radiation climate map - mars society
TRANSCRIPT

RADIATION CLIMATE MAP FOR ANALYZING RISKS TO ASTRONAUTS ON THE MARS SURFACE
FROM GALACTIC COSMIC RAYS
Premkumar B. Saganti1-2, Francis A. Cucinotta2, John W. Wilson3, Lisa C. Simonsen3, and Cary Zeitlin4
1Lockheed Martin Space Operations, Houston TX-77058;
2NASA Johnson Space Center, Houston, TX-77058; 3NASA Langley Research Center, Hampton, VA-23681
4Lawrence Berkeley National Laboratory, University of California, Berkeley, CA 94720
ABSTRACT The potential risks for late effects including cancer, cataracts, and neurological
disorders due to exposures to the galactic cosmic rays (GCR) is a large concern for
the human exploration of Mars. Physical models are needed to project the radiation
exposures to be received by astronauts in transit to Mars and on the Mars surface
including the understanding of the modification of the GCR by the Martian
atmosphere and identifying shielding optimization approaches. The Mars Global
Surveyor mission has been collecting Martian surface topographical data with the
Mars Orbiter Laser Altimeter (MOLA). Here we present calculations of radiation
climate maps of the surface of Mars using the MOLA data, the radiation transport
model HZETRN (high Z=atomic number and high energy transport), and the heavy
ion fragmentation model QMSFRG. Organ doses and average number of particle hits
per cell nucleus from GCR components (protons, heavy ions, and neutrons) are
evaluated as a function of the altitude on the Martian surface. Approaches to improve
the accuracy of the radiation climate map presented here using data from the Odyssey
mission are discussed.
INTRODUCTION
The potential for harmful late effects including as cancer, cataracts, neurological
disorders, and non-cancer mortality risks galactic cosmic rays (GCR) pose a major
threat for the human exploration of Mars [1-3]. Because of their high energies, the
GCR are extremely penetrating and cannot be eliminated by practical amounts of
shielding [4, 5]. The high charge and energy HZE ions portion the GCR present
unique challenges to biological systems such as DNA, cells, and tissue and the risks
to humans is highly uncertain at this time [2, 5]. Another threat in deep space is solar
particle events, which could induce acute radiation syndromes including death if the
event is large enough. However, shielding by the Mars atmosphere and spacecraft
structures along with early warning and detection systems may be effective as
mitigation measures and the biological effects of protons are well understood being
similar to gamma rays. Safety assurances and dose limits for the human exploration
of Mars cannot be provided at this time due to the uncertainties in the biological
effects of HZE ions [2]. Important physical data on the GCR isotopic and energy
spectrum composition near Mars and on the Mars surface will be needed prior to
human exploration. Developing methods for the accurate prediction of the modulation
of the isotopic composition and energies of the GCR after nuclear and atomic
interactions with Mars atmosphere and soil and the accurate determination of
secondary neutron spectra will be essential to design and undertake such missions.
Robotic precursor missions to Mars can provide valuable data on the radiation
environment to be encountered in future human exploration missions of the red planet
and validation of models used for mission design. These measurements should
include direct physical measurements with radiation spectrometers of the energy
spectra of protons, heavy ions, and neutrons. Physical data related to the Mars
altitude, atmospheric [6] and soil composition will also be valuable in developing
models of astronauts and equipment exposures, and in designing shielding habitat
2

configurations. In this paper, we discuss the use of the MOLA altitude data [6] and
models of the radiation environment and GCR transport to present the first complete
radiation map of the Mars surface.
METHODS
The HZETRN transport code [4, 7] describes the atomic and nuclear reaction
processes that alter the GCR in their passage through materials such as the Mars
atmosphere and tissue. The HZETRN code solves the Boltzmann equation for the
particle flux, φj(x,Ε), of ion of type j, with energy E, and depth x, is obtained from
( ) ( ) ( ) ( ) ( )ExEddEExEEEx jjkk jkj ,,,,,,,,, '''''' Ω−ΩΩΩΩ=Ω∇⋅Ω ∑ ∫ φσφσφ
where σj is the total reaction cross section and σjk is the channel changing cross
sections. The HZETRN code solves the Botzmann equation using the continuos
slowing down approximation. The straight-ahead approximation is used for projectile
nuclei [3] and angular dependence of scattering considered for neutrons [7]. Details
on the numerical methods uses in transport code can be found in refs. [4, 7]. Nuclear
fragmentation cross sections are described by the quantum multiple scattering
(QMSFRG) model [8, 9]. The QMSFRG model considers the energy dependence of
the nucleus-nucleus interaction, quantum effects in nuclear abrasion, and a stochastic
model of the de-excitation of pre-fragment nuclei produced in projectile-target nuclei
interactions. The organ dose equivalent can be found by integrating the particle
energy spectra folded with the energy, mass, and charge dependent stopping power or
linear energy transfer (LET), L(E), and the LET dependent quality factor, Q(L), and
by considering the distribution of shielding at the tissue,
HT = Σj ∫ dE φj(x,E) L(E) Q[L(E)]
3

The organ dose equivalent is expressed in the units of Sievert (Sv) (1 cSv = 1 rem).
Values of the LET dependent Q vary between 1 and 30 for the GCR with the highest
values for LET = 50-200 keV/µm in the range of GCR ions with charge, Z=14-26.
The modulation of the GCR near Earth is described using the Badhwar et al. [10, 11]
model in terms of the magnetic field deceleration parameter, Φ. GCR spectra for
several solar maximum (Φ= 1060 or 1216 MV) and solar minimum (Φ = 428 MV)
scenarios were generated. Differences in solar modulation and GCR composition
near-Earth and near-Mars have not been considered in the calculations. The number
of particle-hits per cell nucleus due to direct particle traversals [12] are evaluated
using an average cell cross-sectional area of 100 µm2. Calculations that include
indirect cell hits from delta-rays (secondary electrons) produced by ions will be
reported elsewhere. In some comparisons, heavy ions are divided into distinct charge
groups in some calculations defined as Z=3-10 (light), Z=11-20 (medium), and Z=20-
28 (heavy).
Low- and high-density Mars atmospheric models [13] (16 and 22 g/cm2) assuming a
spherically distributed CO2 atmosphere are considered. Figure 1 describes the
geometry used in the calculations. The resultant shielding offered by the CO2
atmosphere at a given altitude location is calculated for a set of geodesic distributed
rays using the relation
[ ] )cos()()(2)(cos)(),( 2222 θθθ hRhzhzRhRzs +−−+−++=
where, h is the altitude above the mean surface, s being the distance along the slant
path with zenith angle, θ (is calculated between 0 and 900 with 10 increments) and z is
the vertical length of the atmosphere above the identified location. Radiation transport
along the rays are then evaluated using the HZETRN code and results integrated over
z and h to obtain information at each location on the Martian surface.
4

Calculations of radiation transport in the human body, which locate astronauts at
specific surface locations on Mars were performed using the methods described in
conjunction with computerized anatomical models [14] to represent the self-shielding
of the human body. Particle energy spectra, organ dose equivalent, and cell hits were
evaluated at 12 representative different anatomical locations for solar minimum and
solar maximum. Visualization of the Martian surface data was accomplished using
the computer routines (VIZ-MARS) that we have developed for this application using
the software package MATLAB.
RESULTS AND DISCUSSION
By combining the organ dose equivalent with age and gender specific risk
coefficients an estimate of the probability of fatal cancer from radiation exposure is
made [2, 5]. However, due to the limitations in radiobiological data and knowledge
for HZE ions, the definition of a “dose equivalent” is highly uncertain [2, 5]. Thus
estimating the expected risk from radiation fields in deep space and on the Mars
surface relies on accurate evaluation the physical radiation fields as reported here,
however awaits new radiobiology knowledge to define the resulting health risks to
astronauts and to fully understand the effectiveness of risk mitigation approaches
such as shielding. Estimates of cell damage [15, 16] have been considered along with
the current organ dose equivalent to illustrate the role of attenuation of heavy ions by
shielding such as the Martian atmosphere and spacecraft and tissue shielding.
The major physical processes that modulate the heavy ions are atomic energy loss
processes that are well described by stopping powers, and nuclear reactions including
fragmentation and production processes [4, 8, 17]. Figure 2a shows calculations of
the probability that a GCR ion will suffer a nuclear collision per cm of path-length in
water. Figure 2b shows the elemental distribution of the GCR and calculations of the
number of nuclear reactions made by each GCR charge group per path-length in
5

water. These results illustrate the large number of interactions of the GCR that will
occur with both tissue and the Mars atmosphere. However, the level of shielding
provided is insufficient to completely eliminate the heavy ion components and an
accurate description of both fragmentation and transport is needed. In Figure 3 we
show results for the number of particle hits per cell as a function of altitude on the
Mars surface for distinct charge groups and at solar minimum and solar maximum.
The number of cell hits by light ions such as protons and helium are only modestly
affected by atmospheric shielding (altitude variations). This is due to the balance of
losses from atomic slowing down processes and gains from the fragmentation of
heavy ions or production on atoms in the atmosphere. In contrast, heavy ions undergo
a large reduction with increasing atmosphere (decreasing altitude), however the
present models predict that an important heavy ion component occurs, especially at
higher altitudes. Neutrons (not shown here) are less sensitive to changes in the
amount of atmosphere since they contain an important back-scattered component at
lower energies (< 100 MeV) [7]. Because neutrons will make up a larger contribution
at low altitudes and production cross sections for neutrons are sensitive to target
mass, information on atmospheric and soil composition will be important for
designing surface habitats for astronauts. The Odyssey spacecraft [18] and future
Lander missions should provide such data. Figure 4 and Figure 5 show results for the
Martian radiation climate over the surface of Mars for protons and heavy ions,
respectively at solar minimum and maximum. These results indicate significant
reduction for heavy and medium ions, moderate reduction for light ions, and little or
no reduction for protons and neutrons (neutrons not shown). Because of the large
uncertainties in the biological effects of heavy ions and validation of these results by
measurements on the surface of Mars will be essential for human safety.
Table 1 compares the organ dose equivalent en-route to Mars and on the Mars surface
for the major tissues susceptible to radiation-induce cancers. Included in these
calculations are results that consider the addition of shielding configurations on 5 or
6

10 cm of water equivalent material. The cruise phase of the mission leads to organ
doses that approach or exceed legal exposure limits used in low Earth orbit [19] if
time is not constrained and are currently deemed unacceptable because of the
uncertainties in the risks from such an exposure [1, 3]. The comparison in Table 1
show that maximizing crew times on the Mars surface (conjunction class missions)
will be favorable for human exploration. In Figure 6 we show a climatic map of the
skin dose equivalent for the entire surface of Mars. Variations on the order or 50% are
predicted due to changes in atmosphere. Although, uncertainties in heavy ion
radiobiology including the radiation quality factors are expected to be much larger at
this time than estimates of physical quantities, a validation of the radiation climate
map described here is needed. Surface validation measurements should include
measurements of LET spectra and the integral dose and dose equivalent [20] along
with spectroscopic data on neutrons.
CONCLUSIONS
Calculations of the Martian radiation climate illustrate the level of detail that is now
available by state-or-the art computer codes developed by NASA. Critical questions
to be addressed include what is the current accuracy of these calculations, what
accuracy will be required, and what measurements are needed to validate models?
Previous comparisons with measurements near Earth provide some validation of the
models use here and agreement to within 25% is found for the dose equivalent.
However, clearly data near Mars and most importantly on the surface of Mars will be
needed in light of the high level of concern of biological risks to astronauts from
heavy ions. In the very near future, 2001 Mars Odyssey will be collecting the first
Martian radiation environment data by the Martian Radiation Environment
Experiment (MARIE) detector [20]. Other spacecraft that will land on Mars will
provide other data. These measurements will then be utilized to verify our calculated
7

predictions and update the models as needed. Data on the Martian altitude and
topology, and atmospheric and soil composition will also be valuable for designing
human exploration missions.
REFERENCES
1. National Academy of Sciences Space Science Board, HZE Particle Effects in Manned Space Flight, National Academy of Sciences U.S.A. Washington D.C., 1973. 2. National Academy of Sciences, NAS. National Academy of Sciences Space Science Board, Report of the Task Group on the Biological Effects of Space Radiation. Radiation Hazards to Crews on Interplanetary Mission National Academy of Sciences, Washington, D.C., 1997. 3. Cucinotta, F.A., Manuel, F.K., Jones, J., Izsard, G., Murray, J., Djojenegoro, and Wear, M., Space Radiation and Cataracts in Astronauts. Radiat. Res. 156, 460-466 2001. 4. Wilson J.W., Townsend, L.W., Schimmerling, W., Khandelwal G.S., Khan, F., Nealy, J.E., Cucinotta, F.A., Simonsen, L.C., and Norbury, J.W., Transport methods and interactions for space radiations, RP1257, NASA, Washington D.C., 1991. 5. Cucinotta, F.A., Schimmerling, W., Wilson, J.W., Peterson, L.E., Badhwar, G.D., Saganti, P., and Dicello, J.F., Space Radiation Cancer Risks and Uncertainties for Mars Missions. Radiat. Res. 156, 682-688, 2001. 6. Smith, D.E., Zuber, M.T., Solomon, S.C., Philips, R.J., Head, J.W., Garvin, J.B., et al., The Global Topography of Mars and Implications for Surface Evolution. Science 284, 1495-1503, 1999. 7. Clowdsley, M.S., Wilson, J.W., Kim, M., Singleterry, R.C., Tripathi, R.K., Heinbockel, J.H., Badavi, F.F., and Shinn, J.L., Neutron Environments on the Martian Surface. Physica Medica 17, 94-96, 2001. 8. Cucinotta, F.A., Wilson, J.W., Tripathi, R.K.; and Townsend, L.W., Microscopic, Fragmentation Model For Galactic Cosmic Ray Studies. Adv. in Space Res. 22, 533-537, 1998. 9. Cucinotta, F.A., Wilson, J.W., Shinn, J.L., Tripathi, R.K., Maung, K.M., Badavi, F.F., Katz, R., and Dubey, R.D.: Computational Procedures and Data-Base Development. In: NASA Workshop on Shielding Strategies for Human Space
8

Exploration. Eds. Wilson, J.W., Miller, J., Konradi, A., and Cucinotta, F.A., NASA CP 3360, 1997. 10. Badhwar, G.D., and O’Neill, P.M., An Improved Model of GCR for Space Exploration Missions. Nucl. Tracks Radiat. Meas. 20, 403-410, 1992. 11. Badhwar, G. D., Cucinotta, F. A., and O'Neill, P. M.: An Analysis of Interplanetary Space Radiation Exposure for Various Solar Cycles. Radiat. Res. 138, 201-208, 1994. 12. Cucinotta F.A., Nikjoo H., and Goodhead D.T., The Effects of Delta Rays on The Number of Particle-Track Traversals per Cell in Laboratory and Space Exposures. Radiat. Res. 150, 115-119, 1998. 13. Simonsen, L.C., Wilson, J.W., Kim, M.H., and Cucinotta, F.A., Radiation Exposure for Human Mars Exploration. Health Phys. 79, 515-525, 2000. 14. Billings, M.P., Yucker, W.R., and Heckman, B.R., Body Self-Shielding Data Analysis, McDonald Douglas Astronautics Company West, MDC-G4131, 1973. 15. Cucinotta, F.A., Wilson, J.W., Katz, R., Atwell, W., and Badhwar, G. D., Track Structure and Radiation Transport Models for Space Radiobiology Studies. Adv. in Space Res. 18, 183, 194-203, 1995. 16. Cucinotta, F.A., and Dicello, J.F., On the Development of Biophysical Models for Space Radiation Risk Assessment. Adv. Space. Res. 25, 2131-2140, 2000. 17. Zeitlin, C., Heilbronn, L., Miller, J., Rademacher, S.E., Borak, T., Carter, T.R., Frankel, K.A., Schimmerling, W., and Stronach, C.E., Heavy Fragment Production Cross Sections for 1.05 GeV/nucleon 56Fe in C, AL, Cu, Pb, and CH2 Targets. Phys. Rev. C 56, 388-397, 1997. 18. References this special issue. 19. National Council on Radiation Protection and Measurements, Radiation Protection Guidance for Activities in Low Earth Orbit, NCRP Report 132, Bethesda MD , 2000. 20. Badhwar, G., this special issue.
9

Table-1: Illustration of the effectiveness from water shield (5 g/cm2 and 10 g/cm2) on the organ dose equivalent at 12 different locations in the human body. The top table are calculations during transit time to Mars and bottom table on shows the calculations on the Martian surface.
0 g/cm2 5 g/cm2 10 g/cm2 5 g/cm2 10 g/cm2
BFO 70.01 58.18 50.68 16.89 27.60BLADDER 60.08 51.98 46.65 13.48 22.35COLON 69.04 57.70 50.47 16.43 26.91ESOPHAGUS 65.90 55.61 48.96 15.61 25.70EYE 96.01 73.74 60.50 23.19 36.98GONADS 73.71 60.03 51.68 18.56 29.89LIVER 63.53 54.13 48.04 14.80 24.38LUNG 66.82 56.22 49.39 15.86 26.08POINT 120.02 95.61 74.26 20.34 38.13SKIN 94.13 73.15 60.03 22.29 36.23STOMACH 60.99 52.62 47.12 13.73 22.74THYROID 72.57 59.82 51.75 17.58 28.69
En-route to Mars
Water Shield (g/cm2) and corresponding Total Dose (cSv/yr)
% Reduction with
0 g/cm2 5 g/cm2 10 g/cm2 5 g/cm2 10 g/cm2
BFO 19.41 18.66 18.08 3.86 6.86BLADDER 21.09 19.73 18.88 6.43 10.47COLON 19.19 18.50 17.95 3.63 6.48ESOPHAGUS 19.05 18.40 17.88 3.43 6.16EYE 19.68 18.82 18.17 4.41 7.68GONADS 19.77 18.93 18.29 4.26 7.49LIVER 19.59 18.79 18.18 4.08 7.21LUNG 19.58 18.80 18.20 3.99 7.06POINT 25.75 21.27 20.06 17.40 22.09SKIN 19.33 18.60 18.02 3.81 6.78STOMACH 21.12 19.83 18.97 6.10 10.18THYROID 18.97 18.33 17.81 3.37 6.07
On Mars Surface
Water Shield (g/cm2) and corresponding Total Dose (cSv/yr)
% Reduction with
10

Figure-1. Top left image is an illustration of the global profile of the Martian surface from data obtained by MOLA crossing longitudes 52°E and 247°E. The north and south polar caps are at the top and bottom with a vertical exaggeration of 100:1 (adopted from Smith et al. [6]). Top right is the description of the mean surface radius, R, vertical height, Z, of the CO2 atmosphere above the mean surface, and height of the target point above / below the mean surface as used in the calculations. Bottom left is the Martian surface as seen from the Pathfinder landing site with the description of variations in the vertical height of the Martian atmosphere for a given longitude and latitude values, Z(l,l). Bottom right is the description of the slant height, s, and the zenith angle, θ, used in the calculations for the effective shielding from the atmosphere at a given target point on the Martian surface.
11

Energy, MeV/u10 100 1000 10000
Prob
abili
ty o
f Rea
ctio
n / c
m o
f tis
sue
0.01
0.1
1
Proton
NeutronHelium
OxygenSilicon
Iron
Fig. 2a. The probability of a nuclear reaction per cm of tissue traversed versus energy for several ions prominent in the GCR.
12

Charge, Z0 8 16 24G
CR
FLu
x or
No.
Inte
ract
ions
cm
-1 ye
ar-1
102
103
104
105
106
107
108
Fluence
Reactions
Fig. 2b. Comparisons of the elemental fluence of GCR ions near solar minimum to the number of nuclear interactions that occur per cm of tissue traversed by each charge GCR group. Calculations are made behind 5 cm of tissue.
13

ProtonsLow High
1 100
Figure-3. The number of proton hits per cell per year on the Martian surface. Calculations consider the transport of the GCR through the Mars atmosphere using the MOLA topographical data. These particle flux calculations consider the extreme solar cycle scenarios with calculations with left panel near solar minimum (with solar deceleration parameter, φ = 428 MV) and right panel solar maximum scenario (φ = 1050 MV) are shown. Estimates of proton hits per cell per year are for an average location on the skin including the self-shielding of the astronauts body.
14

Heavy IonsLow High
0.1 0.5
Figure-4 The number of heavy ion (Z>2) hits per cell per year on the Martian surface. Calculations consider the transport of the GCR through the Mars atmosphere using the MOLA topographical data. These particle flux calculations consider the extreme solar cycle scenarios with calculations with left panel near solar minimum (with solar deceleration parameter, φ = 428 MV) and right panel solar maximum scenario (φ = 1050 MV) are shown. Estimates of proton hits per cell per year are for an average location on the skin including the self-shielding of the astronauts body.
15

Figure-5. Comparison of calculated particle hits per cell per year at the skin on the Martian surface for solar minium and solar maximum conditions. Results for protons, alpha, light, medium, and heavy charge groups are shown
pa
lm
h 0 km2 km
4 km6 km
8 km
p
a
l
m
h
p
a
l
m
h
p
a
l
m
h
p
a
l
m
h
p
a
l
m
h
0.001
0.010
0.100
1.000
10.000
100.000
No.
of H
its /
Cel
l
Particle Type Altitude
Cell Hits / YrSolar Minimum Scenario
pa
lm
h 0 km2 km
4 km6 km
8 km
p
a
l
m
h
p
a
l
m
h
p
a
l
m
h
p
a
l
m
h
p
a
l
m
h
0.001
0.010
0.100
1.000
10.000
100.000
No.
of H
its /
Cel
l
Particle Type Altitude
Cell Hits / YrSolar Maximum Scenario
16
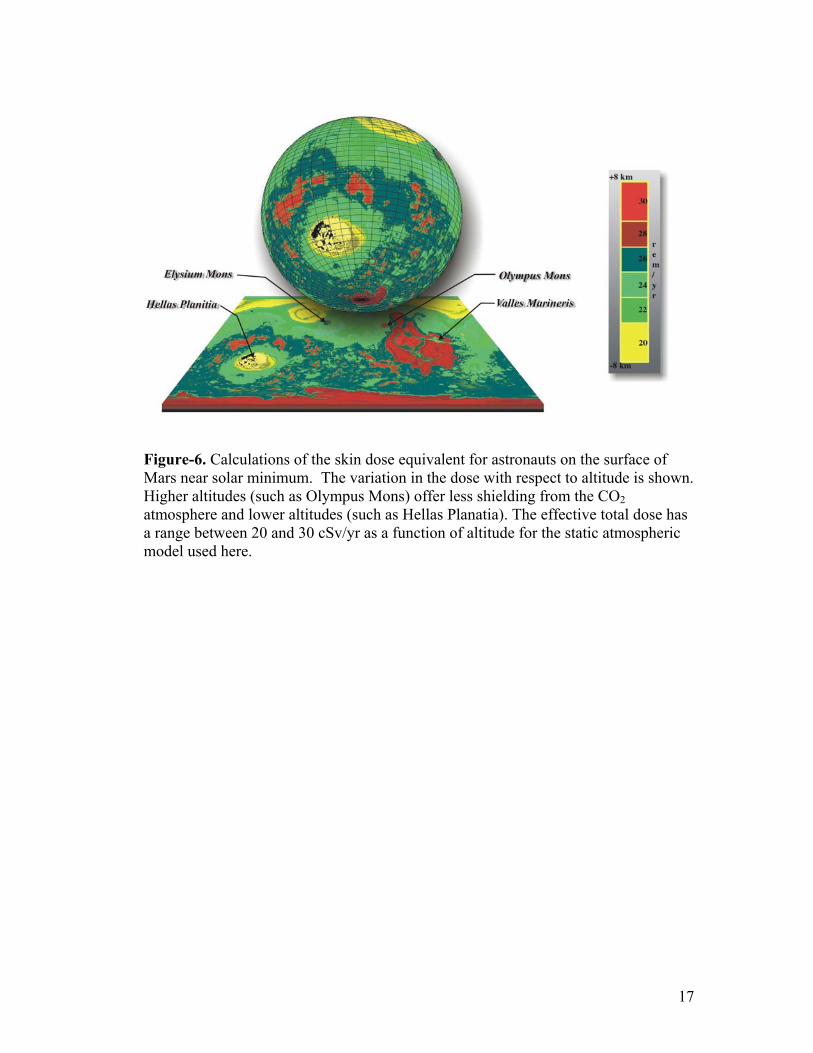
Figure-6. Calculations of the skin dose equivalent for astronauts on the surface of Mars near solar minimum. The variation in the dose with respect to altitude is shown. Higher altitudes (such as Olympus Mons) offer less shielding from the CO2 atmosphere and lower altitudes (such as Hellas Planatia). The effective total dose has a range between 20 and 30 cSv/yr as a function of altitude for the static atmospheric model used here.
17