radiation climate map for analyzing risks...
TRANSCRIPT

RADIATION CLIMATE MAP FOR ANALYZING RISKS TO ASTRONAUTS ON THE MARS SURFACE
FROM GALACTIC COSMIC RAYS
Premkumar B. Saganti1, Francis A. Cucinotta2, John W. Wilson3, Lisa C. Simonsen3, and Cary Zeitlin4
1Lockheed Martin Space Operations, Houston TX-77058;
2NASA Johnson Space Center, Houston, TX-77058; 3NASA Langley Research Center, Hampton, VA-23681
4Lawrence Berkeley National Laboratory, University of California, Berkeley, CA- 94720
ABSTRACT The potential risks for late effects including cancer, cataracts, and neurological
disorders due to exposures to the galactic cosmic rays (GCR) is a large concern for
the human exploration of Mars. Physical models are needed to project the radiation
exposures to be received by astronauts in transit to Mars and on the Mars surface,
including the understanding of the modification of the GCR by the Martian
atmosphere and identifying shielding optimization approaches. The Mars Global
Surveyor (MGS) mission has been collecting Martian surface topographical data with
the Mars Orbiter Laser Altimeter (MOLA). Here we present calculations of radiation
climate maps of the surface of Mars using the MOLA data, the radiation transport
model HZETRN (high charge and high energy transport), and the quantum multiple
scattering fragmentation model, QMSFRG. Organ doses and the average number of
particle hits per cell nucleus from GCR components (protons, heavy ions, and
neutrons) are evaluated as a function of the altitude on the Martian surface.
Approaches to improve the accuracy of the radiation climate map, presented here
using data from the 2001 Mars Odyssey mission, are discussed.
2
INTRODUCTION
The potential for harmful late effects including cancer, cataracts, neurological
disorders, and non-cancer mortality risks, from galactic cosmic rays (GCR) pose a
major threat for the human exploration of Mars [1-3]. Because of their high energies,
the GCR are extremely penetrating and cannot be eliminated by practical amounts of
shielding [4, 5]. The high charge and energy HZE ions portion of the GCR present
unique challenges to biological systems such as DNA, cells, and tissue and the risks
to humans is highly uncertain at this time [2, 5]. Another threat in deep space is solar
particle events, which could induce acute radiation syndromes including death if the
event is large enough and increase the risk of cancer or other late effects. However,
shielding offered by the Mars atmosphere and spacecraft structures along with the
early warning and detection systems may be effective as mitigation measures. The
biological effects of protons are well understood being similar to gamma rays. Safety
assurances and dose limits for the human exploration of Mars cannot be provided at
this time due to the uncertainties in the biological effects of HZE ions [2]. Important
physical data on the GCR elemental and energy composition near Mars and on the
Mars surface will be needed prior to human exploration. Developing methods for the
accurate prediction of the modulation of the isotopic composition and energies of the
GCR after nuclear and atomic interactions with Mars atmosphere and soil and the
accurate determination of secondary neutron spectra will be essential to design and
undertake such missions.
Robotic precursor missions to Mars can provide valuable data on the radiation
environment to be encountered in future human exploration missions of the red planet
and validation of models used for mission design. These measurements should
include direct physical measurements of the energy spectra of protons, heavy ions,
and neutrons with radiation spectrometers. Physical data related to the Mars altitude
[6], atmospheric, and soil composition will also be valuable in developing models of

3
astronaut and equipment exposures, and in designing shielded habitat configurations.
In this paper, we discuss the use of the Mars Orbiter Laser Altimeter (MOLA)
altitude data [6], and models of the radiation environment and GCR transport to
present the first complete radiation map of the Mars surface.
METHODS
The HZETRN (High Z and Energy Transport) code [4, 7] describes the atomic and
nuclear reaction processes that alter the GCR in their passage through materials such
as the Mars atmosphere and tissue. The HZETRN code solves the Boltzmann
equation for the particle flux, φj(x,Ε), of ion of type j, with energy E, and depth x, as
obtained from
( ) ( ) ( ) ( ) ( )ExEddEExEEEx jjkk jkj ,,,,,,,,, '''''' Ω−ΩΩΩΩ=Ω∇⋅Ω ∑ ∫ φσφσφ
where σj is the total reaction cross section and σjk is the channel changing cross
sections. The HZETRN code solves the Botzmann equation using the continuous
slowing down approximation. The straight-ahead approximation is used for projectile
nuclei [4] and angular dependence of scattering is considered for neutrons [7].
Details on the numerical methods used in this transport code can be found in refs. [4]
and [ 7]. Nuclear fragmentation cross sections are described by the quantum multiple
scattering (QMSFRG) model [8, 9]. The QMSFRG model considers the energy
dependence of the nucleus-nucleus interaction, quantum effects in nuclear abrasion,
and a stochastic model of the de-excitation of pre-fragment nuclei produced in
projectile-target nuclei interactions. The organ dose equivalent, HT can be determined
by integrating the particle energy spectra folded with the energy, mass, and charge
dependent stopping power or linear energy transfer (LET), L(E), and the LET
dependent quality factor, Q(L), and by considering the distribution of shielding at the
tissue,

4
)]([( dE H j
T ELQLj )Ε )Ε(= ∑∫ φ
The organ dose equivalent, HT is expressed in the units of Sievert (Sv) (1 cSv = 1
rem). Values of the LET dependent Q vary between 1 and 30 for the GCR with the
highest values for LET = 50-200 keV/µm in the range of GCR ions with charge,
Z=14-26.
The modulation of the GCR near Earth is described using the Badhwar et al., [10, 11]
model in terms of the magnetic field deceleration parameter, Φ. GCR spectra for
several solar maximum (Φ = 1060 - 1216 MV) and solar minimum (Φ = 428 MV)
scenarios were generated. Differences in solar modulation and GCR composition
near-Earth and near-Mars have not been considered in the calculations. Webber [12]
has estimated an increase in the modulation potential Φ of 10 MV per A.U., which
suggests the change in GCR between Earth (~1.0 AU) and Mars (~1.5 AU) would be
small, however the modulation would be in the energy region where HZE particles
have maximum biological quality factors and confirmation of the change due to
modulation is needed for human exploration. The simultaneous observation of GCR
near-Earth and in Mars orbit is one approach to investigate the effects of the radial
gradient on GCR. Energy spectra for the six most abundant GCR elements are fit to
satellite data (H, He, C, O, Si, and Fe). The other GCR ions are scaled using values in
the literature as described previously (ref. [11] and references cited therein).
The number of particle-hits per cell nucleus due to direct particle traversals [13] is
evaluated using an average cell cross-sectional area of 100 µm2. Calculations that
include indirect cell hits from delta rays (secondary electrons) produced by ions will
be reported elsewhere. Also, any additional shielding advantage from the Martian

5
surface magnetic fields (assumed to be weak and sparse at this time) will be
addressed and reported in future when such data is available.
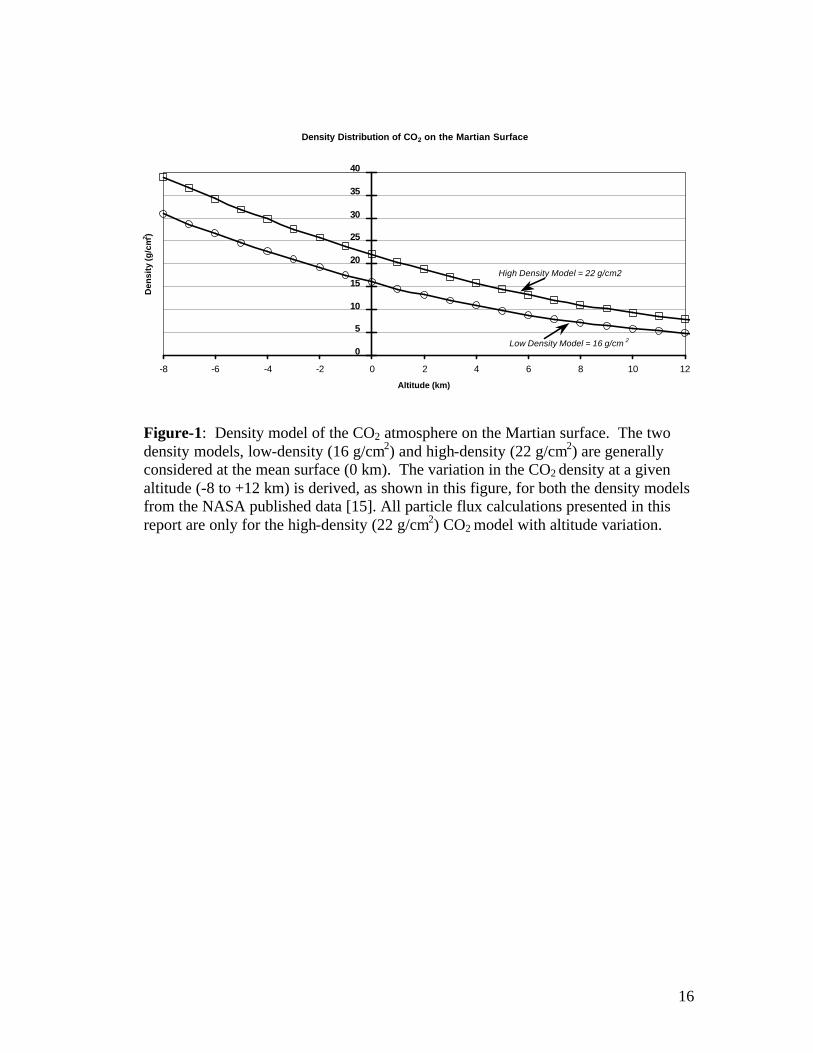
Low and high-density Mars atmospheric models (16 and 22 g/cm2), assuming a
spherically distributed CO2 atmosphere, are considered for all calculations [14].
However, for simplicity, in this report only the high-density model (22 g/cm2)
calculations are presented. Atmospheric density is known to vary inversely with
respect to the altitude from the mean surface. Based on the NASA published data
[15], we have derived a model to assess the variation in the atmosphere with respect
to the altitude. Figure-1 plots CO2 density versus altitude on the Mars surface for the
low- and high-density models. Figure-2 describes the geometry used in the
calculations. Seasonal variations of atmospheric density are not included in these
calculations and hence we refer to as the static atmospheric density model in our
calculations.
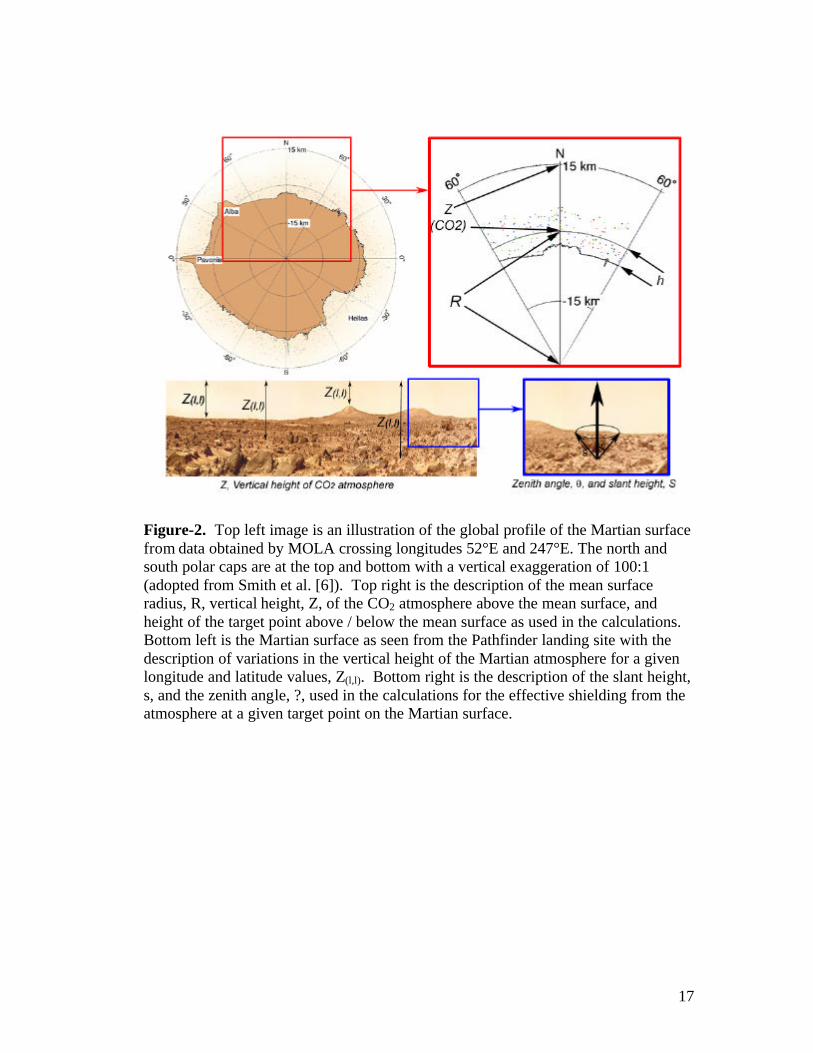
The resultant shielding offered by the CO2 atmosphere at a given altitude location is
calculated for a set of geodesic distributed rays using the relation
[ ] )cos()()(2)(cos)(),( 2222 θθθ hRhzhzRhRzs +−−+−++= where, h is the altitude above the mean surface, s being the distance along the slant
path with zenith angle, ? (is calculated between 0 and 900 with 10 increments) and z is
the vertical length of the atmosphere above the identified location. Radiation transport
along the rays are then evaluated using the HZETRN code and results integrated over
z and h to obtain particle flux at each location on the Martian surface.
Calculations of radiation transport in the human body, which locate astronauts at
specific surface locations on Mars, were performed using the methods described in
conjunction with computerized anatomical models [16] to represent the self-shielding
of the human body. Particle energy spectra, organ dose equivalent, and cell hits were
6
evaluated at 12 representative different anatomical locations for solar minimum and
solar maximum. Visualization of the Martian surface data was accomplished using
the computer routines (VIZ-MARS) that we have developed for this application using
the software package MATLAB.
RESULTS AND DISCUSSION
By combining the organ dose equivalent with age and gender specific risk
coefficients, an estimate of the probability of fatal cancer from radiation exposure is
made [2, 5]. We note that the HZETRN model has been shown to predict the GCR
dose equivalent to within ±25% accuracy. However, a much larger uncertainty exists
in the understanding of the radiobiology of radiation effects at low dose-rates and of
cancer risks from heavy ions [2, 5]. Estimates of cell damage [17, 18] have been
considered along with the current organ dose equivalent to illustrate the role of
attenuation of heavy ions by shielding such as the Martian atmosphere, spacecraft,
and tissue shielding.
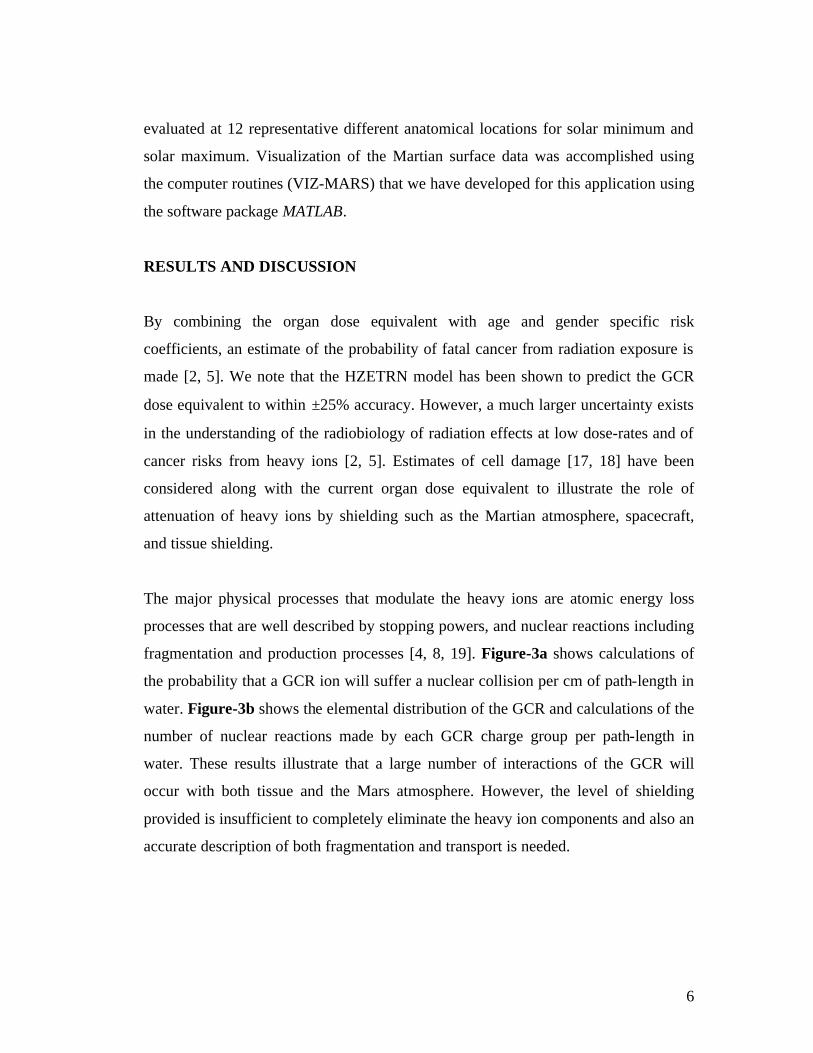
The major physical processes that modulate the heavy ions are atomic energy loss
processes that are well described by stopping powers, and nuclear reactions including
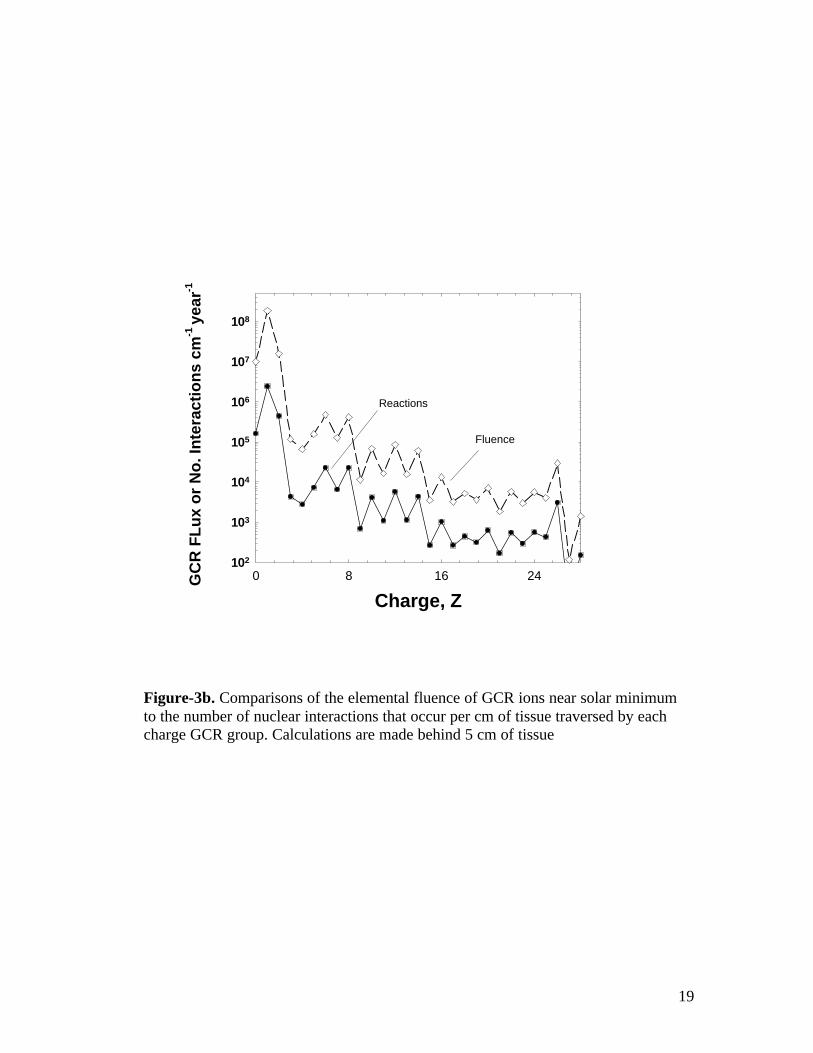
fragmentation and production processes [4, 8, 19]. Figure-3a shows calculations of
the probability that a GCR ion will suffer a nuclear collision per cm of path-length in
water. Figure-3b shows the elemental distribution of the GCR and calculations of the
number of nuclear reactions made by each GCR charge group per path-length in
water. These results illustrate that a large number of interactions of the GCR will
occur with both tissue and the Mars atmosphere. However, the level of shielding
provided is insufficient to completely eliminate the heavy ion components and also an
accurate description of both fragmentation and transport is needed.

7
In Figure-4 we show results for the number of particle hits per cell as a function of
altitude on the Mars surface for distinct charge groups at solar minimum and solar
maximum conditions. The number of cell hits by light ions such as protons and
helium are only modestly affected by atmospheric shielding (altitude variations). This
is due to the changes in the balance of loss from atomic slowing down processes and
gain from the fragmentation of heavy ions or production from atoms in the
atmosphere. In contrast, heavy ions undergo a large reduction with increasing
atmosphere (decreasing altitude). In the present model we also predict that a
significant contribution of heavy ion component occurs, especially at higher altitudes.
Neutrons (not shown here) are less sensitive to changes in the amount of atmosphere
since they contain an important back-scattered component at lower energies (< 100
MeV) [7]. Because neutrons will make up a larger contribution at low altitudes and
production cross sections for neutrons are sensitive to target mass, information on
atmospheric and soil composition will be important for designing surface habitats for
astronauts. The 2001 Mars Odyssey spacecraft [20] and future Lander missions
should provide such data. Figure-5 and Figure-6 show results for the Martian
radiation climate over the surface of Mars for protons and heavy ions respectively
with both solar minimum and maximum conditions. These results indicate significant
reduction for heavy and medium ions, moderate reduction for light ions, and little or
no reduction for protons and neutrons (neutrons are not shown). Because of the large
uncertainties in the biological effects of heavy ions, validation of these results by
measurements on the surface of Mars will be essential for future human safety.
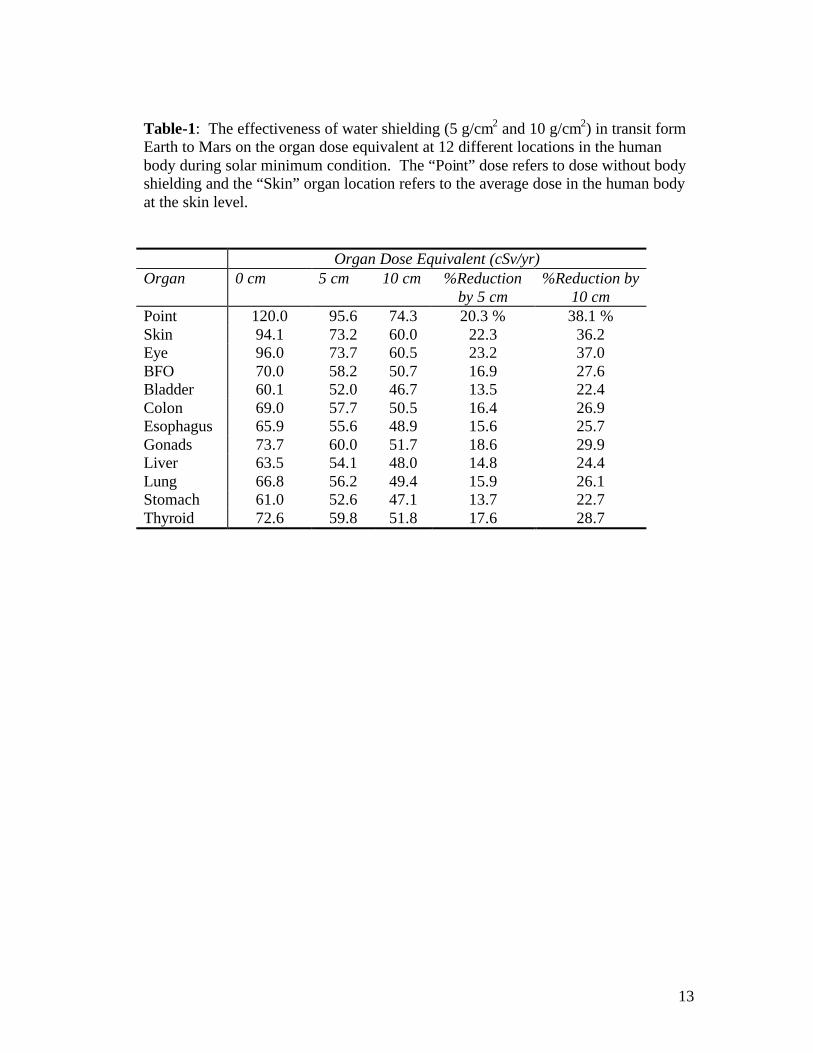
Table-1 compares the organ dose equivalent en-route to Mars and Table-2 on the
Mars surface for the major tissues that contribute to radiation cancer risks during a
solar minimum condition. Included in these calculations are results that consider the
addition of shielding configurations of 5 or 10 cm of water equivalent material. The
cruise phase of the mission could lead to organ doses that approach or exceed legal
exposure limits used in low Earth orbit (LEO), which correspond to an excess

8
probability of 3% fatal cancer [21]. Dose limits are age and gender dependent as
determined by epidemiology data. For manned exploration of Mars two types of
missions are considered; conjunction-class where the mid-point of the mission is
closer to Mars (Mars is on the same side of the Earth from Sun) and opposition-class
where the mid-point is further from Mars (Mars is on the opposite side of the Earth
from Sun). Conjunction-class missions involve longer stay on Mars (300-600 days)
with one-way transit times of 150-250 days. Opposition-class missions involve
shorter stay on Mars (20-60 days) with one-way transit times of 100-400 days [23].
The opposition-class missions require higher energy requirements. Table-3 shows
calculations of fatal cancer probabilities for 40-year-old males and females for such
scenarios [5]. The 95% confidence levels shown are based on calculations, which
consider the uncertainties in epidemiological data, radiation qualities, and the
understanding of the physical environment. In Table-3 the comparison with the
addition of 10 cm water-shielding shows that the addition and optimization of
shielding could lower risks to a level within the acceptable level of risk for LEO
astronauts. However, the large uncertainties limit any conclusion on the acceptability
of risk for long missions (> 100 d). The comparison in Table-3 show that maximizing
crew times on the Mars surface (conjunction-class missions) because of the lower
surface doses will be favorable for human exploration. In Figure-7 we show a
climatic map of the skin dose equivalent for the entire surface of Mars. Variations on
the order of 50% are predicted due to changes in atmosphere. Although, uncertainties
in heavy ion radiobiology including the radiation quality factors are expected to be
much larger at this time than estimates of physical quantities, a validation of the
radiation climate map described here is needed. Surface validation measurements
should include measurements of LET spectra and the integral dose and dose
equivalent [20] along with spectroscopic data on neutrons.

9
CONCLUSIONS
Calculations of the Martian radiation climate illustrate the level of detail that is now
available by the most recent computer codes developed by NASA. Critical questions
to be addressed include what is the current accuracy of these calculations, what
accuracy will be required, and what measurements are needed to validate these
models? Previous comparisons with measurements near Earth provide some
validation of the models used here and an agreement to within 25% is found for the
dose equivalent. However, clearly data near Mars and most importantly on the
surface of Mars will be needed in the context of the high level concern of biological
risks to astronauts from heavy ions. At present, NASA Johnson Space Center’s
MARIE (Martian Radiation Environment Experiment) instrument on board the 2001
Mars Odyssey spacecraft has been collecting and successfully providing data for the
Martian radiation environment mapping since March 13, 2002 [24]. In near future,
other radiation instruments are being planned to land on Martian surface and provide
similar data. Once these measurements are available, they will be utilized to verify
our calculated predictions and update the models as needed. Local measurements on
Martian surface including atmospheric density variations and regolith contributed
albedo radiation will be valuable for designing future human exploration missions to
Mars.
10
REFERENCES
1. National Academy of Sciences Space Science Board, HZE Particle Effects in Manned Space Flight, National Academy of Sciences U.S.A. Washington D.C., 1973. 2. National Academy of Sciences, NAS. National Academy of Sciences Space Science Board, Report of the Task Group on the Biological Effects of Space Radiation. Radiation Hazards to Crews on Interplanetary Mission National Academy of Sciences, Washington, D.C., 1997. 3. Cucinotta, F.A., Manuel, F.K., Jones, J., Izsard, G., Murray, J., Djojenegoro, and Wear, M., Space Radiation and Cataracts in Astronauts. Radiat. Res. 156, 460-466 2001. 4. Wilson J.W., Townsend, L.W., Schimmerling, W., Khandelwal G.S., Khan, F., Nealy, J.E., Cucinotta, F.A., Simonsen, L.C., and Norbury, J.W., Transport methods and interactions for space radiations, NASA-RP1257, 1991. 5. Cucinotta, F.A., Schimmerling, W., Wilson, J.W., Peterson, L.E., Badhwar, G.D., Saganti, P., and Dicello, J.F., Space Radiation Cancer Risks and Uncertainties for Mars Missions. Radiat. Res. 156, 682-688, 2001. 6. Smith, D.E., Zuber, M.T., Solomon, S.C., Philips, R.J., Head, J.W., Garvin, J.B., et al., The Global Topography of Mars and Implications for Surface Evolution. Science 284, 1495-1503, 1999. 7. Clowdsley, M.S., Wilson, J.W., Kim, M., Singleterry, R.C., Tripathi, R.K., Heinbockel, J.H., Badavi, F.F., and Shinn, J.L., Neutron Environments on the Martian Surface. Physica Medica 17, 94-96, 2001. 8. Cucinotta, F.A., Wilson, J.W., Tripathi, R.K.; and Townsend, L.W., Microscopic, Fragmentation Model For Galactic Cosmic Ray Studies. Adv. in Space Res. 22, 533-537, 1998. 9. Cucinotta, F.A., Wilson, J.W., Shinn, J.L., Tripathi, R.K., Maung, K.M., Badavi, F.F., Katz, R., and Dubey, R.D.: Computational Procedures and Data-Base Development. In: NASA Workshop on Shielding Strategies for Human Space Exploration. Eds. Wilson, J.W., Miller, J., Konradi, A., and Cucinotta, F.A., NASA CP-3360, 1997. 10. Badhwar, G.D., and O’Neill, P.M., An Improved Model of GCR for Space Exploration Missions. Nucl. Tracks Radiat. Meas. 20, 403-410, 1992.

11
11. Badhwar, G. D., Cucinotta, F. A., and O'Neill, P. M.: An Analysis of Interplanetary Space Radiation Exposure for Various Solar Cycles. Radiat. Res. 138, 201-208, 1994. 12. Webber, W. R., The Interstellar Cosmic Ray Spectrum and Energy Density. Interplanetary Cosmic Ray Gradients and a New Estimate of the Boundary of the Heliosphere. Astron. Astrophys. 179, 277-284, 1987. 13. Cucinotta F.A., Nikjoo H., and Goodhead D.T., The Effects of Delta Rays on The Number of Particle-Track Traversals per Cell in Laboratory and Space Exposures. Radiat. Res. 150, 115-119, 1998. 14. Simonsen, L.C., Wilson, J.W., Kim, M.H., and Cucinotta, F.A., Radiation Exposure for Human Mars Exploration. Health Phys. 79, 515-525, 2000. 15. Simonsen L.C., Analysis of Lunar and Mars Habitation Modules for the Space Exploration Initiative, Chapter-4 in Shielding Strategies for Human Space Exploration, Ed. J. W. Wilson, J. Miller, A. Konradi, and F. A. Cucinotta, NASA CP- 3360, 43-77, 1997 16. Billings, M.P., Yucker, W.R., and Heckman, B.R., Body Self-Shielding Data Analysis, McDonald Douglas Astronautics Company West, MDC-G4131, 1973. 17. Cucinotta, F.A., Wilson, J.W., Katz, R., Atwell, W., and Badhwar, G. D., Track Structure and Radiation Transport Models for Space Radiobiology Studies. Adv. in Space Res. 18, 183, 194-203, 1995. 18. Cucinotta, F.A., and Dicello, J.F., On the Development of Biophysical Models for Space Radiation Risk Assessment. Adv. Space. Res. 25, 2131-2140, 2000. 19. Zeitlin, C., Heilbronn, L., Miller, J., Rademacher, S.E., Borak, T., Carter, T.R., Frankel, K.A., Schimmerling, W., and Stronach, C.E., Heavy Fragment Production Cross Sections for 1.05 GeV/nucleon 56Fe in C, AL, Cu, Pb, and CH2 Targets. Phys. Rev. C 56, 388-397, 1997. 20. References this special issue. 21. National Council on Radiation Protection and Measurements, Radiation Protection Guidance for Activities in Low Earth Orbit, NCRP Report 132, Bethesda MD, 2000. 22. Badhwar, G., this special issue.
12
23. Cucinotta, F. A., Badhwar, G. D., Saganti, P. B., Schimmerling, W., Wilson, J.W., Peterson, L., and Dicello, J., Space Radiation Cancer Risk Projections for Exploration Missions: Uncertainty Reduction and Mitigation, NASA TP-21077, 2002. 24. For more info http://srhp.jsc.nasa.gov/ and http://marie.jsc.nasa.gov/
13
Table-1: The effectiveness of water shielding (5 g/cm2 and 10 g/cm2) in transit form Earth to Mars on the organ dose equivalent at 12 different locations in the human body during solar minimum condition. The “Point” dose refers to dose without body shielding and the “Skin” organ location refers to the average dose in the human body at the skin level. Organ Dose Equivalent (cSv/yr) Organ 0 cm 5 cm 10 cm %Reduction
by 5 cm %Reduction by
10 cm Point 120.0 95.6 74.3 20.3 % 38.1 % Skin 94.1 73.2 60.0 22.3 36.2 Eye 96.0 73.7 60.5 23.2 37.0 BFO 70.0 58.2 50.7 16.9 27.6 Bladder 60.1 52.0 46.7 13.5 22.4 Colon 69.0 57.7 50.5 16.4 26.9 Esophagus 65.9 55.6 48.9 15.6 25.7 Gonads 73.7 60.0 51.7 18.6 29.9 Liver 63.5 54.1 48.0 14.8 24.4 Lung 66.8 56.2 49.4 15.9 26.1 Stomach 61.0 52.6 47.1 13.7 22.7 Thyroid 72.6 59.8 51.8 17.6 28.7

14
Table-2: The effectiveness of water shielding (5 g/cm2 and 10 g/cm2) on the Mars surface for the organ dose equivalent at 12 different locations in the human body during solar minimum condition. The “Point” dose refers to the dose without body shielding and the “Skin” organ location refers to the average dose in the human body at the skin level. Organ Dose Equivalent (cSv/yr) Organ 0 cm 5 cm 10 cm %Reduction
by 5 cm %Reduction by
10 cm Point 25.8 21.3 20.1 17.4 % 22.1 % Skin 19.3 18.6 18.0 3.8 6.8 Eye 19.7 18.8 18.2 4.4 7.7 BFO 19.4 18.7 18.0 3.9 6.9 Bladder 21.1 19.7 18.9 6.4 10.5 Colon 19.2 18.5 18.0 3.6 6.5 Esophagus 19.1 18.5 17.9 3.4 6.2 Gonads 19.8 18.9 18.3 4.3 7.5 Liver 19.6 18.8 18.2 4.0 7.2 Lung 19.6 18.8 18.2 4.0 7.1 Stomach 21.1 19.8 19.0 6.1 10.2 Thyroid 19.0 18.3 17.8 3.4 6.1

15
Table-3. Percent excess fatal cancer risk projections and 95% C. I.’s for 40-year-old females or males. Calculations are for opposition or conjunction type Mars missions using 4 g/cm2 aluminum shielding and high density Mars CO2 atmosphere and considering effects of the addition of 10 cm water shielding. Values in parenthesis indicate days on Mars surface [5].
Mission Type Days (Mars or lunar surface) 0 cm H2O 10 cm H2O
Females
Opposition 360 (30) 3.3 [0, 18.0] 2.5 [0, 14.6]
Opposition 660 (30) 6.2 [0, 34.0] 4.6 [0, 27.5]
Conjunction 1000 (600) 5.7 [0, 30.8] 4.5 [0, 25.6]
Males
Opposition 360 (30) 2.0 [0, 10.8] 1.5 [0, 8.8]
Opposition 660 (30) 3.7 [0, 20.4] 2.8 [0, 16.5]
Conjunction 1000 (600) 3.4 [0, 18.5] 2.7 [0, 15.3]
16
Figure-1: Density model of the CO2 atmosphere on the Martian surface. The two density models, low-density (16 g/cm2) and high-density (22 g/cm2) are generally considered at the mean surface (0 km). The variation in the CO2 density at a given altitude (-8 to +12 km) is derived, as shown in this figure, for both the density models from the NASA published data [15]. All particle flux calculations presented in this report are only for the high-density (22 g/cm2) CO2 model with altitude variation.
Density Distribution of CO2 on the Martian Surface
0
5
10
15
20
25
30
35
40
-8 -6 -4 -2 0 2 4 6 8 10 12
Altitude (km)
Den
sity
(g/c
m2 )
High Density Model = 22 g/cm2
Low Density Model = 16 g/cm 2
17
Figure-2. Top left image is an illustration of the global profile of the Martian surface from data obtained by MOLA crossing longitudes 52°E and 247°E. The north and south polar caps are at the top and bottom with a vertical exaggeration of 100:1 (adopted from Smith et al. [6]). Top right is the description of the mean surface radius, R, vertical height, Z, of the CO2 atmosphere above the mean surface, and height of the target point above / below the mean surface as used in the calculations. Bottom left is the Martian surface as seen from the Pathfinder landing site with the description of variations in the vertical height of the Martian atmosphere for a given longitude and latitude values, Z(l,l). Bottom right is the description of the slant height, s, and the zenith angle, ?, used in the calculations for the effective shielding from the atmosphere at a given target point on the Martian surface.

18
Figure-3a. The probability of a nuclear reaction per cm of tissue traversed versus energy for several ions prominent in the GCR.
Energy, MeV/u10 100 1000 10000
Pro
bab
ility
of
Rea
ctio
n /
cm o
f ti
ssu
e
0.01
0.1
1
Proton
NeutronHelium
OxygenSilicon
Iron
19
Figure-3b. Comparisons of the elemental fluence of GCR ions near solar minimum to the number of nuclear interactions that occur per cm of tissue traversed by each charge GCR group. Calculations are made behind 5 cm of tissue
Charge, Z0 8 16 24G
CR
FL
ux
or
No
. In
tera
ctio
ns
cm-1
year
-1
102
103
104
105
106
107
108
Fluence
Reactions

20
Figure-4. Comparison of calculated particle hits per cell per year at the skin on the Martian surface for solar minium and solar maximum conditions. Calculations include the average body shielding on the skin for the 50% percentile male [16]. Results for protons, alpha, light, medium, and heavy charge groups are shown
pa
lm
h 0 km2 km
4 km6 km
8 km
p
a
l
m
h
p
a
l
m
h
p
a
l
m
h
p
a
l
m
h
p
a
l
m
h
0.001
0.010
0.100
1.000
10.000
100.000
No
. of
Hit
s / C
ell
Particle Type Altitude
Cell Hits / YrSolar Minimum Scenario
pa
lm
h 0 km2 km
4 km6 km
8 km
p
a
l
m
h
p
a
l
m
h
p
a
l
m
h
p
a
l
m
h
p
a
l
m
h
0.001
0.010
0.100
1.000
10.000
100.000
No
. of
Hit
s / C
ell
Particle Type Altitude
Cell Hits / YrSolar Maximum Scenario

21
Figure-5. Estimates of the number of proton hits per cell per year on the Martian surface. Calculations consider the transport of the GCR through the Mars atmosphere using the MOLA topographical data and include the average body shielding on the skin for the 50% percentile male [16]. Calculations consider the extreme solar cycle scenarios with calculations with left panel near solar minimum (with solar deceleration parameter, Φ = 428 MV) and right panel solar maximum scenario (Φ = 1050 MV) is shown.
Low High
100
Protonsparticle hits / cell / yr
9080706050
Low High
100
Protonsparticle hits / cell / yr
9080706050

22
Figure-6. Estimates of the number of heavy ion (Z>2) hits per cell per year on the Martian surface. Calculations consider the transport of the GCR through the Mars atmosphere using the MOLA topographical data include the average body shielding on the skin for the 50% percentile male [16]. Calculations consider the extreme solar cycle scenarios with calculations with left panel near solar minimum (with solar deceleration parameter, Φ = 428 MV) and right panel solar maximum scenario (Φ = 1050 MV) is shown.
Heavy Ionsparticle hits / cell / yrLow High
0.1 0.50.2 0.3 0.4
Heavy Ionsparticle hits / cell / yrLow High
0.1 0.50.2 0.3 0.4

23
Figure-7. Calculations of the skin dose equivalent for astronauts on the surface of Mars near solar minimum. The variation in the dose with respect to altitude is shown. Higher altitudes (such as Olympus Mons) offer less shielding from the CO2 atmosphere and lower altitudes (such as Hellas Planatia). The effective total dose has a range between 20 and 30 cSv/yr as a function of altitude for the static atmospheric high-density CO2 model used here.