race-to-the-bottom tari cutting - pierre-louis vézina -...
TRANSCRIPT
Race-to-the-bottom tariff cutting∗
Pierre-Louis Vezina†
This version: November 2012
Abstract
Unilateral tariff liberalization accounts for the lion’s share of trade liberalization sincethe 1980s and has accompanied the most successful trade-led development model of thepast 50 years, “Factory Asia”. Understanding what drove this liberalization is thereforecrucial to our grasp of the process of economic development. This paper provides anexplanation for Asia’s emerging economies’ tariff cutting from 1988 to 2006, arguingit has been driven by a competition for FDI. Using spatial-econometric methods usedto identify tax competition combined with an instrumental-variable strategy , I showthat tariffs on parts and components and capital goods, crucial locational determinantsfor assembly firms, followed a strategic-interaction pattern whereby tariffs are causedby corresponding tariffs in competing countries. I show this interaction is strongest inyears and sectors where competitors received more FDI and is inexistent for consumergoods. This supports the FDI envy behind the tariff race to the bottom.
JEL CODES: F13, F15Key Words: Trade policy, Factory Asia, tariff.
∗I thank Richard Baldwin, David von Below, Marius Bruhlhart, Ron Davies, Marco Fugazza, TorfinnHarding, Marcelo Olarreaga, Pierre Picard, Matthias Rieger, Tony Venables, as well as seminar participantsin Geneva, Luxembourg, Nottingham and Lausanne for very helpful comments. This research was supportedby SNSF subsidy PDAMP1-123125.†University of Oxford. email: [email protected]

1 Introduction
One aspect of trade liberalization that has received too little attention in the economic
literature is that of unilateralism. This is puzzling as it accounts for the lion’s share of
trade liberalization since the 1980s. The World Bank (2005) estimates that it accounts
for as much as two thirds of the 21 percentage-point cuts in tariffs in developing countries
between 1983 and 2003, an episode Krugman and Obstfeld (2006, p. 250) refer to as the
big trade policy story of the past two decades. Moreover, the two decades of unilateral
tariff-cutting accompanied the most successful trade-led development model of the past 50
years, i.e. “Factory Asia”. Indeed, Baldwin (2006) writes that most of the rapid expansion
of trade and the fragmentation of the supply chain across countries in East Asia1 from
the end of the 1980s onwards have been fostered by unilateral, rather than multilateral or
preferential, trade liberalization. In a recent study of vertical specialization trade, Bridgman
(2012) argues specifically that falling tariffs on manufactured parts lead to offshoring while
falling freight costs alone do not. Understanding what drove this liberalization (Figure 1) is
therefore crucial to our understanding of the process of economic development.
While some political-economy theories have been developed to explain unilateral trade
liberalization, e.g. soft unilateralism (Coates and Ludema 2001, Richardson 2001),
ideological leadership (Edwards and Lederman 1998), and preferential tariff complementarity
(Estevadeordal et al. 2008, Calvo-Pardo et al. 2009), economists usually answer the question
the other way around, i.e. “why do countries impose tariffs in the first place?”. There is much
evidence (e.g. Goldberg and Maggi 1999) that points to the role of special interests lobbying
for protection (Grossman and Helpman 1994). Lobbying can also be pro-liberalization, for
example when foreign companies lobby for market access (Gawande and Krishna 2006) or
when importers lobby for tariff suspensions (Ludema et al. 2010). With a focus on Factory
Asia, Ando and Kimura (2005) and Baldwin (2010) argue tariff cuts can also be driven
by an international competition for foreign direct investment (FDI) as low tariffs are a
decisive locational determinant for foreign firms that rely on imports of components for local
1First in electronics and then in sport footwear, televisions and radio receivers, office equipment, electricalmachinery, power and machine tools, cameras and watches, and printing and publishing (Sally 2008).
2

processing.2
This paper tests empirically for the presence of such competition-driven liberalization,
which I will refer to as race-to-the-bottom tariff cutting, focusing on seven Asian emerging
economies following the conjecture of Ando and Kimura (2005) and Baldwin (2010). In
this competition-driven liberalization, the desire for FDI leads governments to cut tariffs,
mostly on the inputs of assembly firms, to obtain marginal locational advantages over similar
countries, in the same way corporate-tax competition can lead to races to the bottom (e.g.
Zodrow and Miezkowski 1986 and Wilson 1986).
But tariff liberalization is a situation where a government finds it politically optimal to
remove a tariff that it previously found optimal to impose (Baldwin and Baldwin 1996).
So a shock must have trigged this race to the bottom. Baldwin (2010) argues it was the
revolution in information and communication technologies that made it possible to organize
complex tasks across countries and hence led to production fragmentation. Other factors
specific to Japan explain the rise of Japanese offshoring (Figure 2), which was the main
source of competition between emerging Asian economies (Lamy et al. 2006). Hyun and
Whitmore (1989) argue that the appreciation of the yen, the rise in wages, as well as the
end of tariff preferences in the US and EU explain why Japanese firms were becoming less
competitive and in need of offshoring. Japanese FDI grew by 21.6% per year from 1980 to
1987 and by 1989 Japan was the biggest foreign investor in the world (Tejima 1992).
To test empirically for the presence of competition-driven tariff cutting, I follow a recent
empirical literature that aims at identifying races to the bottom (e.g. Devereux et al. 2008,
Davies and Voget 2011). I use tools from spatial econometrics to show that tariffs on
parts and components, intermediates, and capital goods, i.e. the locational determinants
of assembly firms, are explained by a weighted average of tariffs in competing countries,
which is a necessary condition for a race to the bottom and is consistent with tariffs being
strategic complements. I use the normalized inverses of the absolute differences in GDP per
capita between countries as weights. The idea is that countries that are at a similar level of
2Inui et al. (2008), using a firm-level dataset, show that the level of tariffs does play an important rolein the location choices of foreign affiliates by Japanese firms. According to Ramstetter (2011), of the 25mainly Japanese multinationals operating in Thai machinery in 1994, 15 identified import regulation as animportant problem, but only six identified infrastructure bottlenecks.
3

development compete more intensely against each other.3 As a counterfactual I show that
this correlation is inexistent in consumer goods, which is consistent with a race to the bottom
driving tariff cuts only on imported inputs. I then show that the spatial correlation is robust
to various specifications including a lagged-dependent model and an instrumental-variable
model where the spatial lag is instrumented using predetermined ASEAN preferential tariffs
agreed during negotiations in 1992.
As Devereux et al. (2008) explain, an observed strategic interaction can be due to
competition or simply to common intellectual trends. To show that tariff cutting is the
not due to common intellectual trends, I show that a simple average of tariffs in competing
countries does not lead to a significant spatial correlation. Moreover, since the pattern does
not hold for consumer goods, it is unlikely to be due strictly to free-trade intellectual trends.
Finally, I show that the spatial correlation is highest in years and sectors where Japanese
FDI created more jobs in competing countries than at home. In other words, I show that
FDI jealousy increased the tariff contagion.
The next section reviews the literature on race-to-the-bottom models and unilateral
liberalization, exploring what could be behind emerging Asia’s tariff cutting. In a third
section I describe the data and present some descriptive evidence on race-to-the-bottom
tariff cutting. A fourth section presents my empirical strategy. A fifth provides empirical
evidence that tariffs were indeed strategic complements. A last section concludes.
2 Literature review
2.1 Unilateral liberalization
While some theories have emerged to explain unilateral trade liberalization, its causes are yet
to be fully understood. According to Edwards and Lederman (1998), unilateral liberalization
can be the result of ideological leadership. They provide narrative evidence from Chile, where
tariffs were cut during the regime of Pinochet, a dictator driven by the ideas of the Chicago
School. Another branch of theory views unilateral tariff cuts as a strategy for a large and
3I also use the normalized inverse of the absolute differences in distance to Japan as a robustness check.
4

influential country to obtain reciprocal liberalization or a trade agreement (Richardson 2001,
Coates and Ludema 2001, Krishna and Mitra 2005). A third theory explaining unilateral
cuts is that of preferential tariff complementarity (Estevadeordal et al. 2008, Calvo-Pardo
et al. 2009). Here, the logic is that preferential trade agreements lead to cuts in external
tariffs to avoid costly trade diversion or because a shrinking import-competing sector realigns
interests away from protection.
None of these theories seem ideal to explain what happened in Asian emerging economies
from the end of the 1980s until the mid-2000s. Considering the size of East Asia’s emerging
economies, their tariff cuts are very unlikely to have been part of a soft leadership strategy.
And their timing does not follow liberalization in the big economies, i.e. the US, EU, and
Japan. Ideological leadership does not fit with progressive tariff cutting in multiple countries.
And while a causal link from regionalism to unilateralism may exist in countries part of the
ASEAN trade agreement, it cannot be applied to the entire region during the period studied.
Another hypothesis explaining unilateral tariff cuts is that the liberalization was imposed
by the IMF as a condition for its loans after the Asian crisis of 1997. According to the data
collected by Wei and Zhiwei (2010), only Indonesia has been imposed trade reform conditions
in its program, which lasted from 1997-2000. Hence it is unlikely that IMF programs are
behind the tariff cuts in all countries in Factory Asia which started before 1997.
The reason why so little is known about the causes of unilateral liberalization is that
economists usually ask the question the other way around, i.e. “why do countries impose
tariffs in the first place?” The widely-accepted answer is that governments bow to special
interest groups lobbying for protection (Grossman and Helpman 1994, Goldberg and Maggi
1999). But lobbying can also be pro-liberalization, for example when foreign companies lobby
for market access (Gawande et al. 2006, Kee et al. 2007) or when domestic firms seeking
to avoid paying duties on imported intermediates lobby for tariff suspensions (Gawande et
al. 2005 and Ludema et. al. 2010). Governments bowing to special interests could be one
reason behind Asia’s liberalization and this would fit into the race-to-the-bottom setting
which I describe below.
5

2.2 Races to the bottom
Another way of explaining tariff liberalization is through the theory of race-to-the-bottom
unilateralism, stylized by Baldwin (2010) but also mentioned by Kimura (2003) and Ando
and Kimura (2005). In its simplest form, “developmental state” governments interested in
fostering industrialization per se (Johnson 1982) cut tariffs in a competition to attract or
retain FDI.
The race-to-the-bottom model is well-known in international economics. In its most
famous application, countries competing for FDI reach an uncooperative Nash equilibrium
with bottom levels of corporate tax rates (see Devereux et al. 2008 and Davies and Voget
2011 for recent empirical analyses). The model has been applied to many other locational
determinants of FDI such as subsidies (Haaland and Wooton 1999), wages (Mehmet
and Tavakoli 2003), labor standards (Davies and Vadlamannati 2011) and environmental
standards (Levinson 2003). Here, tariffs on assembly firms’ inputs are the locational
determinant of choice. The relevance of this policy instrument is due to the specific nature
of FDI in Factory Asia, i.e. vertical FDI in manufacturing plants that relied on imports
of components for local processing. While, as in lobbying for tariff suspensions (Ludema
et. al. 2010), it is the import requirements of firms that urge governments to cut tariffs,
the mechanism is somewhat different. In race-to-the-bottom unilateralism, governments cut
tariffs to attract or retain FDI in an international competition where other countries’ tariffs
matter.4
Races to the bottom could also be the result of yardstick competition (Besley and Case
1995) in which governments care about what other governments are doing since voters
compare the FDI performance of their country to that of their neighbors when voting.
This is a possibility but democracy was present to varying degrees in the countries and
period studied.5 Finally, it can also be seen through political science’s policy diffusion
4Governments may be of the developmental-state type, maximizing welfare, or maximizing lobbyingrevenue. In both cases countries compete to attract or retain FDI.
5According to the Polity IV project (systemicpeace.org/polity/polity4.htm) South Korea, the Philippines,Taiwan, and Thailand became democracies at the beginning of the 1990s, and only Thailand went back toanocracy in 2005. And while Indonesia made the transition to democracy in 1999, China has been anautocracy since 1945 and Malaysia an anocracy since 1970.
6

theory, according to which policy choices in one country affect those in neighbors either
because they alter the material payoffs or because they disseminate new information about
the impact of these policies (Elkins and Simmons 2005). Empirical evidence of such policy
diffusion includes Bordignon et al. (2003) and Swank (2006).
3 Data and descriptive statistics
Following the conjectures of Baldwin (2010) and Ando and Kimura (2003), I focus on seven
Asian emerging economies that constitute Factory Asia, i.e. Thailand, Indonesia, Malaysia,
the Philippines, South Korea, Taiwan, and China as they were all competing for FDI over the
1989-2006 period, mostly from Japan which targeted this region intensely with investment
and aid packages under “regional guidance” from the Ministry of International Trade and
Industry (Lamy et al. 2006).
Tariff data, which is from UNCTAD’s TRAINS database, is at the HS 6-digit level.
Each tariff line is then matched with its Broad Economic Category (BEC), i.e. consumer
goods, capital goods, or intermediates using the World Bank’s concordance table. I also
identify which tariff lines are “parts and components” using Schott’s (2004) classification
which defines a tariff line as a “part or component” if its description contains the words
“parts” or “components”.
Applied most-favored-nation (MFN) tariffs were on average repeatedly cut from 1989
till 2006. These cuts went much deeper than the upper bound agreed to during WTO
negotiations. What’s more, as seen in Figure 3, in each country-year, tariffs on parts and
components were on average 10 percentage points lower than on consumer goods.
In Figure 4 I show that tariffs were converging to similar levels across countries.
The average within-product standard deviation in tariffs on parts and components across
countries fell from 15 to 5 percentage points over the 14 years covered. This sigma
convergence is more pronounced for parts and components, intermediates, and capital goods
than for consumer goods, which is indicative of a race to the bottom in inputs.
I use Japanese FDI employment data from the Japanese Research Institute of Economy,
7

Trade and Industry Foreign Direct Investment Database which contains estimates on
employment for Japanese foreign affiliates by country and industry from 1989-2003 (see
Figure 2).6
4 Empirical strategy
The descriptive data analysis so far is indicative of a race to the bottom as tariffs on
inputs came to closer and closer levels across countries. But the question of strategic
complementarity remains. Recent studies aimed at identifying tax competition have
focused on estimating tax reaction functions using spatial econometrics. In the workhorse
specification of Devereux et al. (2008), also adopted by Davies and Voget (2011), tax rates
across countries act as strategic complements, i.e. a key requirement for a race to the bottom.
I thus use the specification of Devereux et al. (2008) and regress tariffs on a weighted
average of lagged tariffs in competing countries. I estimate the following model,
τijt = αij + υit + ρWtτijt−1 + ε
where τijt is the tariff of product i, in country j in period t, αij is a country-product fixed
effect, υit is a country-year fixed effect, which accounts for any country-wide policy, and
Wt a weighting matrix. The choice of weighting matrix determines the type of spatial
correlation. I choose weights as to measure the competition intensity between countries.
Hence, a first weight is the normalized absolute value of the inverted difference in GDP per
capita, suggesting that countries at a similar level of development compete more intensely
against each other. The right-hand side variable can thus be computed for each year as:
n∑j 6=i
τj ×|GDPPCi −GDPPCj|−1∑nj 6=i |GDPPCi −GDPPCj|−1
Likewise, a second possible weight is the inverted difference in distance to Japan. Here the
6The industries are textiles, chemicals, transport equipment, precision instruments, general machinery,electrical machinery equipment, ICT equipment, base metal and metal products, and other manufacturing.
8

logic is that since Japan was the main source of FDI competition, being close to Japan
provided an advantage and hence countries at a similar distance from Japan were competing
more intensely at the tariff level. To compute these weights, I use GDP per capita data from
the IMF and geographic distance from CEPII. If the tariff cutting is the result of common
intellectual trends rather than competitive interaction, the weighting matrix should not
matter.
The race should affect mostly parts and components, intermediates and capital goods
rather than consumer goods, as these were critical to Japanese firms. I estimate the model
for different types of products separately and for various year lags. I first use OLS to estimate
the coefficients as in Egger and Larch (2008). I then proceed to various robustness checks
which include a lagged-dependent-variable model and an IV model based on pre-determined
preferential tariff path set by ASEAN negotiations in 1992.
5 Results and robustness checks
Table 1 gives the spatial correlation results obtained using OLS. The three horizontal panels
give the results using 1-, 2-, and 3-year lags of the spatial lag. Using 1-year lags and
the GDPPC-based weights (columns (1), (3), (5) and (7)), I find a significant spatial
correlation in capital goods, intermediates, and parts and components, while I find none
in consumer goods. This is consistent with the idea of a competition that involves only
locational determinants of FDI. These results are consistent to using 2- or 3-year lags on
the right-hand side. Columns (2), (4), (6) and (8) add tariffs weighted by the inverted
difference in distance to Japan as well as a simple average of tariff in competing countries
as controls. Across lag structures only GDPPC-based weights provide consistently positive
and significant spatial correlations for tariffs on capital goods, intermediates, and parts and
components. Hence, GDPPC-based weights seem to provide the most consistent way to
capture the spatial correlation in tariffs. Overall, I find that the simple average of tariffs to
have no explaining power for any type of good. This suggests that the downward trend in
tariffs cannot be explained by common intellectual trends. I also try using random-weights
9

as a placebo and found no spatial correlation (not shown).
I proceed to a number of robustness checks. First I estimate a lagged-dependent-variable
model rather than a country-product fixed effect model to bound the effect, as suggested
by Angrist and Pischke (2008, Section 5.3). Results in Table 2 confirm a positive
spatial correlation that doesn’t appear in consumer goods. Again, the spatial correlation
is highest in parts and components even though the coefficients are not significantly
different across capital goods, intermediates and parts and components. What’s more,
the lagged-dependent-variable model estimates are smaller than when using the fixed-effect
model, providing a lower bound to the competition effect.
More importantly, even though reverse causality can be ruled out due to the time lag,
it can be argued that the tariff and the year-lagged spatial lag are both correlated with a
product-specific omitted variable, and this renders the spatial lag endogenous. To make sure
the spatial correlation I identify is the causal effect of competitors’ tariffs, I instrument the
spatial lag using the tariff path predetermined by ASEAN preferential tariff negotiations
in 1992, using data from the ASEAN secretariat. The idea here is that the preferential
tariffs agreed during ASEAN negotiations caused some of the MFN tariff cuts, as argued by
Calvo-Pardo et al. (2009). While countries in Factory Asia are now increasingly active in
forming trade agreements, this was not the case until the mid-2000s except for the ASEAN
trade agreement that concerned four of the countries analyzed here, namely Indonesia,
Malaysia, the Philippines and Thailand and was signed in 1992. Korea and China both
have an agreement with ASEAN countries but these came into force in 2006 and 2010,
respectively.7
I thus split my sample into two country groups, the ASEAN four and the three others,
China, Korea, and Taiwan (CKT). For both country groups, the spatial lag is instrumented
by the weighted sum of 1992-determined preferential tariffs in the ASEAN four, where the
weights are GDPPC-based as in the spatial lag. This identification strategy assumes that
preferential tariffs in competing countries did not affect a neighbor’s tariffs through any other
7China now has sealed 15 trade agreements but it started only in 2003 when one including only agriculturewith Thailand came into force. South Korea signed its first with Chile in 2004. Malaysia signed its firstwith Japan in 2005, while the Philippines did the same in 2006 and Indonesia in 2007. Hence, only ASEANpreferences could have mattered for the period studied in this paper.
10

channel than through ASEAN negotiations or tariff competition. For ASEAN countries,
the preferential tariff must thus also be included on the right-hand side. The latter is
instrumented by its 1992-predetermined path. For both country groups the instruments
pass the Kleibergen-Paap under-identification test and the Cragg-Donald weak identification
tests, but not for consumer goods. Hence only the estimates for the other types of goods can
be interpreted. The IV estimates presented in Table 3 confirm previous results and suggest
a causal effect of spatial competition in both ASEAN and non-ASEAN countries.
To go deeper into the mechanism I interact the tariff spatial lag with a FDI jealousy
dummy. I define FDI jealousy as equal to one when the number of jobs created at home
by Japanese FDI is smaller than the weighted average of jobs created by Japanese FDI
in competing countries in the corresponding industry and year (the weights are inverted
absolute differences in GDP per capita). The idea is that FDI jealousy increases the tariff
competition. The results, summarized in Figure 5 suggest that the spatial correlation is
indeed highest and significant only when FDI jealousy was present (this corresponds to
77% of observations). When most jobs were created at home, I find no significant spatial
correlation.8
I also check whether yardstick competition could be behind this spatial dependence.
To test for this I interact the spatial lag with a dummy equal to one for country-years
where election occurred. The idea is that if it is indeed electoral pressure that pushed the
competition, the spatial correlation should be highest in election years. I find no indication
of such interaction (not shown).
6 Conclusion
In this paper I applied the econometric methods used to identify tax competition to tariff
liberalization and provided empirical evidence of a tariff race to the bottom. This suggests
that the two decades of unilateral tariff cutting in Asia’s emerging economies have been
8The figures are based on estimates in table 4. Unexpectedly, I also find a positive spatial correlation forconsumer goods when FDI jealousy is present. Note however that this effect remains statistically smallerthan for parts and components.
11

driven, at least in part, by a competition to attract FDI, mostly from Japan. Racing
governments were cutting tariffs to obtain marginal locational advantages in attracting
multinationals that relied on imports of parts and components for local processing. While
regionalism may also have played a role in Factory Asia’s unilateral trade liberalization,
I find no evidence that its forces overshadowed those of FDI competition. Lobbying by
implanted firms may also have played a role in liberalization in the region studied. Indeed,
the development of Factory Asia may have progressively increased the size of the importing
export-oriented sector and hence the liberalization lobbying forces. Yet, the presence of such
lobbying would not rule out the spatial correlation identified in this paper. Quite to the
contrary, such forces may have reinforced the international-competition pressure to retain
FDI jobs at home. As Sally (2008) observes, unilateral measures and competitive emulation,
rather than WTO negotiations, may to be the main vehicle for future liberalization, especially
as more countries join the competition, in Asia and beyond.
References
Ando, M. and F. Kimura, 2005., “The Formation of International Production and
Distribution Networks in East Asia”, in T. Ito and A. Rose (eds.), International Trade
in East Asia, University of Chicago Press, 2003
Angrist, J and J. Pischke, 2008. Mostly Harmless Econometrics, Princeton University Press.
Baldwin, Robert Edward and Baldwin, Richard Edward, 1996. “Alternate approaches to the
political economy of endogenous trade liberalization,” European Economic Review, Elsevier,
vol. 40(3-5), pages 775-782, April.
Baldwin, Richard, 2006. “Multilateralising Regionalism: Spaghetti Bowls as Building Blocs
on the Path to Global Free Trade,” The World Economy, Blackwell Publishing, vol. 29(11),
pages 1451-1518, November.
12

Baldwin, Richard, 2010. “Unilateral tariff liberalization”, in The International Economy,
Journal of The Japan Society of. International Economics, No.14, pp 10-43. 2010. Also
NBER WP No. 16600, 2010
Besley, Timothy and Case, Anne, 1995. “Incumbent Behavior: Vote-Seeking, Tax-Setting,
and Yardstick Competition,” American Economic Review, American Economic Association,
vol. 85(1), pages 25-45, March.
Bordignon, Massimo and Cerniglia, Floriana and Revelli, Federico, 2003. “In search of
yardstick competition: a spatial analysis of Italian municipality property tax setting,”
Journal of Urban Economics, Elsevier, vol. 54(2), pages 199-217, September.
Bridgman, B., 2012., “The rise of vertical specialization trade”, Journal of International
Economics.
Calvo-Pardo, Hector and Freund, Caroline and Ornelas, Emanuel, 2009. “The ASEAN free
trade agreement : impact on trade flows and external trade barriers,” Policy Research
Working Paper Series 4960, The World Bank
Coates, D., and Ludema, R., 2001, “A Theory of Trade Policy Leadership”, Journal of
Development Economics 65(1)
Davies Ronald B. and Johannes Voget, 2011. “Tax Competition in an Expanding European
Union,” GEE Papers 0033, Gabinete de Estratgia e Estudos, Ministrio da Economia e da
Inovao.
Davies Ronald B. and Krishna Chaitanya Vadlamannati, 2011. “A Race to the Bottom in
Labour Standards? An Empirical Investigation”, mimeo
Devereux, Michael P. and Lockwood, Ben and Redoano, Michela, 2008. “Do countries
compete over corporate tax rates?,” Journal of Public Economics, Elsevier, vol. 92(5-6),
pages 1210-1235, June.
Edwards, Sebastian and Lederman, Daniel, 1998. “The Political Economy of Unilateral Trade
Liberalization: The Case of Chile” (April 1998). NBER Working Paper W6510.
13

Egger, Peter and Mario Larch 2008. “Interdependent preferential trade agreement
memberships: An empirical analysi”s, Journal of International Economics, Volume 76, Issue
2, December
Elkins, Zachary and Beth A. Simmons, 2005. “On Waves, Clusters and Diffusion: A
Conceptual Framework” Annals of the American Academy of Political and Social Science,
598: 33-51.
Estevadeordal, Antoni and Caroline Freund and Emanuel Ornelas, 2008. “Does Regionalism
Affect Trade Liberalization toward NonMembers?,” The Quarterly Journal of Economics,
MIT Press, vol. 123(4), pages 1531-1575, November
Gawande, Kishore and Pravin Krishna and Marcelo Olarreaga, 2005. “Lobbying Competition
Over Trade Policy,” NBER Working Paper 11371.
Gawande, Kishore and Pravin Krishna and Michael J Robbins, 2006. “Foreign Lobbies and
U.S. Trade Policy,” The Review of Economics and Statistics, MIT Press, vol. 88(3), pages
563-571, 01
Goldberg Pinelopi Koujianou and Giovanni Maggi, 1999. “Protection for Sale: An Empirical
Investigation,” American Economic Review, American Economic Association, vol. 89(5),
pages 1135-1155, December.
Grossman, Gene M and Helpman, Elhanan, 1994. “Protection for Sale,” American Economic
Review, American Economic Association, vol. 84(4), pages 833-50, September.
Haaland, Jan I and Wooton, Ian, 1999. “International Competition for Multinational
Investment,” Scandinavian Journal of Economics, Wiley Blackwell, vol. 101(4), pages 631-49,
December
Hyun, JT and K Whitmore, 1989. “Japanese direct foreign investment: Patterns and
implications for developing countries” Washington DC, World Bank, Industry Series 1, Feb.
14

Inui, T., Matsuura, T. and Poncet, S., 2008. The Location of Japanese MNC affiliates:
agglomeration, spillovers and firm heterogeneity, The Institute of Economic Research,
Hitotsubashi University, Discussion Paper Series A No.506
Johnson, Chalmers, 1982. MITI and the Japanese Miracle. Stanford, CA: Stanford University
Press
Kee, H.L., M. Olarreaga and P. Silva, 2007. “Market Access for sale”, Journal of Development
Economics 82 (1), 79-94.
Kimura, Fukunari. 2003. “Development Strategies for Economies under Globalisation:
Southeast Asia as a New Development Model.” In Tran Van Hoa and Charles Harvie, eds.,
New Asian Regionalism: Responses to Globalisation and Crises, London: Palgrave
Krishna, Pravin and Mitra, Devashish, 2005. “Reciprocated unilateralism in trade policy,”
Journal of International Economics, Elsevier, vol. 65(2), pages 461-487, March
Krugman, Paul and Maurice Obstfeld 2006. International Economics: Theory and Policy,
7th edition, Pearson International Edition, Addison Wesley.
Lamy, P., H. Dieter, J. Defraigne and R. Higgott, 2006. “Report on East Asian Integration:
Opportunities and Obstacles for Enhanced Economic Co-operation”, (Paris: Notre Europe).
Levinson, Arik, 2003. “Environmental Regulatory Competition: A Status Report and Some
New Evidence”, National Tax Journal, 56(1), 91-106.
Ludema, Rodney D, Mayda, Anna Maria and Mishra, Prachi, 2010. “Protection for Free?
The Political Economy of U.S. Tariff Suspensions”, CEPR Discussion Paper 7926.
Mehmet, Ozay and Tavakoli, Akbar, 2003. “Does foreign direct investment cause a race to
the bottom?”, Journal of the Asia Pacific Economy,8:2,133 - 156
Ramstetter Eric D., 2011. “Ranking Locations for Japan’s Manufacturing Multinationals in
Asia: A Literature Survey Illustrated with Indexes” ,Asian Economic Journal, 2011, vol. 25,
issue 2, pages 197-226
15
Richardson, Martin, 2001. “Unilateral Liberalisation in a Multilateral World”, University of
Otago Economics Discussion Papers No. 0102, February 2001
Sally, Razeen, 2008. Globalisation and the Political Economy of Trade Liberalisation in the
BRIICS, working paper
Schott, Peter K., 2004. “Across-product Versus Within-product Specialization in
International Trade”, The Quarterly Journal of Economics, MIT Press, vol. 119(2), pages
646-677, May.
Swank, Duane, 2006. “Tax Policy in an Era of Internationalization: An Assessment of a
Conditional Diffusion Model of the Spread of Neoliberalism.” International Organization,
November.
Tejima, S., 1992. “Japanese FDI in the 1980s and its prospects in the 1990s”, EXIM review,
Jul.
Wei, Shang-Jin and Zhang, Zhiwei, 2010. “Do external interventions work? The case of
trade reform conditions in IMF supported programs,”, Journal of Development Economics,
Elsevier, vol. 92(1), pages 71-81, May.
Wilson, J.D., 1986. “A theory of interregional tax competition”. Journal of Urban Economics
19 (3), 296-315.
World Bank, 2005. “Global economic prospects 2005: Trade, Regionalism and Development”,
Washington, D.C.
Zodrow, G., Miezkowski, P., 1986. “Pigou, Tiebout, property taxation, and the
underprovision of local public goods”. Journal of Urban Economics 19 (3), 356-370.
16
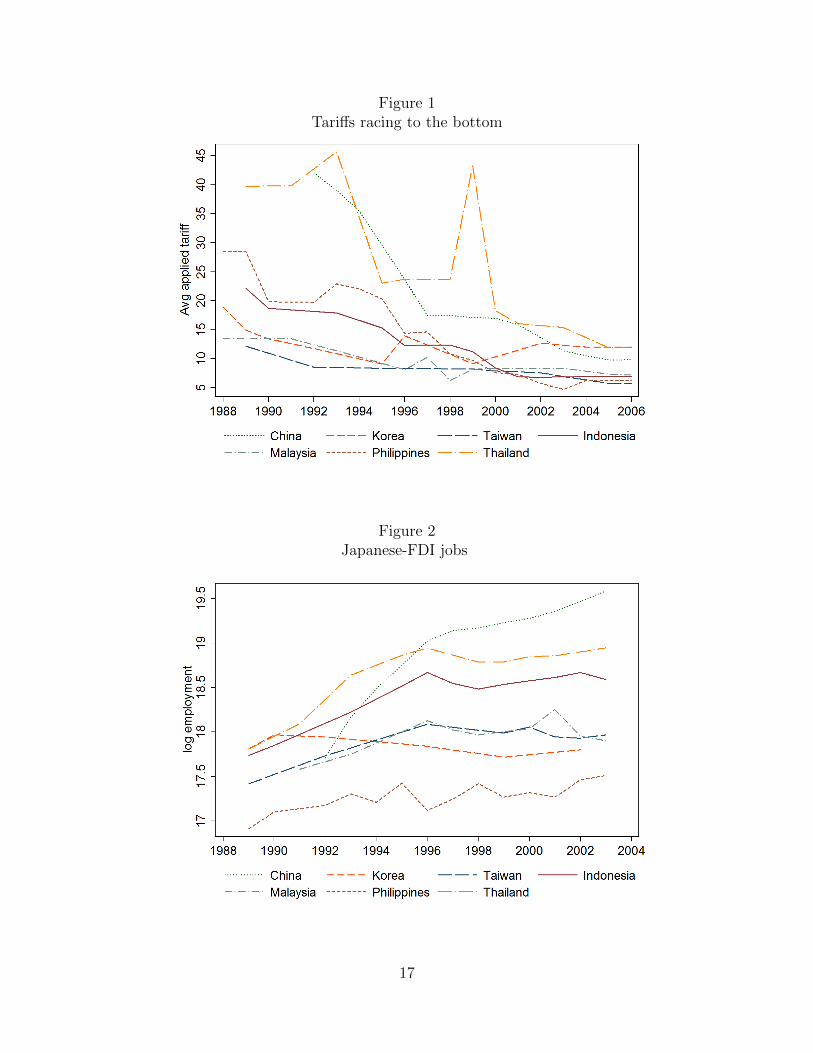
Figure 1Tariffs racing to the bottom
Figure 2Japanese-FDI jobs
17

Figure 3Tariff cutting in Factory Asia
Figure 4Sigma convergence in tariffs
18

Figure 5Spatial correlation in tariffs
Note: The blue bars indicate the level of spatial correlation. The red linesindicate the 95% confidence interval. Results are based on regressions in Table4 where the spatial lag is interacted with FDI jealousy. The latter is a dummyequal to one if the number of jobs created by Japanese FDI at home in theconcerned sector and year is smaller than the weighted average of jobs createdin competing countries.
19

Table 1Spatial correlations in tariffs
consumer goods capital goods intermediates parts and components
(1) (2) (3) (4) (5) (6) (7) (8)
1-year lags
L.tariff GDPPC 0.0348 0.013 0.122*** 0.130*** 0.123*** 0.115** 0.234*** 0.238***(0.0259) (0.0280) (0.0232) (0.0326) (0.0422) (0.0454) (0.0600) (0.0865)
L.tariff simple -0.0701 -0.114 0.014 -0.404**(0.0500) (0.0952) (0.0358) (0.193)
L.tariff distance 0.110* 0.102* 0.00222 0.375**(0.0553) (0.0601) (0.0342) (0.146)
Constant 12.63*** 12.37*** 6.433*** 7.869*** 8.603*** 10.11*** 5.501*** 8.285***(0.426) (0.558) (0.278) (0.435) (0.591) (0.612) (0.598) (1.292)
Observations 74,276 74,276 38,076 38,076 169,575 169,575 23,950 23,950R-squared 0.537 0.539 0.56 0.56 0.367 0.367 0.658 0.665Nb of cty prod 9,444 9,444 4,869 4,869 22,037 22,037 2,995 2,995
2-year lags
L2.tariff GDPPC 0.0467 0.0706** 0.0896*** 0.0945*** 0.108*** 0.122*** 0.153*** 0.249***(0.0286) (0.0310) (0.0186) (0.0286) (0.0269) (0.0269) (0.0438) (0.0776)
L2.tariff simple -0.113** -0.0758 -0.0266 -0.26(0.0488) (0.0951) (0.0360) (0.187)
L2.tariff distance 0.0876** 0.072 0.00725 0.129(0.0367) (0.0661) (0.0306) (0.133)
Constant 26.39*** 26.38*** 11.65*** 10.17*** 10.16*** 11.94*** 15.85*** 14.50***(0.922) (0.861) (0.277) (0.328) (0.318) (0.327) (1.028) (0.945)
Observations 74,677 74,677 38,645 38,645 169,512 169,512 24,367 24,367R-squared 0.491 0.493 0.655 0.655 0.377 0.377 0.62 0.623Nb of cty prod 9,558 9,558 4,959 4,959 22,428 22,428 3,003 3,003
3-year lags
L3.tariff GDPPC 0.0196** 0.0178* 0.0760*** 0.0766*** 0.0652*** 0.0589** 0.162*** 0.193***(0.00868) (0.00943) (0.0157) (0.0221) (0.0193) (0.0232) (0.0261) (0.0469)
L3.tariff simple -0.0264 -0.0822 0.0069 -0.124(0.0216) (0.0496) (0.0266) (0.0857)
L3.tariff distance 0.0353* 0.0841** 0.00762 0.0802(0.0193) (0.0347) (0.0269) (0.0673)
Constant 22.78*** 22.64*** 6.395*** 6.934*** 9.900*** 9.215*** 5.923*** 7.786***(0.300) (0.398) (0.272) (0.410) (0.408) (0.379) (0.442) (0.822)
Observations 73,808 73,808 37,867 37,867 167,468 167,468 23,940 23,940R-squared 0.388 0.389 0.485 0.487 0.245 0.245 0.556 0.557Nb of cty prod 9,578 9,578 4,959 4,959 22,445 22,445 3,003 3,003
Dependent variable is the applied MFN tariff. tariff GDPPC is the weighted average of tariff where the weights are theinverted absolute differences in GDP per capita. For tariff distance the weights are the inverted absolute differences indistance to Japan. Distances to Japan are between countries’ main cities weighted by population. tariff simple is a simpleaverage of tariffs in competing countries. L. is for 1-year lag, L2. for 2-year lag, L3. for 3-year lag. Country-year andcountry-product fixed effects are included in all regressions. Country-year clustered standard errors are in parenthesis.*** p<0.01, ** p<0.05, * p<0.1.
20

Table 2Lagged-dependent-variable model
consumer goods capital goods intermediates parts and components
(1) (2) (3) (4)
L.tariff GDPPC 0.0191 0.0434*** 0.0294** 0.0701**(0.0194) (0.0162) (0.0133) (0.0325)
L.tariff 0.879*** 0.863*** 0.862*** 0.823***(0.0295) (0.0276) (0.025) (0.0302)
Constant 0.588 0.0738 0.417 0.226(0.621) (0.195) (0.276) (0.425)
Observations 74,276 38,076 169,575 23,950R-squared 0.731 0.896 0.673 0.918
Dependent variable is the applied MFN tariff. tariff GDPPC is the weighted average of tariff where the weights arethe inverted absolute differences in GDP per capita. L. is for 1-year lag. Country-year fixed effects are included in allregressions. Country-year clustered standard errors are in parenthesis. *** p<0.01, ** p<0.05, * p<0.1.
Table 3Instrumental-variable model
consumer goods capital goods intermediates parts and components
(1) (2) (3) (4) (5) (6) (7) (8)
CKT ASEAN CKT ASEAN CKT ASEAN CKT ASEAN
L.tariff GDPPC -0.173 -0.337 0.124*** 0.128*** 0.335*** 0.281*** 0.143*** 0.193***(0.401) (3.723) (0.029) (0.0362) (0.0629) (0.0272) (0.0521) (0.034)
L.pref 0.0502 0.231* -0.158*** 0.189***(2.223) (0.118) (0.0562) (0.0573)
L.tariff 0.538*** 0.864 0.535*** 0.460*** 0.499*** 0.684*** 0.782*** 0.607***(0.0471) (0.699) (0.0249) (0.0662) (0.0322) (0.0215) (0.0337) (0.0415)
Observations 41,646 28,892 21,082 18,866 94,188 74,126 13,395 11,740R-squared 0.253 0.456 0.387 0.394 0.269 0.549 0.741 0.664Nb of cty year 33 32 33 32 33 32 33 32Cragg-Donald F 5.354 0.00629 97.73 24.33 165.8 17.7 54.97 19.56Kleibergen-Paap LM 3.305 0.0129 11.99 14.64 12.62 14.99 11.88 14.18Pvalue of K-P test 0.0691 0.909 0.000535 0.00013 0.000382 0.000108 0.000567 0.000166
Dependent variable is the applied MFN tariff. tariff GDPPC is the weighted average of tariff where the weights arethe inverted absolute differences in GDP per capita. Pref is the applied preferential tariff within ASEAN countries.Country-year fixed effects are included in all regressions. IVs for tariff GDPPC and pref are pref92 GDPPC and pref92,respectively, i.e. the 1992-negotiations determined preferential tariffs and their weighted average. CKT is China, SouthKorea and Taiwan. ASEAN is Indonesia, Malaysia, the Philippines and Thailand. L. is for 1-year lag. Country-yearclustered standard errors are in parenthesis. *** p<0.01, ** p<0.05, * p<0.1.
21

Table 4Spatial correlation and Japanese FDI jobs
consumer goods capital goods intermediates parts and components
(1) (2) (3) (4)
L.tariff GDPPC -0.0120 0.0369 0.0393 0.0888(0.0262) (0.0535) (0.0337) (0.0973)
L.FDI jealousy -3.545** -1.307** -2.119*** -2.301*(1.330) (0.551) (0.736) (1.289)
L.tariff GDPPC × L.FDI jealousy 0.0960*** 0.0996* 0.147*** 0.162**(0.0326) (0.0549) (0.0377) (0.0793)
Constant 14.01*** 9.714*** 10.86*** 6.919***(0.606) (0.474) (0.620) (0.836)
Observations 74,276 38,076 169,575 23,950R-squared 0.539 0.562 0.373 0.664Number of cty prod 9,444 4,869 22,037 2,995
Dependent variable is the applied MFN tariff. tariff GDPPC is the weighted average of tariff where the weights are theinverted absolute differences in GDP per capita. FDI jealousy is a dummy equal to one if the number of jobs created byJapanese FDI at home in the concerned sector and year is smaller than the weighted average of jobs created in competingcountries. L. is for 1-year lag. Country-year and country-product fixed effects are included in all regressions. Country-yearclustered standard errors are in parenthesis. *** p<0.01, ** p<0.05, * p<0.1.
22