search.jsp?r=19980232158 2018-05 … in protective clothing", american society of testing and...
TRANSCRIPT

?
i -, j7
; L-, !'i ..
i:
L
NASA RESEARCH ANNOUNCEMENT
FINAL REPORT FOR
SPACE SUIT SURVIVABILITY ENHANCEMENT
September 25, 1998
Submitted By:
Joanne S. Ware, John K. Lin and Thad H. Fredrickson
ILC Dover, Inc.One Moonwalker Road
Frederica, DE 19946
http://www.ilcdover.com
Dr. Christopher M. Pastore
Philadelphia College of Textiles and Science
School House Lane & Henry Avenue
Philadelphia, PA 19144-5497
In Response To:
NASA Research Announcement
96-OLMSA-01B
Contract Identification:
NASW-97014
Submitted To:
Mr. Joseph Kroener, Code 210.H
NASA Goddard Space Flight CenterGreenbelt Road
Greenbelt, MD 20771
CC:
Dr. Robert Norwood, NASA HQ
Mr. Larry Chambers, NASA HQ
NASA Center of Aerospace Information (2 copies)
J /
https://ntrs.nasa.gov/search.jsp?R=19980232158 2018-07-03T05:01:16+00:00Z

J:?i !
.i,J .
i y
TABLE OF CONTENTS
Section Title Pa__a_g_e_
1.0
2.0
3.0
4.0
4.1
4.2
5.0
5.1
5.1.1
5.1.2
5.1.3
5.1.4
5.1.5
5.1.6
5.1.7
5.1.8
5.1.9
5.2
5.2.1
5.2.2
5.2.3
5.2.4
5.2.5
5.2.6
5.2.7
5.3
5.3.1
5.3.2
5.3.3
5.3.4
5.3.5
6.0
7.0
ABSTRACT .................................................................................................. 1
INTRODUCTION ........................................................................................ 3
BACKGROUND .......................................................................................... 5
APPROACH ................................................................................................. 8
SELF-SEALING MECHANISMS ............................................................... 8
CUT, PUNCTURE AND HYPERVELOCITY IMPACT
RESISTANT MATERIALS ......................................................................... 10
FINDINGS ................................................................................................... 13
SELF-SEALING MECHANISMS/MATERIALS ........................................ 13
Background .................................................................................................. 13
Viscoelastic Material Candidates ............................................................... 14
Viscoelastic Fibrous Composite Material Candidates ............................... 15
Fibrous Composite Material Candidates .................................................... 17
Self-Sealing Test Methods And Results .................................................... 18
Self-Sealing Test Method ........................................................................... 18
Self-Sealing Test Results And Discussion ................................................. 18
Cold Flow Characteristic Test Method And Results .................................. 22
Recommendations ....................................................................................... 22
CUT, TEAR AND PUNCTURE RESISTANT
MECHANISMS/MATERIALS .................................................................... 22
Puncture Mechanics .................................................................................... 23
Tearing Mechanics ...................................................................................... 25
Cutting Mechanics ...................................................................................... 27
Fabric Design .............................................................................................. 27
Puncture Resistance Testing Method And Results .................................... 28
Cut Resistance Testing Method And Results ............................................. 29
Cut And Puncture Recommendations ........................................................ 30
HYPERVELOCITY IMPACT ...................................................................... 30
Background .................................................................................................. 30
Hvpervelocitv Testing Method And Results ............................................... 30
Hypervelocity Impact Test Method ............................................................ 32
Hypervelocity Impact Test Results And Discussion .................................. 32
Recommendations ....................................................................................... 33
CONCLUSIONS .......................................................................................... 34
RECOMMENDATIONS .............................................................................. 35

Figure
1
2
3
4
5
6
7
8
9
10
TABLE OF CONTENTS
LIST OF FIGURES
Title
Space Suit Materials Cross-Section ..............................................................
Self-Sealing Mechanisms Considered ...........................................................
Planform Of Samples .....................................................................................
Cross-Section Of External And Internal Components ..................................
Cross-Section Of Assembled Samples ...........................................................
Self-Sealing Performance Comparison Chart ...............................................
Self-Sealing Average Performance Comparison Chart .................................
Schematic Of Fiber Mobility Subject To Small Penetrator ..........................Schematic Illustration Of Successive Fiber Failure From
Small Penetrator .........................................................................................
Schematic Illustration Of Tear Resistance For Varying DegreesOf Yarn Mobility .........................................................................................
3
9
16
17
17
19
20
23
24
26
Table_
1
2
3
4
5
6
7
8
LIST OF TABLES
Title
SSA Vulnerability Summary .........................................................................
Self-Sealing Mechanisms Considered For IncorporationInto The SSA ...............................................................................................
Comparison Of The Selected Yarn Materials Physical Properties ...............Self-Sealing Material Trade Study ................................................................
Cold Flow Characteristics ..............................................................................
Overall Fabric Construction Parameters ......................................................
Puncture Resistance Testing Results ............................................................
Cut Resistance Testing Results .....................................................................
6
8
12
21
22
28
28
3O
ii
, ,.i ¸
APPENDIX A
APPENDIX B
APPENDIX C
APPENDIX D
APPENDIX E
LIST OF APPENDICES
SELF-SEALING CONCEPTS SUBMITTED
FOR EVALUATION
LABORATORY ANALYSIS REPORT,SELF-SEALING PERFORMANCE TESTS
LABORATORY ANALYSIS REPORT,CUT PROTECTION PERFORMANCE TESTS
LABORATORY ANALYSIS REPORT,PUNCTURE RESISTANCE TESTS
HYPERVELOCITY IMPACT RESISTANCE
TEST REPORTS
iii

REFERENCES
ASTM F 1342-91 (Reapproved 1996) "Standard Test Method for Protective Clothing
Material Resistance to Puncture", American Society of Testing and Materials.
ASTM F 1790-97, (1997) "Standard Test Method for Measuring Cut Resistance of Materials
Used in Protective Clothing", American Society of Testing and Materials.
Cadogan, D., Kosmo, J. and Remington, B., "Enhanced Softgoods Structures for Space Suit
Micrometeriod/Debris Protective Systems," SAE Technical Paper No. 921258, July1992.
Christiansen, E.L., Lear, D., Prior, T., "Bumber EMU - Meteoroid/Orbital Debris Risk
Calculations," NASA JSC Hypervelocity Impact Technology Facility, July, 1997.
Gagliardi, D. D., and Gruntfest, I.J., "Journal of Textile Research", 20, p. 180, 1950.
Gagliardi, D. D., and Nussele, A.C., "American Dyestuff Reporter", 39, p. 12, 1950.
Hager, O.B., Gagliardi, D. D., and Walker, H.B., "Journal of the Textile Research", 17, 7,p. 376, July, 1947.
Hodgson, E.W., Cupples, S., Cour-Palais, B.G., et al., "Micrometeroiroid and Orbital Debris
Hazard Considerations for Space Station-Related EVA," SAE Technical Paper No.932225, July, 1993.
Morton, W.E., and Hearle, J.W.S., Physical Properties of Textile Fibers, The TextileInstitute, Manchester: 1993.
Teixira, N., Platt, M., Hamberger, W., "Journal of Textile Research", 25, 10, 1955.
Thomas, R.W., "Cut Resistance Testing of Industrial Gloves", Conference Proceedings:
International Conference on Safety & Protective Fabrics, 1998.
Tribble, Alan C., The Space Environment, Princeton University Press, Princeton, 1995.
iv
,i_ ¸
_ ii_
1.0
FINAL REPORT
SPACE SUIT SURVIVABILITY ENHANCEMENT
NASW-97014
ABSTRACT
Materials developed for the Extravehicular Activity (EVA) space suit have
historically provided an effective barrier to the hazards encountered in space
throughout the manned space program, with enhancements being made over
time to accommodate changes in mission durations. As mission durations have
changed, risks in the working environment have increased thus necessitating
the need for evolutionary materials changes. Now, significant changes in
mission durations are occurring again through the construction and habitation
of the International Space Station and future Lunar/Mars missions. There is an
anticipated three-fold increase in frequency of EVA work with the construction
and habitation of the Space Station. The risks to the space suit that are
anticipated from these endeavors include exposure to sharp objects that can cut
or puncture, and penetrations from micrometeoroid/orbital debris (MMOD)
impacts.
This research effort evaluated two broad-based methodologies that could
increase the protection the space suit could provide. The first area of emphasis
was to enhance the EVA suit's ability to avoid or withstand penetration of the
Thermal Micrometeoroid Garment (TMG) and its underlying restraint and
bladder, thereby preventing the loss of pressurization from the space suit. Self-
sealing materials were developed to achieve this end. If incorporated into the
space suit's cross-section (Figure 1) a self-sealing system of materials would
repair penetrations to the pressure envelope, extending the current capabilities
of the space suit. The second area of emphasis was the development of
materials to resist cut and puncture threats, as well as benefit the space suit's
MMOD impact protection capabilities.
The self-sealing mechanisms evaluated for their ability to increase the length of
time before depressurization in the event that the space suit's protective layers
are penetrated (which is currently 30 minutes with a 4 mm diameter hole
(Christiansen et al, 1997) included: 1) viscoelastic materials, 2) nonwoven
fibrous materials impregnated with viscoelastic materials, and 3) highly
texturized fabric, adherent to the current bladder (pressure envelope) material.
All candidates were bench tested in a pressurized state (4.3 psig) to assess their
ability to seal a leak or puncture if used as the primary bladder material. The
viscoelastic materials were the most promising of these candidates.
Cut and puncture resistant materials were designed from existing high
tenacity/high performance yarns (Kevlar 29 ®) and newly developed high
tenacity/high performance yarns (polyethylene naphthalate). Tested to measure
their ability to prevent a breach in the pressure envelope, the most promising ofthese candidates were sent to the National Aeronautical and Space Agency
• i:_ ¸
i I :i._i, _ • : _
(NASA) Johnson Space Center (JSC) White Sands Testing Facility (WSTF)
facility for hypervelocity testing.
!
2.0 INTRODUCTION
The assembly and construction of the International Space Station will place
unprecedented demands on the protection that the Space Suit Assembly (SSA) is
required to provide. The harsh environment of space, and the increased
frequency and scope of Extravehicular Activities (EVA), necessitate that
increased space suit protection capabilities be addressed that have minimal tono increase in mass or flexibility. Through a joint effort, ILC Dover, Inc. and
Philadelphia College of Textiles and Science addressed the enhancements the
current space suit materials, with the following objectives: 1) to evaluate self-
sealing or self-repairing mechanisms for the pressure envelope and 2) to
evaluate newly designed fabric constructions for improving the protection
capabilities of the space suit for resistance to cut, punctures, andMicrometeoroid/Orbital Debris (MMOD) impacts.
Space Suit Assembly Description
The Extravehicular Mobility Unit, of which the SSA is a part, is a complete, self-
contained life support system. This thermally controlled flexible structure
provides the pressurized environment necessary for life sustaining functions. It
facilitates required mobility and allows for tactility, while providing cut,
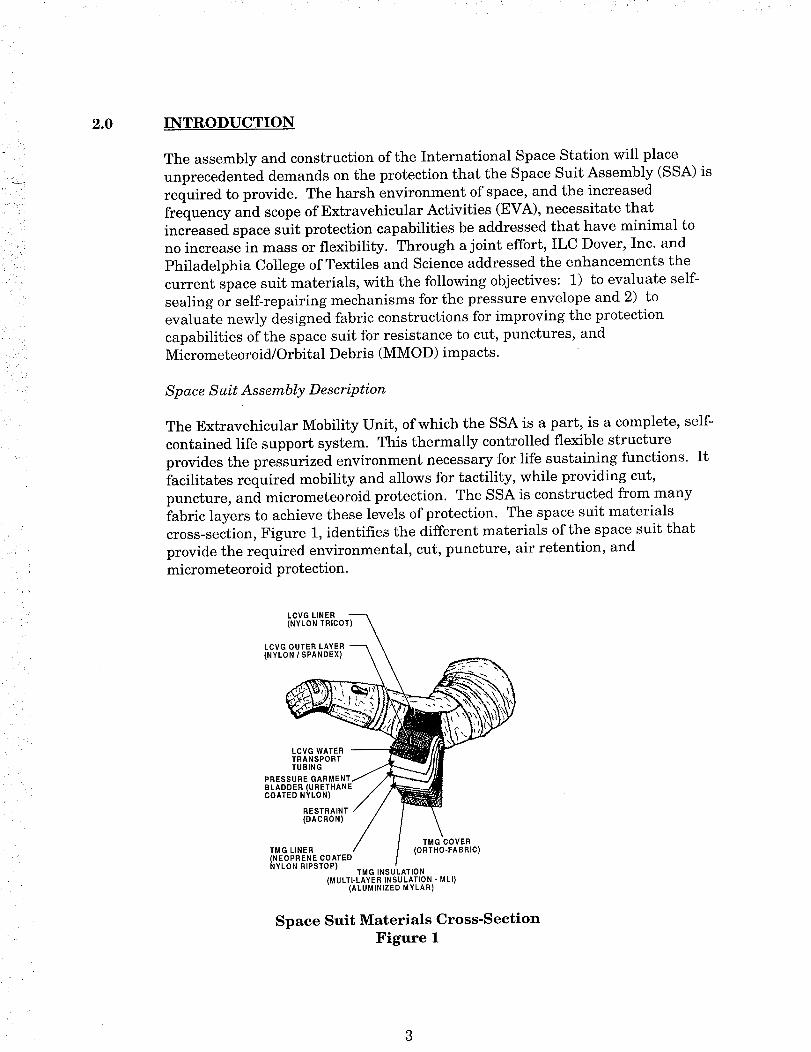
puncture, and micrometeoroid protection. The SSA is constructed from many
fabric layers to achieve these levels of protection. The space suit materials
cross-section, Figure 1, identifies the different materials of the space suit that
provide the required environmental, cut, puncture, air retention, and
micrometeoroid protection.
TMG COVER
(ORTHO-FABRIC)
LCVG LINER T'_
(NYLON TRICO
LCVG OUTER LAYER _ \
TRANSPORT _*
TUBING /,_--_-
PRESSURE GARMENT/
BLADDER (URETHANE / _1_
COATED NYLON) / / -
RESTRAINT / /
(DACRON) /
TMG LINER
(NEOPRENE COATEDNYLON RIPSTOP)
TMG INSULATION
(MULTI-LAYER INSULATION - MLI)
(ALUMINIZED MYLAR)
Space Suit Materials Cross-Section
Figure 1
::iJ
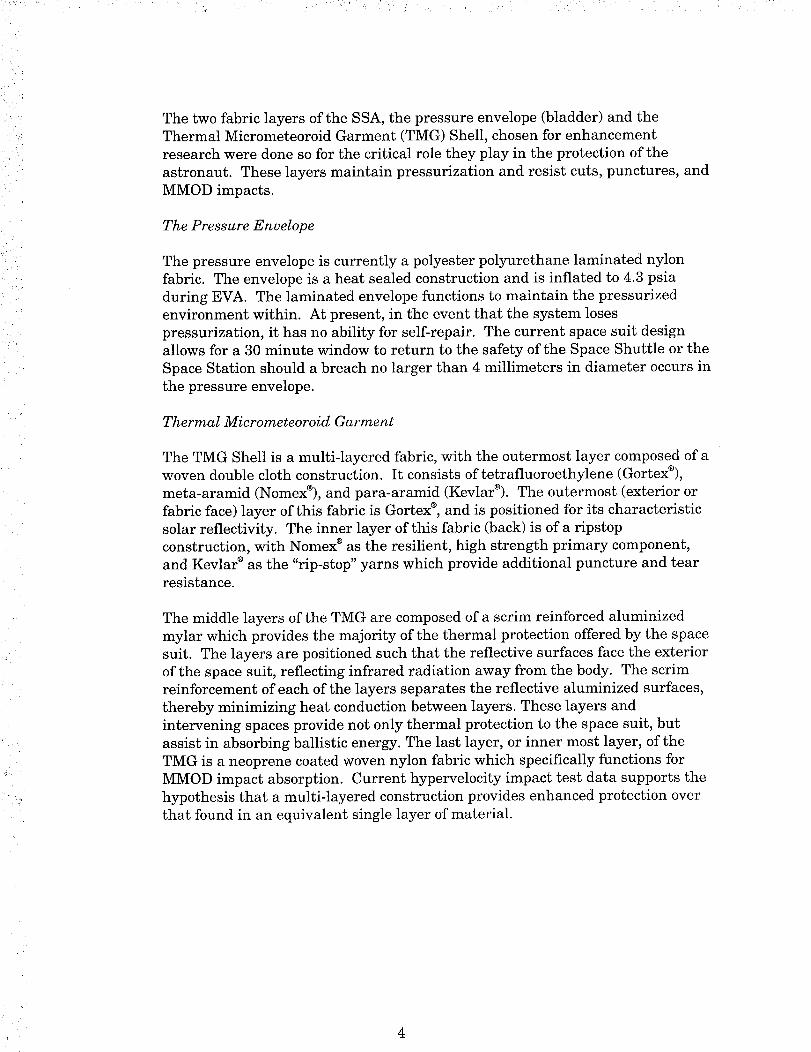
The two fabric layers of the SSA, the pressure envelope (bladder) and theThermal Micrometeoroid Garment (TMG) Shell, chosen for enhancement
research were done so for the critical role they play in the protection of the
astronaut. These layers maintain pressurization and resist cuts, punctures, and
MMOD impacts.
The Pressure Envelope
The pressure envelope is currently a polyester polyurethane laminated nylon
fabric. The envelope is a heat sealed construction and is inflated to 4.3 psia
during EVA. The laminated envelope functions to maintain the pressurized
environment within. At present, in the event that the system loses
pressurization, it has no ability for self-repair. The current space suit designallows for a 30 minute window to return to the safety of the Space Shuttle or the
Space Station should a breach no larger than 4 millimeters in diameter occurs in
the pressure envelope.
Thermal Micrometeoroid Garment
The TMG Shell is a multi-layered fabric, with the outermost layer composed of a
woven double cloth construction. It consists of tetrafluoroethylene (Gortex®),
meta-aramid (Nomex_), and para-aramid (Kevlar®). The outermost (exterior or
fabric face) layer of this fabric is Gortex _, and is positioned for its characteristic
solar reflectivity. The inner layer of this fabric (back) is of a ripstop
construction, with Nomex ®as the resilient, high strength primary component,
and Kevlar ® as the "rip-stop" yarns which provide additional puncture and tearresistance.
The middle layers of the TMG are composed of a scrim reinforced aluminized
mylar which provides the majority of the thermal protection offered by the space
suit. The layers are positioned such that the reflective surfaces face the exterior
of the space suit, reflecting infrared radiation away from the body. The scrim
reinforcement of each of the layers separates the reflective aluminized surfaces,
thereby minimizing heat conduction between layers. These layers and
intervening spaces provide not only thermal protection to the space suit, but
assist in absorbing ballistic energy. The last layer, or inner most layer, of the
TMG is a neoprene coated woven nylon fabric which specifically functions for
MMOD impact absorption. Current hypervelocity impact test data supports the
hypothesis that a multi-layered construction provides enhanced protection over
that found in an equivalent single layer of material.
4
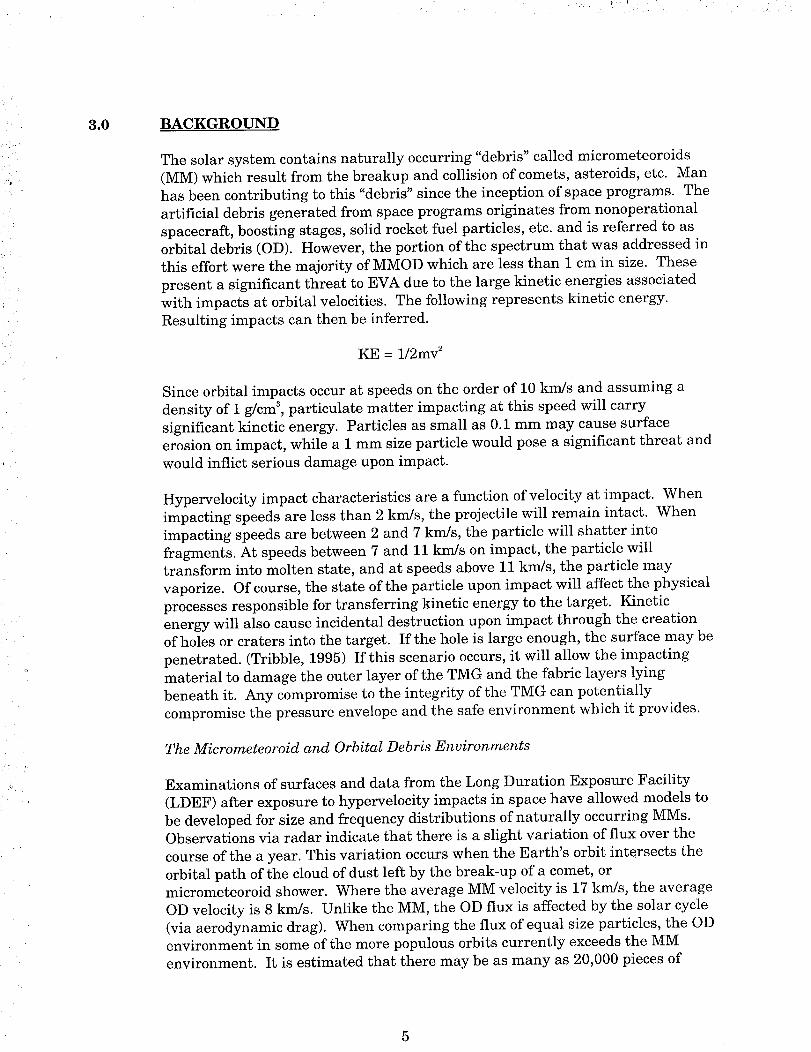
3.0 BACKGROUND
The solar system contains naturally occurring "debris" called micrometeoroids
(MM) which result from the breakup and collision of comets, asteroids, etc. Man
has been contributing to this "debris" since the inception of space programs. The
artificial debris generated from space programs originates from nonoperational
spacecraft, boosting stages, solid rocket fuel particles, etc. and is referred to asorbital debris (OD). However, the portion of the spectrum that was addressed in
this effort were the majority of MMOD which are less than 1 cm in size. These
present a significant threat to EVA due to the large kinetic energies associated
with impacts at orbital velocities. The following represents kinetic energy.
Resulting impacts can then be inferred.
KE = 1/2my 2
Since orbital impacts occur at speeds on the order of 10 km/s and assuming a
density of 1 g/cm _, particulate matter impacting at this speed will carry
significant kinetic energy. Particles as small as 0.1 mm may cause surface
erosion on impact, while a i mm size particle would pose a significant threat and
would inflict serious damage upon impact.
Hypervelocity impact characteristics are a function of velocity at impact. When
impacting speeds are less than 2 km/s, the projectile will remain intact. When
impacting speeds are between 2 and 7 km/s, the particle will shatter into
fragments. At speeds between 7 and 11 km/s on impact, the particle willtransform into molten state, and at speeds above 11 km/s, the particle may
vaporize. Of course, the state of the particle upon impact will affect the physical
processes responsible for transferring kinetic energy to the target. Kinetic
energy will also cause incidental destruction upon impact through the creationof holes or craters into the target. If the hole is large enough, the surface may be
penetrated. (Tribble, 1995) If this scenario occurs, it will allow the impacting
material to damage the outer layer of the TMG and the fabric layers lying
beneath it. Any compromise to the integrity of the TMG can potentially
compromise the pressure envelope and the safe environment which it provides.
The Micrometeoroid and Orbital Debris Environments
Examinations of surfaces and data from the Long Duration Exposure Facility
(LDEF) after exposure to hypervelocity impacts in space have allowed models to
be developed for size and frequency distributions of naturally occurring MMs.Observations via radar indicate that there is a slight variation of flux over the
course of the a year. This variation occurs when the Earth's orbit intersects the
orbital path of the cloud of dust left by the break-up of a comet, ormicrometeoroid shower. Where the average MM velocity is 17 km/s, the average
OD velocity is 8 km/s. Unlike the MM, the OD flux is affected by the solar cycle
(via aerodynamic drag). When comparing the flux of equal size particles, the ODenvironment in some of the more populous orbits currently exceeds the MM
environment. It is estimated that there may be as many as 20,000 pieces of
5

debris greater than 4 cm currently circling the Earth and it is not unexpected
that particulate material ejected from hypervelocity impacts may go on to
become orbital debris itself. Though considered to be a certainty in space flight,
the probability of impact with another object is estimated from the following
relationship, where in time T (years) the number of impacts an object of surface
area A(m 2) can expect is given by:
N = ftL+T FAdt
while the probability of n impacts is given by
-N
P = N" exp
n_
Hodgson, et. al provided an SSA Vulnerability Summary (Table 1) by linking
SSA material surface areas to their respective area densities, and then
estimating the resulting protective capabilities of those regions to MMOD
through correlations for penetration of monolithic layers of materials. It is
important to note that these estimates are expressed in terms of the critical
particle size for MMOD which will just penetrate the TMG in each of these
regions. These critical particle sizes are combined with the size distributions for
each of the regions to estimate the total probability of penetration of the SSA.
Table 1
SSA Vulnerability Summary
Description Area(m 2)
Lower Torso 1.2
Arms
Gloves
PLSS
.75
.11
.9
Areal Density
(g/cm 2).13
.13
.07
.94
......i:;:i_i:i_i:i:i:i:i:i:ii:i:i:i:i:i:_:i:?:i:i:i:i:i:i:i:i:i:i:i:i:i:i:i:ii:i.........
Debris
(cm).032
.032
.02
.13
:i iiiiiiiHiiiiiHii Micrometeoroids
(cm).035
.035
.02
.13
Hazard
(%)50
29
15
2
2DCM .18 .51 .062 .065
HUT .12 .44 .064 .07 1.2
Helmet(Visor) .06 .37 .063 .07 .6.15Helmet .15 .61 .14
Boots (Soles) .05 1.5 .26 .27
.2
<.1
As Table I indicates, the greatest percentages of exposure to MMOD threats are
found in the Arms, Lower Torso, and Gloves. This research effort concentrated
on improving materials for the outer layer of the TMG that would be found in all
of these areas, and self-sealing capabilities in all but the gloves.
6
Sharp objectexposurethat posespotential threats suchascuts and punctures tothe SSAwill alsooccurduring the constructionand habitation of theInternational SpaceStation. The astronaut has intended aswell asunintendedcontactwith sharp,unprotected,or damagededgesof spacecraftor componentparts, which presentsa significant threat to the protection that the spacesuitcanoffer. The designof the SSAmust accountfor the sorts of complexsituations that arisewhere hand-holdsor contactsurfacesareconfrontedwhileon anEVA mission. Twoexamplesdescribethe sort of threats that the SSAhasfacedin the past: 1) During the EVA onSTS-72in which practice techniquesfor the assemblyof the spacestation were conducted,significant damageto thespacesuit, in the form of cuts in the TMG of the glovessurface,were noted.Thesecuts were attributed to the hardware beingusedto carry out the missions(Fritz, 1996). This damagewascreatedby sharp edgesfrom a tool cabinet and atranslation cable. In this instancethe damagedid not reach the pressureenvelope,this structural integrity wasmaintained. Thoughthere arespecificationsfor surfaceedgegeometriesfor the Shuttle program, they are notalwaysfollowed,and not all contactswith risk canbeaverted. 2) Another, moreextremeexampleof the dangersthat advancedEVA holds, occurredduring STS-49when the Intelsat VI wascaptured. The astronauts and ground crewavertedpotential disasterinvolving cuts or penetration of the pressureenvelope. Duringthis missionthere wassignificant concerngeneratedregarding apossibleSSApenetration when the 0.062inch thick metallic surfaceof the satellite wasgraspedby three EVA astronauts. Fortunately, the spinning satellite's inertiawas low enoughnot to require the glovesor any other part of the SSAto bedraggedalongthe potential knife edge. As statedearlier, the TMG offers acritical role in protecting the astronaut. Theneedfor improving the safetyfactor of the TMG and the pressureenvelopeis becomingespeciallyacuteasorbital repair and constructionactivities becomeroutine.
• ff :
i/. !:_i'_
/ /i
!i _ ! _ :
i
_i!i_i_i "
4.0 APPROACH
By concentrating research efforts toward the three primary areas of focus, 1)
self-sealing capabilities for the pressure envelope, 2) improved cut and
puncture, and 3) hypervelocity impact resistance for the TMG, significantaccomplishments were met, encouraging continued investigation and
development in these areas.
Unshadowed areas of the torso and extremities, where exposure to MMOD is
highest, were felt to be an important focus for these enhancement efforts.
Therefore, TMG enhancement technologies were directed only to unshadowed
areas of the TMG with the glove as an exception. The glove, though extremely
critical, has unique requirements for mobility and tactility. Design changes, no
matter how slight, have a much greater affect on functionality than a similar
change to another area of the space suit. It was decided that developmental
enhancement efforts for the glove would be better served from a stand-alone
effort, and not combined with developmental efforts for the remainder of the
TMG and pressure-envelope.
4.1 SELF-SEALING MECHANISMS
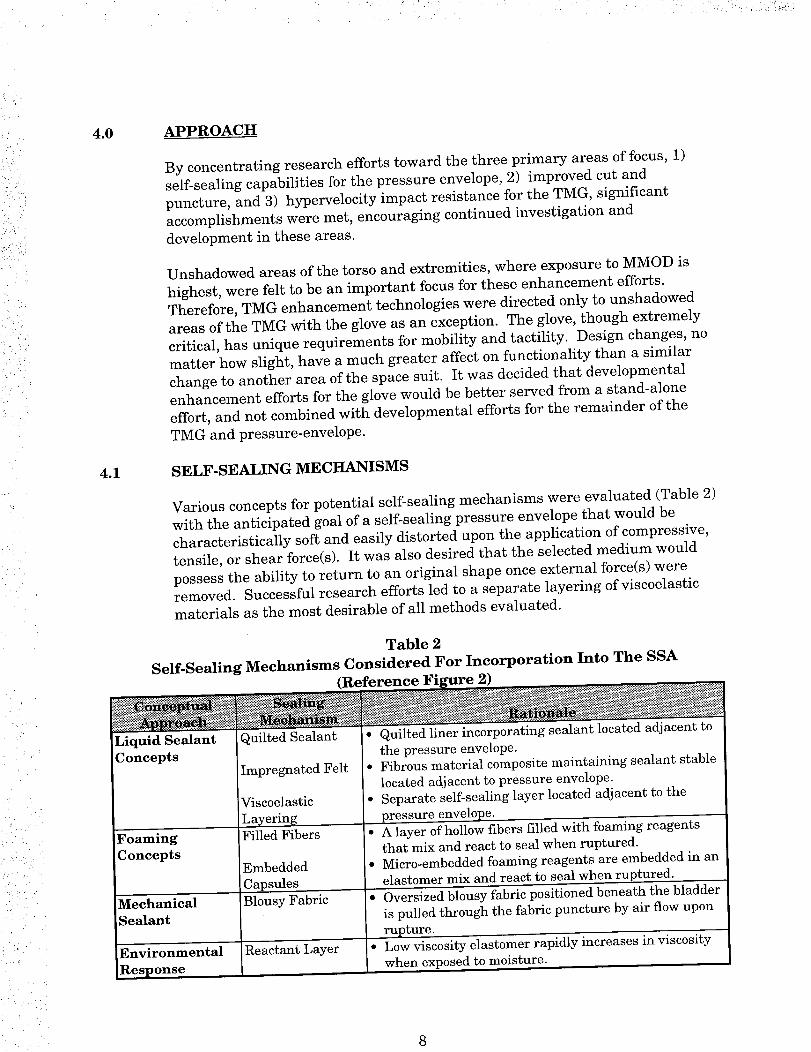
Various concepts for potential self-sealing mechanisms were evaluated (Table 2)
with the anticipated goal of a self-sealing pressure envelope that would be
characteristically soft and easily distorted upon the application of compressive,
tensile, or shear force(s). It was also desired that the selected medium would
possess the ability to return to an original shape once external force(s) wereremoved. Successful research efforts led to a separate layering of viscoelastic
materials as the most desirable of all methods evaluated.
Table 2
Self-Sealing Mechanisms Considered For Incorporation Into The SSA
(Reference Figure 2)
Liquid SealantConcepts
Foaming
Concepts
Mechanical
Sealant
Environmental
Resp-n _,_
_$__ _i_:_ _
,Quilted Sealant
Impregnated Felt
Viscoelastic
LayeringFilled Fibers
Embedded
Capsules
Blousy Fabric
Reactant Layer
• Quilted liner incorporating sealant located adjacent to
the pressure envelope.• Fibrous material composite maintaining sealant stable
located adjacent to pressure envelope.
• Separate self-seahng layer located adjacent to the
pressure envelope.• A layer of hollow fibers filled with foaming reagents
that mix and react to seal when ruptured.• Micro-embedded foaming reagents are embedded in an
elastomer mix and react to seal when ruptured.
• Oversized blousy fabric positioned beneath the bladder
is pulled through the fabric puncture by air flow upon
rupture.• Low viscosity elastomer rapidly increases in viscosity
when exposed to moisture.
" i i ii ,__):/ ._,_ii: _:.__ ) __!i_), _ii_I_:_IIII':__i:_:::i!_:_/__I'11_I_:_i: •
One.Comoonent O"
Quilted Sealant
:::.:
...._:_i_::i::::i:I _.. B,_ddor
iiiiiiiiiiiiiiiiiiiii
Seal ::: Liners
Impregnated
Felt i. 4 PenetrationSealing
One-Component
System
Impregnated Felt
Elastomeric
Mat " .:i::.:_i:!:: ::::::::::::::::::::::::
Reactant-Filled
Hollow
Fibers
2L Sealing
Two-Component
System
Filled Fibers
UOElastomeric _ , ..
Matrix _ :.: :i:i::::.:-:._11 .................... Bladder
_ Liners
Reactant-Filled
Embedded
Capsules
Twe-C omponent
System
Penetration
Sealing
Embedded Capsules
...._iiiiiiiii
:_iiiiiiiiiiiii_.:....:..:..::.
i_iiiiiiiiiiiiiiiii.
Loose
Blousy
Fabrics
One-Component
System
_ ii_i_i_ii;:...... Bladder
: _ Backing
-+>:.
I Penetration
Scaling
Blousy Fabric
:,,_iiiiiiiiiiiiiiiiiiiiiiiiiii!iiii_i_:_ • •
Reactive
Sealant
li P_etration
Sealing
Twc-Component
System
Reactant Layer
Self.Sealing Mechanisms Considered for Incorporating into the SSA
Figure 2
• ) •
4.2
Viscoelastic Materials - These materials combine both viscous and elastic
behaviors, which means that they both dissipate and store energies. Elastomers
(i.e. rubbers) are the best known examples of this class of material. Thematerial is made from long, flexible chain-like molecules. They contain many
single valence bonds, about which rapid rotation is possible as a result of
thermal agitation. Thousands of these molecules are linked together into achain to form an elastomeric unit. Such molecules will change shape readily and
continuously at normal temperatures by Brownian motion. They take up
random conformations in a stress-free state, but assume somewhat oriented
conformations if tensile forces are applied at their ends. In other words, any
deformation will tend to "straighten out", or uncoil, the entangled mass of
contorted chains, and these will tend to coil up again when the restraining force
is released. This elastic-retractile force is really due to the violent contortions of
the long, flexible chains. By incorporating a small number of intermolecularchemical bonds (i.e. crosslinks) into the elastomer, a permanent structure with
the optimal crosslinking density can be formed. Silicone and urethane polymers
are two types of viscoelastic materials having exceptional behavioral responses
for this sort of function (Cadogan, 1996).
Silicone Polymers - Silicone Polymers (polydimethylsiloxane), available in a
variety of molecular weights and with varying degrees of cross-linking can form
a variety of desirable compounds. They have low and predictable tensile and
compressive moduli. With good cohesive strengths they tend to adhere well tothemselves in a low crosslinked state. Silicone polymers are chemically inert
and possess an excellent combination of low temperature flexibility and high
temperature resistance.
Urethane Polymers - Urethane Polymers can also be tailored to desired
performance requirements. Derived from the reaction of diisocyanate and diol,urethanes possess high strength, high elongation, and have a predictable
moduli. Varying the ratio of starting materials, urethane polymers can range
from a soft pliable gum consistency to a rigid, hard polymer.
CUT, PUNCTURE, AND HYPERVELOCITY IMPACT RESISTANT
MATERIALS
Materials that were soft, flexible, and resilient were developed for the cut and
puncture resistance effort. Though the fabric currently used as the outermost
layer of the TMG is a double-cloth construction, for this effort, these single layerfabrics allow for significant alterations in fabric construction (layers, basic
weave design, yarn inlays) as would be deemed necessary from testing results.
High molecular - high tenacity (HM-HT) materials such as those chosen for this
effort, were done so as they possess a degree of crystallinity (the orderly or
parallel arrangement of polymer molecules within and along a fibers axis) and oforientation (the degree to which linear polymeric chains are parallel and
oriented in a preferred direction, which may not be that of the fiber's axis) which
are important determinants to cut and puncture resistance that these materials
10
i"_ _ -i
? i:: • _ •
"ii_!i: i'
.::)
!:ii:i ,
• _ : i, _
.... i ii
can provide. The high tenacity, high performance yarns utilized in the
prototypes were para-aramids (Kevlar 29 ®) and polyethylene naphthalate
(PENTEX).
Para-aramid Fibers.
Para-aramid fibers are composed of the aromatic polyamide, poly (p-phenylene
terephthalamide) or PPTA:
-co © co Nn©These molecules are stiff and possess strong tendencies for interaction with
neighboring molecules, both at the benzene rings and by hydrogen bonding atthe -CO.NH- groups. In solution these self-attracting molecules form elongated
liquid crystals. High shearing at this point of fiber formation aligns the crystals,
parallel to the fiber axis, resulting in a fibrous structure that consists of fullyextended chains, packed together with a very high degree of crystallinity and
orientation. A slight disorder is present which originates from boundaries
between liquid crystals and imperfections of packing within the crystals
resulting in some departure from perfect orientation. When drawn, (the act of
applying tension, either during extrusion or immediately thereafter), these
fibers improve their structural perfection. Kevlar 29 ®, used in both the current
TMG and the newly developed prototypes, is a lower-ordered, lower-modules
form of the para-aramids. Within the crystalline lattice formation there is an
alternating ring and linear formation which creates an anisotropic situation.
Though highly crystalline and oriented, this creates a radically oriented axial
pleating of the crystalline sheets, which helps to resist to some degree,
compressive forces while maintaining high strength characteristics.
Meta-ararnid Fibers
Meta-aramid fibers (Nomex ®) are made from poly (m-phenylene
isophthalamide). By comparing to the para-aramids, the shape of thesemolecules prevent liquid-crystal formation which results in a partially oriented,
partially crystalline structure. For this reason Nomex ® possesses higher
elongation properties than does Kevlar ®, and possesses a lower tenacity.
Polyethylene Napthalate Fibers
Structurally, the polyethylene napthalate fibers (PENTEX) are more similar to
the para-aramids than to the meta-aramids. They possess a significantly higher
compressive modulus compared to the other materials, which would prove
beneficial to resisting cut and puncture threats.
11
Table 3
Comparison Of The Selected Yarn Materials Physical Properties
Density (g/cc)
Tenacity (g/d)
Modulus (g/d)
Elongation (%)
Compressive
Modulus (g/d)
1.44
23
550
4.0
1.38
4- 5.3
55O
22-32
.39 .39
1.39
10+
250
6.0
3.6
J
'i _ , i ', _(
12
". I¸ .i_ i
5.0
5.1
5.1.1
FINDINGS
As purported, the goal of this study was to define and test materials that could
offer improved performance in the areas of self-sealing, cut and puncture
resistance and improved protection against hypervelocity impacts. These three
areas are discussed in detail in Sections 5.1, 5.3 and 5.5 respectively.
SELF-SEALING MECHANISMS/MATERIALS
ILC Dover collaborated with the Philadelphia College of Textiles and Science in
the design of these self sealing materials and mechanisms. As shown in Table
2.0, several approaches were considered. Some of the more exotic concepts (i.e.
microencapsulation as one example), although interesting from a technology
viewpoint, were not pursued because they were clearly beyond the original scope
of the proposal. It was decided that we would concentrate on both liquid sealing
concepts as well as a mechanical sealing concept as proposed by PhiladelphiaCollege of Textiles and Science.
Backe'round
As discussed in Section 4.0 of this report, viscoelastic materials exhibit the
fundamental properties for self sealing behavior. Since they exhibit both viscous
and elastic properties, they do possess sufficient memory to return to their
original location after being punctured or torn. In addition, it is also important
that a polymer system possess high affinity for itself after being damaged. This
strong attraction, along with its a high cohesive strength, ensures that the
damaged material can "mend" itself in a reliable manner.
It was anticipated that the ideal candidate would be relatively soft and easily
distorted upon application of a compressive, tensile or shear force. Once the
force is removed, the elastomer should return to its original shape. If the
elastomer layer is breached, it would readily flow upon itself and knit together
in a strong, cohesive bond. The data presented in section 5.1.8 supports thistheory.
Practically speaking, some type of permanent structure is necessary to form a
coherent solid and prevent liquid like flow of elastomer molecules. This
requirement is usually met by incorporating a small number of intermolecular
chemical bonds (i.e. crosslinks) to make a loose three dimensional molecular
network. These crosslinks further affect the elastic behavior of the molecule.
Through proper selection of the elastomer and crosslink density, the desired
properties can be obtained.
Two types of polymer systems were investigated and tested in this study.
Silicone polymers, based upon polydimethylsiloxane, are available in a variety of
molecular weights and can be crosslinked to form a variety of compounds. Theyexhibit low permanent set properties and tend to adhere well to themselves in a
low crosslinked state. Secondly, urethane polymers are another class of
13
5.1.2
elastomers that can be tailored to meet the desired performance requirements.
By varying the mole ratio of the starting materials, urethane polymers can be
produced ranging from soft, pliable gums to rigid, hard polymers.
Viscoelastic Material Candidates
Listed below is a description of the silicone and urethane candidates
investigated in this study. In all cases, the materials submitted for puncture
testing were laminated to a lightweight, 220 denier polyester basecloth to
facilitate handling and to increase its overall damage tolerance.
Silicones
Silastic HS-30, produced by Dow Corning Corporation, is a 30 Shore A
durometer, high strength methyl-vinyl silicone elastomer. It is compounded
with 2,4-dichlorobenzoyl peroxide catalyst and put into solution with toluene.
The silicone rubber solution is then coated onto the lightweight polyester cloth
at the desired thickness and vulcanized in a hot air oven. This candidate
exhibited poor self sealing behavior in early testing and was therefore droppedfrom further consideration.
SWS 7810, manufactured by SWS Silicones, is a 10 Shore A durometer, methyl
vinyl silicone elastomer. As with the Silastic HS-30, it is compounded with a
suitable peroxide catalyst and coated onto a fabric. The goal here was to
evaluate a softer version of this type of elastomer for improved self sealing
properties. Unfortunately, this softer material exhibited poor results in earlytesting and was dropped from further consideration.
Sylgard Q3-6636, manufactured by Dow Corning Corporation, is two part,
dielectric silicone gel designed for potting and encapsulating moisture sensitive
electronic circuitry. It is reported to retain the stress relief of a liquid whiledeveloping the dimensional stability and nonflow characteristics of an
elastomer. In fact, it is reported to possess self healing properties as well aspressure sensitive adhesive bonding properties. Its hardness is well below that
of conventional silicone gum rubbers (as described above). In fact, hardness is
typically expressed in terms of penetration of a probe for these soft gels.
Urethanes
Rucothane CO-AX-5294, manufactured by Ruco Polymer, is a urethane
solution polymer based upon thermoplastic, polyether urethane. It is presently
used in the manufacture of all glove bladders for the current Shuttle Space Suit
contract. It possesses high tensile and tear strength in combination with a
relatively low tensile modulus. It is included here since it has demonstrated
some self sealing abilities during EVA where the astronauts palm barpenetrated the glove bladder. The bladder was able to form a seal around the
metallic palm bar and the leakage was stopped.
14

(
5.1.3
Conathane EN-11, manufactured by Conap Incorporated, is a two parturethane used for potting and casting applications. It exhibits lower hardness
and modulus than the Rucothane polymer, and therefore would be expected toperform better in a self sealing application.
TyrLyner, manufactured by Synair Corporation, is a two part urethane used
for self sealing passenger car tire applications. In its cured state, it behaves like
a soft gel, with very low hardness and low modulus properties. In many
respects, it is analogous to the silicone gels in the silicone family of polymers.
Part A is described as the curative consisting of a hydroxyl terminated polyether
polyol. Part B is defined as a isocyanate terminated prepolymer.
As described in section 5.1.7, selected materials have been tested in 15 and 30
mil thicknesses. In all cases, the material has been laminated to a 220 denier,high count polyester fabric to increase its durability.
Viscoelastic/Fibrous Composite Materials
The self sealing material candidates used in combination with textile
reinforcements to form a flexible composite construction are described in Table
2. All of the self sealing test coupons were prepared per the following procedure:
The current bladder cloth (polyester polyurethane laminated nylon fabric) was
cut into six-inch diameter circles, one for each sample prepared. The coated side
of all of the bladder cloth circles was swabbed with acetone to remove any
parting film. Cloth discoloration was not observed nor were any coloration nordeposits observed on the swab.
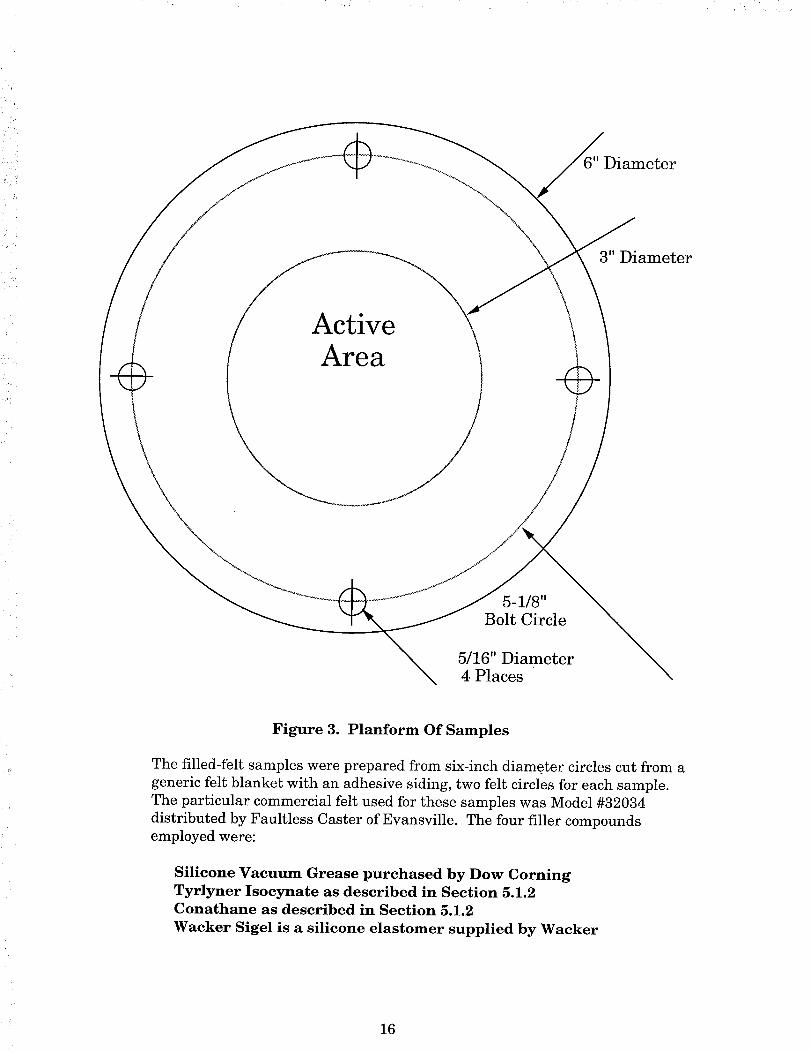
All of the samples had the configuration shown in Figure 3.
15
ameter
Figure 3. Planform Of Samples
The filled-felt samples were prepared from six-inch diameter circles cut from a
generic felt blanket with an adhesive siding, two felt circles for each sample.
The particular commercial felt used for these samples was Model #32034
distributed by Faultless Caster of Evansville. The four filler compoundsemployed were:
Silicone Vacuum Grease purchased by Dow Coming
Tyrlyner Isocynate as described in Section 5.1.2
Conathane as described in Section 5.1.2
Wacker Sigel is a silicone elastomer supplied by Wacker
16
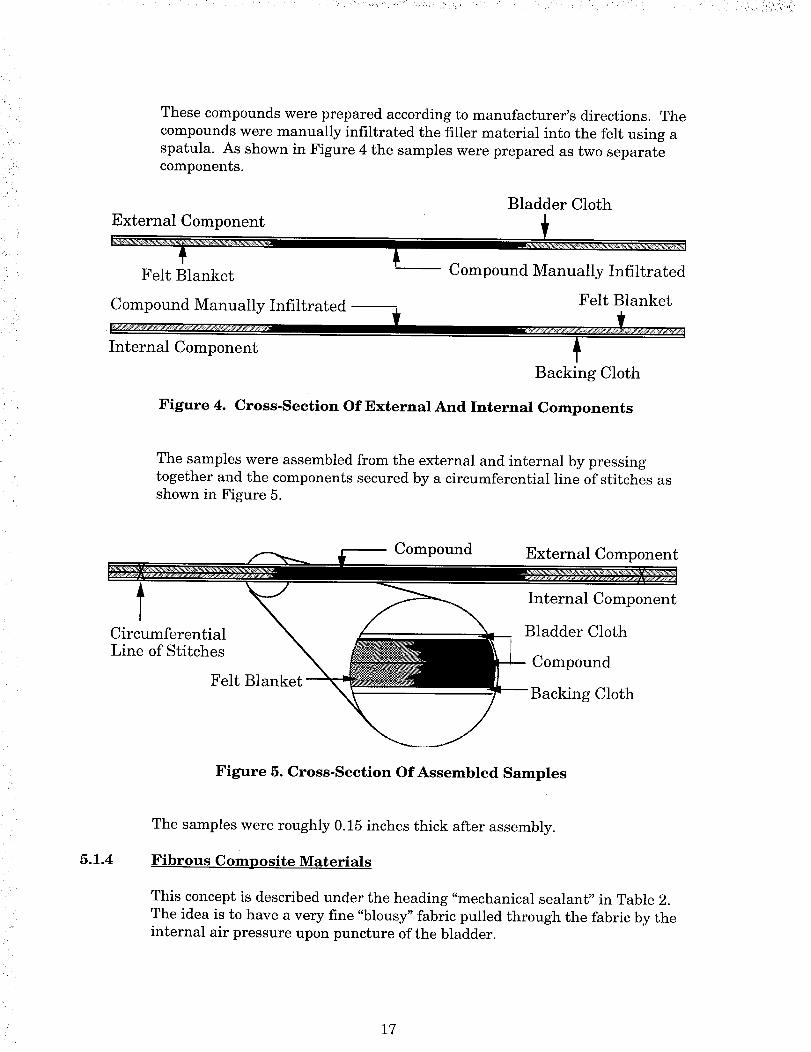
These compounds were prepared according to manufacturer's directions. The
compounds were manually infiltrated the filler material into the felt using a
spatula. As shown in Figure 4 the samples were prepared as two separatecomponents.
External Component
Bladder Cloth
Felt Blanket Compound Manually Infiltrated
Compound Manually Infiltrated Felt Blanket
Internal Component
Backing Cloth
Figure 4. Cross-Section Of External And Internal Components
The samples were assembled from the external and internal by pressing
together and the components secured by a circumferential line of stitches as
shown in Figure 5.
tCircumferential
Line of Stitches
Felt Blanket
Compound External Component
Internal Component
Bladder Cloth
Compound
Backing Cloth
Figure 5. Cross-Section Of Assembled Samples
5.1.4
The samples were roughly 0.15 inches thick after assembly.
Fibrous Composite Materials
This concept is described under the heading "mechanical sealant" in Table 2.
The idea is to have a very fine "blousy" fabric pulled through the fabric by theinternal air pressure upon puncture of the bladder.
17
5.1.7
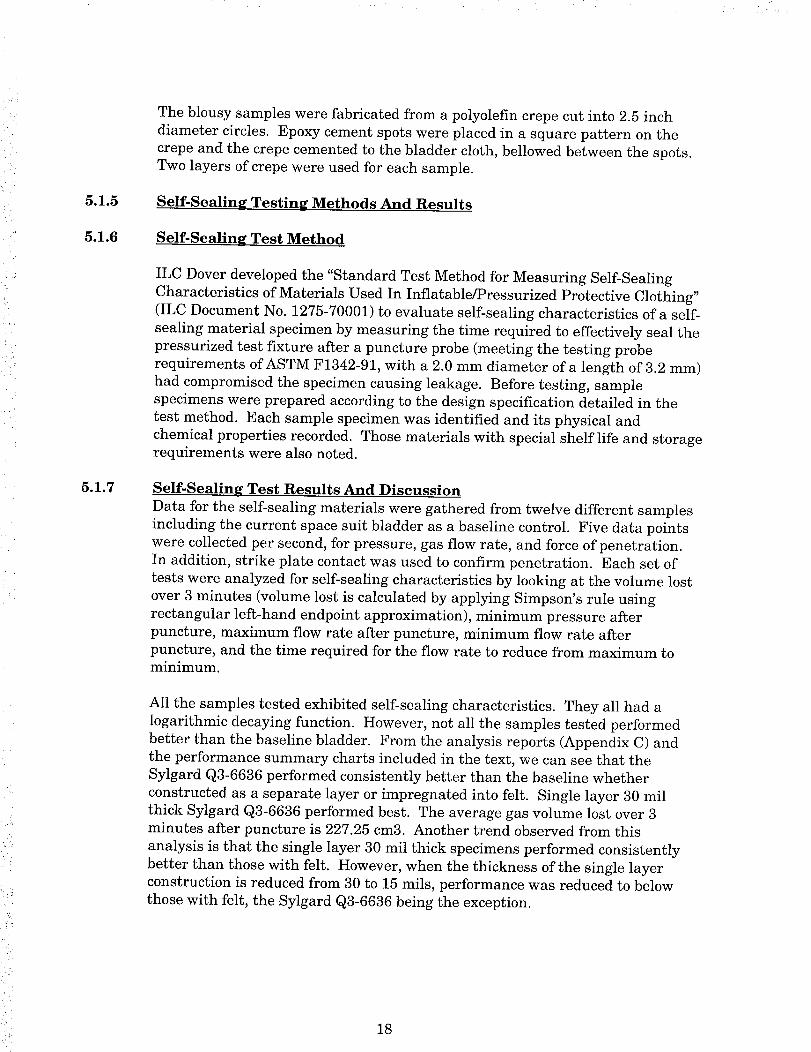
The blousy samples were fabricated from a polyolefin crepe cut into 2.5 inch
diameter circles. Epoxy cement spots were placed in a square pattern on the
crepe and the crepe cemented to the bladder cloth, bellowed between the spots.Two layers of crepe were used for each sample.
Self-Sealing Testing Methods And Results
Self-Sealing Test Method
ILC Dover developed the "Standard Test Method for Measuring Self-Sealing
Characteristics of Materials Used In Inflatable/Pressurized Protective Clothing"
(ILC Document No. 1275-70001) to evaluate self-sealing characteristics of a self-
sealing material specimen by measuring the time required to effectively seal the
pressurized test fixture after a puncture probe (meeting the testing probe
requirements of ASTM F1342-91, with a 2.0 mm diameter of a length of 3.2 mm)
had compromised the specimen causing leakage. Before testing, samplespecimens were prepared according to the design specification detailed in the
test method. Each sample specimen was identified and its physical and
chemical properties recorded. Those materials with special shelf life and storagerequirements were also noted.
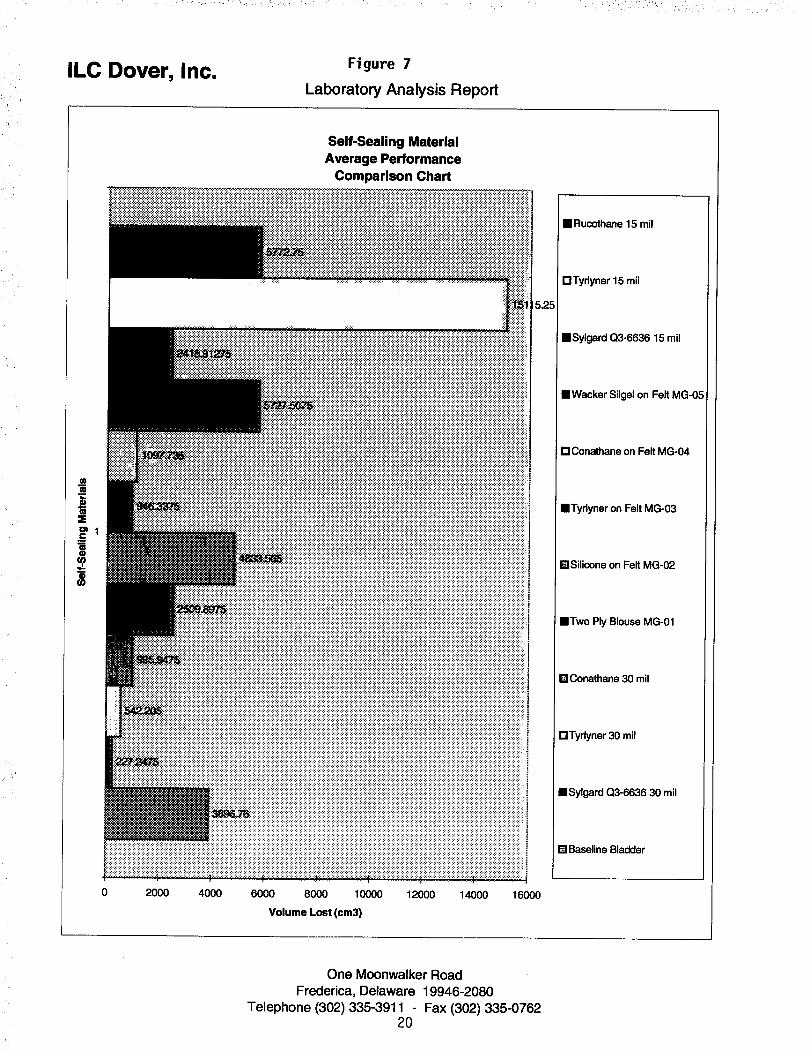
Self-Sealing Test Results And Discussion
Data for the self-sealing materials were gathered from twelve different samples
including the current space suit bladder as a baseline control. Five data points
were collected per second, for pressure, gas flow rate, and force of penetration.
In addition, strike plate contact was used to confirm penetration. Each set of
tests were analyzed for self-sealing characteristics by looking at the volume lost
over 3 minutes (volume lost is calculated by applying Simpson's rule using
rectangular left-hand endpoint approximation), minimum pressure after
puncture, maximum flow rate after puncture, minimum flow rate after
puncture, and the time required for the flow rate to reduce from maximum tominimum.
All the samples tested exhibited self-sealing characteristics. They all had a
logarithmic decaying function. However, not all the samples tested performed
better than the baseline bladder. From the analysis reports (Appendix C) and
the performance summary charts included in the text, we can see that the
Sylgard Q3-6636 performed consistently better than the baseline whether
constructed as a separate layer or impregnated into felt. Single layer 30 mil
thick Sylgard Q3-6636 performed best. The average gas volume lost over 3minutes after puncture is 227.25 cm3. Another trend observed from this
analysis is that the single layer 30 mil thick specimens performed consistently
better than those with felt. However, when the thickness of the single layerconstruction is reduced from 30 to 15 mils, performance was reduced to below
those with felt, the Sylgard Q3-6636 being the exception.
18

ILC Dover, Inc. Figure 6
Laboratory Analysis Report
20000 -
18000
16000
14000
1200OW
oE 10000.
,-I
==_. 8000
6000
4000
2000
0
0
Self-Sealing Material
Performance Comparison Chart
2
Sample No.
3 4
Baseline Bladder
•--B-- Sylgard Q3-6636 30 mil
Tyrlyner 30 mil
Conathane 30 mil
_Two Ply Blouse MG-01
--@_Silicone on Felt MG-02
---F---Tyrlyner on Felt MG-03
Conathane on Felt MG-04
---,---Wacker Silgel on Felt MG-05
Sylgard Q3-6636 15 mil
•il Tydyner 15 mil
_ Rucothane 15 mil
One Moonwalker Road
Frederica, Delaware 19946-2080
Telephone (302) 335-3911 - Fax (302) 335-0762
19
, ,/i ¸:_•:', ii_•:!:•:i_, :, rl ,
ILC Dover, Inc. Figure 7
Laboratory Analysis Report
===1|
0 2000 4000
Self-Sealing MaterialAverage Performance
Comparison Chart
6000 8000 10000
Volume Lost (cm3)
12000 14000
[]Rucothane 15 mil
rlTyrlyner 15 mil
nSylgard Q3-6636 15 mil
[]Wacker Silgel on Felt MG-05
DConathane on Felt MG-04
mTyrlyner on Felt MG-03
mSilicone on Felt MG-02
mTwo Ply Blouse MG-01
DConathane 30 mil
I'lTyrlyner 30 mil
nSylgard Q3-6636 30 mil
[] Baseline Bladder
One Moonwalker RoadFrederica, Delaware 19946-2080
Telephone (302) 335-3911 - Fax (302) 335-076220
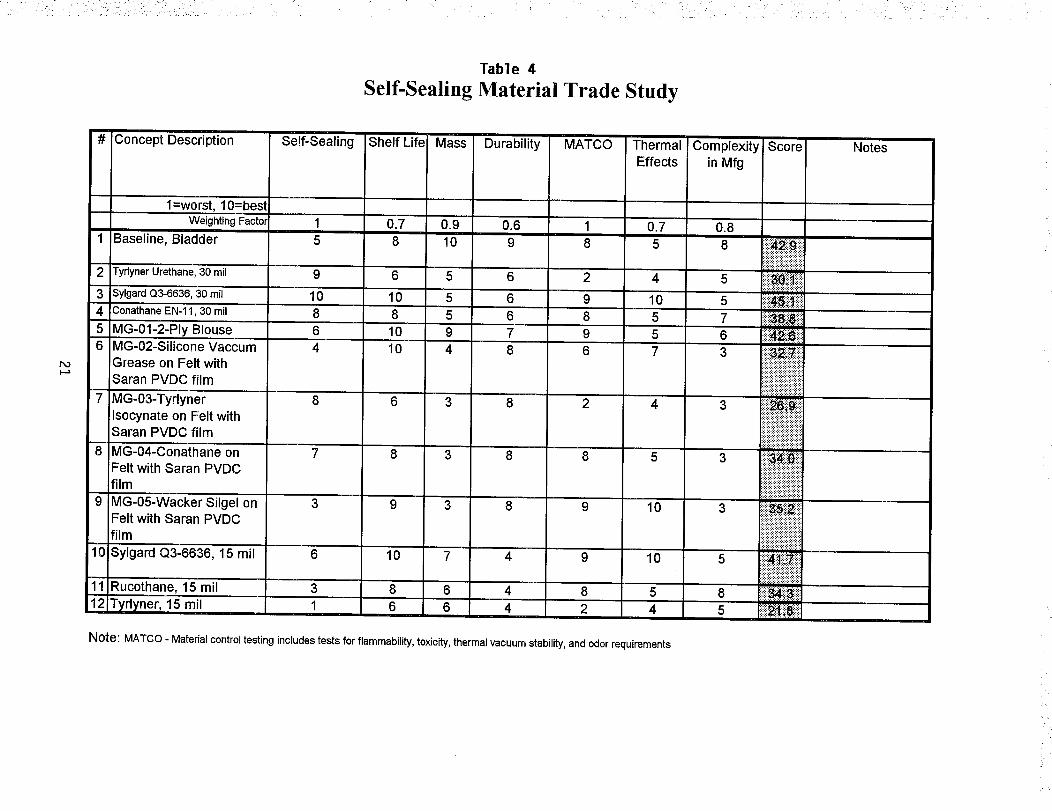
Table 4
Self-Sealing Material Trade Study
# Concept Description Self-Sealing Shelf Life Mass Durability MATCO Therma Complexity ScoreEffects in Mfg
Notes
I.-,,i
1=worst, 10=bestWeighting Factor 1 0.7 0.9
1 Baseline, Bladder 5 8 100.6 1 0.7 0.89 8 5 8
2 Tyrlyner Urethane, 30 mil 9 6 5
3 Sylgard Q3-6636, 30rail 10 10 54 Conathane EN-11,30 mil 8 8 5
5 MG-01-2-Ply Blouse 6 10 96 MG-02-Silicone Vaccum 4 10 4
Grease on Felt withSaran PVDC film
7 MG-03-Tyrlyner 8 6 3Isocynate on Felt withSaran PVDC film
8 MG-04-Conathane on 7 8 3Felt with Saran PVDCfilm
9 MG-05-Wacker Silgel on 3 9 3 8Felt with Saran PVDCfilm
6 2 4 5
6 9 10 56 8 5 77 9 5 68 6 7 3
8 2 4 3
8 8 5 3
9
10 Sylgard Q3-6636, 15 mil 6 10 7 4 9
10 3
10 5
5 812Rucothane, 15 mil 3 8 6 4 8Tyrlyner, 15 mil 1 6 6 4 2 4 5
Note: MATCO - Material control testing includes tests for flammability, toxicity, thermal vacuum stability, and odor requirements
iiii! Sii iiiiii
::::::::::::::::::::::::::::::::::::::::
•.......,..-.......,.;??;.
:::::::::::::::::::::::::::::::::
::::::::::::::::::::::::::::::::::::::::::::::
i_iiiii!%'.:ili_i_i'iiiiiiii
ii_iiiiiiiiiiiiiiiii!iiiiiiiii::::::::::::::::::::::::::::::::::::::::::::::::::::::::::::::
iiiiiiiiiiiiiiiiii!i!iiiiiiiii
ii:ii:i :. < iiii
5.1.8
5.1.9
5.2
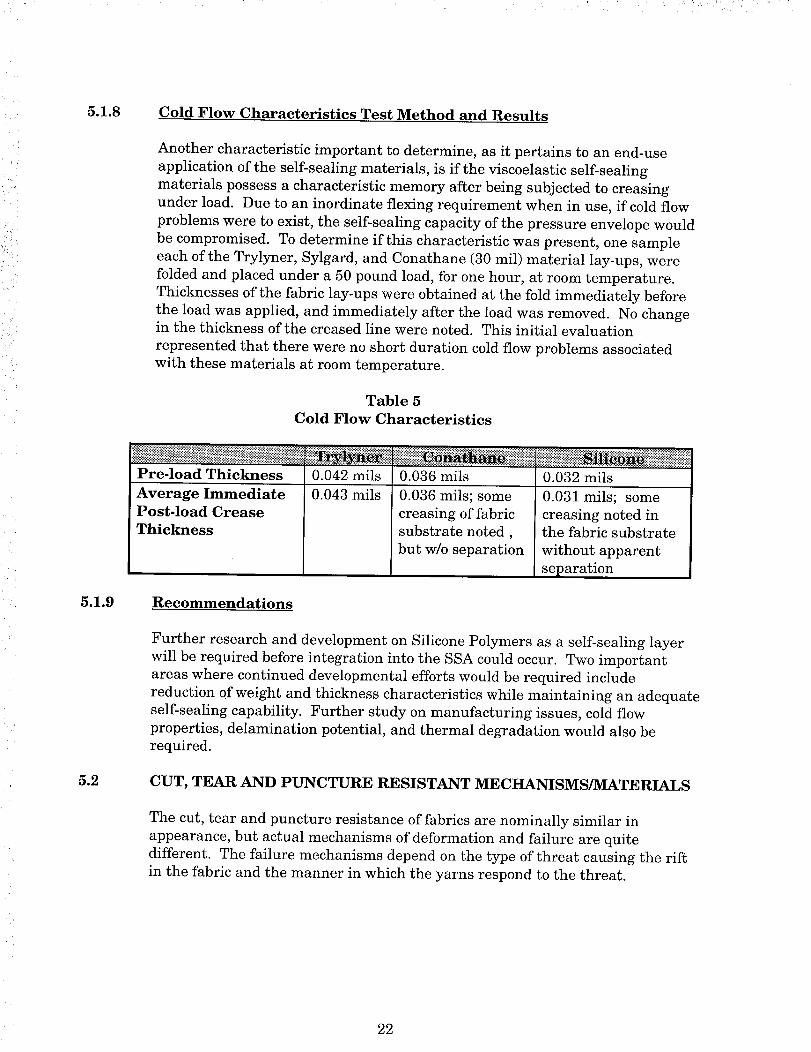
Cold Flow Characteristics Test Method and Results
Another characteristic important to determine, as it pertains to an end-use
application of the self-sealing materials, is if the viscoelastic self-sealing
materials possess a characteristic memory after being subjected to creasing
under load. Due to an inordinate flexing requirement when in use, if cold flow
problems were to exist, the self-sealing capacity of the pressure envelope would
be compromised. To determine if this characteristic was present, one sample
each of the Trylyner, Sylgard, and Conathane (30 mil) material lay-ups, were
folded and placed under a 50 pound load, for one hour, at room temperature.
Thicknesses of the fabric lay-ups were obtained at the fold immediately before
the load was applied, and immediately after the load was removed. No changein the thickness of the creased line were noted. This initial evaluation
represented that there were no short duration cold flow problems associated
with these materials at room temperature.
Table 5
Cold Flow Characteristics
Pre-load Thickness
Average Immediate
Post-load Crease
Thickness
0.042 mils 0.036 mils 0.032 mils
0.043 mils 0.036 mils; some
creasing of fabric
substrate noted,
but w/o separation
0.031 mils; some
creasing noted inthe fabric substrate
without apparent
separation
Recommendations
Further research and development on Silicone Polymers as a self-sealing layer
will be required before integration into the SSA could occur. Two important
areas where continued developmental efforts would be required include
reduction of weight and thickness characteristics while maintaining an adequateself-sealing capability. Further study on manufacturing issues, cold flow
properties, delamination potential, and thermal degradation would also berequired.
CUT, TEAR AND PUNCTURE RESISTANT MECHANISMS/MATERIALS
The cut, tear and puncture resistance of fabrics are nominally similar in
appearance, but actual mechanisms of deformation and failure are quite
different. The failure mechanisms depend on the type of threat causing the rift
in the fabric and the manner in which the yarns respond to the threat.
22
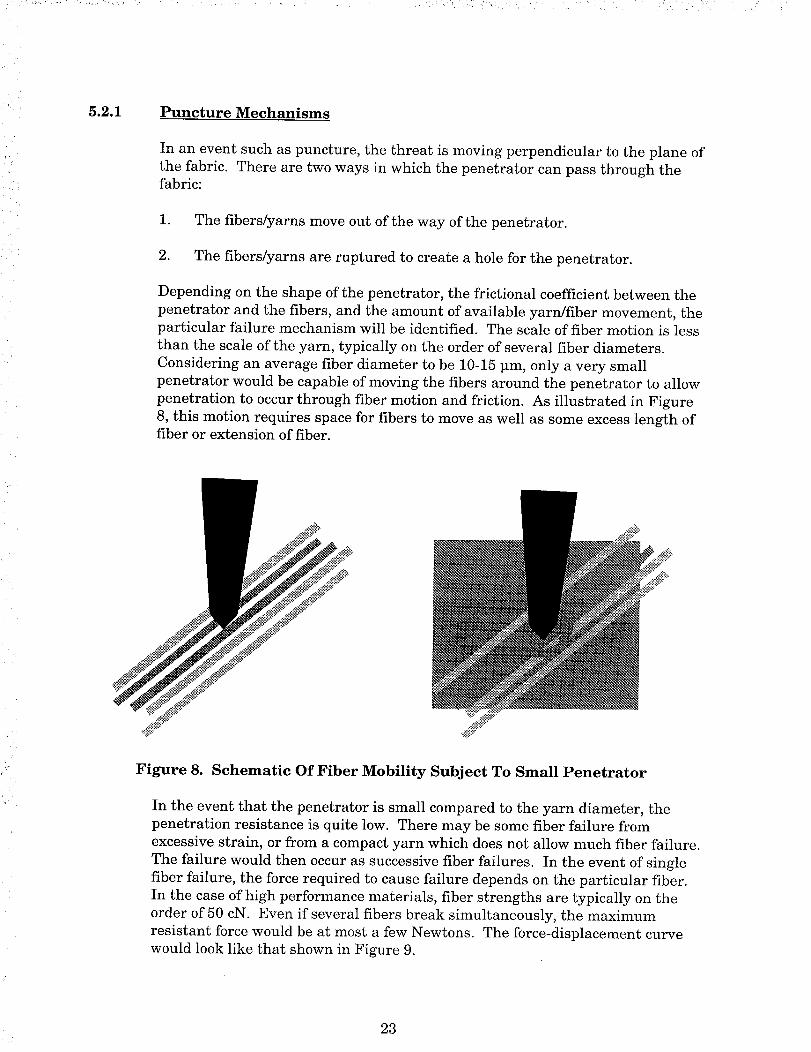
5.2.1 Puncture Mechanisms
In an event such as puncture, the threat is moving perpendicular to the plane of
the fabric. There are two ways in which the penetrator can pass through thefabric:
1. The fibers/yarns move out of the way of the penetrator.
2. The fibers/yarns are ruptured to create a hole for the penetrator.
Depending on the shape of the penetrator, the frictional coefficient between the
penetrator and the fibers, and the amount of available yarn/fiber movement, theparticular failure mechanism will be identified. The scale of fiber motion is less
than the scale of the yarn, typically on the order of several fiber diameters.
Considering an average fiber diameter to be 10-15 _m, only a very small
penetrator would be capable of moving the fibers around the penetrator to allow
penetration to occur through fiber motion and friction. As illustrated in Figure
8, this motion requires space for fibers to move as well as some excess length offiber or extension of fiber.
Figure 8. Schematic Of Fiber Mobility Subject To Small Penetrator
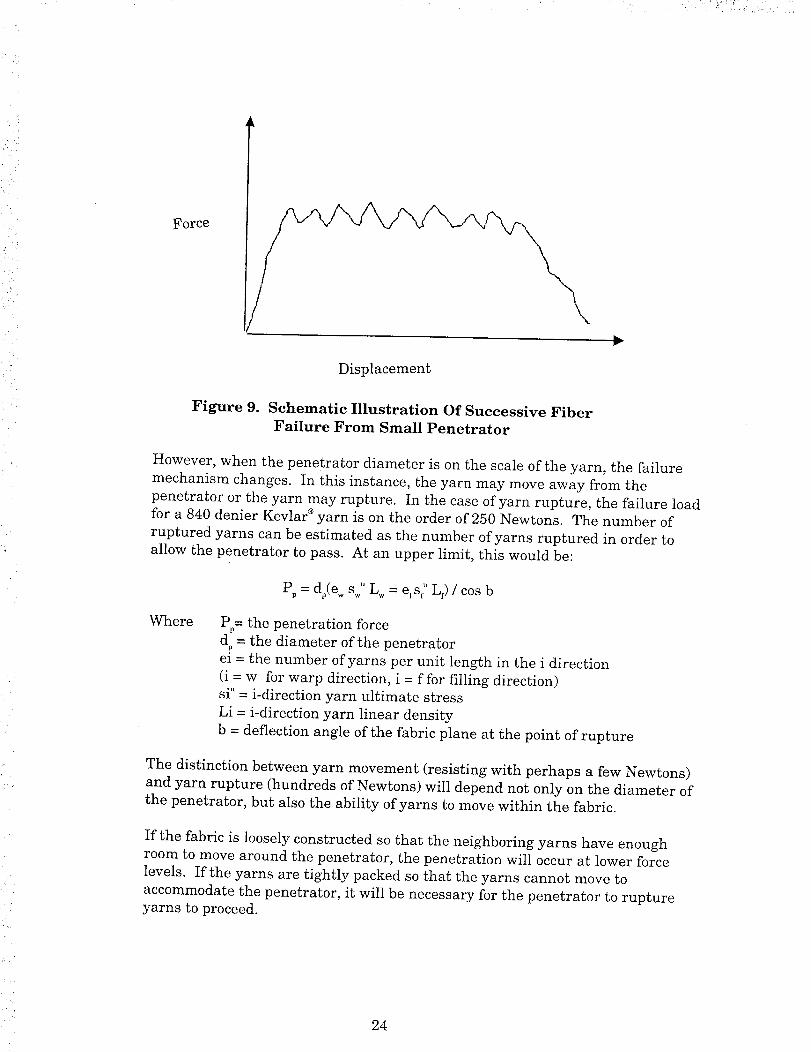
In the event that the penetrator is small compared to the yarn diameter, the
penetration resistance is quite low. There may be some fiber failure from
excessive strain, or from a compact yarn which does not allow much fiber failure.
The failure would then occur as successive fiber failures. In the event of single
fiber failure, the force required to cause failure depends on the particular fiber.
In the case of high performance materials, fiber strengths are typically on the
order of 50 cN. Even if several fibers break simultaneously, the maximum
resistant force would be at most a few Newtons. The force-displacement curve
would look like that shown in Figure 9.
23
" '.i̧ , _:_':_:i!i__.:.i:
lForce
h..
Displacement
Figure 9. Schematic Illustration Of Successive Fiber
Failure From Small Penetrator
However, when the penetrator diameter is on the scale of the yarn, the failure
mechanism changes. In this instance, the yarn may move away from the
penetrator or the yarn may rupture. In the case of yarn rupture, the failure load
for a 840 denier Kevlar ®yarn is on the order of 250 Newtons. The number of
ruptured yarns can be estimated as the number of yarns ruptured in order to
allow the penetrator to pass. At an upper limit, this would be:
u
Pp=dp(e wswuL =efsf Lf)/cosb
Where Pp= the penetration force
d = the diameter of the penetrator
ei = the number of yarns per unit length in the i direction
(i = w for warp direction, i = f for filling direction)si u = i-direction yarn ultimate stress
Li = i-direction yarn linear density
b = deflection angle of the fabric plane at the point of rupture
The distinction between yarn movement (resisting with perhaps a few Newtons)
and yarn rupture (hundreds of Newtons) will depend not only on the diameter ofthe penetrator, but also the ability of yarns to move within the fabric.
If the fabric is loosely constructed so that the neighboring yarns have enoughroom to move around the penetrator, the penetration will occur at lower force
levels. If the yarns are tightly packed so that the yarns cannot move to
accommodate the penetrator, it will be necessary for the penetrator to ruptureyarns to proceed.
24

5.2.2
Thus, to maximize the force required to cause penetration, it is useful to have a
very tightly woven fabric with high strength yarns.
However, it needs to be pointed out that in the event of a penetration the tightly
woven fabric will contain ruptured yarns which leave a permanent opening in
the fabric. The fabric which is penetrated more easily will not rupture yarns,
and the hole is more likely to close when the penetrator completes its path.
Tearing Mechanisms
Tearing is the sequential or spontaneous breaking of yarns in a fabric, either
singly or in small groups, along a line through the fabric. Typically the yarns
being broken are transverse to the principle load direction. Tearing can occur as
a result of a steadily increasing load or as an equivalent to crack propagation ina prestressed fabric.
Similar to the discussion on penetration, tearing is affected by the yarn's ability
to move within the fabric. When the yarns cannot move at all, the tear
propagates by sequential individual yarn failure. The tear strength can bepredicted as the strength of a single yarn.
If there is some yarn motion, one yarn may slide within the fabric until it meets
another, and the tear cannot propagate until two yarns are bunched together.
The tear strength doubles in this case. As shown in Figure 10, the mobility ofthe yarns within the fabric dictate the tear strength of the fabric
25

T
Force
Displacement
Figure 10. Schematic Illustration Of Tear Resistance For
Varying Degrees Of Yarn Mobility.
Gagliardi and Nussele developed to following relation for tear strength, whichwas later supported by Hager et al.:
T = m(_"_ _ + b
2
Where
T = fabric tear strength
u = fabric tensile strength (ravel strip)u = fabric strain to failure
m = slope fabric relating fabric toughness to tear resistance
b = constant depending on fabric construction
In further studies by Gagliardi and Gruntfest, fabrics were treated with
finishing resins which reduced yarn extensibility, increased yarn tensile
modulus, and had little effect on yarn strength. They found that this decreased
fiber capacity for energy absorption and also the ability of the yarns and fabricsto resist tearing.
26
5.2.3
5.2.4
From this it can be seen that for an uncoated fabric, the tear resistance of the
fabric increases with increasing yarn strength and yarn extensibility. This
further suggests that yarn twist should be applied in such a manner as to
increase the strength of the yarn. For a continuous multifilament yarn, zero
twist is optimum. For a staple yarn, twist should be applied to the optimumtwist level.
An exception to this design criteria is found for coated fabrics. In this case,
infiltration of coating material will increase tear strength, and subsequently it is
occasionally beneficial to twist multifilament yarns because the fabric is thicker,
so the amount of applied coating is greater.
The greater the yarn mobility, the greater the tear resistance because multipleyarns must be ruptured at the same time.
Considering the importance of yarn mobility, Teixira et al. looked at the
performance of fabrics with a variety of weave constructions. They found that
for fabrics made with the same warp and filling yarns, and same end and pick
counts, the tear resistance depended on weave structure in the following order:
1. 3-4 basket
2. 2-2 basket
3. 2/2 twill
4. 4 harness satin
5. plain weave
Cutting Mechanisms
The mechanism to cut combines both the puncture and tearing mechanisms.
The process variables occurring to resist this event are influenced by the
polymeric structural formation of high strength fibers, the diameter of the
cutting edge, the compressive moduli of the fiber/yarn, and very significantly,the amount of yarn movement allowed from the fabric's construction
parameters.
Fabric Design
Following the above design guidelines, fabric were chosen to have high strength,
good yarn mobility, but relatively stable weave structure. Plain weave fabrics
were formed to compromise good coverage and abrasion resistance with decenttear and cut resistance.
Kevlar ® and PEN ®yarns were used in the production of the fabrics. Hybrids
were also formed. Of the four fabric samples selected for evaluation in this
study, a summary of the construction variables are indicated in Table 6.
27
A
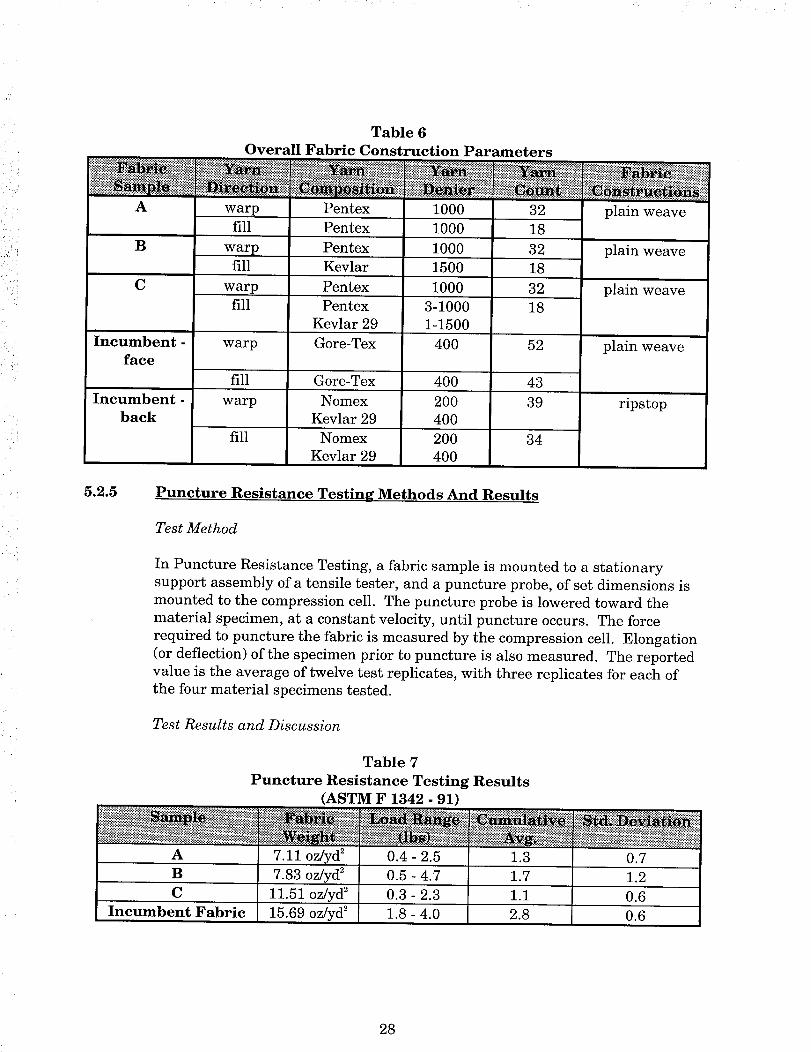
Table 6
Overall Fabric Construction Parameters
iii_%i %%%
warp Pentex 1000
:__-_::_:Ni:iii...._ _..-'__i-_ .....................i:ii_!_i_?:_:::.,27_i_?-'_i:_::::.:::::&:_:,:::_:::_%:i:i;_::iiii!iiiii1_ _ii_i_iii_iiiiNN_iiiiiii _iii!iiiN_Niiii
32 plain weavefill Pentex 1000 18
B warp Pentex 1000 32
fill Kevlar 1500 18
C warp Pentex 1000 32
fill Pentex 3-1000 18
Kevlar 29 1-1500
Incumbent - warp Gore-Tex 400 52face
fill Gore-Tex 400 43Incumbent -
backNomex
Kevlar 29
Nomex
Kevlar 29
200
400
200
400
39
34
warp
fill
plain weave
plain weave
plain weave
ripstop
5.2.5 Puncture Resistance Testing Methods And Results
Test Method
In Puncture Resistance Testing, a fabric sample is mounted to a stationary
support assembly of a tensile tester, and a puncture probe, of set dimensions is
mounted to the compression cell. The puncture probe is lowered toward the
material specimen, at a constant velocity, until puncture occurs. The force
required to puncture the fabric is measured by the compression cell. Elongation
(or deflection) of the specimen prior to puncture is also measured. The reported
value is the average of twelve test replicates, with three replicates for each ofthe four material specimens tested.
Test Results and Discussion
Table 7
Puncture Resistance Testing Results
(ASTM F 1342 - 91)
A 7.11 oz/yd _ 0.4 - 2.5
B 7.83 oz/yd _ 0.5 - 4.7
C 11.51 oz/yd _ 0.3 - 2.3
Incumbent Fabric 15.69 oz/yd _ 1.8 - 4.0
NN1.3 0.7
1.7 1.2
1.1 0.6
2.8 0.6
28
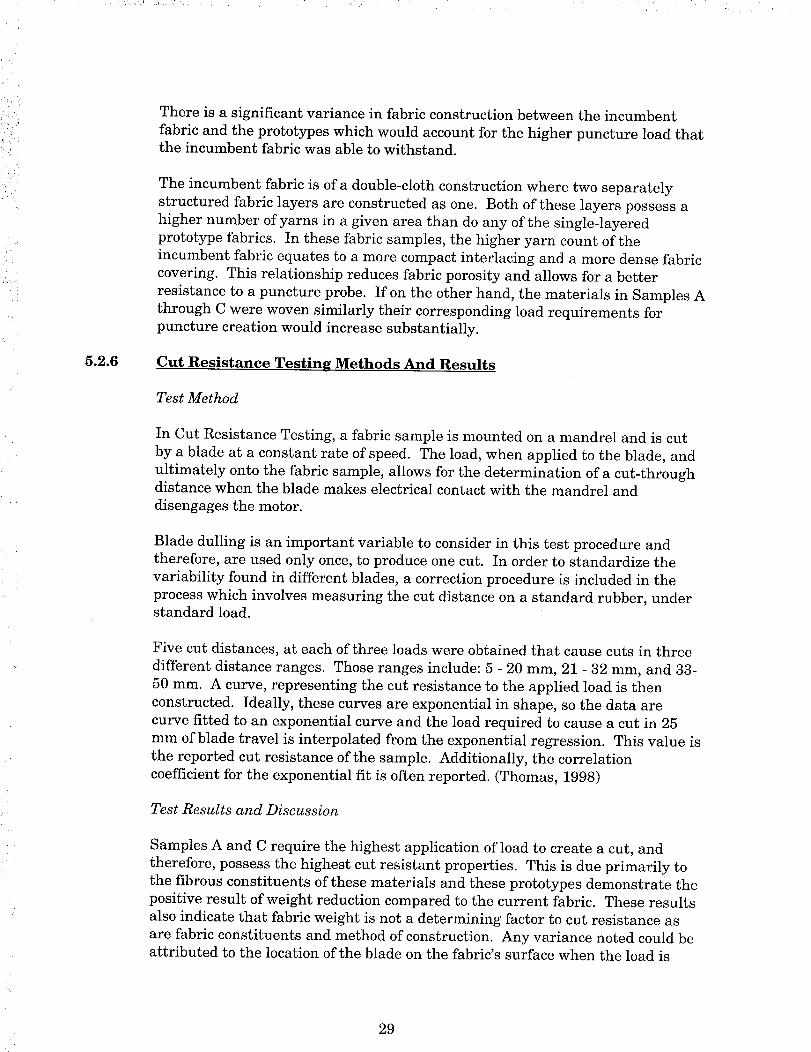
5.2.6
There is a significant variance in fabric construction between the incumbent
fabric and the prototypes which would account for the higher puncture load thatthe incumbent fabric was able to withstand.
The incumbent fabric is of a double-cloth construction where two separately
structured fabric layers are constructed as one. Both of these layers possess a
higher number of yarns in a given area than do any of the single-layered
prototype fabrics. In these fabric samples, the higher yarn count of the
incumbent fabric equates to a more compact interlacing and a more dense fabric
covering. This relationship reduces fabric porosity and allows for a better
resistance to a puncture probe. If on the other hand, the materials in Samples A
through C were woven similarly their corresponding load requirements for
puncture creation would increase substantially.
Cut Resistance Testing Methods And Results
Test Method
In Cut Resistance Testing, a fabric sample is mounted on a mandrel and is cut
by a blade at a constant rate of speed. The load, when applied to the blade, and
ultimately onto the fabric sample, allows for the determination of a cut-throughdistance when the blade makes electrical contact with the mandrel anddisengages the motor.
Blade dulling is an important variable to consider in this test procedure and
therefore, are used only once, to produce one cut. In order to standardize the
variability found in different blades, a correction procedure is included in the
process which involves measuring the cut distance on a standard rubber, understandard load.
Five cut distances, at each of three loads were obtained that cause cuts in three
different distance ranges. Those ranges include: 5 - 20 mm, 21 - 32 mm, and 33-
50 mm. A curve, representing the cut resistance to the applied load is then
constructed. Ideally, these curves are exponential in shape, so the data are
curve fitted to an exponential curve and the load required to cause a cut in 25
mm of blade travel is interpolated from the exponential regression. This value is
the reported cut resistance of the sample. Additionally, the correlation
coefficient for the exponential fit is often reported. (Thomas, 1998)
Test Results and Discussion
Samples A and C require the highest application of load to create a cut, and
therefore, possess the highest cut resistant properties. This is due primarily to
the fibrous constituents of these materials and these prototypes demonstrate the
positive result of weight reduction compared to the current fabric. These results
also indicate that fabric weight is not a determining factor to cut resistance as
are fabric constituents and method of construction. Any variance noted could be
attributed to the location of the blade on the fabric's surface when the load is
29

applied. Depending on the where on any given yarn the blade lands, the result
may show more or less a resistance to cutting. In the case of Sample B, there is
more Kevlar 29® per area than any of the other fabrics, and that may account
for the overall lower load required for cutting. This may be due to the
significantly lower compressive modulus that the Kevlar possess than that of thePEN.
Table 8
Cut Resistance Testing Results
(ASTM F 1790-97)
A 7.11 oz/yd _
B 7.83 oz/yd _
C 11.51 oz/yd _
Incumbent Fabric 15.69 oz/yd _
674.0 0.831
502.0 0.860
675.0 0.846
379.0 0.956
5.2.7 Cut And Puncture Recommendation s
An improved resistance to cut and puncture threats could be achieved in the
prototype fabrics through an optimized fabric construction. Areal density of the
fabric can be increased through the incorporation of a more tightly woven fabric.
Methods to achieve this end include, an increased degree of fiber/yarn packing,
adjustments in the yarn diameters used, and development of a multilayered
fabric with varying methods of interlacing which would promote different fabricperformance properties.
HYPERVELOCITY IMPACT
Background
There have been reports of occurrences where the integrity of the space suit was
threatened by cuts and/or punctures. Now, rapidly increasing levels of debris
found in the space environment are also threatening the level of protection thatthe space suit can provide. Probability models of space suit survival have
indicated that increased levels of protection against these threats will be
required from the space suit near the year 2000 (Hodgson, 1993). The EVA
hazards associated with MMOD impact is directly related to the ability of theimpacting particle to penetrate the space suit and create a leak. These
hypervelocity impacts have two defining characteristics. The first is that at the
moment of collision, the velocities of the colliding materials are greater than the
speed of sound and the energy released on impact is large compared to the heat
of vaporization. As a result, intense shock waves pass through the materials,
resulting in fragmentation and melting, (Whipple Effect). At sufficiently high
impacting velocities, some of the impacting material may be vaporized. In a
material composed of multiple layers and/or one which possesses sufficient
thickness, such as the SSA, further fragmentation and destruction can occur.
30
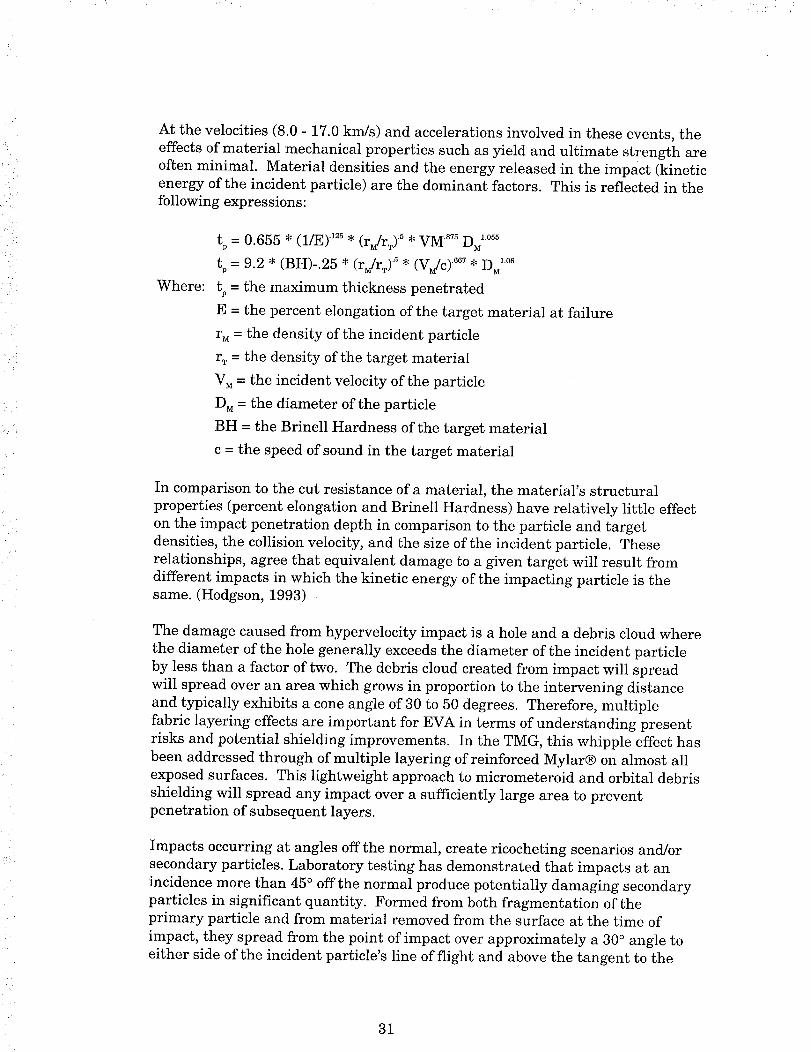
At the velocities (8.0- 17.0km/s) and accelerationsinvolved in theseevents, theeffectsof material mechanicalpropertiessuchasyield and ultimate strength areoften minimal. Material densitiesand the energyreleasedin the impact (kineticenergyof the incident particle) are the dominant factors. This is reflectedin thefollowing expressions:
Where:
tp= 0.655 * (l/E) "1_ * (rJrT) "_* VM "sT_D 1.055--M
tp = 9.2 * (BH)-.25 * (rJrT) 5 * (VJc) 667* D_ TM
tp = the maximum thickness penetrated
E = the percent elongation of the target material at failure
r M= the density of the incident particle
r_ = the density of the target material
V M= the incident velocity of the particle
D M= the diameter of the particle
BH = the Brinell Hardness of the target material
c = the speed of sound in the target material
In comparison to the cut resistance of a material, the material's structural
properties (percent elongation and Brinell Hardness) have relatively little effect
on the impact penetration depth in comparison to the particle and target
densities, the collision velocity, and the size of the incident particle. These
relationships, agree that equivalent damage to a given target will result from
different impacts in which the kinetic energy of the impacting particle is thesame. (Hodgson, 1993)
The damage caused from hypervelocity impact is a hole and a debris cloud where
the diameter of the hole generally exceeds the diameter of the incident particle
by less than a factor of two. The debris cloud created from impact will spread
will spread over an area which grows in proportion to the intervening distance
and typically exhibits a cone angle of 30 to 50 degrees. Therefore, multiple
fabric layering effects are important for EVA in terms of understanding present
risks and potential shielding improvements. In the TMG, this whipple effect has
been addressed through of multiple layering of reinforced Mylar® on almost allexposed surfaces. This lightweight approach to micrometeroid and orbital debris
shielding will spread any impact over a sufficiently large area to preventpenetration of subsequent layers.
Impacts occurring at angles off the normal, create ricocheting scenarios and/or
secondary particles. Laboratory testing has demonstrated that impacts at an
incidence more than 45 ° off the normal produce potentially damaging secondaryparticles in significant quantity. Formed from both fragmentation of the
primary particle and from material removed from the surface at the time of
impact, they spread from the point of impact over approximately a 30 ° angle to
either side of the incident particle's line of flight and above the tangent to the
31
_ : .... i !iii ._r_!'iiii i̧
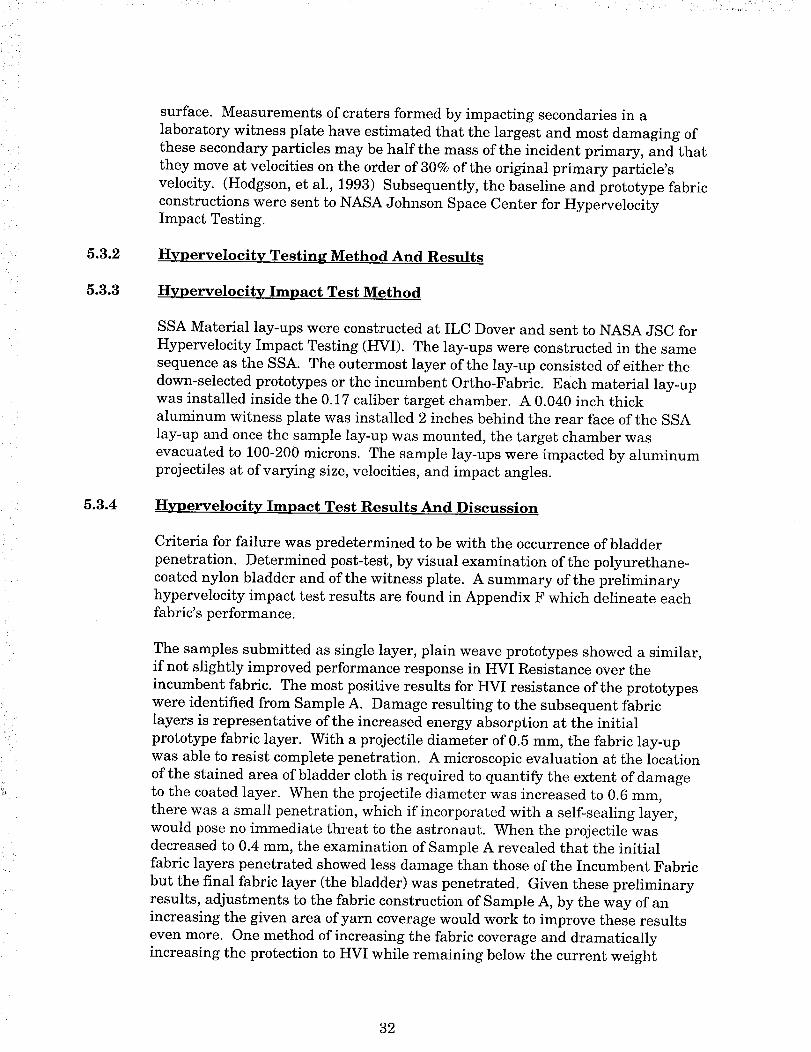
5.3.4
surface. Measurements of craters formed by impacting secondaries in a
laboratory witness plate have estimated that the largest and most damaging of
these secondary particles may be half the mass of the incident primary, and that
they move at velocities on the order of 30% of the original primary particle's
velocity. (Hodgson, et al., 1993) Subsequently, the baseline and prototype fabric
constructions were sent to NASA Johnson Space Center for HypervelocityImpact Testing.
Hypervelocity Testing Method And Results
Hypervelocity Impact Test Method
SSA Material lay-ups were constructed at ILC Dover and sent to NASA JSC for
Hypervelocity Impact Testing (HVI). The lay-ups were constructed in the same
sequence as the SSA. The outermost layer of the lay-up consisted of either the
down-selected prototypes or the incumbent Ortho-Fabric. Each material lay-up
was installed inside the 0.17 caliber target chamber. A 0.040 inch thickaluminum witness plate was installed 2 inches behind the rear face of the SSA
lay-up and once the sample lay-up was mounted, the target chamber was
evacuated to 100-200 microns. The sample lay-ups were impacted by aluminumprojectiles at of varying size, velocities, and impact angles.
Hypervelocity Impact Test Results And Discussion
Criteria for failure was predetermined to be with the occurrence of bladder
penetration. Determined post-test, by visual examination of the polyurethane-
coated nylon bladder and of the witness plate. A summary of the preliminaryhypervelocity impact test results are found in Appendix F which delineate each
fabric's performance.
The samples submitted as single layer, plain weave prototypes showed a similar,
if not slightly improved performance response in HVI Resistance over the
incumbent fabric. The most positive results for HVI resistance of the prototypes
were identified from Sample A. Damage resulting to the subsequent fabric
layers is representative of the increased energy absorption at the initial
prototype fabric layer. With a projectile diameter of 0.5 mm, the fabric lay-up
was able to resist complete penetration. A microscopic evaluation at the location
of the stained area of bladder cloth is required to quantify the extent of damage
to the coated layer. When the projectile diameter was increased to 0.6 mm,
there was a small penetration, which if incorporated with a self-sealing layer,
would pose no immediate threat to the astronaut. When the projectile was
decreased to 0.4 mm, the examination of Sample A revealed that the initial
fabric layers penetrated showed less damage than those of the Incumbent Fabric
but the final fabric layer (the bladder) was penetrated. Given these preliminary
results, adjustments to the fabric construction of Sample A, by the way of an
increasing the given area of yarn coverage would work to improve these results
even more. One method of increasing the fabric coverage and dramatically
increasing the protection to HVI while remaining below the current weight
32
5.3.5
requirement would be to reconstruct the PEN into a similar doubleclothconfiguration as is the current TMG.
Recommendations
In an attempt to optimize the HVI performance results, the fabric lay-ups were
rearranged allowing for two consecutive layers of Prototypes A and B. Thoughnot exact in its replication of the doublecloth construction found in the
incumbent fabric, it was hoped that additional impact resistance could be
attained. At the time of publication of this report, these results are still
pending. The results will be submitted as an Addendum to this report.
At the time of the publication of this report, two of the most promising 30 mil
self sealing Sylgard Q3-6636 samples were submitted for unpressurized
hypervelocity impact testing. They will be placed in a fabric lay-up and located
adjacent to the bladder cloth, facing outward. The two fabric lay-ups in whichthey will be included will have Prototype A and the incumbent Ortho-Fabric as
the outer most TMG layer. This testing will help determine if the self sealing
layer will improve resistance to MMOD impact, and a visual description and
quantification of the damaged incurred to the seal sealing testing will be
achieved post testing. These results will be submitted as an Addendum to thisreport.
33
6.0 CONCLUSIONS
Through this research effort, significant knowledge of materials and
technologies have been gained to state unequivocally that substantial
enhancements for to the SSA can be incorporated to improve the TMG cut and
puncture resistance, HVI resistance, and self-sealing mechanisms that the spacesuit now provides.
The increased frequency of EVA work that will be associated with the
construction and habitation of the Space Station, as well as that which will occur
with future lunar/mars missions necessitate that enhancements such as thisoccur.
An improved cut resistance can be built into the outermost layer of the TMG byusing the recently developed polymer, polyethylene napthalate. With
adjustments to this fabric's construction parameters, the puncture resistance
can also be improved substantially. The adjustments made to the fabric
construction, enhancing the cut and puncture resistance, will also result in an
improved resistance to the constant threat of hypervelocity impacts.
If the outer protective layers of the space suit are penetrated, a self-sealing layer
can be incorporated to seal puncture sites. A single layer of silicone gel, SylgardQ3-6636, performed the most consistently of all candidates examined.
34
7.0 RECOMMENDATIONS
In order to achieve the goals and objectives set forth in this effort, which were to
incorporate enhanced performance capabilities for the SSA, the following stepsare recommended for completion:
Self-Sealing Capabilities
Continue efforts to optimize self-sealing weight and thicknesscharacteristics.
Perform Hypervelocity Impact Testing on the self sealing material at theoptimized weight and thickness.
Evaluate the cold flow characteristics of the selected self-sealing material
through the range of temperatures to which it would be exposed.
Evaluate thermal degradation characteristics of the selected self-sealingmaterial.
Evaluate the manufacturing issues of a self-sealing layer which will impactdesign parameters.
Send the selected fabric to White Sands Testing Facility for Material
Control Testing for Flammability, Toxicity, Thermal Vacuum Stability, andOdor.
Cut, Puncture, and Hypervelocity Impact Resistance Characteristics
Isolate the most effective fabric construction parameters for the outermostlayer of the TMG.
Send the selected fabric to White Sands Testing Facility for Material
Control Testing for Flammability, Toxicity, Thermal Vacuum Stability, andOdor.
35

APPENDIX A
SELF-SEALING CONCEPTS SUBMITTED FOR EVALUATION
o_uo!_ S pue szi!lxo Z jo o_ziio D t_!qdiopt_I!qd
o.tO:lSt_d S.Ltq_)put_ oI)[u!jJt_cO oqS!OlA[
s_doauoa _UllUOS-jlO S
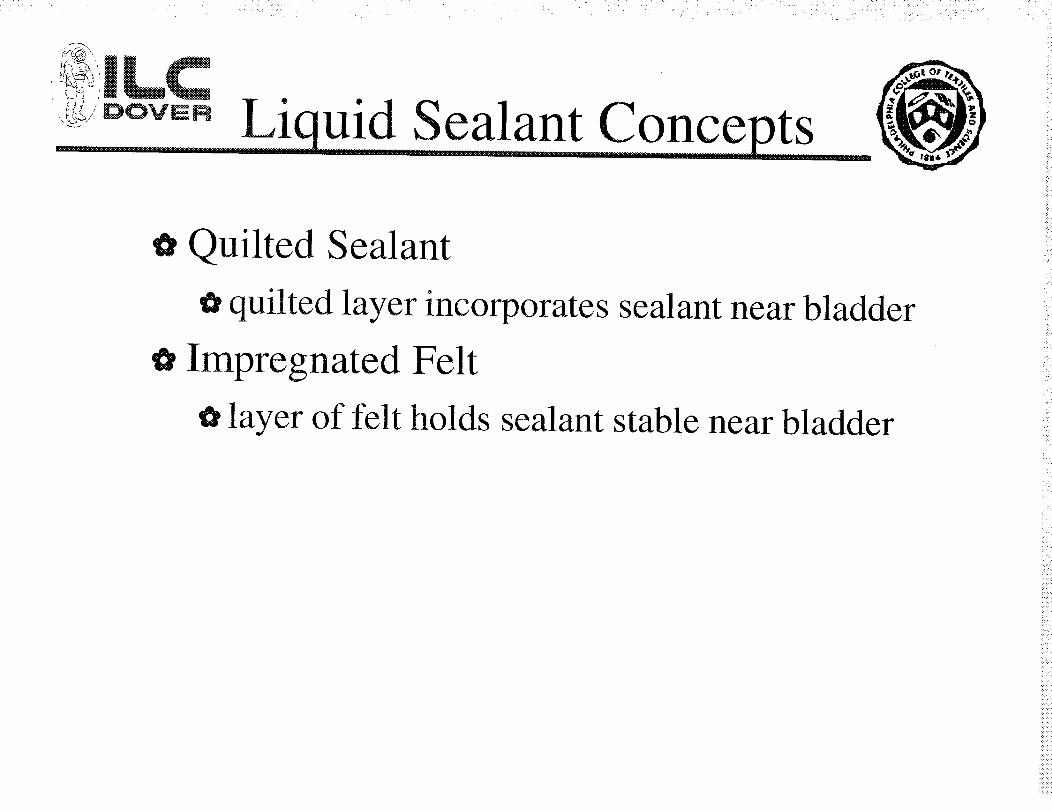
---- -- 1 tC pt_5_jD°vER L1 Ul ea an once s............................ " ............................................ M ....... ]']"
Quilted Sealant
o quilted layer incorporates sealant near bladder
Impregnated Felt
o layer of felt holds sealant stable near bladder
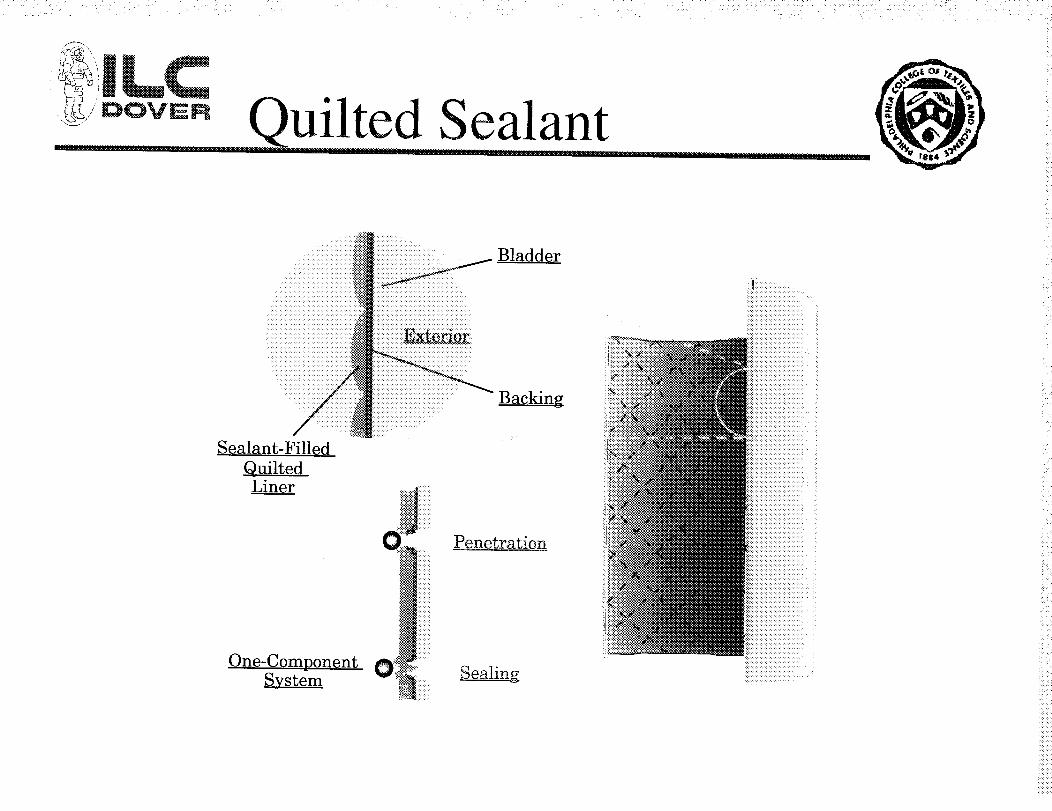
Quilted Sealant_;/DOVER
!il B,adderBacking
Sealant-Filled
QuiltedLiner
One-Component
System
O._II' " Penetration
i__liiiiiii!ii
il_ iiiiiiiiii
O_I_! iiii_ Sealing
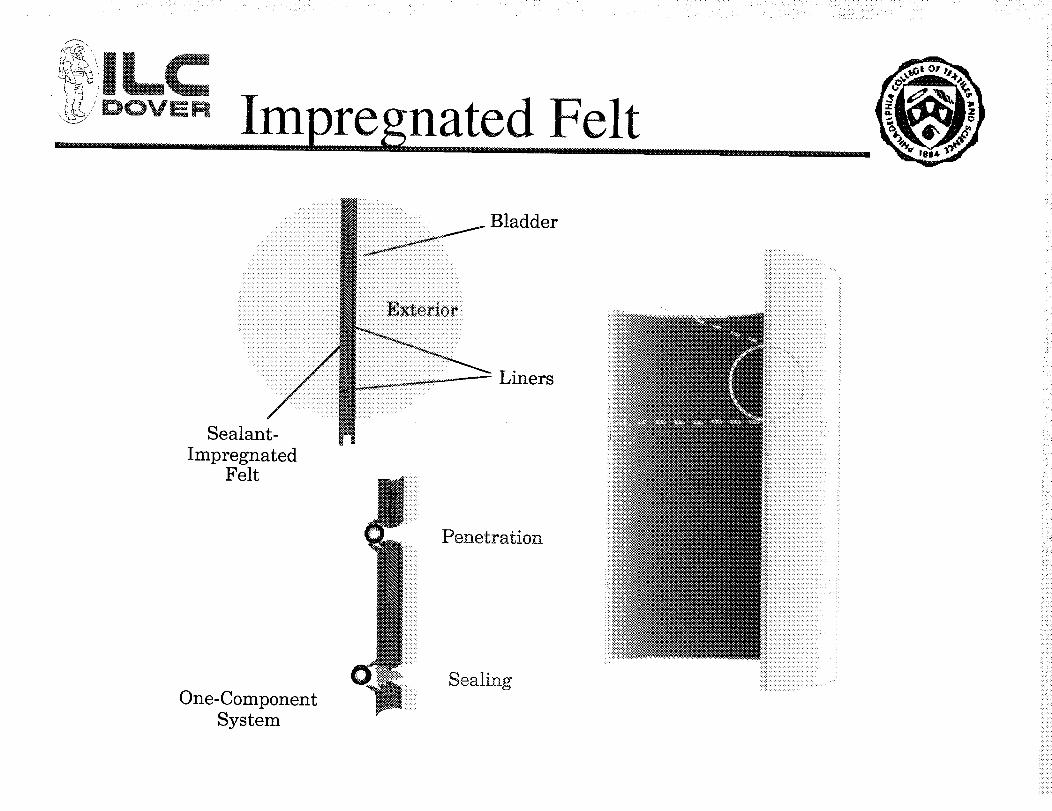
i_ ¸_,_
|LCDOVER Impregnated Felt
......... '................. '................. '........... '"'.... ".......................nMMMMMMrrMrr.... 11.... nMMMnrrrr.... 111.... MM
JSealant-
ImpregnatedFelt
One-Component
System
t_ Bladder
:itLiners
iPenetration
Sealing
i::::
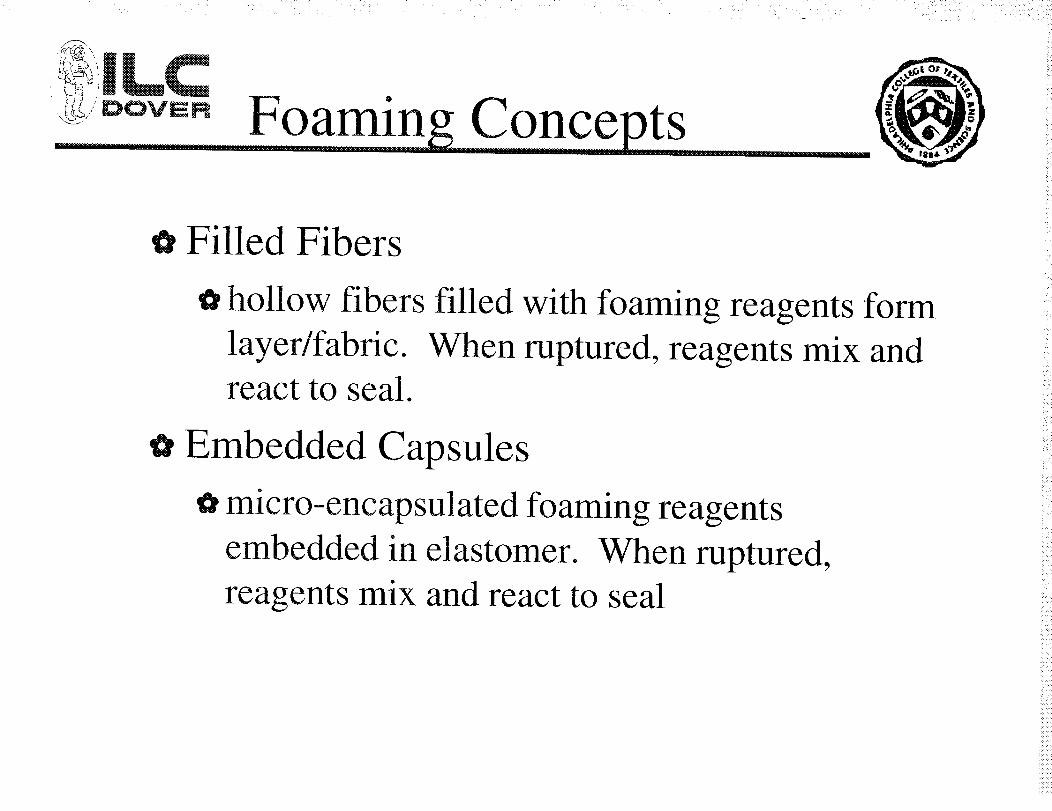
Foaming Concepts....... . .... _.......... ,., . .................................. o.............................
MMMMMMM........
Filled Fibers
o hollow fibers filled with
layer/fabric.
react to seal.
foaming reagents form
When ruptured, reagents mix and
o Embedded Capsules
o micro-encapsulated foaming reagents
embedded in elastomer. When ruptured,
reagents mix and react to seal
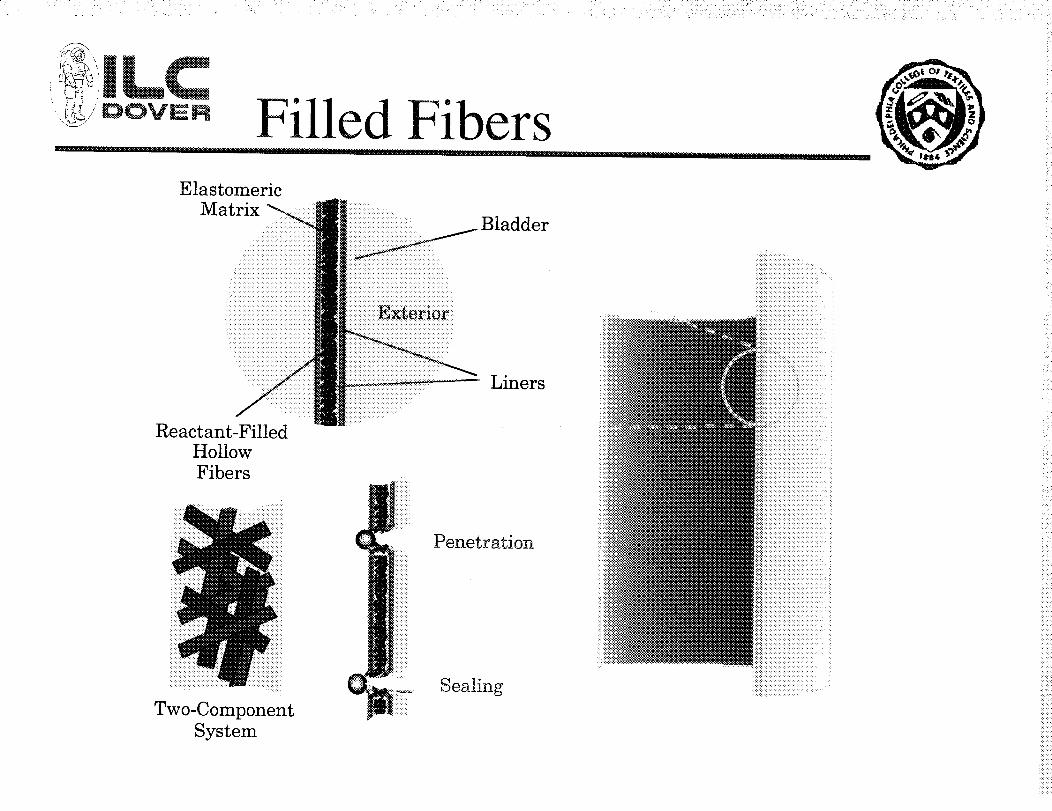
_i:¸¸¸::i :::i_: :_ ;:: • _:: i:;_ :!i_:i:: _i
_!/' DOVE R Filled FibersElastomeric
MatrixBladder
Liners
Reactant-FilledHollowFibers
Two-Component
System
Penetration
Sealing
MMMMMMMMr..........
..... .............
iiiii!iiiiiiiiiiiiiiiiiii!iii_i_i_i_i_i_i_i_i_i_ii....::::::_::_:::: • H
!!•:
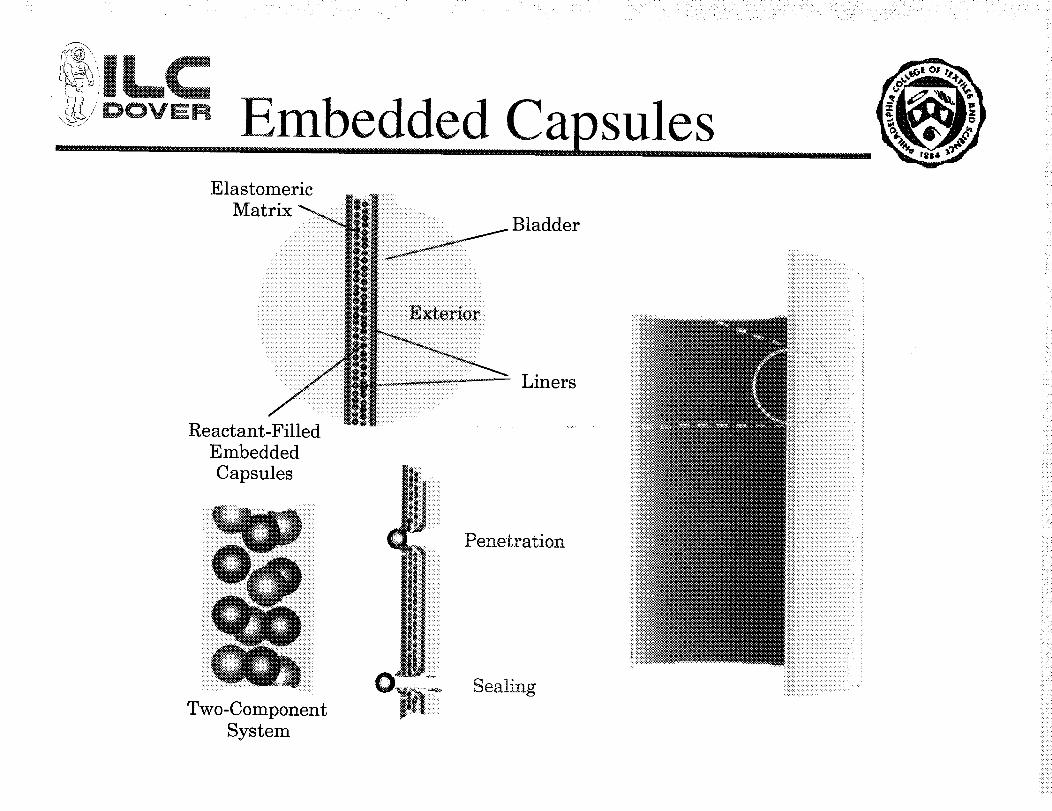
Reactant-Filled
Embedded
Capsules
ElastomericMatrix _.. _|i|
'_-_i|_ Bladder
j Lmers
H :;:!
Two-Component
System
• <ii
Penetration
Sealing

"o:m!aund
tI3no:_ql a!:_qej slind ,_OlLJ:W 'po:mldn:_ uoqA_
•_appelq qleauaq s! a!:_qej _(snolq pOZ_.S.IOA0 O
a!:Lqe_l,{snolfl o
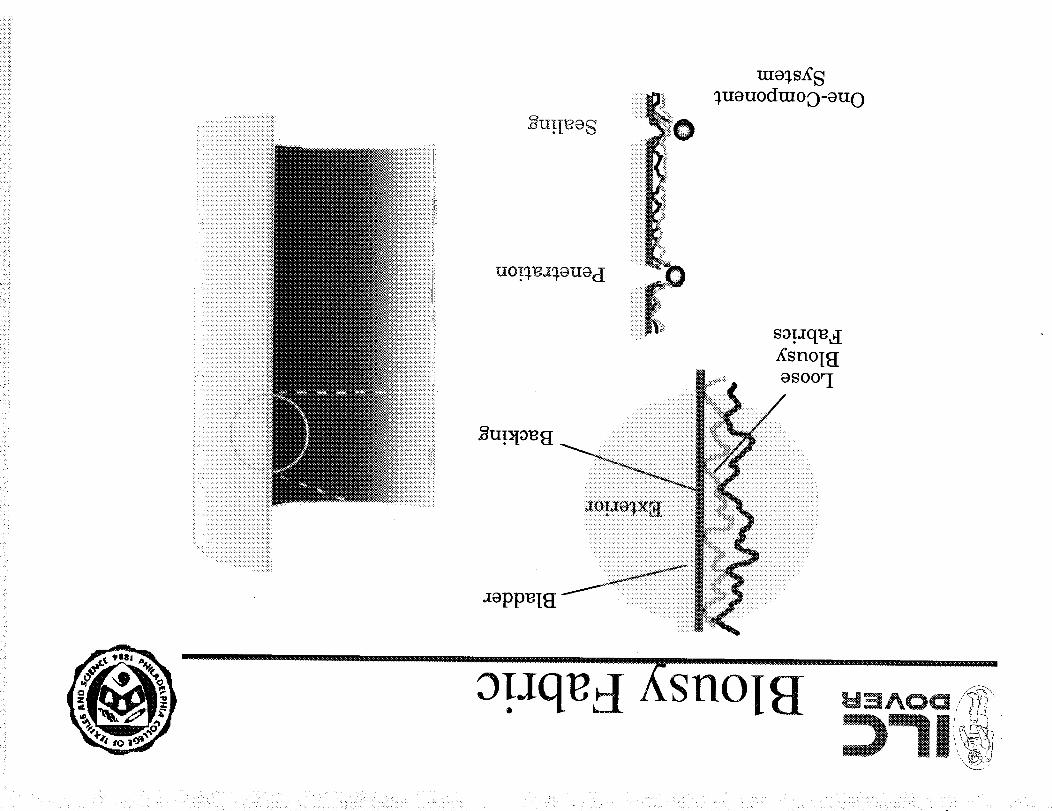
a_PP_I_[
_uouodtuoo_ouO
i:iiiii t]:
::::::
iiii:i_
iii:i:ii::::::
ililiiiiiiil
E°sa!aqeeI
XsnoI_
•_Jms!otu ol p_sodx_ u_q;.6 £1!SO_S!A
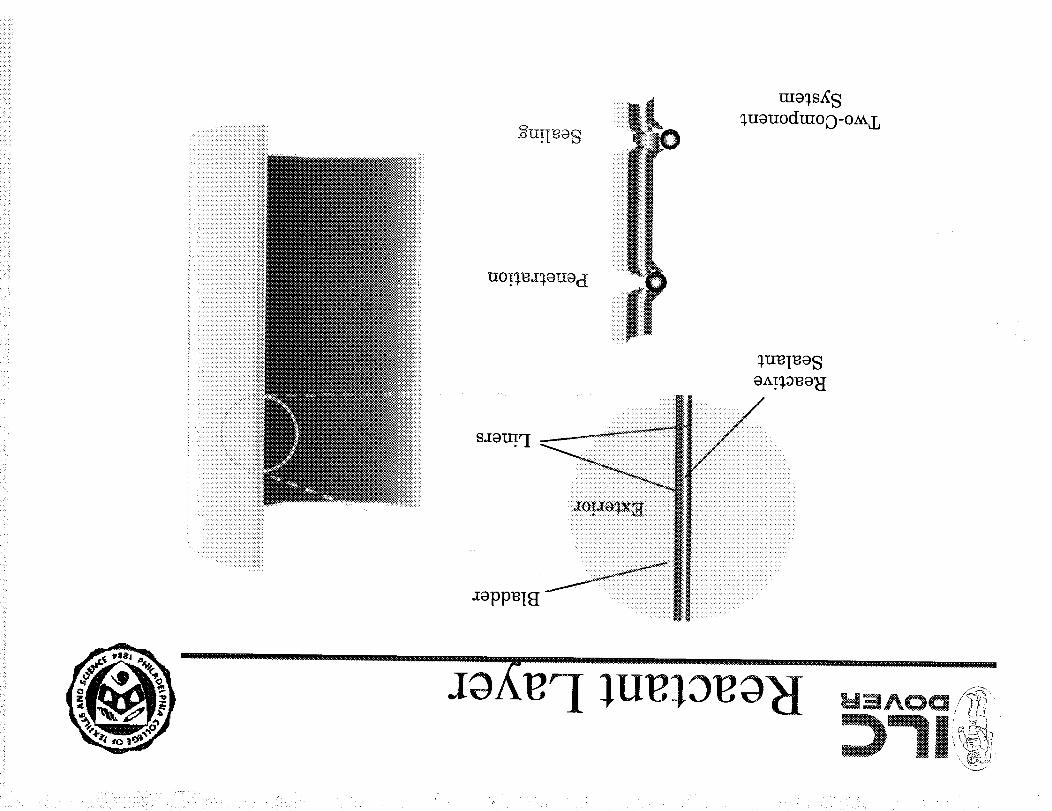
mo_s£ S
_)uouodmoo-o_,L
ii _i_i_i_G!iii_i_i!iiiiiiiiiiiiiiiiii!i
q '

APPENDIX B
LABORATORY ANALYSIS REPORT, SELF-SEALING PERFORMANCE TESTS

ILC Dover, Inc.Laboratory Analysis Report
Self-Sealing Performance Test
Test Method
Log No.Work Order No.MaterialProbe Used
Thickness (cm}WeightDate
1275-70001
8021-01
1275-17039
Baseline, Bladder
Puncture Probe
Sample Run
234
Weight ofSample
Specimen
(qm)4.744.674.73
4.71
iAverage
Initial
Pressure(Pa)29440.6
H,
29854.329992.2
29785.40.0289
See Table
May 12, 1998
CumiAvg
Average
Initial Flow
Rate (sccm)
22.4423.1723.6424.62
Sample Max. Load Min. Max. Flow Min. Flow Delta Flow Delta FIo_ Change ol Volume Los
Run (N) Pressure Rate Rate afte_ Rate Max. (-) Rate Min. (-I Time from in 180 sec
after (sccm) Puncture Min. (sccm) Initial(sccm) Max. tc After MaxPuncture (sccm) Min. Flow Flow Rak
(Pa) Rate (sec) Icm 3)
1 51.93 28302.91 2803i 973 1830.11 950.56 360.00 3802.89
2 55.42 28891.8i 1875 676 1198.90 652.83 300.00 2632.083 49.20 28936.6: 2625 1190 1435.43 1166.36 267.00 4399.424 49.45 28831.8 2302 1287 1015.20 1262.38 275.00 4752.65
_V_ i_iii i :2!181i 2_8!94
ILC Dover, Inc.One Moonwalker RoadFrederica, Delaware 19946-2080Telephone (302) 335-3911Fax (302) 335-0762
1-Sep-98Analyst Date
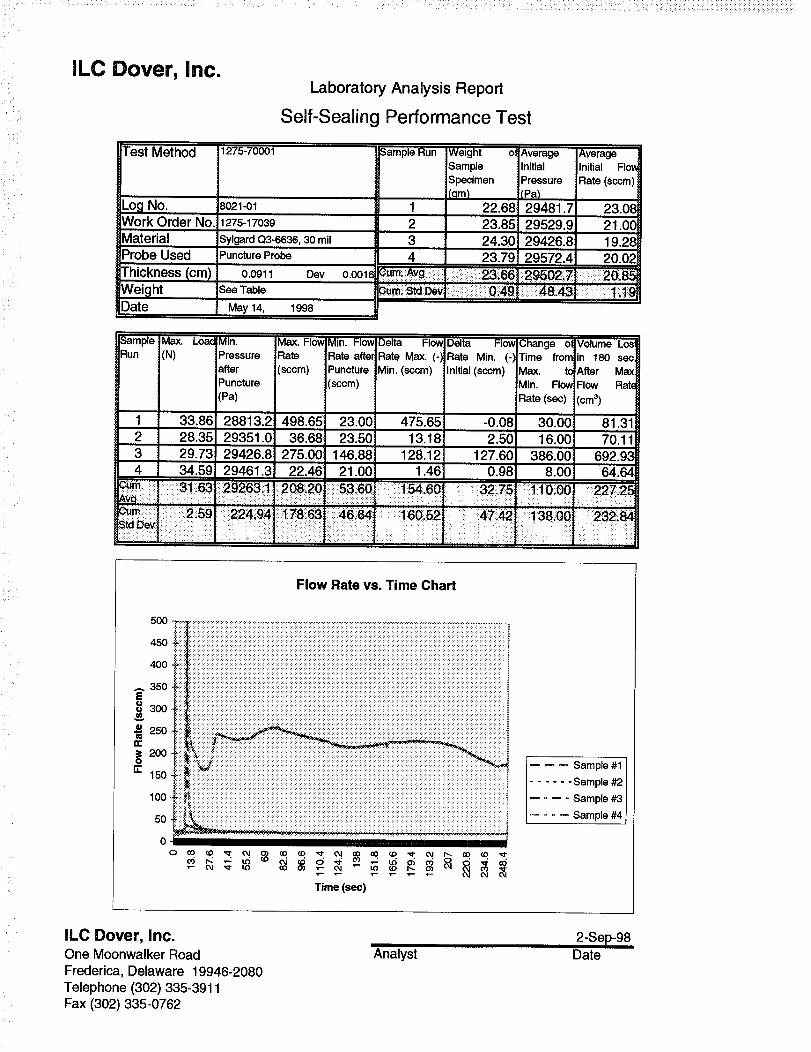
ILC Dover, Inc.Laboratory Analysis Report
Self-Sealing Performance Test
Test Method
Log No.Work Order No.iMaterialProbe Used
Thickness (cm)WeightDate
1275-70001
8021-01
Sample Run
11275-17o39 2 23.85Sylgard Q3-6638, 30 mil 3 24.30
=uncture Probe
Weight of_SampleSpecimen
(qm)22.68
4 23.79
0.0911 Dev 0.001__UmiiAvglii ! 23i_66
May 14, 1998
AverageInitial
Pressure
(Pa)29481.729529.929426,8
29572.4
AverageInitial Flov
Rate (sccm)
23,0821.0C19.2820.02
Sample Max. Lo_ Min. Max. Flow Min. Flow=Delta FIo_ Delta Flow Change of,Volume Lost
Run (N) Pressure Rate Rate after_Rate Max. (-_ Rate Min. (-) Time frorr in 180 sec.after (sccm) Puncture Min. (sccm) Initial (sccm) Max. t¢ After Maxl
Puncture (sccm) Min. FIo_ Flow Rats
(Pa) Rate (sec) (cms)
1 i 33.86 28813.2 498.65 23.00 475.65 -0.08: 30.00 81.31
2 28.35 29351.0 36.68 23.50 13.18 2.5()i 16.00 70.11_:3 29.73 29426.8 275.00_ 146,88 128.12 127.60i 386.00 692.93_4 34.59 29461.3 22.46 i 21.00 1.46 0.98 8.00 64.6¢
_m: i::_: :3_ii63::29263!1,2_::20 ii53i60 _: 1_i60Av_ I It i ........................... 32i75 "110i00 227 25_.......... × ....... =[ , . Hi H .......... HI
_160i52_ _:_4742 _;138i00l 232_
Flow Rate vs. Time Chart
ILC Dover, Inc,One Moonwalker RoadFrederica, Delaware 19946-2080Telephone (302) 335-3911Fax (302) 335-0762
2-Sep-98Analyst Date
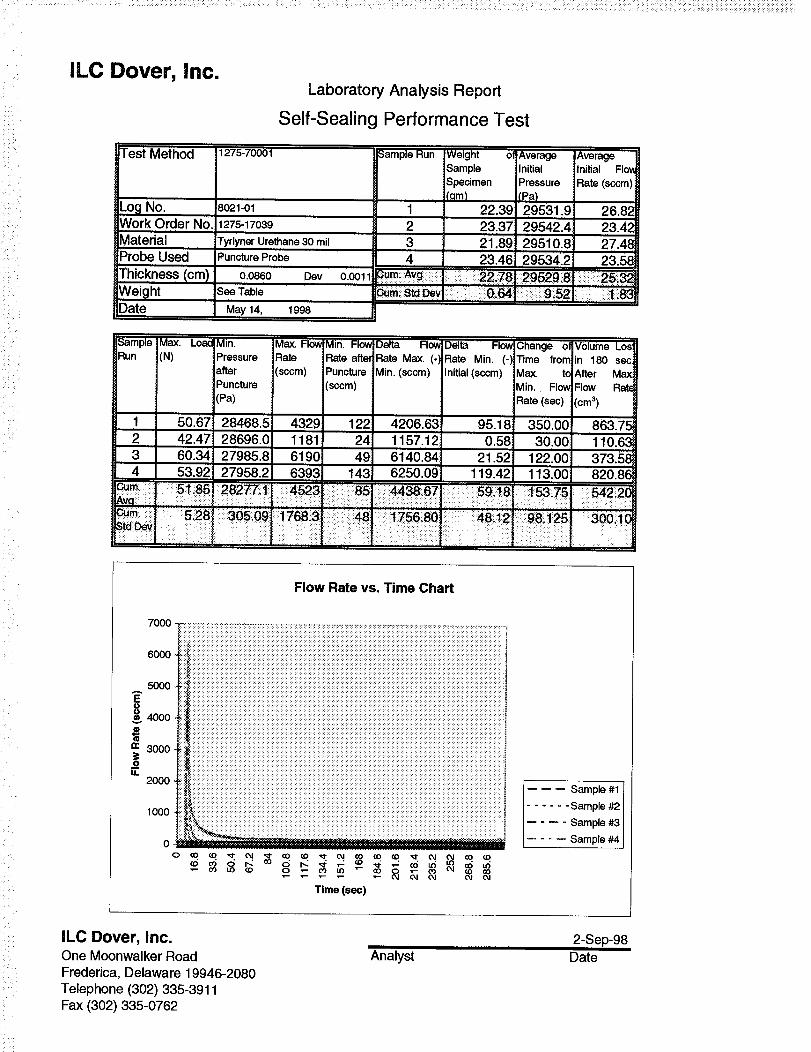
ILC Dover, Inc.Laboratory Analysis Report
Self-Sealing Performance Test
Test Method 1275-70001
Log No. 8021-01
Work Order No. 1275.17039Material Tyrlyner urethane 30 mil
Probe Used PunctureProbe
Thickness (cm) 0.0860 OevWe ight see TableDate May 14, 1998
0.001
_ample Run Weight of Average AverageSample Initial Initial Flow
Specimen Pressure Rate (sccm)(,qm) (Pa)
1 22.39 29531.9 26.8_2 23.37i 29542.4 23.42:
3 21.89 29510.8 27.484 23.46 29534.2 23.58
Sample Max. Loa¢ Min.
Run (N) PressureafterPuncture
{Pa)
1 50.67 28468.52 42.47 28696.03 60.34 27985.84 53.92 27958.2
Max. Flow Min. Flow DeltaRate
(sccm)
Flow Delta Flow Change of Volume Los:Rate afte_ Rate Max. (-_ Rate Min. (-) Time frorr in 180 secPuncture Min. (sccm) Initial (sccm) Max. t¢ After Max:(sccm) Min. FIo_ Flow RatG
Rate(sec) (cm3)
4329 122 4206.63 95.18i 350.00 863.751181 24 1157.12 0.58i 30.00 110,636190 49 6140.84 21.52 122.00 373.51_6393 !43 6250.09 119.42 113.00 820.8__
5 H_i:i85 28277il 4523 ::_:: 85 _4_67 : 59 18 :_;_75 5422C
StdDev
Flow Rate vs. Time Chart
l Sample #1
...... Sample #2
.... Sample #3
.... Sample #4
ILC Dover, Inc.One Moonwalker Road
Frederica, Delaware 19946-2080Telephone (302) 335-3911Fax (302) 335-0762
i
Analyst2-Sep-98
Date

ILC Dover, Inc.Laboratory Analysis Report
Self-Sealing Performance Test
Test Method
Log .No.Work Order No.MaterialProbe Used
1275-70001 Sample Run
8021-01 1,T
!275-17039
Conalhane EN-11, 30 mil
Puncture Probe
2
Weight ofSampleSpecimen
(qm)21,421.8
!AverageInitialPressure
(Pa)29514.3129566.8
AverageInitial FIo_
Rate (sccm)
23.8923.62
Thickness (cm)WeightDate
3 22.7 29528.2 23.065 21.9 29307,0 25.26
CUre Avg ..........::_:_:::::__::::::2:1::9 ': :.....
...... ,,,...... 86;o5j!
0.0_4 _v 0._17
See Table
May 14, 1998
Sample Max. Load Min.
Run (N) Pressureafter
Puncture
(Pa)
1 99.29i 28613.22 87.27 28613.23 85,37 28606.35 67.77 28337.5
Max. FIo_ Min. Flow Delta Flow Delta FIo_ Change ol Volume LosRate Rate after Rate Max. (-)Rate Min. (-1 Time from in 180 sec(sccm) Puncture Min. (sccm) Initial (sccm) Max. to After Max
(sccm) _lin. Flow Flow Rate
Rate (sec) (cm 3)
2422 488.00 1933,78 464.11 356.00 2054.191579 202.00 1377,10 178.38 210.00 773.32i 162 220.00 942.48 196.94 11.00 711.491743 86.00 1656.86 60.74 312.00 444.79
84i93 2_42i6 il _727 2_9 ; I47_!58 2i25i_ 2_i25 "995!95_va :.i!:::: | iili_m, ::i:/:8i58 !02i56 317174 :_! 529 i2
: • ...... ................ . ........: tdDev
Flow Rate vs. Time Chart
2500
2000
_, 1500¢,,)
1000
"o." 500
0
-500
Time (sec)
-- -- -- Sample #1
...... Sample #2
..... Sample #3
..... Sample #5
ILC Dover, Inc.One Moonwalker RoadFrederica, Delaware 19946-2080Telephone (302) 335-3911Fax (302) 335-0762
Analyst3-Sep-98Date
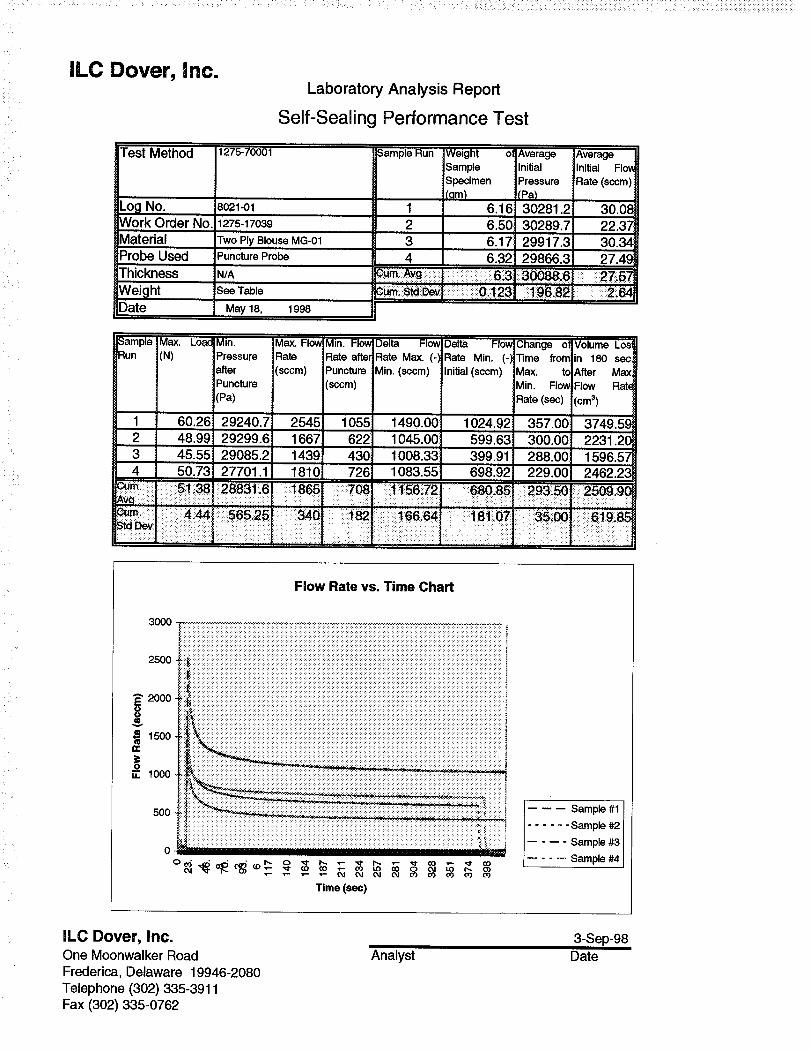
: _:: ................. ...... _ _::_ ::: ::_i :_ _:: :_:___ _i__:_ :: _ ::i¸: _:::_::_;_i::!i̧l;:;:_:i:i_i:_i:i_::_:_:!i_:_ii::i!:_!i:i!_ii:_ii_i_i!_ii:i_ii:i_!_i_!i:_i_!:_:_;_:_!:::I_I!I:!_:i:_i:_i_::_i_:_::_!i!_i:_!::!i_:i_!_i_iiiiiii_iiiii_i_:_iii_iii_iiiiiiiii_iiiii_iiiiii_
ILC Dover, Inc.Laboratory Analysis Report
Self-Sealing Performance Test
Test Method
Log No.
Work Order No.MaterialProbe UsedThickness
WeightDate
1275-70001
8021-01
1275-17039
Two Ply Blouse,MG-01Puncture Probe
N/A
See Table
May 18, 1998
Sample Run
34
Weight off
SampleSpecimenIqm)
6.1'6
6.506.176.32
AverageInitialPressure
(Pa)30281.2
30289.7299! 7.3
29866.,330088i6
=umi !;ili;i;;i; iil2si; 98182
AverageInitial FIo_
Rate (sccm)
30.0822.3730.3427.49
'i:::':2:7ii57
_ampleRun
1234
" I
Max. Loa¢ Min. Max. Flov Min. FlowI Delta Flow1(N) Pressure Rate Rate after,,'Rate Max. (-',
after (sccm) !Puncture Min. (sccm)
Puncture (sccm)!(Pa)
Delta Flow Change o! Volume Los1Rate Min. (-)Time from in 180 sec,Initial (sccm) Max. tc After Ma_
Min. Flov Flow Rate
Rate (sec) (cms)
60.26 29240.7 2545 1055 1490.0048.99 29299.6 1667 622 1045.00
45,55 29085.2 1439 430 1008.33 399.91 288.00 1596.5750.73 27701.1 1810 726 1083.55 698.92 229.00 2462.23
1024.92! 357.00 3749.59599.63 300.00 2231,2_
J
5_ii38 _2883_ i6 ii::865', 7_ 1156i72 :293i50:: ......::::::::::::::i::
::_:iii565i25 3_0 :: 182°: _:66i_ _8ii07" _i001::::::i::::619i85::::::::::::::::
Flow Rate vs. Time Chart
_'2000OO
1500
1000
500
0
Time (sec)
I Sample #1
I...... Sample #2
:"::::: I .... Sample #3l .... Sample #4
I'_ O')oO 03
ILC Dover, Inc.One Moonwalker RoadFrederica, Delaware 19946-2080Telephone (302) 335-3911Fax (302) 335-0762
Analyst3-Sep-98
Date
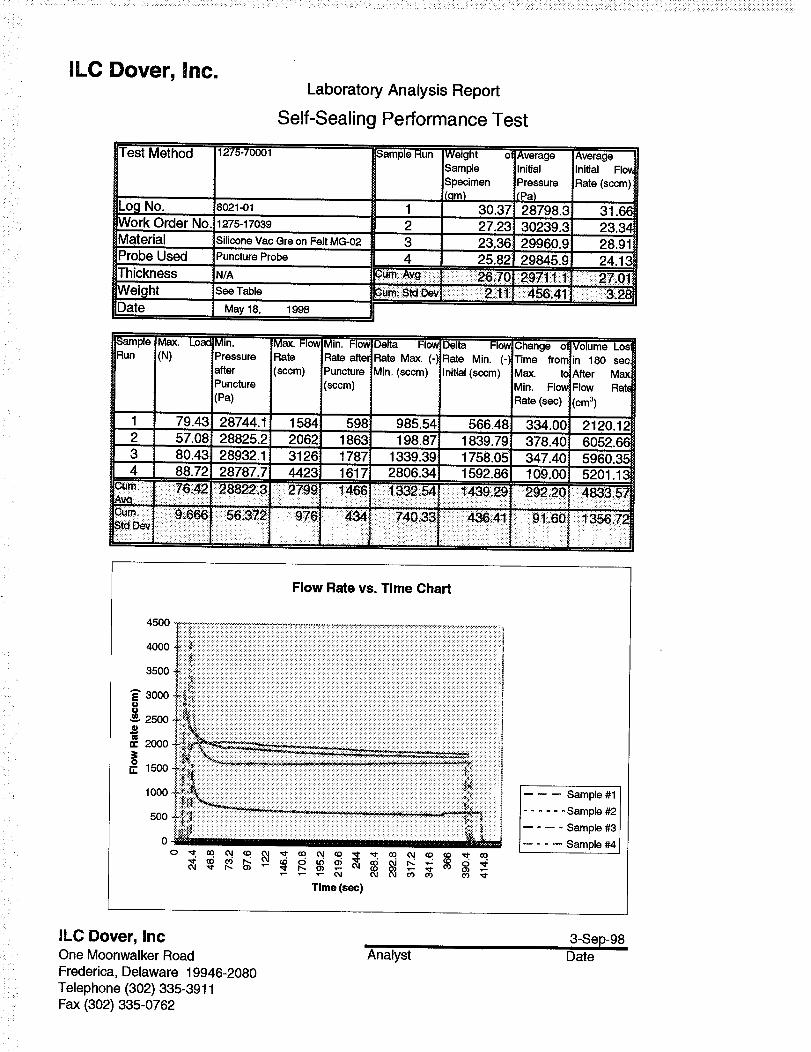
ILC Dover, Inc.
Test Method
Log No.
Work Order No.
Material
Probe Used
Thickness
WeightDate
Laboratory Analysis Report
Self-Sealing Performance Test
1275-70001
8021-01
1275-17039
Silicone Vac Gre on Felt MGI02
PunctureProbe
N/A
See Table
May 18, 1998
Sample Run Weight el Average Average
Sample Initial Initial FIo_
Specimen Pressure Rate (sccm)
(qm) (Pa)1 30.37 28798.3 31.66
2 27.23 30239.3 23.34
3 23,36 29960.9 28.91
4 25.82 29845.9 24.13
cumi Avg: ii_J _ 26_ 0_
Sample Max. LoadMin.Run (N) Pressure
afterPuncture
(Pa)
1 79.43 28744.1
2 57.08 28825.2
3 80.43 28932.1
Max. Flov Min. FlowlDelta
Rate
(sccm)
1584
2062
3126
Flow Delta Flow Change o! Volume Los
Rate afterRate Max. (-) Rate Min. (-) Time from in 180 secPuncture Min. (sccm) Initial(sccm) Max. to After Mm(sccm) Min. FlowFlow Rat(
Rate(sec) (cm3)
598:: 985.54 566.48 334.00i 2120.12
1863 198.871 1839.79: 378.40i 6052.6(_
1787 1339.39 1758.05 347.40 5960.354 88.72 28787.7 4423 1617 2806.34 1592.86 109.00 5201.13
_m.' _6i_2!28822i3 2799 :I_ ii:_2i_ _439!29 i 292i201 4_i5__m_
0i33" " 9 i60sa:_V
Flow Rate vs, Time Chart
__ _dm_ ......
Time(s_)
Sample_,_I ...... Sample
I .... Sample##:rI .... Sample
ILC Dover, IncOne Moonwalker Road
Frederica, Delaware 19946-2080
Telephone (302) 335-3911
Fax (302) 335-0762
Analyst
3-Sep-98Date

ILC Dover, inc.Laboratory Analysis Report
Self-Sealing Performance Test
Test Method
Log No.Work Order NoMaterial
Probe Used
Thickness
WeightDate
1275-70001
8021-01
1275-17039
Tyrlyner Isocynate on Felt MG-03
Puncture Probe
N/A
See Table
May 18, 1998
Sample Run
2
3
4
Weight ol
Sample
Specimen
(qm)
24.5
29.0
35.4
32.5
3um:;iAVgl;i;!ii!i!;i!iiiii!iiiiiiiiiiiiiiiiiliiiiii30ii3:::::::;:::::::::n::::;::..,:;::::::;:::
Average
Initial
Pressure
lea)
29920,1 !
30113.7:
29975.6
29761.2
29942i7
Average
Initial FIo_
Rate (sccm)
26.24
20.28
29.04
24.21
Sample!Max. Load Min.
Run (N) Pressure
after
Puncture
(Pa)
1 90.96 28906.8::2 88.601 29117.6::
3 64.00 29302.04 65.84 29022.3
Max. Flow Min. Flow Delta
Rate
(sccm)
Flow Delta Flow Change ol Volume Los
Rate aftel Rate Max. (-) Rate Min. (-] Time from in 180 sec
Puncture Min. (sccm) Initial (sccm) Max. to After Max
(sccm) Min. Flow Flow Rat_
Rate (sec) [cm 3)
2197 130 2067.43 103.33 212.20 677.25
1350 581 768.79 560.84 8.00' 2391,371265 75 1189.64 46.32 98.60 315.66
1662 82 1580.38 57.41 79.80 401.07
77:35 29087i2 t618 2_7 _:40_ 56 _19t98 : :99!65 9__va : ii l ::: i ! :::::__m. _2 ..........'............ ' ...................................... ' ...........i4-3!: _122i622 1:_:43 : 56i28i: 722152
................. ,,, ...... i]] :]il .............................................................:......... i ;: :: .................. i .......
Flow Rate vs. Time Chart
Samplei ...... Sample
i .... Sample #3Ji .... Samp e #4
-500
Time (sec)
ILC Dover, Inc.One Moonwalker Road
Frederica, Delaware 19946-2080
Telephone (302) 335-3911
Fax (302) 335-0762
Analyst
4-Sep-98
Date

ILC Dover, Inc.Laboratory Analysis Report
Self-Sealing Performance Test
Test Method
Log No.Work Order No.Mater alProbeUsed
Thickness
Weight (_lmIDate
1275-70001
8021-01
1275-17039
Conathaneon Felt,MG-04PunctureProbe
N/A
SeeTable
May 26, 1998
SampleRun
1234
Weight olSampleSpecimen(qm)
27.98
31.86
35.99
36.25
Average AverageInitial ntia FIo_Pressure Rate (sccm)(Pa}30313.4 27.0(_
29938. 9 19.7429983.9: 29.27
29746.6i 26.63
3urnA_g :: ::_:02 .... ' 6.......- .......,,, llr /ii:..;.., : 29995.7 ::i ::25,6:;umiiS_:_! :_:_.:..;:i:i::i:3:,10_;::::158:86 .... 2:96
Sample!Max. Load Min. Max. FlowMin. Flow Delta Flow Delta FlowChange ol Volume LosRun (N) Pressure Rate Rate after Rate Max. (-) Rate Min. (-I Time from in 180 sec
after (sccm) Puncture Min. (sccm) Initial(sccm) Max. to After MaxPuncture (sccm) Min. Flow Flow Rat(
(Pa) Rate (sec) (cm3)
1 135.27 29436.1i 738 49 688.21 22.48 275.00 268.692 189.87i 29492.3i 129 33 95.55 13.63 143.00 126.89
3 78.26 28861.5' 4225 539 3685.49 510.17 47.20 1970.854 79.69 28701.7 4481 396 4084.91 369.53 95.20 2024.51
3urn',' ' _120.77 29122:9 _:2393 255 _:_:213854 "; [[r 22895 140_10 : 1097 73_va ,;:_ I.!::::_;:::,::i:: ...:.:.i :::::::::::::::::::::::i:::i_::_l_-ii:i : _ :::_ _::i_:: ! :_ i !;;::
_m. ::_;:::::41.800' 3_1,308" :_i_960 iiiii;i:;:i!i;12!3ii::_i_:;117_6i66" 210i90_';: 768.90i 89Y;95
Flow Rate vs. Time Chart
ILC Dover, Inc.One Moonwalker RoadFrederica, Delaware 19946-2080Telephon (302) 335-3911
Fax (302) 335-0762
4-Sep-98Analyst Date
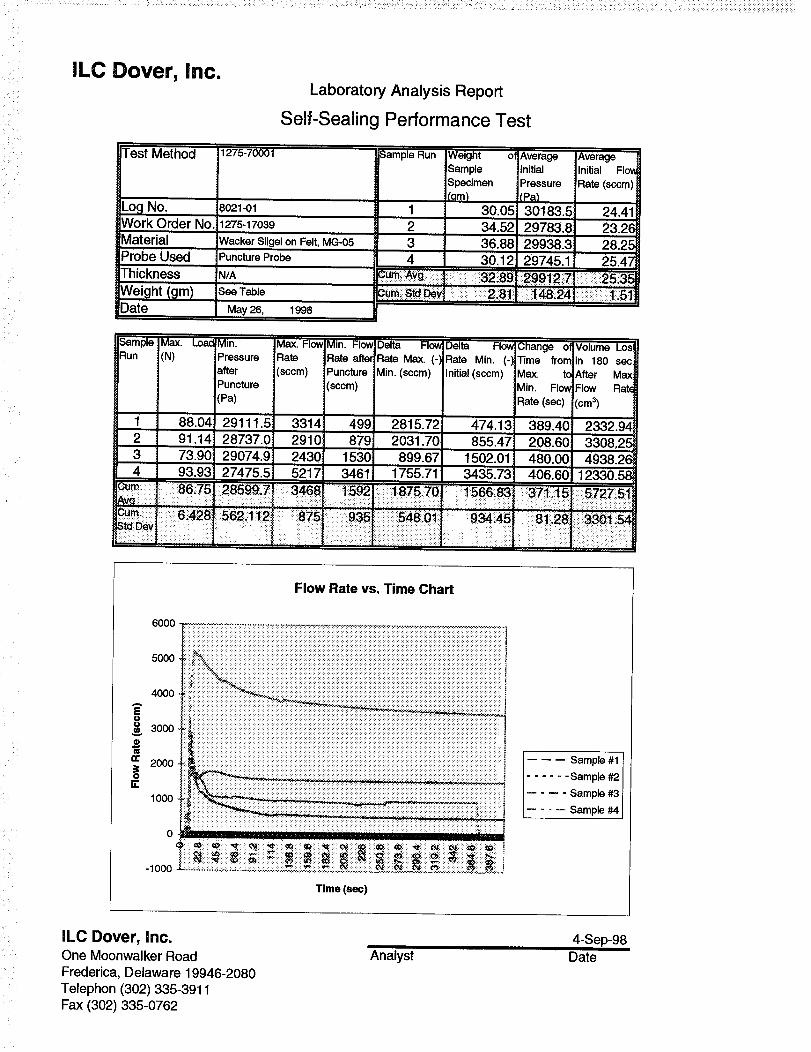
ILC Dover, Inc.Laboratory Analysis Report
Self-Sealing Performance Test
Test Method 1275-70001 Sample Run
Log No. 8021-01 1Work Order No. 1275-17039 2Material Wacker Si!gel on Felt, MG-05 3Probe Used Puncture Probe 4Thickness N/A
Weight (gm) See Table
Date May 26, 1998
Weight ol Average _Average!Sample Initial Initial FIo_
Specimen Pressure Rate (sccm){qm) [Pa)
30.05 30183.5 i 24.4134.52 29783.8 23.2636.88 29938.3 28.2530.12 29745.1 25.47
_umii_Yg iiiiI ii 'i 32_89_ 299_2i_ i 25:.3__i::sia_f, ii ::::2i8ili _8i2_ i::iiii_i_l_iiSlI
Sample Max. Load Min.
Run (N) PressureafterPuncture
(Pa)
1 88.04 29111.52 91.14 28737.0i3 73.90 29074.94 93.93 27475.5
Max. FIo_ Min. Flow Delta Flow Delta Flov Change olRate Rate after Rate Max. (-) Rate Min. (-] Time from
(sccm) Puncture Min. (sccm) Initial (sccm) Max. to(sccm) Min. Flow
Rate (sec)
3314 499 2815,72 474.13 389140'2910 879 2031.70i 855.47 208.602430 1530:: 899.67 1502.015217 3461 1755.71 3435.73
8675 28599i? 3468 Er :::i::592!187570 _' _5_i83Av_ !::i : iiii:.::ii i:i • i iii::i
_m I 6!428 _:875_ 9_' i5_8i0_ ":_: 9_i45
!Volume Los
in 180 secAfter MaxFlow Rat_
(cm5
2332.943308,25
480.00 4938.26406.60 12330.58
37_iI:5 5_27i5_
6000
5000
4OOO
E
3000.
2000mI,I.
1000
-1000
Flow Rate vs. Time Chart
Time (sec)
J Sample #1
...... Sample #2
.... Sample #3 I
.... Sample #4J
ILC Dover, Inc.One Moonwalker RoadFrederica, Delaware 19946-2080Telephon (302) 335-3911Fax (302) 335-0762
Analyst4-Sep-98
Date
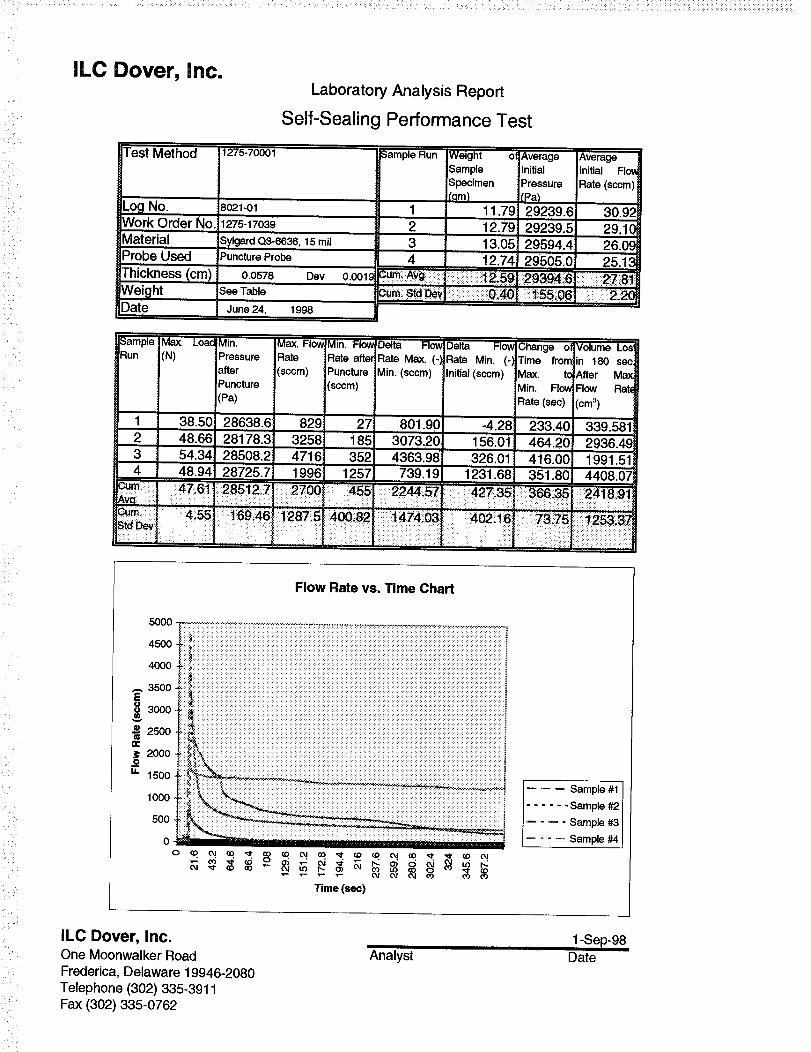
ILC Dover, Inc.
Test Method
Log No.Work Order No.
;Material
Probe Used
Thickness (cm)WeightDate
Laboratory Analysis Report
Self-Sealing Performance Test
1275-70001
8021-01
1275-17039
Sylgard Q3-6636,15 mil
Puncture Probe
0.0578 Dev 0.001
See Table
June 24, 1998
3ample Run Weight otSampleSpecimen
Iqm)1 1.79
1 2.791
3
AverageInitialPressure
(Pa)29239.629239.5
13.05 29594.4
AverageInitial Flow
Rate (sccm) i
30.9229.1C26.09
4 12.74 29505.0 25.13
_umi Avg ::Z_i_iiiii_i:_:_::_i2i59J2939_i6tii 27_8t:
rr -
SampleRun
1234
AV_
Max. Load Min.(N) Pressure
afterPuncture
(Pa)
38.50 28638.648.66: 28178.3i54.34 28508.2i48194 28725.7
Max. Flow Min. FlowRate Rate aftel
{sccm) Puncture
(sccm)
Delta FIo_ Delta Flowl
Rate Max. (-} Rate Min. (-)_Min. (sccm)
829' 27 801.90
32,58 185 3073.204716 352 4363.98i1996 1257 739.19
Initial (sccm)
-4.28156.01326.01
1231.68
Change olTime from
Max. toMin. Flow
Rate (sec)
233.40464.26416.001351.80
Volume Los
in 180 secAfter MaxFlow Rat<
(cm _)
339.5812936.491991.514408.07
28512;7 2700_ 455 ':22_57 36635] 2418i9_, : i ii i::l_ i
/ !69_46]:!28_ 5_ 400i82 i_74!03" 402i16 731_5 :12_i37'
Flow Rate vs. Time Chart
5000
4500
4000 _::_
_3500,Eg 3000
25_
2000
E 1500
1000
500
0-
Time _)
Sample #1
...... Sample #2
I .... Sample #3
.... Sampe #4
ILC Dover, Inc.One Moonwalker RoadFrederica, Delaware 19946-2080Telephone (302) 335-3911Fax (302) 335-0762
Analyst1-Sep-98
Date
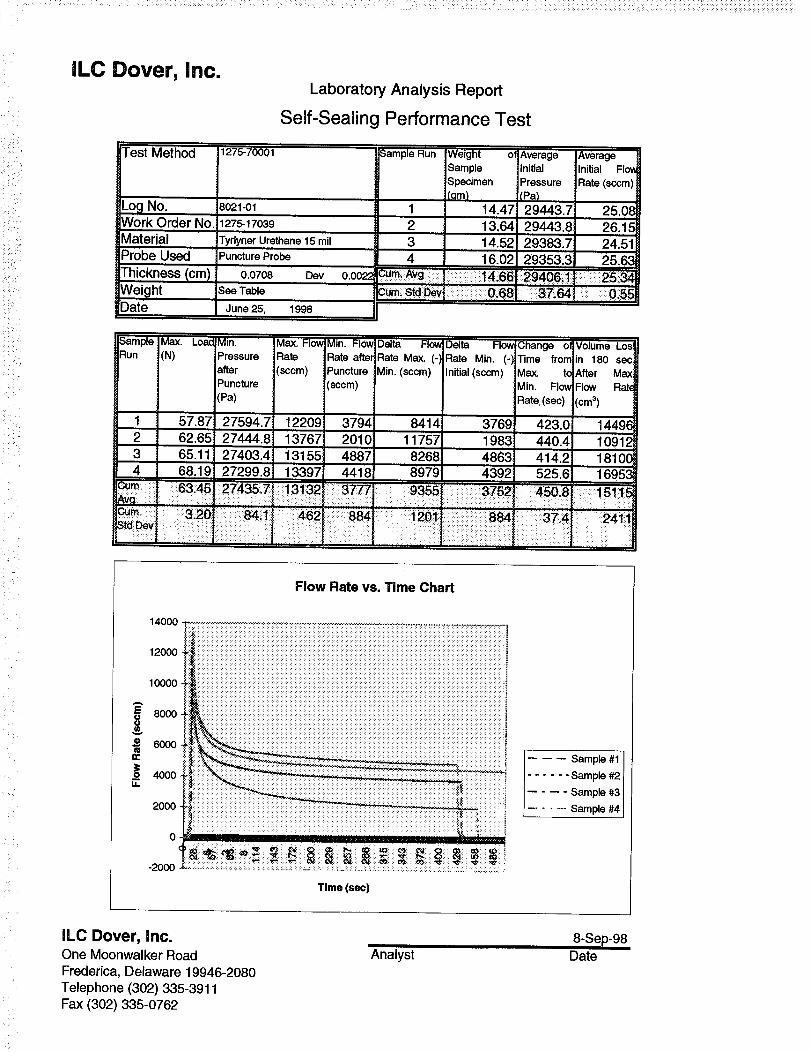
.............. ':--:_:'/: - /:/_ " : /._/-..-. . " :::i .:ii H._ " : : :: :. :/_:i /: i: - !H¸¸:̧ :i:/:i_
ILC Dover, Inc.
Test Method
Log No.
Work Order No.Material
Probe Used
Thickness (cm)
WeightDate
Laboratory Analysis Report
Self-Sealing Performance Test
1275-70001Sample Run Weight ol Average Average
Sample Initial Initial FIo_
Specimen Pressure Rate (scorn)
(qm) [Pa)
1 14.47 29443.7 25.082 13.64 29443.8 26.15
3 14.52 29383.7 ` 24.514 16.02 29353.3 i 25.63
3urn.Avg : '_: _ '_14:.66iSum. StdDev :i:ii:i:;:i;'":: 0:6E
8021-01
1275-17039
Tyrlyner Ure_ane 15 mil
Puncture Probe
0.0708
SeeTable
June 25,
Dev 0.0022
1998
Sam_e Max. Load
Run (N)
1 57.87
2 62.65
3 65.11
4 68.19
Cure.':: :: _63:45
_m. : ; 3.20
Std::Devi _ :
Min. Max. Flow Min. Flow Delta Flov
Pressure Rate Rate aftel Rate Max, (-)
after (sccm) Puncture Min. (sccm)
Puncture (sccm)
(Pa)
27594.7 12209 3794 84141
27444.8 13767 2010 11757
27403.4 13155 4887 8268i
27299 8 13397 4418 89791
Delta Flow Change ol Volume LosRate Min. (-] Time from in 180 sec
Initial (sccm) Max. to After Max
Min. Flow Flow Rat(
Rate (sec) (cm 3)
3769 423.0 14496
1983 440.4: 10912
4863 414.2 181004392 525.61 16953
Flow Rate vs. Time Chart
14000
12OO0
10000
80000
6000
4000I,I.
2000
-2000
Time (sec)
- - - Sample #2
- Sample #3
- -- Sample #4
ILC Dover, Inc.One Moonwalker Road
Frederica, Delaware 19946-2080
Telephone (302) 335-3911
Fax (302) 335-0762
Analyst
8-Sep-98
Date
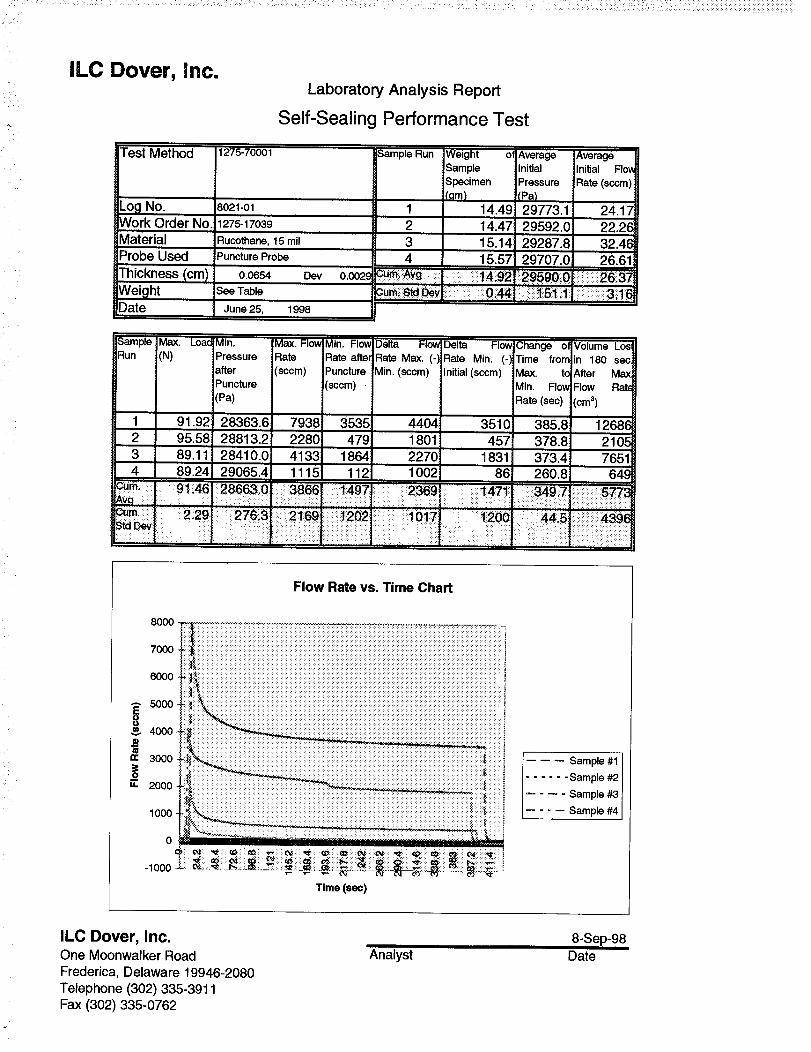
ILC Dover, Inc.
Test Method
Log No.Work Order No.MaterialProbe Used
Thickness (cm)WeightDate
Laboratory Analysis Report
Self-Sealing Performance Test
1275-70001
8021-01
1275-17039
Sample Run
Rucothane, 15 milPuncture Probe
0.0654
See Table
June 25,
Oev
1998
1i
234
0.002_¢
Weight of, Average AverageSample Initial Initial Flow
Specimen Pressure Rate (sccm)[qm) (pa)
14.49 29773.1 24.1714.47 29592.0 22.2615.14 29287.8 32.4(15.57 29707.0 26.6i
_u_iii_'_g ii_' !4i921 29590i0 iii!iii 2637
Sample Max. Loa(Run (N)
1 91,92i2 95.58i3 89.11i4 89.24
Min.
Pressure
after
Puncture
(Pa)
28363.628813.228410.0i
Max. Flow Min. Flow Delta FIo_ Delta Flow Change ol
Rate Rate after Rate Max. (-) Rate Min. (-_ Time from{sccm) Puncture Min. (sccm) Initial (sccm) Max. tc
(sccm)• Min. Flov
Rate (sec)
7938 i 3535 4404 3510 385.82280 479 1801 457 378,84133 1864 2270
Volume Los
in 180 secAfter MaxiFlow Rak
[cm3)
126862105
1831 373.4 765129065.41 1115 112 1002 86 260.8 649
_m, :91146 2_0 :;_66 ::1497 2_9 :: t471 ii 5_3_v_ j I Ji :::::::::::::::::::::::::::
_;:m. 2i29 27613 ;2169 ; !202 ;; _0;17 :t200 ::: :44_5iStdl:>eV_ : : :::i::::i!
: : : ::: :::: :: :::::::; :::.: ::: ::: :::
Flow Rate vs. Time Chart
8000,
7OOO
6OOO
5000I
4000
3000
2000
1000
0
-1000
Time (sec)
Sample #1
...... Sample #2 I
.... Sample #3
.... Sample #4
ILC Dover, Inc.One Moonwalker RoadFrederica, Delaware 19946-2080Telephone (302) 335-3911Fax (302) 335-0762
Analyst8-Sep-98
Date
APPENDIX C
LABORATORY ANALYSIS REPORT, CUT PROTECTION PERFORMANCE TESTS
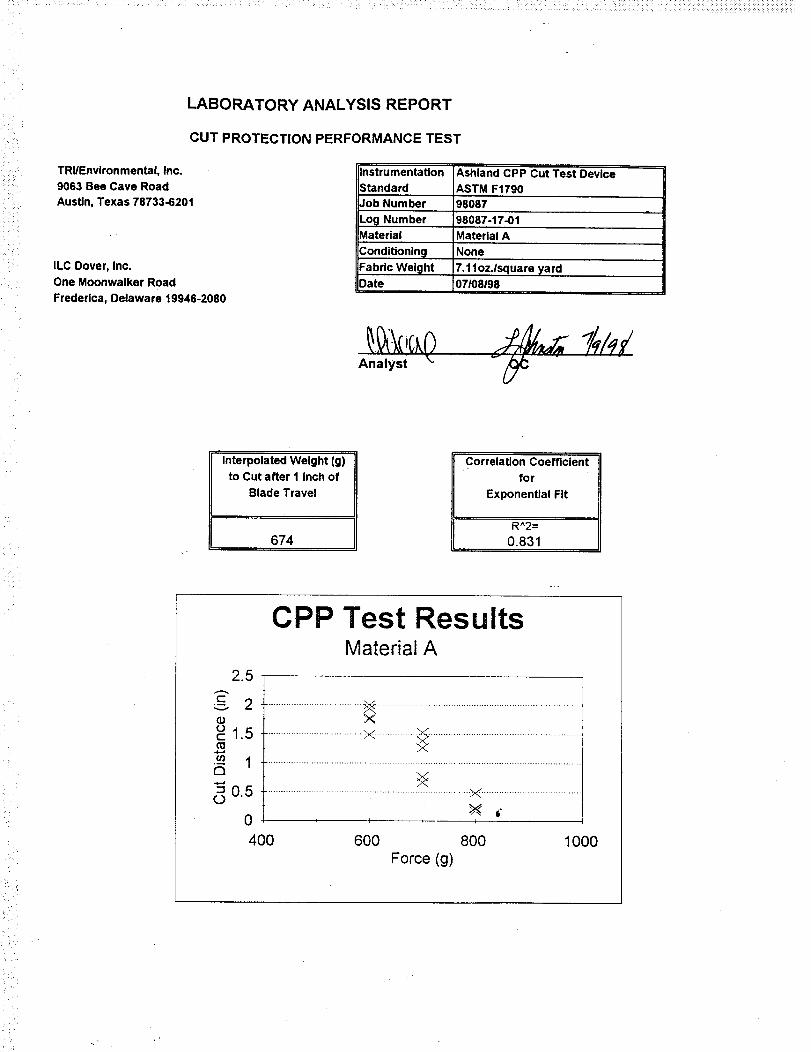
LABORATORY ANALYSIS REPORT
CUT PROTECTION PERFORMANCE TEST
TRI/Environmental, Inc.9063 Bee Cave Road
Austin, Texas 78733-6201
ILC Dover, Inc.One Moonwalker Road
Frederica, Delaware 19946.2080
Instrumentation
Standard
Job Number 98087
Log Number 98087-17-01Material Material A
NoneConditioning
Fabric WeightDate
Ashland CPP Cut Test DeviceASTM F1790
7.1loz.lsquare yard07108198
Interpolated Weight (g)to Cut after 1 inch of
Blade Travel
674
Correlation Coefficient
for
Exponential Fit
R^2=0.831
2.5
CPP Test ResultsMaterial A
'-" 2
oc-1.5
•_- 1a
_0.5(0
0 I I
400 600 800 1000
Force (g)
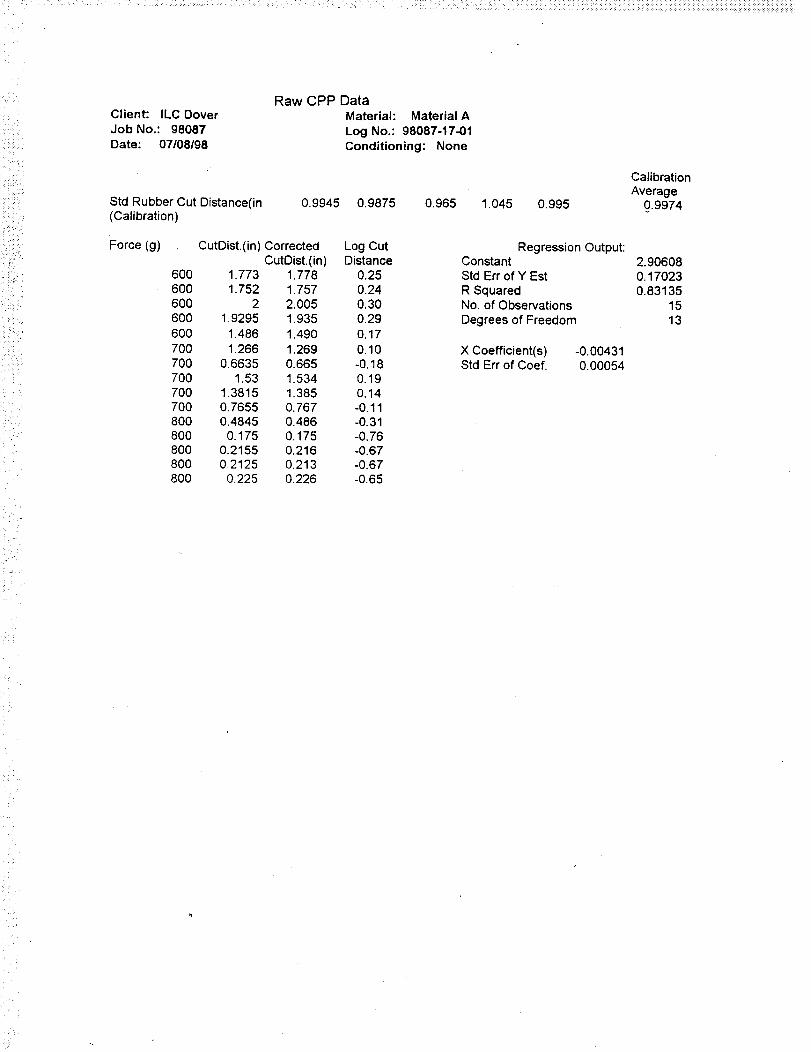
Raw CPP DataClient: ILC Dover Material: Material A
Job No.: 98087 Log No.: 98087-17-01
Date: 07/08/98 Conditioning: None
Std Rubber Cut Distance(in 0.9945 0.9875 0.965 1.045 0.995(Calibration)
Force (g) CutDist.(in) Corrected Log C_CutDist.(in) Distance
600 1.773 1.778 0.25600 1.752 1.757 0.24600 2 2.005 0.30600 1.9295 1.935 0.29600 1.486 1.490 0.17
700 1.266 1.269 0.10700 0.6635 0.665 -0.18700 1.53 1.534 0.19700 1.3815 1.385 0.14700 0.7655 0.767 -0.11800 0.4845 0.486 -0.31800 0.175 0.175 -0.76800 0.2155 0.216 -0.67800 0.2125 0.213 -0.67800 0.225 0.226 -0.65
CalibrationAverage
0.9974
X Coefficient(s) -0.00431Std Err of Coef, 0,00054
Regression Output:Constant 2.90608Std Err of Y Est 0.17023
R Squared 0.83135No. of Observations 15
Degrees of Freedom 13
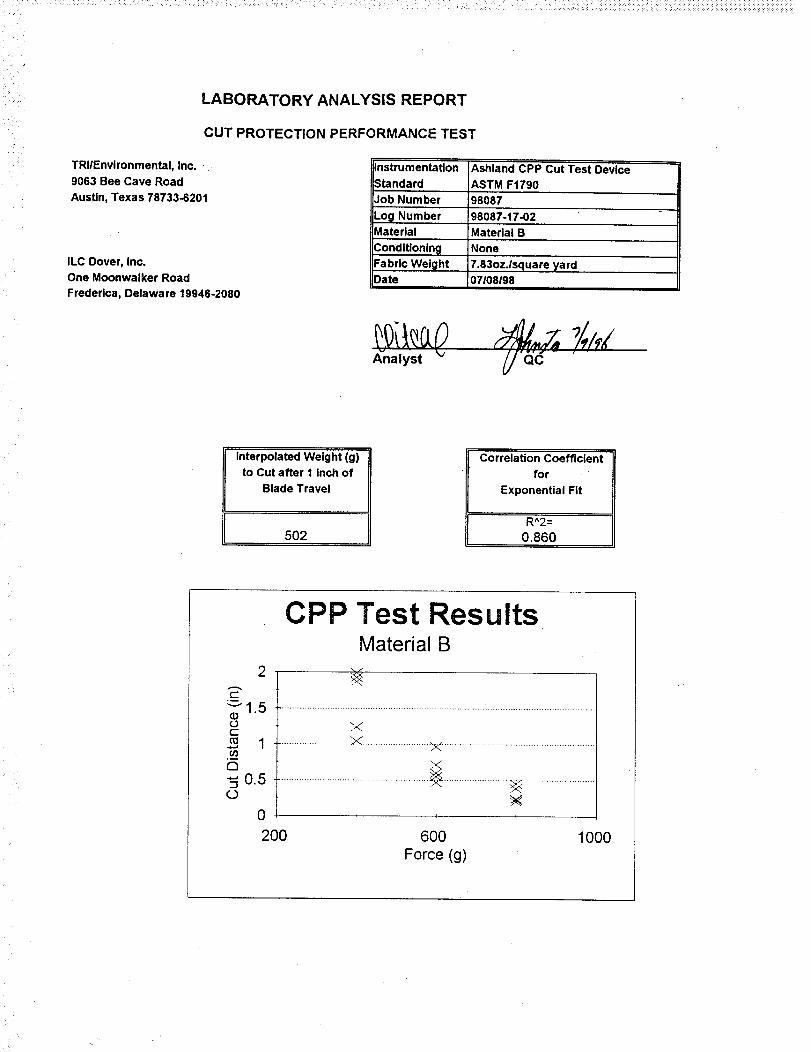
_ii_
_i_
LABORATORY ANALYSIS REPORT
CUT PROTECTION PERFORMANCE TEST
TRIIEnvironmental, Inc. -
9063 Bee Cave Road
Austin, Texas 78733-6201
ILC Dover, Inc.
One Moonwalker Road
Frederlca, Delaware 19946-2080
Instrumentation
StandardAshland CPP Cut Test Device
ASTM F1790
Conditioning
Job Number 98087
Log Number 98087-17-02
Material Material B
None
Fabric Wei_lhtDate
7.83oz.lsquare yard07108198
._naly,t " _/'_'c .....
Interpolated Weight (g)
to Cut after 1 inch of
Blade Travel
502
Correlation Coefficient
for
Exponential Fit
R^2 =
0.860
CPP Test ResultsMaterial B
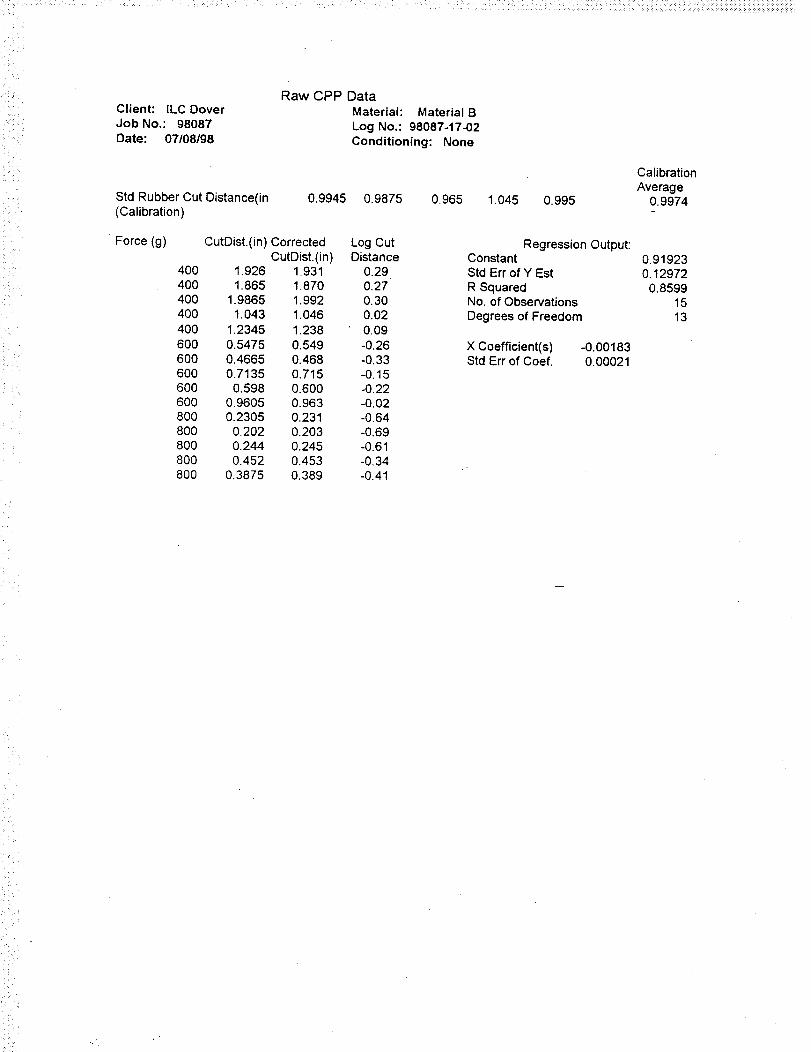
Raw CPP DataClient: ILC Dover Material: Material B
Job No.: 98087 Log No.: 98087-17-02Date: 07/08/98 Conditioning: None
Std Rubber Cut Distance(in 0.9945 0.9875 0.965 1.045 0.995(Calibration)
Force (g)
40O4004O0400
4006006006O060O60O8008OO800800800
CutDist.(in) Corrected Log Cut
CutDist.(in) Distance1.926 1.931 0.291.865 1.870 0.27
1.9865 1.992 0.301.043 1.046 0,02
1.2345 1.238 0.09
0,5475 0.549 -0.260.4665 0.468 -0.330.7135 0.715 -0.15
0.598 0.600 -0.220.9605 0.963 -0.020.2305 0.231 -0.64
0.202 0.203 -0.690.244 0.245 -0.610.452 0.453 -0.34
0.3875 0.389 -0.41
Calibration
Average0.9974
Regression Output:Constant 0.91923Std Err of Y Est 0.12972R Squared 0.8599No. of Observations 15
Degrees of Freedom 13
X Coefficient(s) -0.00183Std Err of Coef. 0.00021

< i:
iililH
LABORATORY ANALYSIS REPORT
CUT PROTECTION PERFORMANCE TEST
TRIIEnvlronmental, Inc.
9063 Bee Cave Road
Austin, Texas 78733-6201
ILC Dover, Inc.
One Moonwalker Road
Frederica, Delaware 19946-2080
rnstrumentatlon
Standard
Ashland CPP Cut Test Device
Conditionin_l
ASTM F1790
Job Number 98087
L.o_lNumber 98087-17-03Material Material C
None
Fabric WeightDate
11.61oz.lsquare yard!07108198
Analyst
!i
Interpolated Weight (g)
to Cut after 1 inch of
Blade Travel
675
Correlation Coefficient
for
Exponential Fit
R^2 =
0.846
2.5
CPP Test ResultsMaterial C
_- 2
¢3cl.5(o
•_ 1a
_0.5(0
0
X
I I
400 600 800 1000
Force (g)
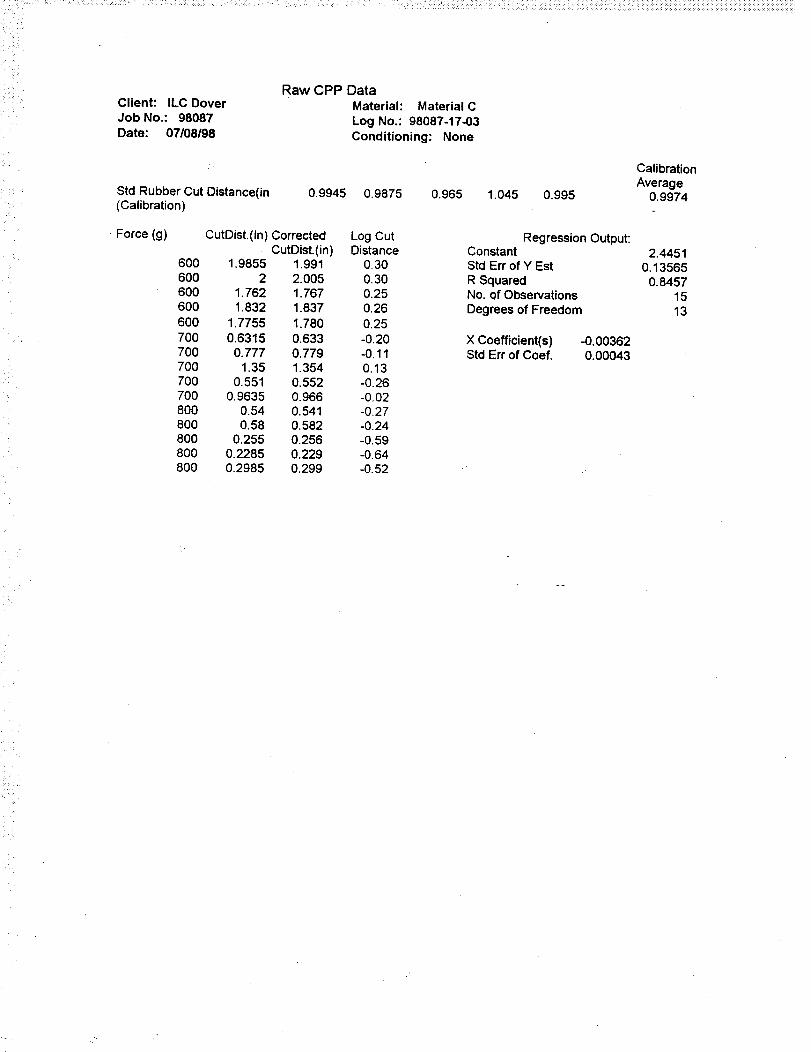
!i_!!i!i_!_Raw CPP Data
Client: ILC Dover Material: Material C
Job No.: 98087 Log No.: 98087-17-03Date: 07/08/98 Conditioning: None
Std Rubber Cut Distance(in 0.9945 0.9875 0.965 1.045 0.995(Calibration)
• Force (g) CutDist.(in) Corrected Log CutCutDist.(in) Distance
600 1.9855 1.991 0.30600 2 2.005 0,30600 1.762 1.767 0.25600 1.832 1.837 0.26600 1.7755 1.780 0.25
700 0.6315 0.633 -0.20700 0.777 0.779 -0.11700 1.35 1.354 0.13700 0.551 0.552 -0.26700 0.9635 0.966 -0.02800 0.54 0.541 -0.27800 0.58 0.582 -0.24800 0.255 0.256 -0.59800 0.2285 0.229 -0.64800 0.2985 0.299 -0.52
Calibration
Average0.9974
X Coefficient(s) -0.00362Std Err of Coef. 0.00043
Regression Output:Constant 2.4451Std Err of Y Est 0.13565R Squared 0.8457No. of Observations 15Degrees of Freedom 13
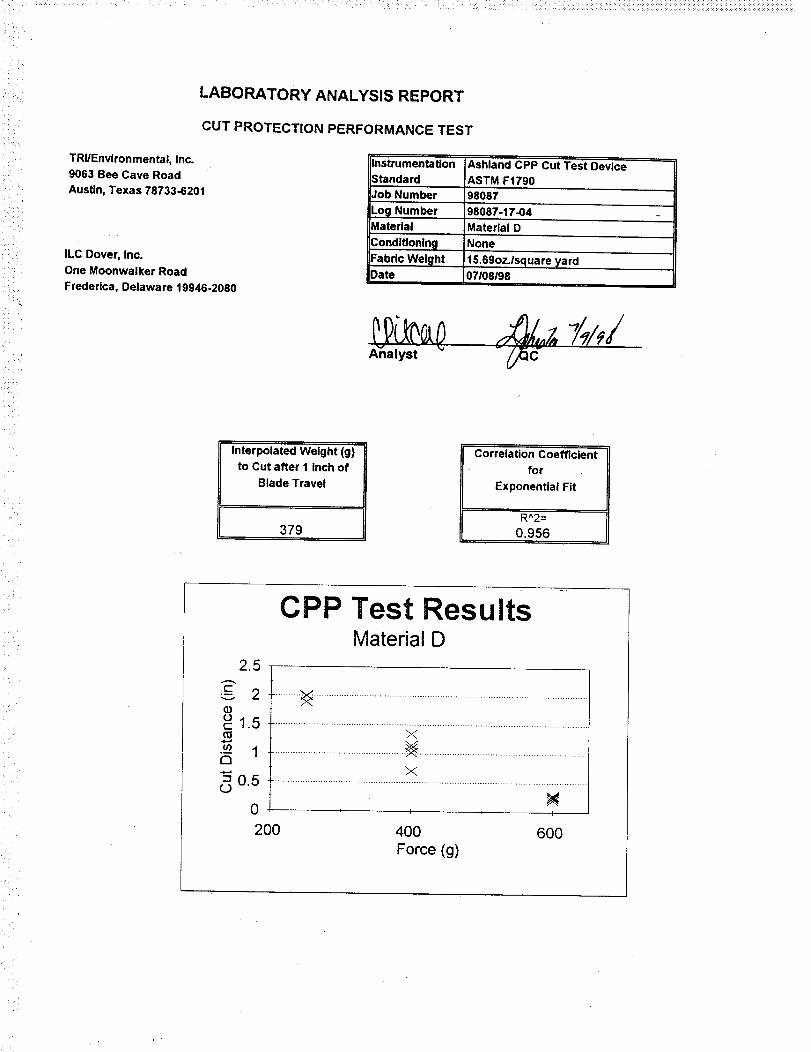
_.! __!<'_!__ _::i_!_i_i!_i<<i_i_<,i!:!_i<!:!i_!_<: <i<_!_i<<_iiikiiiii_i!i!i!i_!ii!_i_ii!_i_ii:_ii%i!i_i_i_i_i_ii_iiii;_iiii_iii_iiiiii_iiiiii_iii_iiiiiiiiiiiiiiiiiiiiiiiiiii
LABORATORY ANALYSIS REPORT
CUT PROTECTION PERFORMANCE TEST
TRIIEnvironmental, Inc.
9063 Bee Cave Road
Austin, Texas 78733-6201
ILC Dover, Inc.
One Moonwalker Road
Frederica, Delaware 19946-2080
Instrumentation
StandardAshland CPP Cut Test Device
ASTM F1790
0onditionincJ
Fabric Weight
Date
Job Number 98087
Lo_l Number 98087-17-04
Material Material D
None
15.69oz.lsquare yard
07108198
Analyst _"
Interpolated Weight (g)to Cut after 1 inch of
Blade Travel
379
Correlation Coefficient
for
Exponential Fit
R^2=
0.956
2.5
c-•- 2v
¢..)_-1.5
•_- 1E3
=0.50
CPP Test ResultsMaterial D
0
20O
X
x
I I
400 600
Force (g)
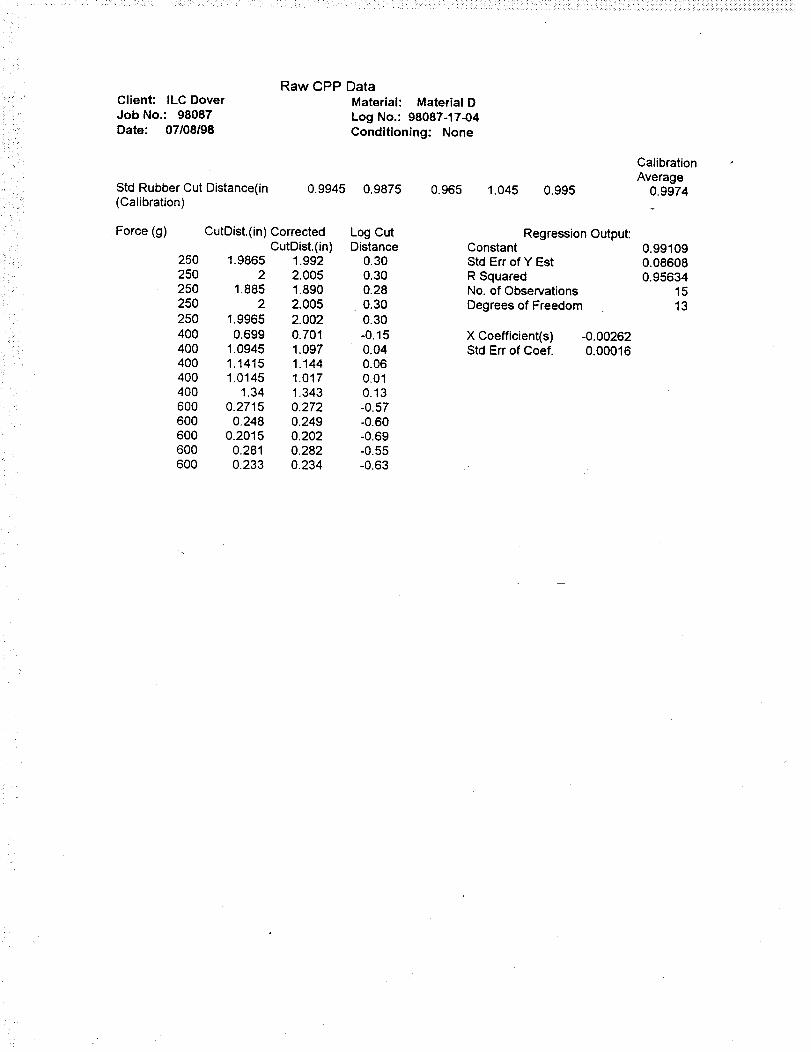
............... _ _s_ __ _ .... _ _ ?_ _ _ _ _ : ___:__ _ _ _ _ii_:!i_:i̧ _:!ii_!_i_,_¸_,_i_i_i_:_!_ii_i_i:i_i_:i_iliii_iii!!;!i!i_i!!!_ii!ii!i_iiiii!!!ii_ii!_!_!_!ilil_i!_i:iiiiiiii:_ii_!_i_!!!!_i!_ii!!i_i!i!_i!_ii_!_ii_iiiii_iii_i!i!ii_i_iiiii_iiiii_iiiiiiiiiii_iiiiiiiii_iiiii_i_iiiii_iiiiiiii_
!,i
• :i ¸
Raw CPP Data
Client: ILC Dover Material: Material D
Job No.: 98087 Log No.: 98087-17-04Date: 07108/98 Conditioning: None
Std Rubber Cut Distance(in 0.9945 0.9875 0.965(Calibration)
Force (g) CutDist.(in) Corrected Log CutCutDi_.(in) Di_ance
250 1.9865 1.992 0.30250 2 2.005 0.30250 1.885 1.890 0.28250 2 2.005 0.30250 1.9965 2.002 0.30
400 0.699 0.701 -0.15400 1.0945 1.097 0.04400 1.1415 1.144 0.06400 1.0145 1.017 0.01400 1.34 1.343 0.13600 0.2715 0.272 -0.57600 0.248 0.249 -0.60
600 0.2015 0.202 -0.69600 0.281 0.282 -0.55600 0.233 0.234 -0.63
1.045 0.995
Calibration
Average0.9974
Regression Output:Constant 0.99109Std Err of Y Est 0.08608
R Squared 0.95634No. of Observations 15
Degrees of Freedom 13
X Coefficient(s) -0.00262Std Err of Coef. 0.00016
APPENDIX D
LABORATORY ANALYSIS REPORT, PUNCTURE RESISTANCE TESTS
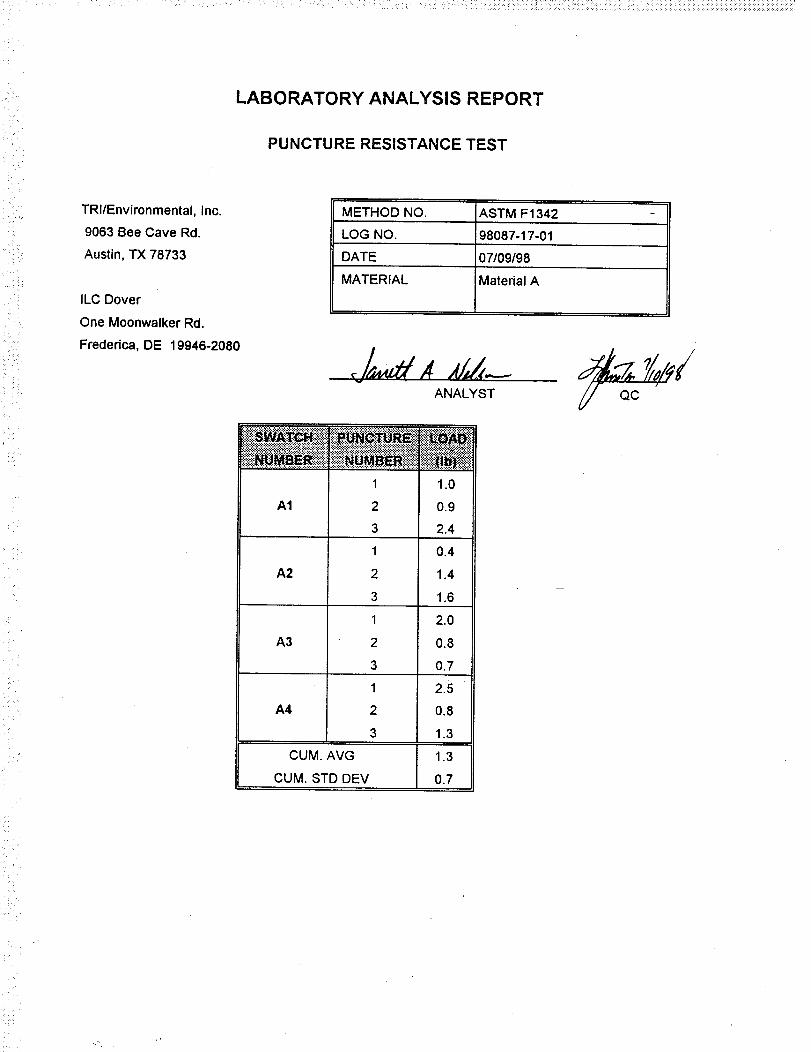
__i_,i_
TRI/Environmental, Inc.
9063 Bee Cave Rd.
Austin, TX 78733
ILC Dover
One Moonwalker Rd.
Frededca, DE 19946-2080
LABORATORY ANALYSIS REPORT
PUNCTURE RESISTANCE TEST
METHOD NO. ASTM F1342
LOG NO. 98087.17-01
DATE 07/09/98
MATERIAL Material A
ANALYST
1 1.0
A1 2 0.9
3 2.4
1 0.4
A2 2 1.4
3 1.6
1 2.0
A3 2 0.8
3 0.7
1 2.5
A4 2 0.8
3 1.3
CUM. AVG 1.3
CUM. STD DEV 0.7
QC
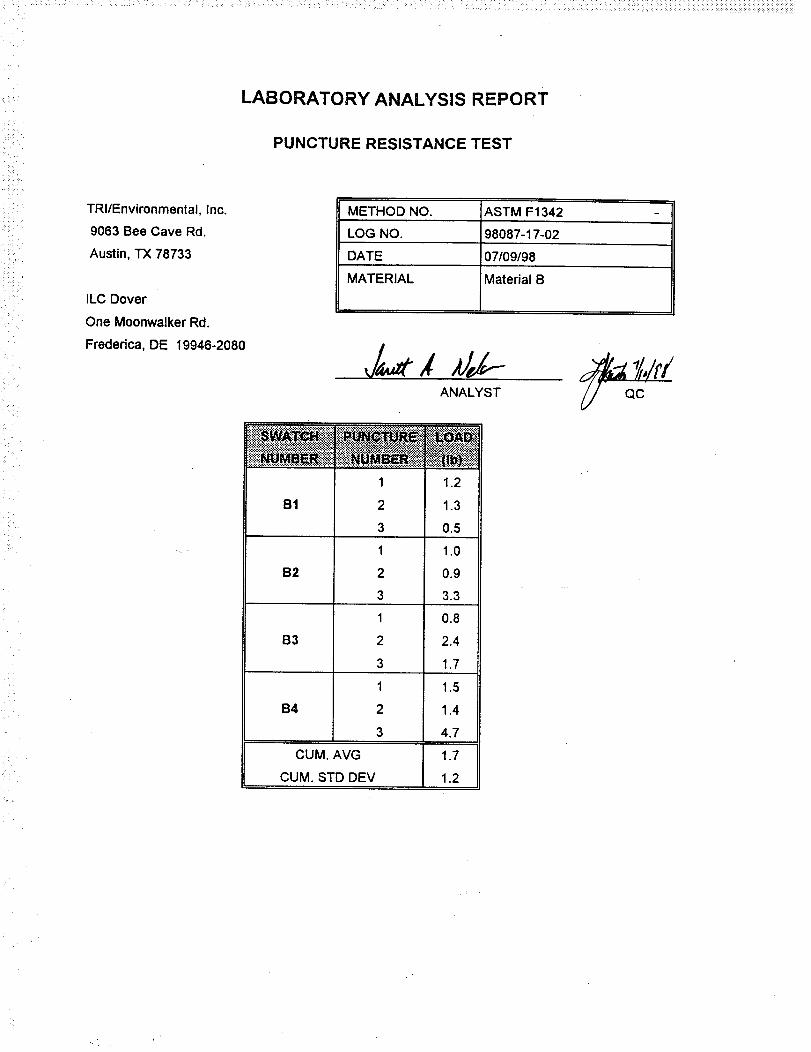
LABORATORY ANALYSIS REPORT
PUNCTURE RESISTANCE TEST
TRI/Environmental, Inc.
9063 Bee Cave Rd.
Austin, "IX 78733
ILC Dover
One Moonwalker Rd.
Frederica, DE 19946-2080
METHOD NO. ASTM F1342
LOG NO. 98087-17-02
DATE 07/09/98
MATERIAL Material B
ANALYST
1 1.2
B1 2 1.3
3 0.5
1 1.0
132 2 0.9
3 3.3
1 0.8
B3 2 2.4
3 1.7
1 1.5
B4 2 1.4
3 4.7
CUM. AVG 1.7
CUM. STD DEV 1.2

LABORATORY ANALYSIS REPORT
PUNCTURE RESISTANCE TEST
i:_
TRI/Environmental, Inc
9063 Bee Cave Rd.
Austin, TX 78733
ILC Dover
One Moonwalker Rd.
Frederica, DE 19946-2080
METHOD NO. ASTM F1342
LOG NO. 98087-17-03
DATE 07/09/98
MATERIAL Material C
ANALYST
C1
C2
C3
C4
1
2
3
1
2
3
1
2
3
1
2
3
CUM. AVG
CUM. STD DEV
0.3
0.8
0.8
2.0
0.7
0.7
0.8
2.3
0.7
1.1
1.1
2.3
1.1
0.6
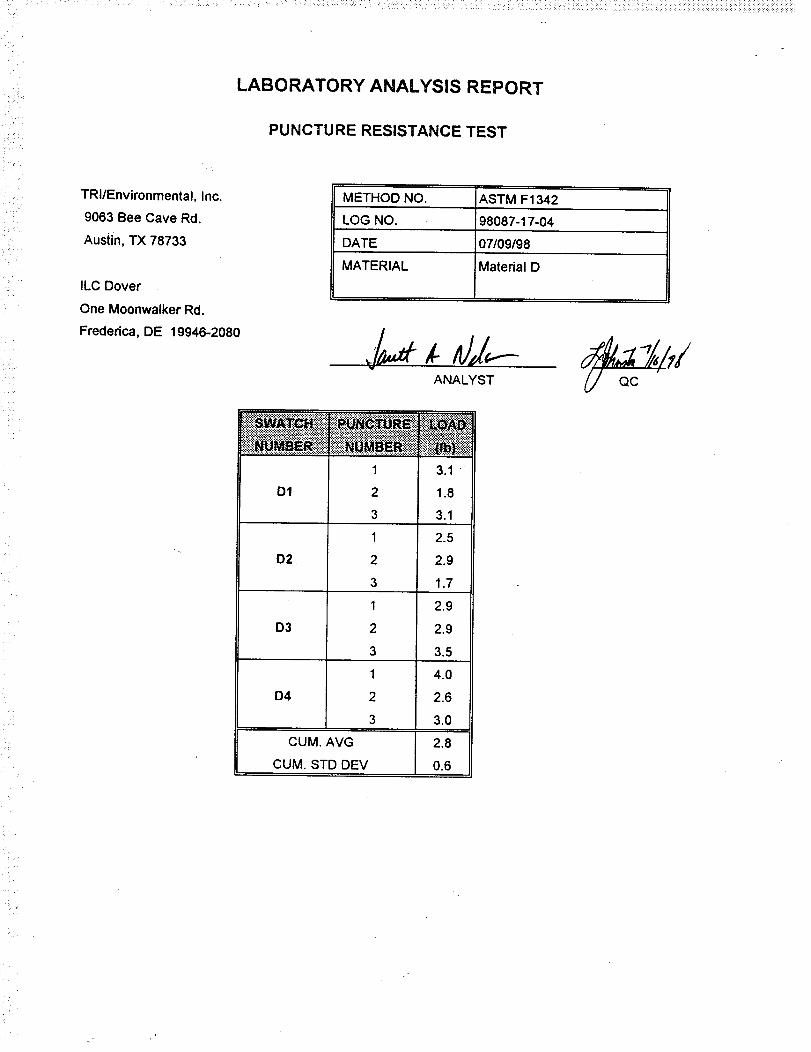
LABORATORY ANALYSIS REPORT
PUNCTURE RESISTANCE TEST
TRI/Environmental, Inc.
9063 Bee Cave Rd.
Austin, TX 78733
ILC Dover
One Moonwalker Rd.
Frederica, DE 19946-2080
METHOD NO. ASTM F1342
LOG NO. 98087-17-04
DATE 07/09/98
MATERIAL Material D
v
ANALYST
1 3.1
D1 2 1.8
3 3.1
1 2.5
D2 2 2.9
3 1.7
1 2.9
D3 2 2.9
3 3.5
1 4.0
D4 2 2.6
3 3.0
CUM. AVG 2.8
CUM. STD DEV 0.6
_- ....................... - _'_: _ _ • • •• • • -•_ • " • , • _ ;. i •_ _,_:_:.: ;-:0_) !L¸ ;:_L_%U_::_:_!:_;!:_:_i_;_!•J.%_ii_:_ii_iii_ii:iii_i_i_ii_iii_iiii_i_iiiiiii_i_iiiiiiiii_i_iiiiiiii_i_iiiiiiiii_i
q
>H
iii_i_iiili_
]
d,i_•
APPENDIX E
HYPERVELOCITY IMPACT RESISTANCE TEST REPORTS

Summary of Preliminary
Hypervelocity Impact Testing Results
Velocity (km/s)
Projectile 0.5 0.5Diameter (mm)
0 0Angle (degree)
Prototype Layer
Reinforced
Mylar Layer #1Reinforced
Mylar Layer #5
NeopreneCoated Nylon
Dacron Polyester
Urethane Coated
Nylon
Aluminum
Witness Plate
Pass/Fail
1.0 mm diameter
hole
2.5 mm X 2.5 mm
entrance hole
5.0 mm X 5.0 mm
exit hole
1.0 mm X 1.5 mm
hole
2.25 mm X 3.25mm hole
4.5 mm X 6.5 mmStain
No DamageOccurred
Passed
0.5 0.5 0.6 0.6
0 0 0 01.0 mm diameter 1.75 mm X 1.5 0.75 mm X 1 mm
hole mm diameter hole diameter hole3.75 mm X 3.0 mm
entrance hole
4.75 mm X 5.5 mm
exit hole
1.25 mm X 1.75 mm
hole
2.0 mm X 3.0 mmhole
.75 mm X 1.25 mmHole
4.5 mm X 5.0 mm
Stain
32 mm X 19 mm
Splattered Area
Failed
4.0 mm X 3.25
mm entrance hole
5.0 mm X 5.5 mmexit hole
1.0 mm X 1.25mm hole
1.5 mm X 1.25
mm hole
0.75 mm hole
0.25 mm craters35 mm X 20 mm
Splattered AreaFailed
3.0 mm X 4.0 mm
entrance hole
5.0 mm X 5.0 mmexit hole
1.25 mm X 2.25
mm hole
2.5 mm X 1.75 mm
hole
.75 X 1.25 mm hole
3 mmX 3.5 mm
Stain
32 mm X 30 mm
Splattered Area
Failed
1.5 mm X 1.25 mmdiameter hole
3.75 mm X 2.5 mm
entrance hole
5.0 mm X 5.0 mm
exit hole
2.25 mm X 2.0 mm
hole
3.25 mm X 4.0 nun
hole
0.5 mm Hole5.0 mm Stain
No DamageDetected
Failed
1 mm hole
2.75 mm X 2.75 mm
hole w/petals7.0 mm X 6.0 mm exit
hole
2.0 mm X 2.25 mm
hole
3.0 mm X 3.0mmhole
1.5 mm Hole
5.0 X 6.0 mm Stain
Minute Craters
45 mm X 30 mm Area
Failed

Summary of Preliminary
Hypervelocity Impact Testing Results
................................................_..........................._ ........................_...........................::_,................................,..........- ............................ _ _:__ _ :_i _ . ._i_ .. _ii_i_.._ | _._p._._. _$_::::::::::::::::::::::::::::::::::::::::::::::::::::::::::::::::::::::::::::::::::::::::::::::::::::::::::::::::::::::::::::::::::::::::::::::::::::::::::::::::::::::::::::::::::::::::::::::::::::::::::::::::::::::::::::::::::::::::::::::::::::::::::::::::::::::::::::::::::::::::::::i _ _i_ii_iiii[i!i_i_iiiiiii_i_]_iii_iiii_iiii_iii_iii_i!_i|!_ii_iiiiii_i_iiiiiiiiiii_iiiii_ii_ii_1_!iiiiiiiii_iiiiiiiiiiiiii_i_ii_ii_iiiiiI_iii_iiiiiiiii_iiii_!_iiii_iiii_ii
ve, ocity Lmn/s) 7.17 7.0 7.0 7.1 .................. 619 .....................................................7_0 ............................Projectile
Diameter (mm)
Angle (degree)
Prototype Layer
Reinforced
Mylar Layer #1
0.6 0.5
1.25 mm X 1.5 mm
vertical hole
0 0
1.25 mm hole
3.75 mm X 3.25mm entrance w/
petals
3.5 mm X 5.0 mm
entrance w/petals
Reinforced 7.5 mm X 4.5 mm 4.5 mm X 5 mm exitMylar Layer #5 exit hole hole
Neoprene 2.5 mm X 2.25 mm 1.75 mm X 1.25 mmCoated Nylon hole hole
Dacron Polyester
Urethane Coated
Nylon
Aluminum
Witness Plate
Pass/Fail
0.4
0
0.75 mm hole
2mmX 1.5 mm
entrance w/petals
3.9 mm X 3.0 mm
exit hole
1.25 mm hole
0.4 0.4
0.75 mm X 1 mmhole
0 0
1 mm hole
t.75 mm X 1.75
mm entrance
w/petals4.5 mm X 4.0 mm
exit hole
2.0 mm entrance
hole w/petals
4.25 mm X 4.0 mmexit hole
0.4
1 mm X 0.75 mm
hole
4.0 mm X 2.5 mm
entrance hole w/
petals2.75 mm X 2.0 mm
exit hole
2.5 mm X 2.5 mm
hole
1 mm X 0.75 mmHole
5.0 mm X 4.5 mm
Stain
Minute Craters
40 mm X 45 mm
Failed
2.5 mm X 1.25 mmhole
1.25 mm X 0.75 mm
hole
4.0 mm X 2.75 mmStain
Minute Craters
40 mm X 35 mm
Failed
1.5 mm X 1.75 mm
hole
0.75 mm Hole3 mm Stain
Minute Craters
30 nun X 30 mm
Failed
1 mm X 1 mm hole
1.25 mm X 1.5 mmhole
1.0 mm area of
Broken Fibers2.5 mm X 2.0 mm
Stain
Minute Craters27 mm X 35 mm
Failed
0.75 mm X 0.5 mm
hole
<0.25 mm X 0.5
mm hole
1.5 mm X 2.5 mm
Stain
No Damage Noted
Passed
1.0mmX 1.0 mm
hole
1.0 mm X 0.75 mm
hole
0.75 mm X 1.0 mm
hole
2.0 mm X 2.5mmStain
No Damage Noted
Failed
NOTE: Hypervelocity Test #8 is not indicated, as it was reported as "a bad shot".
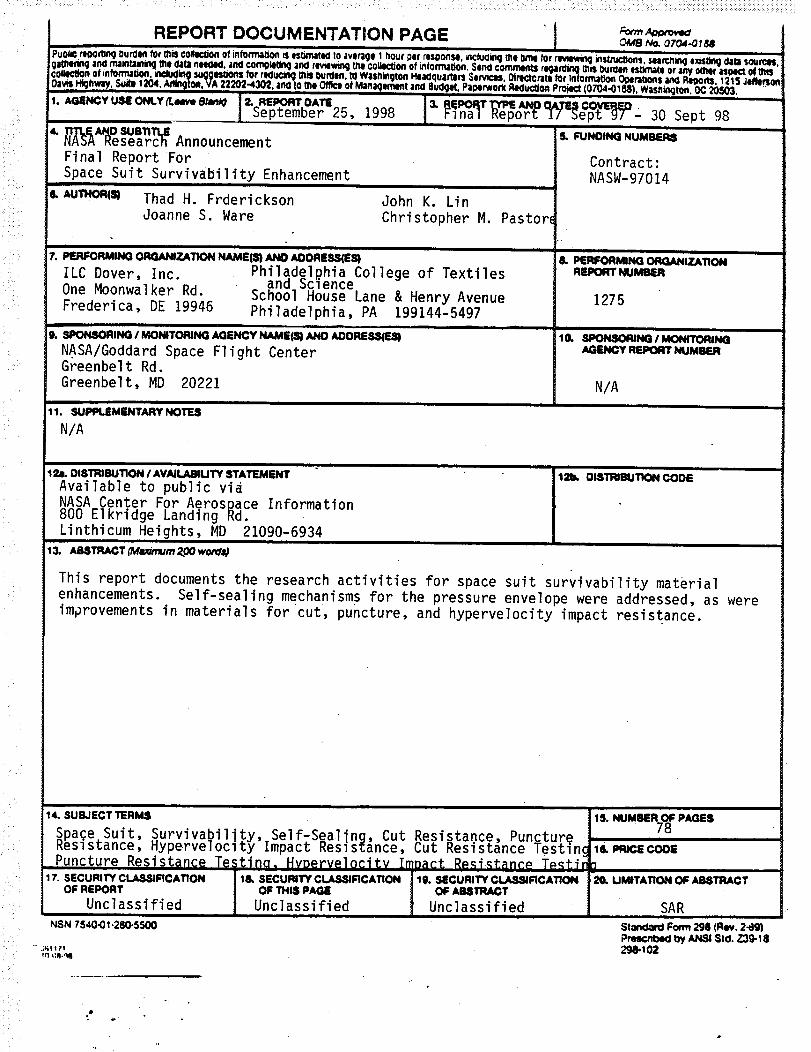
: _:_:?::.:: : :.... :: .....<: : ::_ ::_::<:::: :_<:_:_:::_: ::<:i::_!!:_:_i<_i:kY:_:ii_;::<:!!<::_!!ii_:_:<:i:!_i_!!iiii_i_iiiii_ii_i!iiiii_iiiii:iiiii_iiiiiiiiiii_iii_iiiiiiiiiiiiiiiiiii_iiiiiiiiiii_iiiiiii!ii_
REPORT DOCUMENTATION PAGE I _,,,,_,o_OM8 No. 070,1-0184
• _ ...,*w, wu,_n_u......rroMK_tV_U4"U]_),wgsnll1_T0n,[JG_503.
1. AGENCY U_E ONLY (Le4ve 81anlO 2. REP_,_RTOATE j 3.September 25, 1998 __ee '_NG ort., = 30Sept98I
4. TITLEAND SIJS_LENASA Research Announcement s. FUNOINGNUMBFinal Report For
Space Suit Survivability Enhancement
¢ AUTM_(_ Thad H. Frderickson
Joanne S. Ware
z. r._jC-ORM_NGocm_mzAnoN NAM_m _uwO_OORSSS(SS)ILC Dover, Inc. Philadelp.hia College of Textiles
ano _c_enceOne Moonwalker Rd. School House Lane & Henry AvenueFrederica, DE 19946 Philadelphia, PA 199144-5497
. ii iI
o. SPONSOmNO/ Moa,,._oa_NGAOr=NCYe,U_S_ _ _ORSSS(nZSlN.ASA/Goddard Space Flight CenterGreenbelt Rd.
Greenbelt, MD 20221
11. SUPPLEMENTARY NOTES
N/A
John K. Lin
Christopher M. Pastor,
Contract:
NASW-97014
i..
8. PERFORMING ORGANIZATIONREPORT NUMBER
1275
10. SPONSORING/MONITORINGAGENCY REPORT NUMBER
N/A
lZ,.O0STRmUTION/*V_LABUTYSTA_Mfm" la_.OmTmeUTW_NCOOSAvailable to public viaNASA Center For Aerospace Information800 Elkridge Landing Rd.
Linthicum Heights, MD 21090-6934
1_ ABSTRACT (Mc_num 200 wo_
This report documents the research activities for space suit survivability material
enhancements. Self-sealing mechanisms for the pressure envelope were addressed, as were
improvements in materials for cut, puncture, and hypervelocity impact resistance.
i
_4. SUSJSC_RMS
aqe. Suit, Survivability, Self-Sealin_, Cut Resistance, Puncturees]szance, Hyperveloc_zy Impact Resistance, Cut Resistance Testinc
Puncture Resistance Testino. HvDervelocitv ImPact Resi_tance T_stir17. SECURITYCLASSlRCATION l& SECURITYCI._S,_RCATION 1_ SECUmTYCI.AS_RCATION
OFREPORT OFTHISPAGE OFAI_TRAGT
Unclassified Unclassified Unclassified
NSN/$¢_I.2_.5500
-" ,;K1 ! 7 t
_(k R_J¢llCOOE
20. UMITATION O¢ ABSTRACT
SAR
Standam Form 29tl (Rev. 2-_9)by ANSl Slcl. Z_9-18
298-_02