r-01-24 - skb.com
TRANSCRIPT
R-01-24
Svensk Kärnbränslehantering ABSwedish Nuclear Fueland Waste Management CoBox 5864SE-102 40 Stockholm SwedenTel 08-459 84 00
+46 8 459 84 00Fax 08-661 57 19
+46 8 661 57 19
A preliminary carbon budget fortwo oligotrophic hardwater lakesin the Forsmark area, Sweden
Eva Nilsson
Department of Limnology, Evolutionary Biology Centre
Uppsala University
June 2001

1
A preliminary carbon budget fortwo oligotrophic hardwater lakesin the Forsmark area, Sweden
Eva Nilsson
Department of Limnology, Evolutionary Biology Centre
Uppsala University
June 2001
ISSN 1402-3091
SKB Rapport R-01-24
This report concerns a study which was conducted for SKB. The conclusionsand viewpoints presented in the report are those of the author(s) and do notnecessarily coincide with those of the client.
Summary
The Swedish Nuclear Fuel and Waste Management Co (SKB) is responsible formanagement and disposal of Swedish radioactive waste. The company is planning toconstruct repositories that will keep radioactive waste away from humans for hundredsof thousands of years. In a safety assessment of the repositories hypothetical releases areused to evaluate the robustness of the repositories. It is important to know how theradioactive nuclides would react if they were released and by which way they couldenter the living biota. SFR are responsible for the disposal of low radioactive waste andclose to the nuclear plant in Forsmark there is a storage for low radioactive waste. Atthe moment this storage is located in the bedrock far below the sea level but due to land-rise in the area it will in the future be located above sea level. Hence, it is of importanceto know how the surface ecosystems in the area are functioning. A carbon budget for theaquatic ecosystem above SFR in Öresundsgrepen exist (Kumblad 1999), but it is alsoimportant to have a carbon budget for the surface systems in the Forsmark area sinceSFR in the future will be situated above sea level.
Carbon budgets can be used to get a picture of how an ecosystem functions. The carbonflow shows how carbon is transported through a food web from lower trophic levels,e.g. plants and bacteria to higher trophic levels such as fish. Oligotrophic hardwaterlakes are the most important lakes in the Forsmark area. This report aims to give apicture of a potential flow of carbon through the ecosystem in two oligotrophic hard-water lakes, Lake Hällefjärd and Lake Eckarfjärden. Macrophytes, mainly Chara, werecalculated to make up the largest part of the biomass and production in both lakes.Benthic bacteria and microphytobenthos (benthic photosynthesising microorganisms)were other large contributors to the production. Benthic bacteria were found responsiblefor a major part of respiration and, hence, consumption of carbon in the lakes. The bio-mass and production of biota were calculated to be concentrated to the light exposedsoft-bottom community.
Unfortunately very few studies have been performed in oligotrophic hardwater lakes inUppland and some of the values in the carbon budget are highly uncertain since theywere calculated from literature data originating from other lake types. However, thisestimate of the carbon flow, may serve as a basis for planning of future studies, of thefunction of the ecosystem in oligotrophic hardwater lakes.

Sammanfattning
Svensk Kärnbränslehantering AB (SKB) är ansvariga för hanteringen av svensktradioaktivt bränsle och avfall. Det radioaktiva avfallet ska förvaras så att det äroåtkomligt för människor i hundratusentals år. Om radionuklider trots allt skulle kommaut i naturen är det viktigt att veta hur omkringliggande ekosystem fungerar så attriskanalyser för människor kan göras. SFR är ansvariga för lågradioaktivt avfall, och iÖstersjön i närheten av kärnkraftverket i Forsmark, finns idag ett förvar för lågradio-aktivt avfall. För tillfället befinner sig detta förvar under havsytan men genom land-höjningen i området kommer det i framtiden att befinna sig på land. Ytterligare förvarav kärnbränsle planeras men var dessa kommer att placeras är ännu inte bestämt.
De viktigaste sjöarna i Forsmarksområdet är de kalkoligotrofa sjöarna. Definitionen aven kalkoligotrof sjö är att den är kalkrik och näringsfattig. De kalkoligotrofa sjöarna iUppland är relativt unga och har skapats genom landhöjningen som har pågått sedanden senaste istiden, vilken slutade för 8800 år sedan. På grund av de låga näringshal-terna i vattnet är produktionen i vattenmassan låg. På bottnarna finns dock en storbiomassa av växter (makrofyter) och fotosyntetiserande mikroorganismer. Vissa avsjöarna är omgivna av myr medan andra är omgivna av skog. Tillrinningsområdetskaraktär är sannolikt av stor betydelse för ekologin i sjöarna då tillrinnande vattenförändras med avseende på jonsammansättning när det passerar olika typer av eko-system.
Denna rapport ger en bild av hur kol kan tänkas flöda mellan olika organismgrupper itvå kalkoligotrofa sjöar i Forsmarksområdet; en omgiven av myrmark och en omgivenav skogsmark. Om radionuklider skulle komma ut i de kalkoligotrofa sjöarna är detmest troligt att de skulle komma in i näringskedjan via fotosyntetiserande mikroorganis-mer eller via bakterier.
I beräkningarna befanns makrofyter, främst Chara, vara de viktigaste primärproducen-terna och deras produktion utgjorde mellan 78 och 80 % av den totala produktionen isjöarna. Fotosyntetiserande mikroorganismer på bottnarna utgjorde en annan viktig delav primärproduktionen medan primärproduktionen i vattenmassan var försumbar.
Bakterieplanktons biomassa och produktion beräknades vara låga medan den bentiskabakteriebiomassan och produktionen var höga. Bentiska bakterier stod för en stor del avrespirationen och därmed konsumtionen av organiskt kol i båda sjöarna.
Konsumtionen av organiskt kol var högre än produktionen av organiskt kol i sjöarna.Detta beror troligen på att sjöarna tillförs avsevärda mängder kol från omgivningarna.En annan orsak kan vara att produktionen i sjöarna undervärderats eller att konsum-tionen övervärderats. Få studier har genomförts i de kalkoligotrofa sjöarna i Upplandoch därför användes värden från liknande sjöar. Detta medför givetvis en risk att vissaorganismgruppers produktion och konsumtion missbedömts. För att säkerställa dennakolbudget är det viktigt att fler studier av produktionen i de kalkoligotrofa sjöarnagenomförs. Främst är det studier av mikrofytobentos biomassa och produktion som ärönskvärda. Eftersom mätvärden från detta tjocka lager av mikrofytobentos saknas, ochnågon motsvarighet ej finns i andra sjöar, blir den uppskattade produktionen från littera-turdata mycket osäker.

Sammanfattningsvis är detta en grov uppskattning av kolflödet i två kalkoligotrofa sjöari Uppland. Dess huvudsakliga användning bör vara till att planera de studier sombehövs för att med rimlig noggrannhet fastställa kolflödet i sjöarna så att pålitliga risk-analyser för radionuklider kan göras.

7
Contents
Page
1 Introduction 9
2 Description of the area 11
3 Construction of the food web 15
4 The carbon budget 194.1 Initial considerations and calculations 19
4.1.1 Macrophytes 204.1.2 Phytoplankton 214.1.3 Microphytobenthos 214.1.4 Epiphytic bacteria 224.1.5 Bacterioplankton 224.1.6 Benthic bacteria 224.1.7 Zooplankton 234.1.8 Benthic fauna 234.1.9 Higher organisms 24
4.2 Calculated carbon biomass in habitats and motile biota 244.3 Distribution of biomass and production of carbon among
functional groups 244.4 Flow of carbon 27
5 Discussion 33
6 Acknowledgements 35
7 References 37
9
1 Introduction
The Swedish Nuclear Fuel and Waste Management Co (SKB) is responsible formanagement and disposal of Swedish radioactive waste. The company is planning toconstruct deep repositories, which will keep the radioactive waste away from humansthrough hundreds of thousands of years. One of the possible sites for the repositories isthe Forsmark area. Already, a storage for low and intermediate level radioactive waste,SFR, is situated near the nuclear plant in Forsmark. At the moment this storage issituated below the bottom of the sea. In the future, however, this area will rise and,around year 3500 AD, the land above the storage will be dry /Brydsten, 1999/. In caseof a hypothetical release of radionuclides, it is important to understand how thesurrounding ecosystems function to be able to make risk assessments for humans.
14C would by dose be the dominant radionuclide released from the SFR storage and,hence, it is important to know the flow of carbon through the ecosystems in the area. Acarbon budget gives a picture of the importance of different organism groups and howcarbon is transported from lower trophic levels to higher trophic levels in the food web.A carbon budget for the area above the SFR, the Öresundsgrepen, has been done /Kum-blad, 1999/. However, in the future the SFR will be situated above sea level and thehence it is important to evaluate also ecosystems above sea level.
The Forsmark area is characterised by forested lowland with several short rivers ofwhich Forsmarksån is by far the largest (40 km long, 375km2 catchment area). Oligo-trophic hardwater lakes constitute the most important lake type in the area today/Brunberg and Blomqvist, 1998/. These lakes are young and have been created by theshore displacement that has been going on since the last glaciation which terminated8800 years ago /Ignatius et al., 1981/. In the future more lakes and new catchment areaswill be formed in the area by the same process.
Two structurally different oligotrophic hardwater lake ecosystems of approximately thesame age were chosen for carbon budget calculations; Lake Hällefjärd being surroundedby mire and Lake Eckarfjärden being surrounded by forest. The horizontal growth ofmires around some lakes will most likely influence the ontogeny of the entire lake eco-system /Brunberg and Blomqvist, 2000/. To illustrate potential differences betweenoligotrophic hardwater lakes surrounded by mire and those surrounded by forest interms of flow of nutrients and energy through the systems, one representative of eachtype were chosen.
Very few studies of the limnology of these lakes have been carried out and consequentlyonly limited amounts of data are available. The carbon budget is, as far as possible,based on biomass values and carbon flows between functional groups in the lakes.When data were lacking, biomass values from similar lakes were used.

11
2 Description of the area
The two oligotrophic hardwater lakes chosen for the budget calculations, Lake Hälle-fjärd and Lake Eckarfjärden, are situated in the province Uppland, central Sweden,close to the Baltic Sea. Since the depression during the last glaciation the area has beenrising gradually and currently the land rise is about half a meter per century /Ignatius etal., 1981/. The bedrock mainly consists of granites and gneisses. The overlaying glacialand postglacial soils are calcium-rich till and glacial and post-glacial clay respectively,which results in surface waters being highly alkaline.
Lake Hällefjärd is a small lake with a total lake area of 0.05 km2 (Table 2-1). It issituated in the county Tierp (60°30.6'N, 17°57.3'E) at 4 m above the sea level. Theaverage depth is 0.9 m and the maximum depth is 1.5m. Lake Hällefjärd has a volumeof 200 000 m3 and the theoretical residence time of the water is 63 days. The catchmentarea of the lake is 0.5 km2 and is mainly made up by forest (77.3%) of which a smallpart, 3.6%, has recently been clear-cut. The lake is surrounded by mire, which consti-tutes 18.1% of the catchment area. Phragmites is covering a large part of the mire.There are no visible inlets to the lake. The northern part of the mire close to the outlethas been partly drained, but no effect of this drainage on the lake ecosystem has beendiscovered. Because of the low degree of anthropogenic influence, Lake Hällefjärd hasbeen considered to have the highest value in different biological conservation surveys/Haglund, 1972; Länsstyrelsen i Uppsala län, 1987; Naturvårdsverket, 1999/. Both poolfrog (Rana leesonae) and medicinal leech (Hirudo medicinalis), which are endangeredspecies in Sweden are found in the lake. The mire contains many different species ofrare herbs and a number of birds are stationary in the area.
Lake Eckarfjärden is larger than Lake Hällefjärd but still a small lake with an area of0.23 km2 (Table 2-1). It is situated 2 km East of Forsmark in the county Östhammar(60°22'N, 18°12'E) at 6 meters above the sea level. The average depths is 1.5 m and themaximum depth is 2.6 m. The volume of the lake is 350 000 m3 and the theoreticalresidence time of the water is 383 days. The catchment area is 1.51 km2 and is domi-nated by forest which make up 73% /Brunberg and Blomqvist, 1998/. The lake makesup 15%, wetlands 7% and arable and pastureland 5% of the catchment area /Brunbergand Blomqvist, 1998/. The lake is surrounded by forest and not by mire as Lake Hälle-fjärd. However, the outlet passes through a small mire. The outlet has been subjected todrainage and the lake level has been slightly lowered. Otherwise there are no visiblesigns of human impact on the lake.
Table 2-1. Area, depth, volume, residence time and catchment area of Lake Hällefjärd andLake Eckarfjärden.____________________________________________________________________________________
Lake Mean Max. Volume Residence Catchmentarea depth depth time area(km2) (m) (m) (m3) (days) (km2)
____________________________________________________________________________________
Lake Hällefjärd 0.05 0.9 1.5 200 000 63 0.5
Lake Eckarfjärden 0.23 1.5 2.6 350 000 383 1.51____________________________________________________________________________________
12
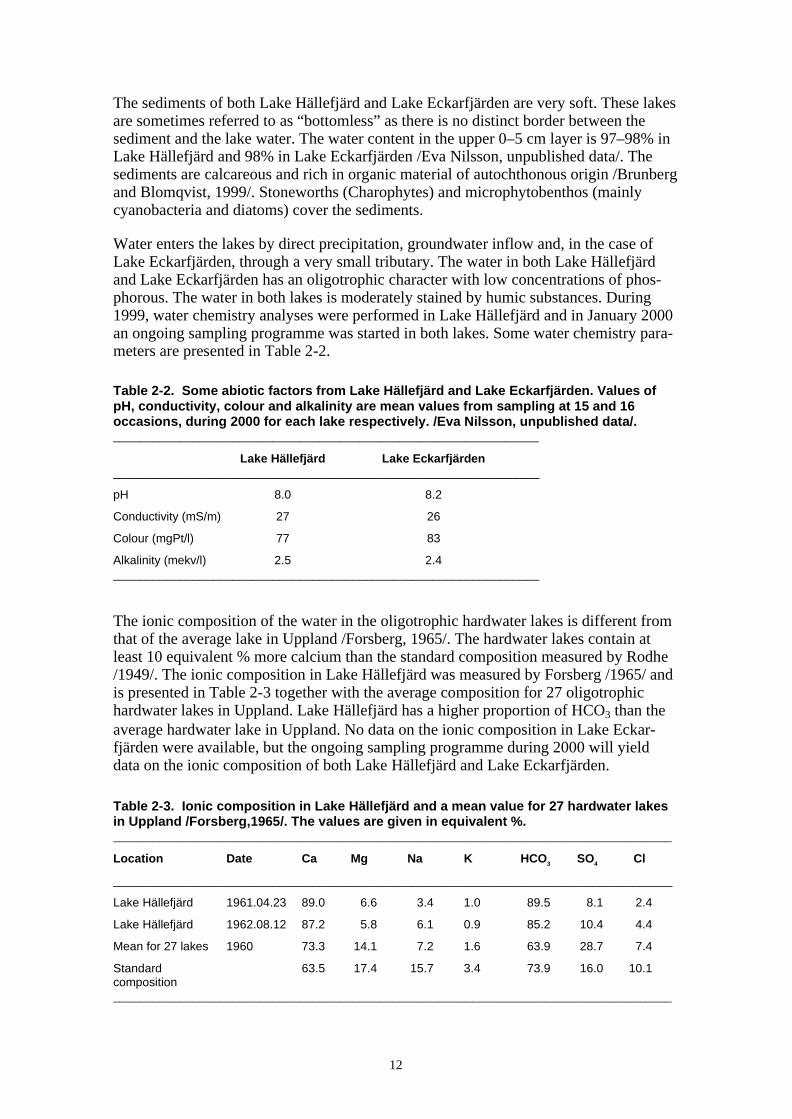
The sediments of both Lake Hällefjärd and Lake Eckarfjärden are very soft. These lakesare sometimes referred to as “bottomless” as there is no distinct border between thesediment and the lake water. The water content in the upper 0–5 cm layer is 97–98% inLake Hällefjärd and 98% in Lake Eckarfjärden /Eva Nilsson, unpublished data/. Thesediments are calcareous and rich in organic material of autochthonous origin /Brunbergand Blomqvist, 1999/. Stoneworths (Charophytes) and microphytobenthos (mainlycyanobacteria and diatoms) cover the sediments.
Water enters the lakes by direct precipitation, groundwater inflow and, in the case ofLake Eckarfjärden, through a very small tributary. The water in both Lake Hällefjärdand Lake Eckarfjärden has an oligotrophic character with low concentrations of phos-phorous. The water in both lakes is moderately stained by humic substances. During1999, water chemistry analyses were performed in Lake Hällefjärd and in January 2000an ongoing sampling programme was started in both lakes. Some water chemistry para-meters are presented in Table 2-2.
Table 2-2. Some abiotic factors from Lake Hällefjärd and Lake Eckarfjärden. Values ofpH, conductivity, colour and alkalinity are mean values from sampling at 15 and 16occasions, during 2000 for each lake respectively. /Eva Nilsson, unpublished data/.________________________________________________________________
Lake Hällefjärd Lake Eckarfjärden________________________________________________________________
pH 8.0 8.2
Conductivity (mS/m) 27 26
Colour (mgPt/l) 77 83
Alkalinity (mekv/l) 2.5 2.4________________________________________________________________
The ionic composition of the water in the oligotrophic hardwater lakes is different fromthat of the average lake in Uppland /Forsberg, 1965/. The hardwater lakes contain atleast 10 equivalent % more calcium than the standard composition measured by Rodhe/1949/. The ionic composition in Lake Hällefjärd was measured by Forsberg /1965/ andis presented in Table 2-3 together with the average composition for 27 oligotrophichardwater lakes in Uppland. Lake Hällefjärd has a higher proportion of HCO3 than theaverage hardwater lake in Uppland. No data on the ionic composition in Lake Eckar-fjärden were available, but the ongoing sampling programme during 2000 will yielddata on the ionic composition of both Lake Hällefjärd and Lake Eckarfjärden.
Table 2-3. Ionic composition in Lake Hällefjärd and a mean value for 27 hardwater lakesin Uppland /Forsberg,1965/. The values are given in equivalent %.____________________________________________________________________________________
Location Date Ca Mg Na K HCO3 SO4 Cl
____________________________________________________________________________________
Lake Hällefjärd 1961.04.23 89.0 6.6 3.4 1.0 89.5 8.1 2.4
Lake Hällefjärd 1962.08.12 87.2 5.8 6.1 0.9 85.2 10.4 4.4
Mean for 27 lakes 1960 73.3 14.1 7.2 1.6 63.9 28.7 7.4
Standard 63.5 17.4 15.7 3.4 73.9 16.0 10.1composition____________________________________________________________________________________

13
During winter, the lakes in this area are covered with ice for 140–160 days fromNovember to April /Eriksson, 1920/. In Eckarfjärden there is a low risk for oxygendeficiency below the ice /Brunberg and Blomqvist, 2000/. For Lake Hällefjärd nostudies of oxygen deficiency has been made. However, preliminary studies of oxygenconcentrations during 2000 did not show any oxygen deficiency this year.
Both lakes are shallow and have limited volumes of water, and hence the water warmsup quickly during summer. In the summer of 2000 the temperature rose above 20°C inboth lakes. The annual mean temperature in the area is 5.8°C. Because of the smalldepth it is unlikely that any thermoclines are formed.
15
3 Construction of the food web
In general terms, the carbon that flows through the organisms in a food web finally endsup in the organisms at the highest trophic levels in the system. By understanding thestructure of the food web as well as the production, respiration and consumption ofdifferent organism groups it is possible to calculate the flow of carbon. In lakes, carbonis mobilised by two different processes at the base of the food web. First of all, organiccarbon can be produced within the lakes by photosynthetic organisms (autochthonouscarbon). Alternatively, carbon which enters the lake via the inflows, allochtonous orga-nic carbon, can be incorporated into the food web by heterotrophic bacteria. Tradi-tionally, lakes have been considered net autotrophic systems where the autochthonousprimary production exceeds or equals the respiration. However, recent findings suggestthat lakes may be net sources of CO2 /Cole et al., 1994/ and that bacterial respiration ofallochtonous carbon exceeds primary production in many lakes /del Giorgio et al.,1997/.
Photosynthetic organisms use carbon dioxide, nutrients and solar energy to produceorganic carbon. Primary producers in lakes include phytoplankton, macrophytes,epiphytic algae and microphytobenthos. Bacteria use dissolved organic carbon (DOC)for their production and this carbon may be supplied from allochtonous or autoch-thonous sources. The bacteria in lakes are present in the pelagial, in the sediments andon macrophytes.
Zooplankton, benthic fauna and fish consume the carbon produced by primary pro-ducers and bacteria at the base of the food web. Animals that feed exclusively onautotrophs are termed herbivores. Some feed on other animals and are termed carni-vores. Still others feed on both autotrophs and other animals and are called mixotrophs.When the consumers are foraging, some carbon is lost due to respiration, excudation,and sloppy feeding. The carbon that is lost in the food chain may be used again byautotrophs as well as by bacteria.
Carbon is transported from the primary producers in several steps. An animal eating anautotroph is a primary consumer. The animal feeding on the primary consumer is asecondary consumer, and so on. The autotrophs and consumers constitute differenttrophic levels in the food web, i.e. the primary producers are the first trophic level, theprimary consumers are the second trophic level, the secondary consumers are the thirdtrophic level, and so on. However, the food web is seldom simple and animals oftenforage at more than one trophic level.
In this study the organisms has been divided into functional groups mainly in accord-ance with Kumblad /1999/, who constructed a carbon budget for a nearby brackishwater ecosystem in Öresundsgrepen. The organisms were divided on the basis of theirfood source and their function in the ecosystem. Below follows a list of the functionalgroups as well as a brief definition of the organisms included.

16
• Phytoplankton: pelagic microalgae and cyanobacteria.
• Microphytobenthos: microalgae and cyanobacteria on the bottom of the lakes.
• Macrophytes: macroalgae, higher plants, bryophytes and epiphytic algae.
• Bacterioplankton: pelagic heterotrophic bacteria.
• Zooplankton: pelagic animals.
• Benthic bacteria; heterotrophic bacteria in the sediments and on the bottom of lakes.
• Benthic fauna: invertebrate fauna in/on the sediment and associated to macrophytes.
• Fish.
The ecosystem of oligotrophic hardwater lakes may be divided into three characteristichabitats, the pelagic habitat, the emergent macrophyte habitat, and the light exposedsoft-bottom habitat /Brunberg and Blomqvist, 1999/. Since the lakes are shallow, lightreaches the entire bottom and there is no profundal zone. The division has been used inthe calculations to determine in which habitat of the lake ecosystem production andconsumption is highest. In this report calculations for the emergent macrophyte zonehas not been included. Sphagnum makes up a large part of the emergent macrophytezone and enters into the surrounding mire. It is difficult to determine were the emergentmacrophyte zone ends and where the surrounding mire begins and in this report theemergent macrophyte zone has been included in the surrounding mire in the calcula-tions. Higher organisms that move freely between the habitats (i.e. fish) were treatedseparately.
The benthic soft bottom habitat in the oligotrophic hardwater lakes is believed to be themost important part of the lake in terms of primary production /Brunberg and Blom-qvist, 1999/. The functional groups found in this habitat are microphytobenthos, macro-phytes, epiphytic bacteria, benthic fauna and benthic bacteria.
The pelagic habitat in hardwater lakes such as Lake Hällefjärd and Lake Eckarfjärden isprobably not very productive, since most of the production in such lakes is believed tobe allocated to the bottoms and the nutrient concentrations in the water are low /Brun-berg and Blomqvist, 2000/. Functional groups in this habitat include phytoplankton,bacterioplankton and zooplankton.
Sphagnum and/or Phragmites dominate the emergent macrophyte zone in lakes in theForsmark area. Mires often encircle the entire lakes, which is the case for Lake Hälle-fjärd. The mire forms a floating edge, a quagmire, into the lake and Sphagnum is thedominating species. Sphagnum is known to sieve the inflowing water to the lake and tofunction as a cation exchanger releasing hydrogen ions for other ions /e.g. Clymo, 1963;Clymo, 1964/. Water is probably entering the lake through the mire and if so, Sphagnumis most likely also important in determining how much organic carbon that reaches thelake. It is possible that the Sphagnum mire is releasing dissolved organic carbon (DOM)produced by Sphagnum but it is also possible that the bacterial microflora within themire takes up the DOM in the passing water. Lake Eckarfjärden lacks surrounding mire.Instead the emergent macrophyte zone is dominated by Phragmites.
The higher trophic levels that can move freely between the habitats include fish andbirds. Fish can feed both from the pelagic and the light exposed soft-bottom habitat. Inthis kind of oligotrophic lake, where most of the biomass is concentrated to the bottoms,it is reasonable to believe that fish are mainly foraging from the benthic community.

17
Macrophyte vegetation in lakes increases the amount of food for birds /Blindow, 1986/.Birds can feed either on the macrophytes, on the invertebrates living on the plants, or onfish. The concentration of invertebrates is high on Chara and since the bottoms of oligo-trophic hardwater lakes usually are covered with Chara, they are regarded as good birdlocations /Blindow, 1986/.
19
4 The carbon budget
4.1 Initial considerations and calculationsAs far as possible, in the budget calculations presented below, values of biomass,production, respiration and consumption of organisms in Lake Hällefjärd and LakeEckarfjärden, collected from the literature, were used. When values were not available,data from similar lakes were chosen. If possible, mean values of biomass for the entireyear were used, but in most cases, only biomass values from summer studies were avail-able. Biomass values in terms of wet or dry weight were converted to carbon usingconversion factors for different groups of organisms obtained from Kautsky /1995 a/. Ina majority of cases, only biomass values were available, and were used to calculateproduction, respiration and consumption according to Kautsky /1995 b/. Biomass andproduction of benthic bacteria were taken from Törnblom /1995/. Epiphytic algal bio-mass and production were assumed to be included in the macrophyte biomass and pro-duction. Data on fish biomass for Lake Eckarfjärden were available as catch per uniteffort (CPUE) /Brunberg and Blomqvist, 1999/. These values were calculated to g car-bon in the lake with a conversion factor of 33kg ⋅ ha-1 per 1 CPUE /Nyberg, personalcommunication/. Fish were assumed to contain 10% carbon. No data of fish biomasswere available for Lake Hällefjärd. Instead, a mean value for six oligotrophic hardwaterlakes in Uppland /Brunberg and Blomqvist, 1999/ was used.
When only summer values of production and respiration were available, they werecorrected for the difference in solar radiation and temperature to get values representingthe annual production and respiration. The primary production was assumed to bedependent on solar radiation and the calculation includes number of light days, which isthe number of days when the relative insolation exceeds 5 MJ ⋅ m-2 ⋅ day-1. At 60°N, thelatitude where Lakes Hällefjärd and Eckarfjärden are situated, the number of light dayswas estimated to 105 using data from the Baltic Sea /Kautsky and Kautsky, 1995/. Thisvalue was corrected by the authors for the reduction in insolation that the ice coverresults in. However, such a reduction in light due to icecover in Lake Hällefjärd andLake Eckarfjärden is not possible to calculate since no data are available of the thick-ness of the icecover during the winter season. Therefore, the number of light days in theBaltic Sea at the same latitude was assumed to be identical to the number of light daysin lake Hällefjärd and Lake Eckarfjärden. The respiration of animals was compensatedfor temperature differences and the annual degree days were estimated to 2400°C at60°N /Kautsky and Kautsky, 1995/.
Calculations for biomass, primary production, respiration and consumption
• biomass (gC ⋅ m-2) = dry weight ⋅ value for carbon content in theorganism/Kautsky, 1995 a/,
• biomass Fish (kgC ⋅ m-2) = CPUE ⋅ 33kg ⋅ ha-1 ⋅ lake area ⋅ 0.10,
• primary production (gC ⋅ m-2 ⋅ year-1)= biomass ⋅ conversion factor for primaryproduction /Kautsky, 1995 b/ ⋅ annual lightdays,
20
• bacterial production (gC ⋅ lake-1 ⋅ year-1)= (30.16 µgC ⋅ gsediment
-1 ) ⋅ days,
• respiration (gC ⋅ m-2 ⋅ year-1) = biomass ⋅ conversion factor for respiration/Kautsky, 1995 b/ ⋅ degree days,
• consumption (benthic and pelagic bacteria) = production + respiration,
• consumption (zooplankton, benthic fauna and fish) = 3 ⋅ respiration.
Very few studies have been performed in the oligotrophic hardwater lakes and no dataare available of how much dissolved organic carbon (DOC), dissolved inorganic carbon(DIC) and particulate organic carbon (POC) that reaches the lakes. However, to be ableto calculate the amount of DOC, DIC and POC that reaches the lake, the flow of waterand the ability of the mire to retain carbon must be known. No studies have been madeof the water flow to Lake Hällefjärd or Lake Eckarfjärden and neither is the carbonretention of the mire known. Therefore, the amount of carbon reaching the lake from theemergent macrophyte community could not be calculated. However, a calculation wasmade of how much TOC that theoretically has to reach the lake with the inflowingwater to balance the budget.
Since data on the carbon biomass, production, respiration and consumption for differentfunctional groups only occasionally were available from Lake Hällefjärd and LakeEckarfjärden and mostly taken from other lakes, a more detailed explanation of whichvalues were used for the different functional groups is given below.
4.1.1 Macrophytes
Characeans, mainly Chara aculeolata but also Chara aspera and Chara globulariscover most of the bottom in Lake Hällefjärd /Forsberg, 1965/. Lake Eckarfjärden is alsoa Chara lake but there are no data available of the percentage cover of Chara. In bothlakes Phragmites is also found but no data of biomass are available. Since no quantita-tive data were available for the biomass of the macrophytes in neither Lake Hällefjärdnor Lake Eckarfjärden, values from the Chara Lake Krankesjön in southern Swedenwere used. In a study of the macrophyte cover in June to September 1989, the biomassof Chara was 478±115 g dry weight m-2 and the biomass of Potamogeton was 73±10 gdry weight ⋅ m-2 /Blindow, 1992/. Together with the lake area of each lake these valueswere used to calculate the carbon biomass for the entire lakes. This gives a gross esti-mation of how large the biomass of macrophytes in the two lakes may be. Of course thebiomass may differ between lakes and further studies are needed to confirm the largepercentage of biomass and production that Chara was calculated to make up in thisstudy.
Epiphytic algal biomass and production were assumed to be included in the macrophytebiomass and primary production.

21
4.1.2 Phytoplankton
Phytoplankton were studied in Hällefjärd during the summer 1999 /Halvarsson, 2001/.The biomass value used in this carbon budget is the mean value from six samplingsduring the summer 1999. Samples were taken 23 June, 7 and 20 July, 5 and 17 Augustand 9 September. The biomass values from Lake Hällefjärd were also used for LakeEckarfjärden. Forsberg /1965/ noted that the phytoplankton biomass in Lake Sigge-forasjön in Uppland were of the same order of magnitude as those in the oligotrophichardwater lake Långsjön. All the oligotrophic hardwater lakes seem to have a smallphytoplankton biomass and they can probably be assumed to be of the same order ofmagnitude. Phytoplankton production was calculated with conversion factors fromKautsky /1995 b/.
4.1.3 Microphytobenthos
The biomass of microphytobenthos was studied in Lake Hällefjärd during 1999/Halvarsson, 2001/. In that study, the biomass of microphytobenthos was generallyfound to be much larger than the biomass of phytoplankton (Figure 4-1) and thebiomass increased considerably during the summer. No data were available of micro-phytobenthos biomass or production in Lake Eckarfjärden and on production in LakeHällefjärd. Lundqvist /1925/ who studied the oligotrophic hardwater lakes claimed thatthe biomass of microphytobenthos was mainly made up by cyanobacteria and diatoms.
Since no data were available on the productivity of microalgae in the lakes, the cal-culations had to be based on literature data. The production of microphytobenthos hasnot been well studied in freshwater and, hence no good lake data were available forbudget calculations. However, studies of marine microphytobenthos have shown that
Figure 4-1 Biomass of microphytobenthos and phytoplankton in Lake Hällefjärd during 1999/Halvarsson, 2001/. The microphytobenthos were sampled from the top 5 cm of the sediment and thebiomass for the whole lake has been calculated by multiplication with the lake area.
Phytoplankton and microphytobenthos biomass in Lake Hällefjärd 1999.
0
50
100
150
200
250
1999-06-23 1999-07-20 1999-09-04
Date
kgC
Phytoplankton
Microphytobenthos
22
the benthic primary production can exceed the primary production of the integratedwater column both on shallow /Barranguet et al., 1996; Carmouze et al., 1998/ and ondeep (14–40m) locations /Cahoon and Cooke, 1992/. In marine studies inorganicnutrients has been shown to limit for the growth of microphytobenthos /Nilsson et al.,1991/. If groundwater is entering the oligotrophic hardwater-lake there is probably agood source of inorganic nutrients to provide large production. Light may also belimiting for the growth of microphytobenthos but Sundbäck et al., /1996/ showed thatthe benthic communities seem to be adapted to low light intensities. In this carbonbudget, production values for filamentous algae in the Baltic Sea /Kautsky, 1995 b/were used. The result is in the same order of magnitude as when microphytobenthosvalues from the Danish Wadden Sea are used /Grøntdev, 1962/.
4.1.4 Epiphytic bacteria
No values were available for the biomass or production of epiphytic bacteria from LakeHällefjärd or Lake Eckarfjärden. Neither were biomass values found for epiphyticbacteria from other Chara lakes. However, epiphytic bacterial biomass and productionmay be high. In Lake Dystrup in Denmark, with a 95% cover of macrophytes, theepiphytic bacterial biomass was 7-fold higher than the pelagic bacterial production/Theil-Nielsen and Søndergaard, 1995/. Since the bottom of both Lake Hällefjärd andLake Eckarfjärden is covered with Chara, values from Lake Dystrup were assumed tobe applicable even for Lake Hällefjärd and Lake Eckarfjärden. Biomass of 0.33 gC ⋅ m-2
were used and the production were assumed to be 7 times the pelagic bacterial pro-duction.
4.1.5 Bacterioplankton
No data were available on the biomass or production of bacterioplankton in either LakeHällefjärd or Lake Eckarfjärden. Brunberg and Blomqvist /1999/ speculated that thebacterioplankton production should be of equal to or larger than the phytoplanktonproduction, because dissolved organic carbon present in high concentrations in the lakesin the form of allochtonous substances. In some lakes, bacterioplankton are dependenton the phytoplankton for dissolved organic carbon but this is most likely not the case inthe oligotrophic hardwater lakes where bacterioplankton may rely on humic substancesas carbon source.
Values on bacterioplankton biomass were taken from Lake Njupfatet, an oligotrophicclearwater lake in northern part of Sweden /Vrede, 1997/. The production of bacteriawas assumed to be of the same magnitude as the phytoplankton production in this study.
4.1.6 Benthic bacteria
No studies on benthic bacterial biomass or production in Lake Hällefjärd or LakeEckarfjärden were available. The biomass of benthic bacteria is generally high and theiractivity is also high compared to that in the water column /Doremus and Clesceri,1982/. The benthic bacterial biomass in sediments does not vary much between sedi-ments, ranging between 108 and 1010 cells ⋅ cm-3 in both marine and freshwater sedi-ments /Schallenberg et al., 1989/. Also, the number of bacteria in the sediment varieslittle both within and between years /Boström et al., 1989/. No good correlation hasbeen found between the bacterial biomass and the bacterial production /van Duyl and

23
Kop, 1990; Nilsson et al., 1991; Brunberg, 1993/. This may be due to the fact that alarge amount of the bacteria are inactive /Boström and Törnblom, 1990/.
In the oligotrophic hardwater lakes the bacterial biomass and production may be smalldue to competition with the microphytobenthos for inorganic nutrients but they mayalso be favoured by the presence of microphytobenthos which provide them a readilyavailable carbon source. The sediment of Lake Hällefjärd and Lake Eckarfjärden oughtto be highly organogenic due to the large amount of microphytobenthos. Therefore,values of benthic bacterial biomass and production were taken from a study in Vallen-tunasjön, in which the sediments also are highly organogenic /Törnblom, 1995/. In thatstudy, the bacterial biomass was measured from October 1988 to November 1989 andthe mean value of biomass (2921 µg C ⋅ gsediment
-1) was used to calculate the bacterialbiomass in Lake Hällefjärd and Lake Eckarfjärden. The density of the sediment of LakeHällefjärd and Lake Eckarfjärden was assumed to be 1 g ⋅ cm-3, which is the density ofwater. This value was chosen due to the high water content of the sediments, recordedin the hardwater lakes /Eva Nilsson, unpublished data/. A layer of 1 cm was used in thecalculation of biomass and production. Also benthic bacterial production was estimatedusing data from the study of Törnblom /1995/.
4.1.7 Zooplankton
Since phytoplankton biomass and production in the oligotrophic hardwater lakes aregenerally low, the biomass and production of zooplankton should also be low (e.g.McCauley and Kalff, 1981/. No data were available on zooplankton biomass in lakesHällefjärd an Eckarfjärden. Since zooplankton are feeding on phytoplankton, phyto-plankton populations of equal size could be assumed to provide the same size of zoo-plankton populations. Of course there can be differences between different zooplanktonpopulations and different species in their need of food. Zooplankton values from Sigge-forasjön are available for the entire year, and since the phytoplankton population ofSiggforasjön was of equal size as those in oligotrophic hardwater lakes, values fromLake Siggeforasjön were used in this carbon budget as a gross estimate. The mean value77 µg C ⋅ 1-1 from a study 1996 to 1997 in Lake Siggeforasjön /Lindström,1998/ waschoosen for both Lake Hällefjärd and Lake Ecklarfjärden.
4.1.8 Benthic fauna
No studies were available on the biomass or composition of benthic fauna in the oligo-trophic hardwater lakes in Uppland. However, Lundqvist /1925/ noted high amounts ofChironomid tubes in some of the oligotrophic hardwater lakes. In a study in LakeKrankesjön in southern Sweden the biomass of macroinvertebrates on Chara,Potamogeton and bare sediment was studied /Hargeby et al., 1994/. It was found thatthe invertebrate biomass was larger on Chara. Chara is usually not fed upon by benthicanimals but provide a good substrate for benthic fauna which use the vegetation as ashelter from predators and they also feed on the epiphytic algae and bacteria /Blindow,1986/. Values from Lake Krankesjön were used to calculate the biomass of benthicfauna in Lake Hällefjärd and Lake Eckarfjärden assuming that the whole lake area iscovered with Chara. Since only macroinvertebrates were considered in this study it mayhave lead to an underestimation of the biomass, respiration and consumption of benthicfauna. In Chara lakes in northern Norway the densities of benthic fauna were studiedand were found to range between 8–10g dry weight ⋅ m-2 /Fjeldsa, 1977/. Using thisvalue would result in slightly higher biomass value for the lakes than using those from
24
Lake Krankesjön. However, since data from Lake Krankesjön have been used for othergroups of organisms it seems reasonable to use them also for benthic fauna.
4.1.9 Higher organisms
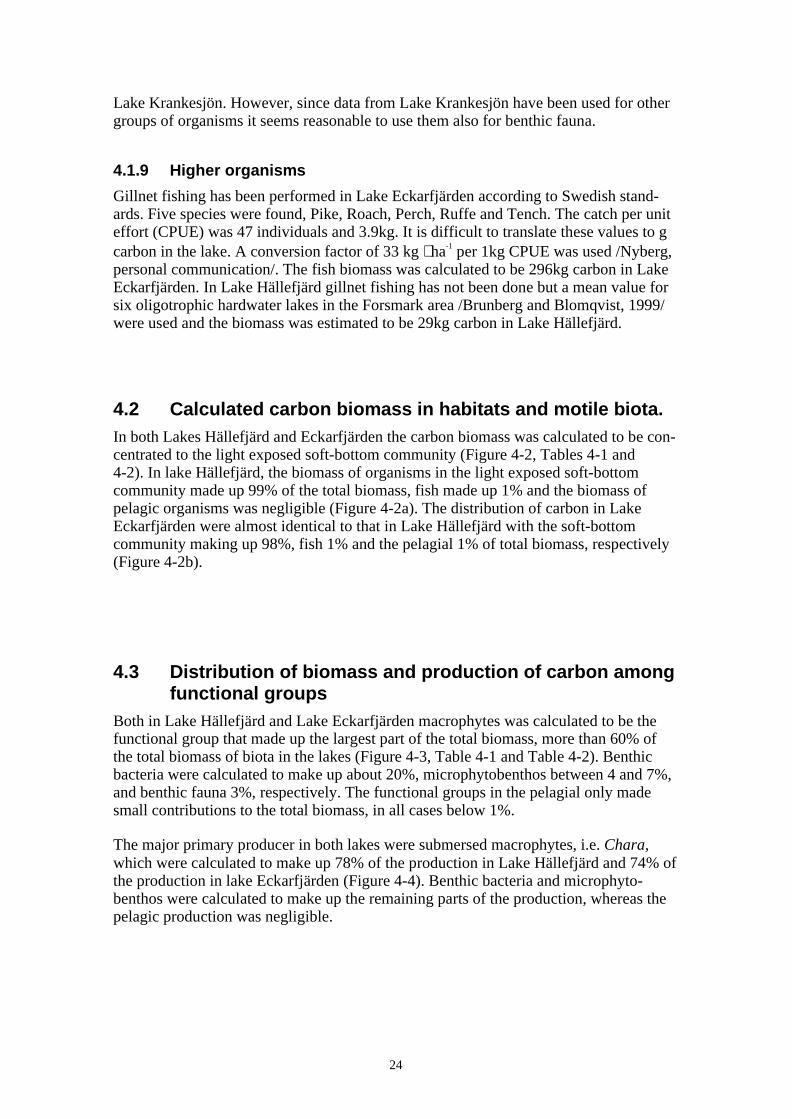
Gillnet fishing has been performed in Lake Eckarfjärden according to Swedish stand-ards. Five species were found, Pike, Roach, Perch, Ruffe and Tench. The catch per uniteffort (CPUE) was 47 individuals and 3.9kg. It is difficult to translate these values to gcarbon in the lake. A conversion factor of 33 kg ⋅ ha-1 per 1kg CPUE was used /Nyberg,personal communication/. The fish biomass was calculated to be 296kg carbon in LakeEckarfjärden. In Lake Hällefjärd gillnet fishing has not been done but a mean value forsix oligotrophic hardwater lakes in the Forsmark area /Brunberg and Blomqvist, 1999/were used and the biomass was estimated to be 29kg carbon in Lake Hällefjärd.
4.2 Calculated carbon biomass in habitats and motile biota.In both Lakes Hällefjärd and Eckarfjärden the carbon biomass was calculated to be con-centrated to the light exposed soft-bottom community (Figure 4-2, Tables 4-1 and4-2). In lake Hällefjärd, the biomass of organisms in the light exposed soft-bottomcommunity made up 99% of the total biomass, fish made up 1% and the biomass ofpelagic organisms was negligible (Figure 4-2a). The distribution of carbon in LakeEckarfjärden were almost identical to that in Lake Hällefjärd with the soft-bottomcommunity making up 98%, fish 1% and the pelagial 1% of total biomass, respectively(Figure 4-2b).
4.3 Distribution of biomass and production of carbon amongfunctional groups
Both in Lake Hällefjärd and Lake Eckarfjärden macrophytes was calculated to be thefunctional group that made up the largest part of the total biomass, more than 60% ofthe total biomass of biota in the lakes (Figure 4-3, Table 4-1 and Table 4-2). Benthicbacteria were calculated to make up about 20%, microphytobenthos between 4 and 7%,and benthic fauna 3%, respectively. The functional groups in the pelagial only madesmall contributions to the total biomass, in all cases below 1%.
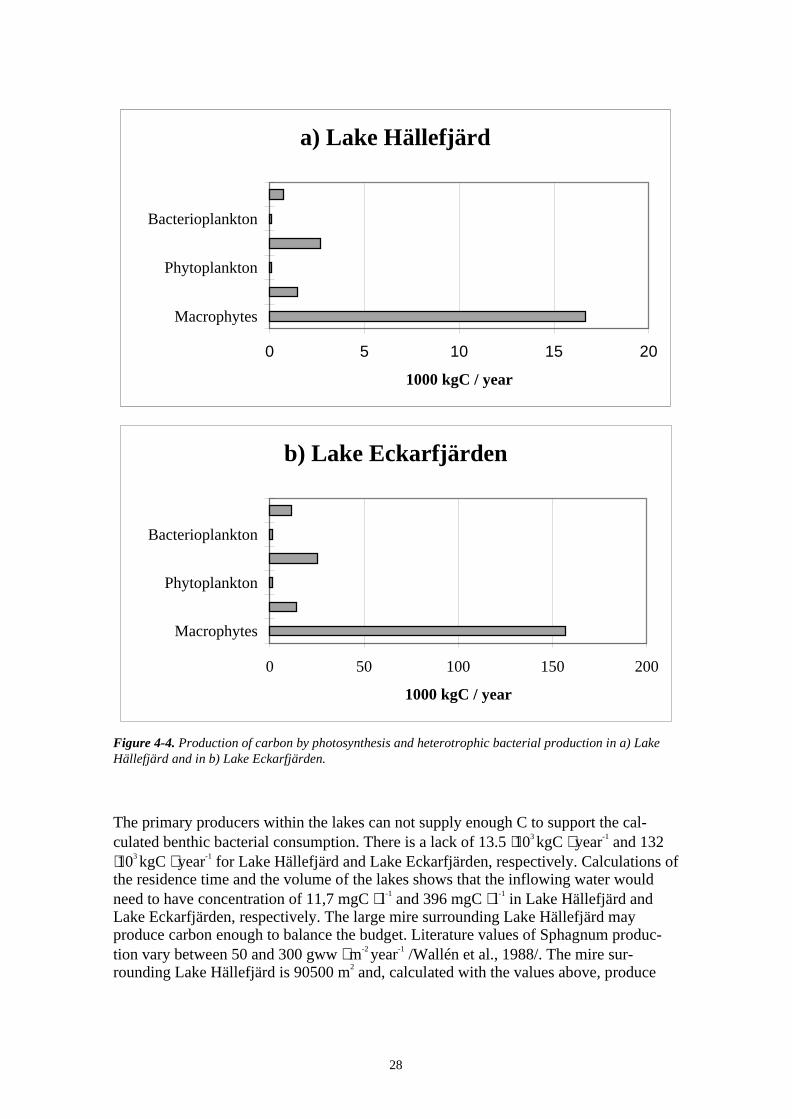
The major primary producer in both lakes were submersed macrophytes, i.e. Chara,which were calculated to make up 78% of the production in Lake Hällefjärd and 74% ofthe production in lake Eckarfjärden (Figure 4-4). Benthic bacteria and microphyto-benthos were calculated to make up the remaining parts of the production, whereas thepelagic production was negligible.

25
Figure 4-2. Distribution of biomass between the pelagic and light exposed soft-bottom community andfish in a) Lake Hällefjärd and b) Lake Eckarfjärden.
Table 4-1. Biomass, production, respiration and consumption of different organismgroups in Lake Hällefjärd._________________________________________________________________________________
Functional groups Biomass Prod Respiration Consump. Sec. cons. Source andkgC 1000 kgC 1000 kgC 1000 kgC 1000 kgC location
⋅ year-1 ⋅ year-1 ⋅ year-1 ⋅ year-1
_________________________________________________________________________________
Phytoplankton 10 0.1 – – – 1
Microphytobenthos 140 1.4 – – – 1
Macrophytes 2149 16.6 – – – 2
Bacterioplankton 1 0.1 0.1 0.2 0.1 3,4
Benthic bacteria 712 2.6 118 121 3 5
Epiphytic bacteria 4 0.7 0.7 3.4 2.7 6
Zooplankton 2 – 0.5 1.4 0.9 7
Benthic fauna 88 – 6 18 12 8
Fish 29 2 7 5 9
Total 3131 21 127 148 21
__________________________________________________________________________________
Source and location:
1. Halvarsson, 2001; Lake Hällefjärd.2. Blindow, 1992: Lake Krankesjön.3. Vrede, 1997: Lake Njupfatet.4. Brunberg and Blomqvist, 1999.5. Törnblom, 1995: Lake Vallentunasjön.6. Theil-Nielsen and Søndergaard, 1995: Lake Dystrup.7. Lindström, 1998: Lake Siggeforasjön.8. Hargeby et al., 1994: Lake Krankesjön.9. Nyberg /personal comment/.
a) Lake Hällefjärd
Fish1%
The Pelagic community
0%
The light exposed soft-
bottom community
99%
b) Lake Eckarfjärden
The light exposed soft-
bottom community
98%
The pelagic community
1%
Fish1%

26
Figure 4-3. Carbon distribution among living organisms in a) Lake Hällefjärd and b) Lake Eckarfjärden.
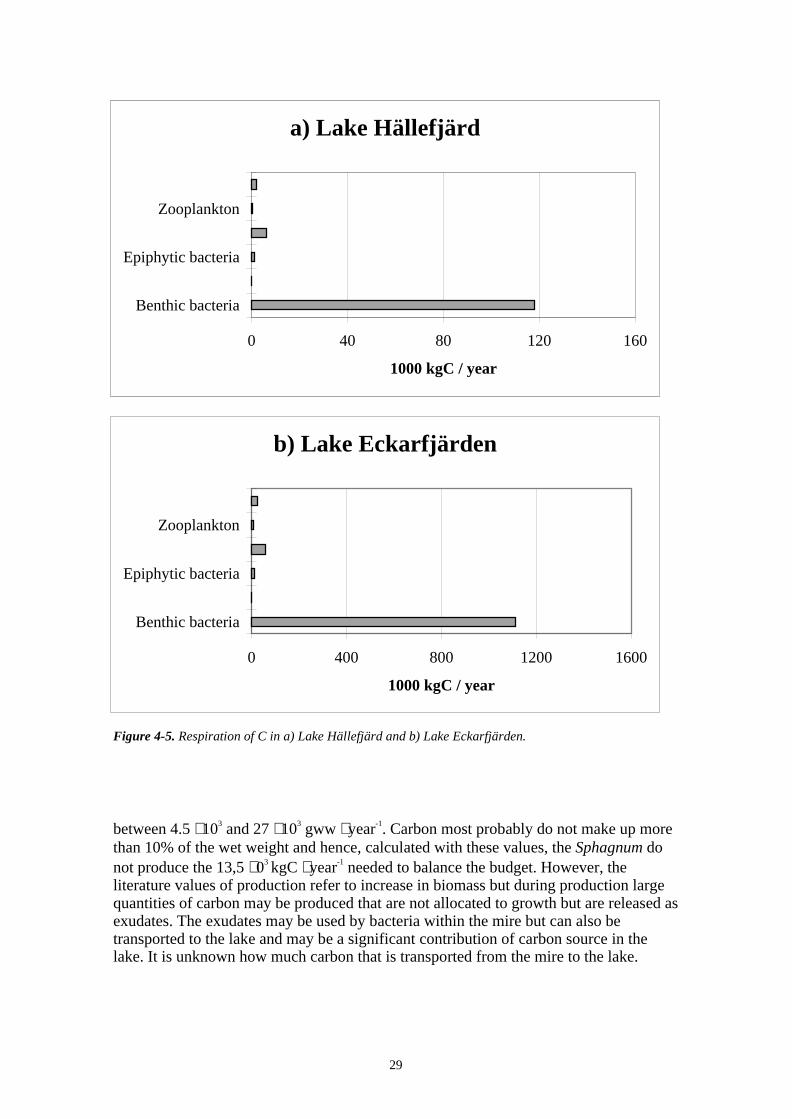
Carbon respiration was calculated to be almost exclusively allocated to benthic bacteriain both lakes (Figure 4-5). The benthic bacteria were found to make up 92% and 91% ofthe total respiration in Lake Hällefjärd and Lake Eckarfjärden, respectively. Benthicfauna, fish and epiphytic bacteria made up 5, 2 and 1% of the total respiration, respec-tively. In Lake Eckarfjärden zooplankton made up 1% of the respiration.
a) Lake Hällefjärd
Macrophytes69%
Phytoplankton0%
Fish1%
Bacterioplankton0%
Benthic bacteria23%
Epiphytic bacteria0%
Zooplankton0%
Benthic fauna3%
Microphytobenthos4%
a) Lake Hällefjärd
Macrophytes69%
Phytoplankton0%
Fish1%
Bacterioplankton0%
Benthic bacteria23%
Epiphytic bacteria0%
Zooplankton0%
Benthic fauna3%
Microphytobenthos4%
27
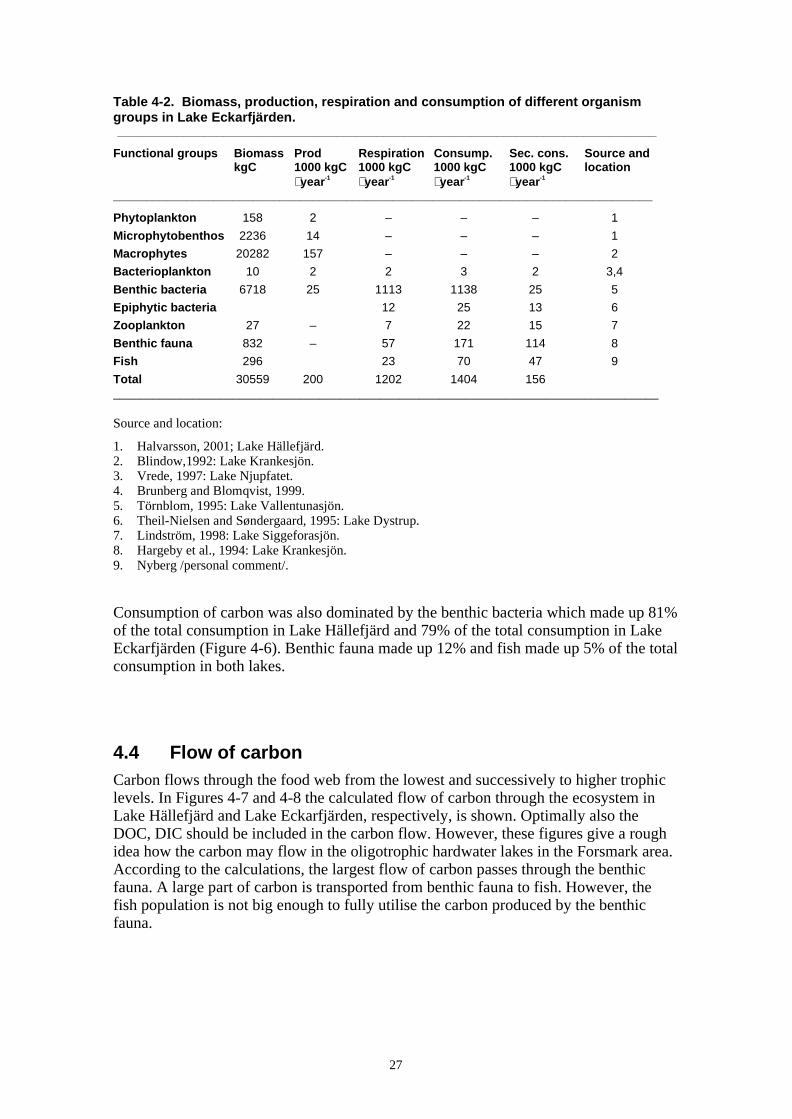
Table 4-2. Biomass, production, respiration and consumption of different organismgroups in Lake Eckarfjärden. _________________________________________________________________________________
Functional groups Biomass Prod Respiration Consump. Sec. cons. Source andkgC 1000 kgC 1000 kgC 1000 kgC 1000 kgC location
⋅ year-1 ⋅ year-1 ⋅ year-1 ⋅ year-1
_________________________________________________________________________________
Phytoplankton 158 2 – – – 1
Microphytobenthos 2236 14 – – – 1
Macrophytes 20282 157 – – – 2
Bacterioplankton 10 2 2 3 2 3,4
Benthic bacteria 6718 25 1113 1138 25 5
Epiphytic bacteria 12 25 13 6
Zooplankton 27 – 7 22 15 7
Benthic fauna 832 – 57 171 114 8
Fish 296 23 70 47 9
Total 30559 200 1202 1404 156__________________________________________________________________________________
Source and location:
1. Halvarsson, 2001; Lake Hällefjärd.2. Blindow,1992: Lake Krankesjön.3. Vrede, 1997: Lake Njupfatet.4. Brunberg and Blomqvist, 1999.5. Törnblom, 1995: Lake Vallentunasjön.6. Theil-Nielsen and Søndergaard, 1995: Lake Dystrup.7. Lindström, 1998: Lake Siggeforasjön.8. Hargeby et al., 1994: Lake Krankesjön.9. Nyberg /personal comment/.
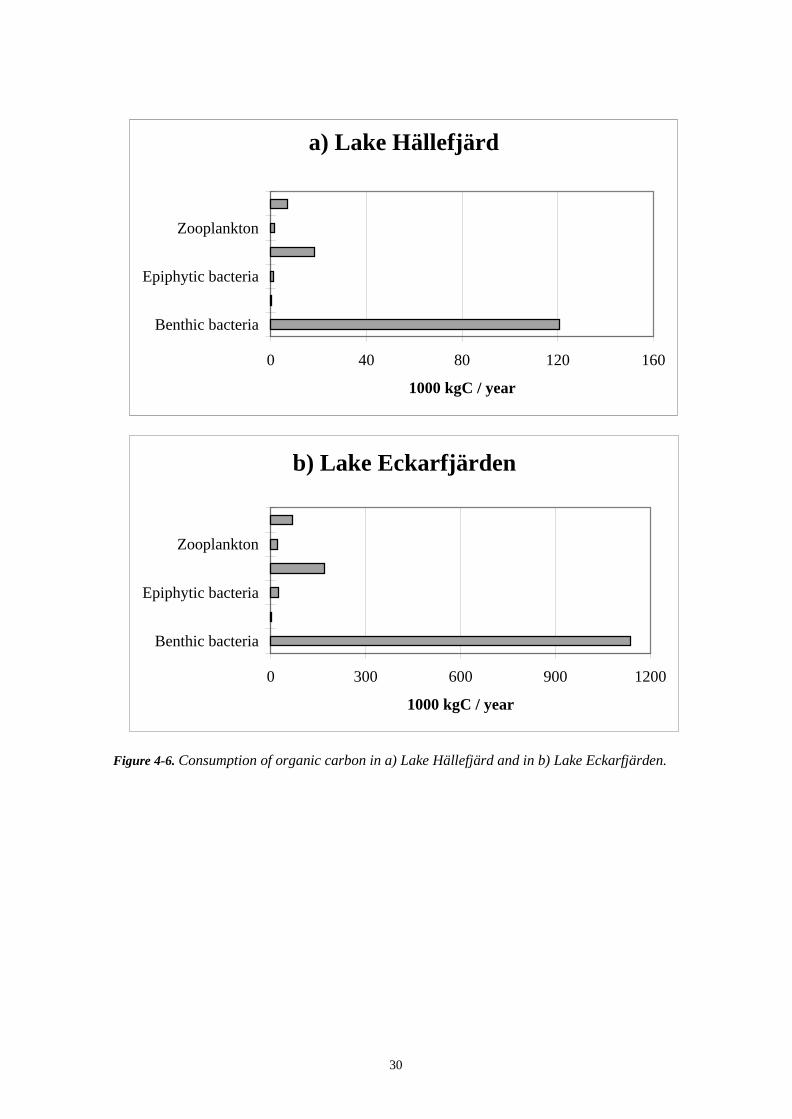
Consumption of carbon was also dominated by the benthic bacteria which made up 81%of the total consumption in Lake Hällefjärd and 79% of the total consumption in LakeEckarfjärden (Figure 4-6). Benthic fauna made up 12% and fish made up 5% of the totalconsumption in both lakes.
4.4 Flow of carbonCarbon flows through the food web from the lowest and successively to higher trophiclevels. In Figures 4-7 and 4-8 the calculated flow of carbon through the ecosystem inLake Hällefjärd and Lake Eckarfjärden, respectively, is shown. Optimally also theDOC, DIC should be included in the carbon flow. However, these figures give a roughidea how the carbon may flow in the oligotrophic hardwater lakes in the Forsmark area.According to the calculations, the largest flow of carbon passes through the benthicfauna. A large part of carbon is transported from benthic fauna to fish. However, thefish population is not big enough to fully utilise the carbon produced by the benthicfauna.
28
Figure 4-4. Production of carbon by photosynthesis and heterotrophic bacterial production in a) LakeHällefjärd and in b) Lake Eckarfjärden.
The primary producers within the lakes can not supply enough C to support the cal-culated benthic bacterial consumption. There is a lack of 13.5 ⋅103 kgC ⋅ year-1 and 132⋅103 kgC ⋅ year-1 for Lake Hällefjärd and Lake Eckarfjärden, respectively. Calculations ofthe residence time and the volume of the lakes shows that the inflowing water wouldneed to have concentration of 11,7 mgC ⋅ l-1 and 396 mgC ⋅ l-1 in Lake Hällefjärd andLake Eckarfjärden, respectively. The large mire surrounding Lake Hällefjärd mayproduce carbon enough to balance the budget. Literature values of Sphagnum produc-tion vary between 50 and 300 gww ⋅ m-2 year-1 /Wallén et al., 1988/. The mire sur-rounding Lake Hällefjärd is 90500 m2 and, calculated with the values above, produce
a) Lake Hällefjärd
0 5 10 15 20
Macrophytes
Phytoplankton
Bacterioplankton
1000 kgC / year
b) Lake Eckarfjärden
0 50 100 150 200
Macrophytes
Phytoplankton
Bacterioplankton
1000 kgC / year
29
Figure 4-5. Respiration of C in a) Lake Hällefjärd and b) Lake Eckarfjärden.
between 4.5 ⋅ 103 and 27 ⋅ 103 gww ⋅ year-1. Carbon most probably do not make up morethan 10% of the wet weight and hence, calculated with these values, the Sphagnum donot produce the 13,5 ⋅ 03 kgC ⋅ year-1 needed to balance the budget. However, theliterature values of production refer to increase in biomass but during production largequantities of carbon may be produced that are not allocated to growth but are released asexudates. The exudates may be used by bacteria within the mire but can also betransported to the lake and may be a significant contribution of carbon source in thelake. It is unknown how much carbon that is transported from the mire to the lake.
a) Lake Hällefjärd
0 40 80 120 160
Benthic bacteria
Epiphytic bacteria
Zooplankton
1000 kgC / year
b) Lake Eckarfjärden
0 400 800 1200 1600
Benthic bacteria
Epiphytic bacteria
Zooplankton
1000 kgC / year
30
Figure 4-6. Consumption of organic carbon in a) Lake Hällefjärd and in b) Lake Eckarfjärden.
a) Lake Hällefjärd
0 40 80 120 160
Benthic bacteria
Epiphytic bacteria
Zooplankton
1000 kgC / year
b) Lake Eckarfjärden
0 300 600 900 1200
Benthic bacteria
Epiphytic bacteria
Zooplankton
1000 kgC / year

31
Figure 4-7. Annual carbon budget with calculated flow of carbon between organisms in LakeHällefjärd. All values are in 103 kg C ⋅ year-1. Biomasses are given below the functional groups.The arrows between functional groups write primary production and secondary consumptionthat reaches the trophic levels above. Respiration is given in the small squares connected to thefunctional groups. Consumption not covered by the trophic levels below is indicated by dottedlines.
Macrophytes 2.1
Microphytobenthos 0.1
Benthic bacteria 0.7
Benthic fauna 0.09
Fish 0.03
Zooplankton 0.002
Phytoplankton 0.01
Out
In
1.5
17
118
6
Bacterioplankton 0.001
0.1
2
1
0.1
0.20.1
3
1
13.5
1
6
12
121
?
13.5
5
Epiphytic bacteria 0.004
2.7
3.4
0.7

32
Figure 4-8. Annual carbon budget with flow of carbon between different organisms group in LakeEckarfjärden. All values are in 103 kg C ⋅ year-1. Biomasses is given below the functional groups. Primaryproduction and secondary consumption that reaches the trophic levels above is written by the arrowsbetween functional groups. Respiration is given in the small squares connected to the functional groups.Consumption not covered by the trophic levels below is indicated by dotted lines.
Macrophytes 20
Microphytobenthos 2
Benthic bacteria 7
Benthic fauna 0.8
Fish 0.3
Zooplankton 0.03
Phytoplankton 0.2
Out
In
14
157
1113
57
Bacterioplankton 0.01
2
23
7
2
32
25
15
132
18
55
1138
?
132
47
Epiphyticbacteria 0.07
13
0,7 0,7 12
25
59
33
5 Discussion
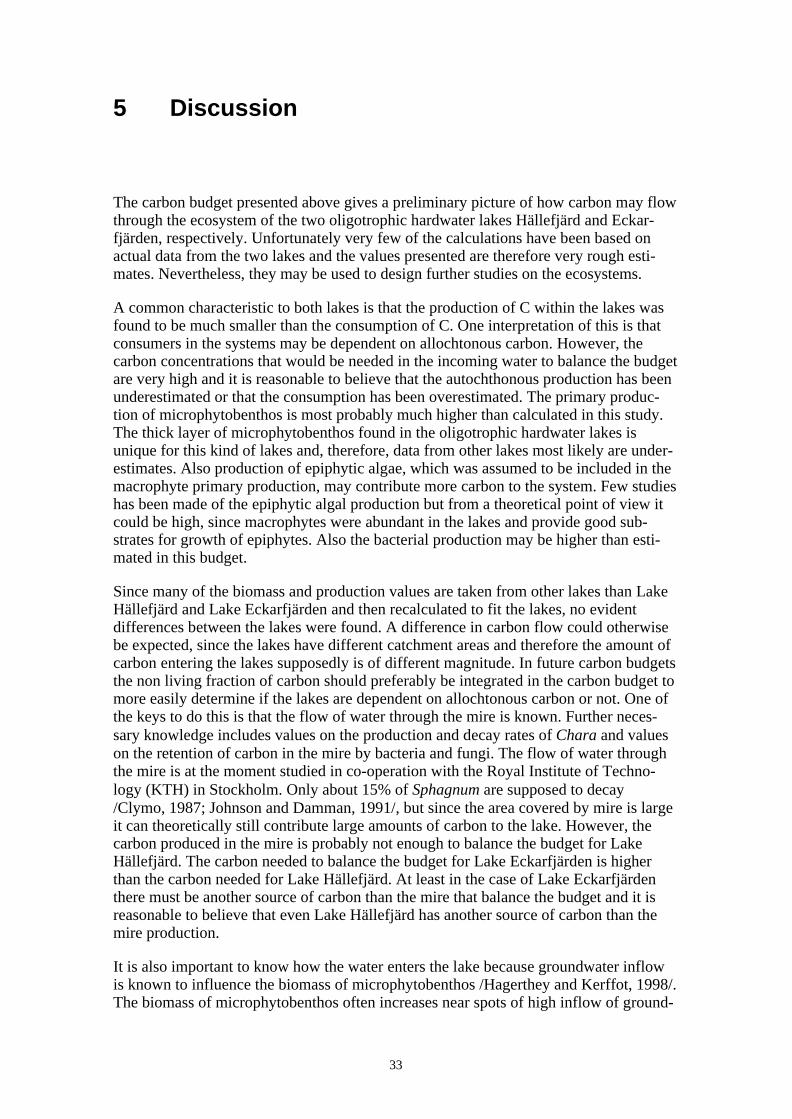
The carbon budget presented above gives a preliminary picture of how carbon may flowthrough the ecosystem of the two oligotrophic hardwater lakes Hällefjärd and Eckar-fjärden, respectively. Unfortunately very few of the calculations have been based onactual data from the two lakes and the values presented are therefore very rough esti-mates. Nevertheless, they may be used to design further studies on the ecosystems.
A common characteristic to both lakes is that the production of C within the lakes wasfound to be much smaller than the consumption of C. One interpretation of this is thatconsumers in the systems may be dependent on allochtonous carbon. However, thecarbon concentrations that would be needed in the incoming water to balance the budgetare very high and it is reasonable to believe that the autochthonous production has beenunderestimated or that the consumption has been overestimated. The primary produc-tion of microphytobenthos is most probably much higher than calculated in this study.The thick layer of microphytobenthos found in the oligotrophic hardwater lakes isunique for this kind of lakes and, therefore, data from other lakes most likely are under-estimates. Also production of epiphytic algae, which was assumed to be included in themacrophyte primary production, may contribute more carbon to the system. Few studieshas been made of the epiphytic algal production but from a theoretical point of view itcould be high, since macrophytes were abundant in the lakes and provide good sub-strates for growth of epiphytes. Also the bacterial production may be higher than esti-mated in this budget.
Since many of the biomass and production values are taken from other lakes than LakeHällefjärd and Lake Eckarfjärden and then recalculated to fit the lakes, no evidentdifferences between the lakes were found. A difference in carbon flow could otherwisebe expected, since the lakes have different catchment areas and therefore the amount ofcarbon entering the lakes supposedly is of different magnitude. In future carbon budgetsthe non living fraction of carbon should preferably be integrated in the carbon budget tomore easily determine if the lakes are dependent on allochtonous carbon or not. One ofthe keys to do this is that the flow of water through the mire is known. Further neces-sary knowledge includes values on the production and decay rates of Chara and valueson the retention of carbon in the mire by bacteria and fungi. The flow of water throughthe mire is at the moment studied in co-operation with the Royal Institute of Techno-logy (KTH) in Stockholm. Only about 15% of Sphagnum are supposed to decay/Clymo, 1987; Johnson and Damman, 1991/, but since the area covered by mire is largeit can theoretically still contribute large amounts of carbon to the lake. However, thecarbon produced in the mire is probably not enough to balance the budget for LakeHällefjärd. The carbon needed to balance the budget for Lake Eckarfjärden is higherthan the carbon needed for Lake Hällefjärd. At least in the case of Lake Eckarfjärdenthere must be another source of carbon than the mire that balance the budget and it isreasonable to believe that even Lake Hällefjärd has another source of carbon than themire production.
It is also important to know how the water enters the lake because groundwater inflowis known to influence the biomass of microphytobenthos /Hagerthey and Kerffot, 1998/.The biomass of microphytobenthos often increases near spots of high inflow of ground-
34
water and this may lead to a patchy distribution. It is therefore important to determine ifthere are discrete points of high groundwater inflow to a lake to be able to take repre-sentative samples when studying the production of the lakes.
The calculations show that carbon biomass as well as production of C in the lakes isconcentrated to the benthic community and more studies are required to understand thiscommunity better. If radionuclides are released to oligotrophic hardwater lakes theywould most probably enter the biota via the benthic community either by bacteria ormicrophytobenthos.
In conclusion this is a preliminary carbon budget for Lake Hällefjärd and Lake Eckar-fjärden. It gives a gross picture of carbon flow in oligotrophic hardwater lakes butclearly shows that more studies are needed to accurately determine the carbon flow.

35
6 Acknowledgements
I would like to thank Ulrik Kautsky, Anna Brunberg, Peter Blomqvist and Don Piersonfor valuable comments and suggestions on the construction of the carbon budget andmanuscript.
37
7 References
Barranguet C, Plante-Cuny M R, Alivon E, 1996. Microphytobenthos production inthe gulf of Fos, French Mediterranean coast. Hydrobiologia 333: 181–193.
Blindow I, 1986. Undervattensväxter viktiga i fågelsjöar. Fauna Och Flora 81: 233–244.
Blindow I, 1992. Long- and short-term dynamics of submerged macrophytes in twoshallow eutrophic lakes. Freshwater Biology 28: 15–27.
Boström B, Pettersson A-K, Ahlgren I, 1989. Seasonal dynamics of a cyanobacteria-dominated microbial community in surface sediments of a shallow, eutrophic lake.Aquatic Sciences 51:153–178.
Boström B, Törnblom E, 1990. Bacterial production, heat production and ATP-turnover in shallow marine sediments. Thermochimica Acta 172: 147–156.
Brunberg A-K, 1993. Microcystis in lake sediments Its potential role in phosphorousexchange between sediments and lake water. PhD-thesis. Acta UniversitatisUpsaliensis. Science 448.
Brunberg A-K, Blomqvist P, 1998. Vatten i Uppsala län 1997. Rapport nr 8/1998.Upplandsstiftelsen.
Brunberg A-K, Blomqvist P, 1999. Characteristics and ontogeny of oligotrophic hard-water lakes in the Forsmark area, central Sweden. SKB R-99-68, Swedish Nuclear Fueland Waste Management Co.
Brunberg A-K, Blomqvist P, 2000. Post-glacial, land rise-induced formation anddevelopment of lakes in the Forsmark area, central Sweden. SKB TR-00-02, SwedishNuclear Fuel and Waste Management Co.
Brydsten L, 1999. Shore level displacement in Öregrundsgrepen. SKB TR-99-16,Swedish Nuclear Fuel and Waste Management Co.
Cahoon L B, Cooke J E, 1992. Benthic microalgal production in Onslow Bay, NorthCarolina, USA. Marine Ecology Progress Serier 84: 185–196.
Carmouze J P, de Farias B, Bernardes M C, Kuroshima K N, 1998. Benthic influ-ence on the metabolism of a shallow tropical lagoon (Lagoa da Barra, Brazil). Hydro-biologia 373/374: 89–100.
Clymo R S, 1963. Ion exchange in Sphagnum and its relation to bog ecology. Ann. Bot.N. S. 27: 309–324.
Clymo R S, 1964. The origin of acidity in Sphagnum bogs. Bryologist 67: 427–431.
Clymo R S, 1987. The ecology of peatlands. Sci. Prog. Oxf. 71: 593–614.
38
Cole J J, Caraco N F, Kling G W, Kratz T, 1994. Carbon dioxide supersaturation inthe surface waters of lakes. Science 265: 1568–1570.
del Giorgio P A, Cole J J, Cembleris A, 1997. Respiration rates in bacteria exceedphytoplankton production in unproductive aquatic systems. Nature 385: 148–151.
Doremus C, Clesceri L S, 1982. Microbial metabolism in surface sediments and itsrole in the immobilization of phosphorous on oligotrophic lake sediments. Hydro-biologia 91: 261–268
Eriksson I V, 1920. Isläggning och islossning i Sveriges insjöar. Medd. fr. StatensHydrologiska anstalt 1:2, 95 pp.
Fjeldsa J, 1977. Benthos densities in the littoral zone of some lakes in northernNorway. Fauna 30(4) 227–236.
Forsberg C, 1965. Environmental conditions of Swedish Charophytes. Symb. Bot. Ups.18:4
Grøntved J, 1962. Preliminary report on the productivity of microbenthos and phyto-plankton in the Danish Wadden Sea. – Meddr Kommn Danm. Fisk. og Havunders.(N:S.) 12: 347–378.
Hargeby A, Andersson G, Blindow I, Johansson S, 1994. Trophic web structure in ashallow eutrophic lake during a dominance from phytoplankton to submerged macro-phytes. Hydrobiologia 279/280: 83–90.
Hagerthey S E, Kerfoot W C, 1998. Groundwater flow influences the biomass andnutrient ratios of epibenthic algae in a north temperate seepage lake. Limnol. Oceanogr.42(6) 1227–1242.
Haglund E, 1972. Naturvårdsinventering av Uppsala län del VIII. Tierps kommun,norra delen. Länsstyrelsen Uppsala Län.
Halvarsson E, 2001. Hällefjärd – en kalkoligotrof sjö I Norduppland, beskrivning avavrinningsområde, sjöekosystem och antropogen påverkan. Scripta LimnologicaUpsaliensia 2001 B:11.
Ignatius H, Axelberg S, Niemistö L, Winterhalter B, 1981. Quaternary geology ofthe Baltic Sea. In: Voipio A (ed). The Baltic Sea. Elsevier Oceanography Series 30.
Johnson L C, Damman A W H, 1991. Species-controlled Sphagnum decay onSouthern Swedish raised bog. Oikos 61: 234–242.
Kautsky U, 1995 a. Annual variation in carbon and nutrient stocks of Baltic coastalecosystems. In : Ecosystem processes in coastal areas of Baltic Sea, Doctoral thesis atUniversity of Stockholm, Depatment of Zoology.
Kautsky U, 1995 b. Seasonal dynamics of carbon and nutrient fluxes in Baltic coastalecosystems. in: Ecosystem processes in coastal areas of Baltic Sea, Doctoral thesis atUniversity of Stockholm, Depatment of Zoology.
39
Kautsky U, Kautsky H, 1995. Coastal productivity in the Baltic Sea. in: Ecosystemprocesses in coastal areas of Baltic Sea, Doctoral thesis at University of Stockholm,Depatment of Zoology.
Kumblad L, 1999. A carbon budget for the aquatic ecosystem above SFR in Öre-sundsgrepen. SKB R-99-40. SKB Swedish Nuclear Fuel and Waste Management Co.
Lindström E S, 1998. Bacterioplankton community composition in five lakes differingin trophic status and humic content. In: Temporal and spatial variation in the com-munity composition of lake bacterioplankton. PhD-thesis. Acta Universitatis Upsa-liensis 413.
Lundqvist G, 1925. Utvecklingshistoriska insjöstudier i Sydsverige. Akademiskavhandling. Stockholms högskola. Kungliga boktryckeriet P.A. Norstedt & Söner,Stockholm.
Länsstyrelsen i Uppsala Län, 1987. Naturvårdsprogram för Uppsala län. Värdefullaområden för naturvård och rörligt friluftsliv. Meddelande från planeringsavdelningen.1987.2.
McCauley E, Kalff J, 1981. Empirical relationships between phytoplankton and zoo-plankton biomass in lakes. Can. J. Fish. Aquat. Sci. 38: 458–463.
Naturvårdsverket, 1999. Bedömningsgrunder för miljökvalitet. Sjöar och vattendrag.Rapport 4913. Naturvårdsverket, Stockholm.
Nilsson P, Jönsson B, Lindström-Swanberg I, Sundbäck K, 1991. Response of amarine shallow-water sediment system to an increased load of inorganic nutrients.Marine ecology progress series 71: 275–290.
Rodhe W, 1949. The ionic composition of lake waters. Verh. Int. Ver. Limnol. 10:377–386.
Schallenberg M, Kalff J, Rasmussen J, 1989. Solutions to problems in enumeratingsediment bacteria in direct counts. Appl. environ. Microbiol 55:1214–1219.
Sundbäck K, Carlsson L, Nilsson C, Jönsson B, Wulff A, Odmark S, 1996.Response of benthic microbial mats to drifting green algal mats. Aquatic microbialecology 10:195–208.
Theil-Nielsen J, Søndergaard M, 1995. Production of epiphytic bacteria and bacterio-plankton in three shallow lakes. Oikos 86:283–292.
Törnblom E, 1995. Bacterial production and total community metabolism in sedimentsof a eutrophic lake. In: Microbial activity and biomass in aquatic surface sediments acommunity level approach. PhD-thesis. Acta Universitatis Upsaliensis 153.
van Duyl F C, Kop A J, 1990. Seasonal patterns of bacterial production and biomass inintertidal sediments of the western Dutch Wadden Sea. Marine ecology progress series59: 249–261.

40
Vrede K, 1997. Bacterioplankton production and biomass in two lakes of differenttrophic status, responses to inorganic nutrients, organic carbon, and other planktonicbiota. PhD-thesis. Comprehensive Summaries of Uppsala Dissertations from the facultyof Science and Technology 282.
Wallén B, Falkengren-Grerup U, Malmer N, 1988. Biomass, productivity andrelative rate of photosynthesis of Sphagnum at different water levels on a SouthSwedish peat bog. Holarctiv Ecology 11:70–76.