quarterly report september 30, 2011 - · pdf filequarterly report september 30, 2011 ... the...
TRANSCRIPT

P A R N A S S U S F U N D S®
QUARTERLY REPORT ▪ SEPTEMBER 30, 2011
PARNASSUS FUNDS
Parnassus FundSM PARNX
Parnassus Equity Income FundSM – Investor Shares PRBLX
Parnassus Equity Income Fund – Institutional Shares PRILX
Parnassus Mid-Cap FundSM PARMX
Parnassus Small-Cap FundSM PARSX
Parnassus Workplace Fund® PARWX
Parnassus Fixed-Income FundSM PRFIX


Table of Contents
Letter from Parnassus Investments .............. 4
Fund Performance and CommentaryParnassus Fund.............................................. 5
Parnassus Equity Income Fund .................... 9
Parnassus Mid-Cap Fund..............................12
Parnassus Small-Cap Fund ...........................15
Parnassus Workplace Fund...........................17
Parnassus Fixed-Income Fund......................19
Responsible Investing Notes ........................21
Portfolios of InvestmentsParnassus Fund..............................................22
Parnassus Equity Income Fund ....................23
Parnassus Mid-Cap Fund..............................25
Parnassus Small-Cap Fund ...........................26
Parnassus Workplace Fund...........................28
Parnassus Fixed-Income Fund......................29

P A R N A S S U S F U N D S Quarterly Report • Q3 2011
November 4, 2011
Dear Shareholder:
Enclosed you will find the quarterly reports for all six Parnassus Funds. This has not been a good quarter for our funds as allthe equity funds lost money. The Fixed-Income Fund eked out a gain because of the strong bond market.
The difficult economy and international uncertainty conspired to drive down stock prices. There were a couple of bright spotsduring the quarter, as the Equity Income Fund beat both of its benchmarks and the Mid-Cap Fund beat one benchmark andwas just a hair below the other. I’ll let you read all the details in the reports that follow. Despite the poor quarter, the fundshave solid long-term records.
I am pleased to announce that we have hired a new senior analyst in our research department. Romahlo Wilson is a graduateof Stanford University and holds an MBA from The Wharton School, University of Pennsylvania. His previous experienceincludes working as senior associate at Houlihan Lokey, an investment banking firm, and as a consultant at CleantechApproach, where he advised businesses and municipalities on energy efficiency and renewable energy. Rom interned with usearlier this year and did such a good job that we hired him on a permanent basis. We’re happy to have him as a member ofthe Parnassus team.
Yours truly,
Jerome L. Dodson, PresidentParnassus Investments
4

Quarterly Report • Q3 2011 P A R N A S S U S F U N D S
PARNASSUS FUND
Ticker: PARNX
As of September 30, 2011, the net asset value per share (“NAV”) of the Parnassus Fund was $32.78, resulting in a loss of19.38% for the third quarter. This compares to a loss of 13.87% for the S&P 500 Index (“S&P 500”) and a loss of 16.94% forthe Lipper Multi-Cap Core Average, which represents the average multi-cap core fund followed by Lipper (“Lipper average”).For the year-to-date, the Fund is down 19.04%, compared to a loss of 8.69% for the S&P 500 and a loss of 12.04% for theLipper average.
These returns are very disappointing, especially considering how well we’ve done over the last five years. In my view, though,these losses are quotational, and investors with a long-term approach should not lose capital. Our investment objective hasnot changed, and we’re picking stocks the same way we always have. What’s happening is that investors have been selling offmany of our stocks at prices that I think are far below their intrinsic value, and these low quotes make our performance lookbad. At some point, I think that investors will recognize the value of the stocks in our portfolio, and prices of those sharesshould rise.
The stock market as a whole has been very discouraging this year, and investors have been emotionally affected by the sell-off.This has led to panic-selling, which frightens even more people into selling, bringing down stock quotes even further.Unfortunately, emotion often makes people do foolish things – like selling stock at ridiculously low prices. The great investor,Warren Buffett, once said that you don’t have to be brilliant to be a good investor, but you do have to have the right
Parnassus FundAverage AnnualTotal Returns (%) One
YearThreeYears
FiveYears
TenYears
GrossExpense
Ratio
NetExpense
Ratiofor periods ended9/30/2011
Parnassus Fund -9.62 0.87 0.55 1.24 0.97 0.97
S&P 500 Index 1.13 1.23 -1.18 2.81 NA NA
Lipper Multi-CapCore Average -2.40 1.13 -1.36 3.57 NA NA
Performance data quoted represent past performance and are no guarantee of future returns.
Current performance may be lower or higher than the performance data quoted. Current
performance information to the most recent month-end is available on the Parnassus website
(www.parnassus.com). Investment return and principal value will fluctuate so that an
investor’s shares, when redeemed, may be worth more or less than their original principal cost.
Returns shown in the table do not reflect the deduction of taxes a shareholder may pay on fund
distributions or redemption of shares. The S&P 500 Composite Stock Index (also known as the
S&P 500) is an unmanaged index of common stocks, and it is not possible to invest directly in
an index. Index figures do not take any expenses, fees or taxes into account, but mutual fund
returns do. Prior to May 1, 2004, the Parnassus Fund charged a sales load (maximum of
3.5%), which is not reflected in the total return calculations. Before investing, an investor
should carefully consider the investment objectives, risks, charges and expenses of the Fund and
should carefully read the prospectus, which contains this and other information. The prospectus
is available on the Parnassus website, or one can be obtained by calling (800) 999-3505. As
described in the Fund’s current prospectus dated May 1, 2011, Parnassus Investments has
contractually agreed to limit the total operating expenses to 0.99% of net assets, exclusive of
acquired fund fees, until May 1, 2012. This limitation may be continued indefinitely by the
Adviser on a year-to-year basis.
temperament. What he meant was that you haveto resist the urge to sell when stocks are fallingsharply. That’s the time to buy.
Human nature is such that people get scared whenthe market takes a tumble. They sell their stock atthe wrong time, and this causes shares to fall evenfurther. That’s what is happening right now. I’venoticed that in the last few months, many of ourinvestors have been redeeming their shares, whereasin 2009 and 2010, we had a lot of money cominginto the Fund. I feel bad that they are taking theirmoney out of the Fund at just the wrong time, butquite often, emotions outweigh rational thought.
To the left is a table comparing the ParnassusFund with the S&P 500 and the Lipper averageover the past one-, three-, five- and ten-yearperiods.
Company AnalysisThe stock that hurt us the most was homebuilderPulteGroup, which lost 48.4% during the quarter,collapsing from $7.66 to $3.95 for a staggering84¢ loss for each fund share. As most of youknow, we’ve been investing in homebuilder stockssince late 2007. At first, the strategy worked wellwith these stocks rising a lot in 2009 and early2010, and making a substantial contribution tothe NAV. Unfortunately, they’ve been a bigdisappointment since late 2010.
In previous housing recessions, homebuildingstocks made big gains about two years after theirstocks suffered deep losses, as housing led the
5

P A R N A S S U S F U N D S Quarterly Report • Q3 2011
economy out of the recession. The housing market did not have to come back completely for stocks to move much higher,but only had to turn up a bit, as investors bought homebuilding stocks in anticipation of a stronger housing market ahead.This pattern repeated itself in 2009 and early 2010 with the shares moving higher. My view was that the housing marketwould be much stronger sometime in 2010 at the latest. Unfortunately, I did not sell the shares at that point, since I expectedthem to move even higher, as the economy made a strong recovery.
As we all know now, the economy has not made a strong recovery, and the housing market has kept getting weaker. It may havehit bottom now, but no one knows for sure. Job growth has been weak and people without jobs don’t buy houses. Even peoplewith jobs are reluctant to buy homes if their neighbor is out of work. The irony here is that houses are very affordable with pricesdropping around 32% nationwide from their peak, according to Case-Shiller, and interest rates are at post-World War II lows.
I’ve thought a lot about what to do with our housing stocks, and I’ve decided to hang onto what we have, but not to buy anymore despite stock prices that seem to be at rock bottom. I’m no longer confident that the housing market or the economy willmake a strong recovery any time soon. The economy and the housing market will come back, just as they always have, but it’shard to determine when that will happen. The time to recovery could be measured in years instead of months.
The stock of Ciena Corporation sank 39.1% from $18.38 to $11.20 for a loss of 78¢ for each Parnassus Fund share. Thecompany makes optical equipment used in telecommunications, and the stock dropped after the company reporteddisappointing sales, particularly from Europe and the Middle East. Investors are concerned that carriers will not be investingas much in optical equipment as anticipated. We’re holding the stock and adding to our position, because we think it isundervalued. Part of the decline was due to weak revenue forecasts, but much of the drop was not based on fundamentalfactors, but on the general market sell-off and the weak economy. Ciena has excellent products and appears to be gainingmarket share in the optical equipment market.
Oil- and gas-producer W&T Offshore saw its stock fall 47.3% from $26.12 to $13.76 while slicing 71¢ off the NAV. Crude oilprices dropped sharply during the quarter from $95 to $79 a barrel and the company’s drilling costs have not dropped as muchas the price of crude oil. We’re holding the stock since we expect oil prices to rise again and drilling prices to drop.
Technology-giant Hewlett-Packard’s stock fell 38.3% from $36.40 to$22.45, chopping 71¢ off the NAV. Operating results were good for thecompany as both revenue and earnings beat analyst expectations. Whattorpedoed the stock were not the fundamentals, but intrigue in theboardroom and weak performance in the CEO suite.
The decline of HP over the past decade has been a deep disappointmentfor me. Fifteen years ago, the company was a great place to work, one ofthe most admired corporations in the country and an example of howinnovation could produce great products. The company still has somegreat products and most of its employees are capable, dedicated andhard-working. The problem has not been with the workers of HP, butrather with the board and the CEO. For years now, the directors havebeen feuding and spying on one another, and they’ve made a series ofterrible decisions. The trouble began about 12 years ago, when theboard departed from the company’s tradition of promoting from withinfor the CEO job, and passed over company veteran Ann Livermore tohire Carly Fiorina, a vice president at Lucent. Fiorina made an ill-advisedmove to buy Compaq Computer for $25 billion dollars. The movedivided shareholders, caused dissension within the company andresulted in Walter Hewlett, son of a company founder, leading ashareholder revolt that lost by a small margin. Hewlett left the boardsoon after the fight. In an ironic footnote, the board recently revealedplans to divest the personal computer business because of lowprofitability.
The company made something of a comeback when the board hiredMark Hurd in 2005 to replace Carly Fiorina. Hurd succeeded in getting
Parnassus Fund Sector Weightingsas of September 30, 2011 (percentage of net assets)
Portfolio Composition
0 10 20 30 40 50 60 70
Consumer Discretionary
Fund
S&P 500 Index
20.2%10.6%
0.4%12.5%
3.3%11.4%
0.0%3.9%
12.1%13.4%
1.3%11.9%
4.8%10.0%
0.0%3.4%
57.5%19.7%
0.0%3.2%
0.4%0.0%
Consumer Staples
Energy
Utilities
Financials
Health Care
Industrials
Materials
Information Technology
Telecom Services
Short-term Investments, Other Assets & Liabilities
Portfolio characteristics and holdings aresubject to change periodically.
6

Quarterly Report • Q3 2011 P A R N A S S U S F U N D S
the company back on track, as its operations improved along with earnings. In a move that was inconceivable to me, theboard fired Hurd in 2010, and hired Leo Apotheker, who had very little experience in the industry and had been terminatedafter only ten months as CEO of software maker SAP. Apotheker made a series of bad decisions including announcing the saleof the PC business before there had been a thorough review. There was also a deal to buy software-company Autonomy forthe incredible price of $10.3 billion and a move to shut down HP’s webOS tablet division. The board soon realized itsmistake and fired Apotheker after less than a year in office.
Its next decision was to hire Meg Whitman, former CEO of eBay, to replace Apotheker without doing a thorough search tofind other candidates. Although Whitman had some success at eBay, her record there was mixed. She had no experience witha company as big as Hewlett-Packard and no history with a company that had a large hardware, software and servicesbusiness.
Given this strange history, you may be wondering why I’m still holding onto the stock. There are two reasons. First, it’sincredibly cheap at only five times earnings. Second, the company provides some great products and services, and it has atalented and dedicated workforce that deserves better corporate governance from the board of directors.
Despite the downward movement in most of our stocks, there was one that made a substantial contribution to the NAV.MasterCard, the big debit- and credit-card processor, added 13¢ to each fund share, as the stock climbed 5.3% from $301 to$317 during the quarter. The stock moved higher in August after the company reported excellent quarterly financial results,including higher purchase volume and transaction growth with international transactions especially strong. The stock’s rallycontinued, when management affirmed its long-term performance targets and reported gains in market share at the expenseof Visa.
Outlook and StrategyThis section represents my thoughts and applies to the three funds that I manage: the Parnassus Fund, the ParnassusSmall-Cap Fund and the Parnassus Workplace Fund. The other portfolio managers will discuss their thoughts in theirrespective reports.
This year, the funds that I manage have not done very well, and that’s the first time that has happened in a long time. Themarket has dropped quite a bit, but our funds have dropped even more. Our approach is still the same, but our stocks arecurrently even more out of favor than the market as a whole. Investors have been selling off the stocks in our portfolios, sothat now most of them are priced far below their intrinsic values. Given this situation, our strategy is to change nothing. We’llhang onto the stocks we have. There will be some fine-tuning, such as selling stocks that have higher valuations and buyingothers that have lower valuations, but there won’t be any wholesale changes.
This has happened to us before, with investors selling off our stocks at very low prices. What we found was that the beststrategy was just to hold what we already own if they were good companies. At some point, the market will recognize thevalue in our securities and they will appreciate. Unfortunately, we don’t know when that will happen.
That’s the strategy part of this report. How about the outlook?
As most of you know, I tend to be an optimist. Right now, though, I can’t find much to be optimistic about. We’ve been outof the recession for two years now, but the recovery has been very weak. Normally, when the economy comes out of a deeprecession such as the one we had in 2008, the recovery is very strong, with housing and new job creation leading the economyhigher.
This time, both housing and job creation are very weak. Of course, one affects the other. People without jobs don’t buyhouses, and if there are not many houses being constructed, there are fewer jobs around. We seem to be caught in a viciouscircle.
The irony here is that corporations have a lot of cash on their balance sheets, but they aren’t willing to use that cash to investand create new jobs. They’re concerned about the demand for their products and services, and without demand, there’s noreason to invest. Another irony here is that housing is more affordable than at any time in recent memory. Housing prices arecheap and interest rates are low. It’s a great time to buy, but people just aren’t buying.
7

P A R N A S S U S F U N D S Quarterly Report • Q3 2011
Also casting a pall over economic activity is the situation in Europe. Their banks are not well capitalized, and somegovernments have spent so much and borrowed so much, that they’re financially very shaky. No one wants to lend them anymore money. If governments default on their bonds, this will affect the banks, since they hold a lot of debt issued byEuropean governments. If Europe were to go into another deep recession, this would definitely have a very negative effect onthe American economy. It seems that the American stock market is trading off the debt situation in Europe. Our stock marketdrops when it looks as if the Europeans will default, then it moves sharply higher when it appears that their financialproblems will be resolved.
The Greek economy is a small one, and it shouldn’t have much effect on the rest of the world. Somehow though, headlinesfrom Greece are driving our stock market. For decades, the Greek government has spent far more than it took in as revenue,and tax-evasion is a national sport. The government has hired far more civil servants than it needs or can afford. It’s clear thatGreece has to raise taxes and reduce government spending, which means reducing its number of government workers andcutting pensions. This seems like a common-sense approach, but when the Greek prime minister announced this policy, itresulted in public worker strikes and violent protests. It’s as if a big part of the Greek population has an economic death wish.Because of Greece’s small size, all this should not affect the overall European or North American economy. Nevertheless, itunnerves investors.
At some point, though, our economy will get better. It always has and it will again. Some economic activity will provide acatalyst for the broader economy. With housing now so affordable, people might start buying homes again, since thepopulation is growing faster than houses are being constructed. This would lead to more jobs in construction, homefurnishings and general retail. A vicious circle would turn into a virtuous circle. Another possibility would be for corporationsto invest some of the cash on their balance sheets to hire more people and invest more. This would also stimulate economicactivity and start the virtuous circle.
Eventually, this will happen, but right now, there are no signs on the economic horizon of something that will jump-start theeconomy. Both the Obama administration and the Federal Reserve have tried to stimulate the economy, but thus far, theirefforts have fallen short. I think both entities are doing the right thing, and it’s a mystery why the economy hasn’t responded.
In the meantime, there’s nothing we can do as investors except wait. We have good companies in the portfolios of our funds,and they will do well when the economy recovers, but there’s no way of telling when that will happen.
The only consolation in our current situation is that stocks are very cheap. At quarter’s end, the S&P 500 traded at just 10.6times consensus earnings estimates for the next twelve months. This is well below the fifteen-year average of 17.0 times, andclose to the low of 8.9 times reached during the market sell-off in late 2008. When stocks are this cheap, it is possible that wecould have a rally.
Yours truly,
Jerome L. DodsonPortfolio Manager
8

Quarterly Report • Q3 2011 P A R N A S S U S F U N D S
PARNASSUS EQUITY INCOME FUND
Ticker: Investor Shares - PRBLXTicker: Institutional Shares - PRILX
As of September 30, 2011, the NAV of the Parnassus Equity Income Fund-Investor Shares was $24.23, resulting in a loss of11.06% for the third quarter (including dividends). This compares to a loss of 13.87% for the S&P 500 Index (“S&P 500”)and a decline of 13.41% for the Lipper Equity Income Fund Average, which represents the average equity income fundfollowed by Lipper (“Lipper average”).
For the first nine months of 2011, the Fund fell 7.10% versus losses of 8.69% for the S&P 500 and 7.94% for the Lipperaverage. I don’t like to lose money, but I’m pleased that the Fund outperformed its peers during a tough quarter andyear-to-date period. In addition, our long-term record remains outstanding. Our three-, five- and ten-year annualized returnsbeat the S&P 500 and Lipper average for every period.
Parnassus Equity Income FundAverage Annual TotalReturns (%) One
YearThreeYears
FiveYears
TenYears
GrossExpense
Ratio
NetExpense
Ratiofor periods ended9/30/2011
Parnassus Equity Income FundInvestor Shares 0.34 1.73 3.55 6.19 0.99 0.99
Parnassus Equity Income FundInstitutional Shares 0.58 1.96 3.78 6.32 0.75 0.75
S&P 500 Index 1.13 1.23 -1.18 2.81 NA NA
Lipper Equity Income FundAverage 0.56 1.45 -0.48 3.94 NA NA
The total return for the Parnassus Equity Income Fund-Institutional Shares fromcommencement (April 28, 2006) was 4.10%. Performance shown prior to the inception of theInstitutional Shares reflects the performance of the Parnassus Equity Income Fund-InvestorShares and includes expenses that are not applicable to and are higher than those of theInstitutional Shares. The performance of Institutional Shares differs from that shown for theInvestor Shares to the extent that the classes do not have the same expenses. Performance dataquoted represent past performance and are no guarantee of future returns. Currentperformance may be lower or higher than the performance data quoted, and currentperformance information to the most recent month-end is available on the Parnassus website(www.parnassus.com). Investment return and principal value will fluctuate, so that aninvestor’s shares, when redeemed, may be worth more or less than their original principal cost.Returns shown in the table do not reflect the deduction of taxes a shareholder may pay on funddistributions or redemption of shares. The S&P 500 is an unmanaged index of common stocks,and it is not possible to invest directly in an index. Index figures do not take any expenses, feesor taxes into account, but mutual fund returns do. On March 31, 1998, the Fund changed itsinvestment objective from a balanced portfolio to an equity income portfolio. Before investing,an investor should carefully consider the investment objectives, risk, charges and expenses of theFund and should carefully read the prospectus, which contains this and other information. Theprospectus is on the Parnassus website, or one can be obtained by calling (800) 999-3505. Asdescribed in the Fund’s current prospectus dated May 1, 2011, Parnassus Investments hascontractually agreed to limit the total operating expenses to 0.99% and 0.77% of net assets,exclusive of acquired fund fees, through May 1, 2012 for the Investor Shares and InstitutionalShares, respectively. These limitations may be continued indefinitely by the Adviser on ayear-to-year basis.
To the left is a table that compares theperformance of the Fund with that of the S&P 500and the Lipper average for the one-, three-, five-and ten-year periods.
Third Quarter ReviewThe S&P 500 plunged 13.9% during the thirdquarter, as concerns about the European debtcrisis and a slowing global economy slammedstock prices. These factors especially hurt stocks inthe index’s financial and industrial sectors, whichfell on average 22.0% and 21.0%, respectively.Fortunately, the Fund’s underweight position infinancials, as compared to the index, added 25basis points (one basis point equals 0.01%) to ourreturn versus the benchmark, and our excellentstock picking in industrials contributed 136 basispoints relative to the index.
The biggest contributor to our outperformance inindustrials was Waste Management, which alsohappens to be the largest holding in the portfolio.My conviction in this investment increased thispast month after I visited the company’simpressive waste-to-energy operation in AltamontPass, California. In this facility, WasteManagement turns landfill gas into electricity andtransportation fuel for specially-designed wastecollection vehicles. Parnassus Director of Research,Ben Allen, has done outstanding work monitoringour Waste Management investment.
The Fund had two additional portfolio allocationsthat meaningfully boosted our outperformance.We had an average cash position of 8.7% duringthe quarter, which cushioned our loss by 113basis points versus the S&P 500. This abnormallyhigh cash balance resulted from sales during thequarter of a broad range of stocks, mostly in thefinancials, technology and energy sectors.
9

P A R N A S S U S F U N D S Quarterly Report • Q3 2011
The final driver of our third quarter performance was the Fund’s consumer discretionary stocks, which cushioned our loss by62 basis points versus the S&P 500. Our investments in this sector, which consist of Nike and Target, fell only 0.5% inaggregate, well below the 12.8% loss for the average consumer stock in the index. Parnassus Mid-Cap Fund portfolio managerand senior analyst Matt Gershuny has done an outstanding job executing our Target investment process.
Company AnalysisFour stocks reduced the NAV by at least 20¢ each. Technology titan Hewlett-Packard (HP) fell 38.3% during the third quarterfrom $36.40 to $22.45 and trimmed 30¢ off the Fund’s NAV. Amazingly, this stock is down 46.7% for the year, despite thefact that expectations for HP’s 2011 earnings haven’t changed much since the beginning of the year.
Unfortunately, management missteps and concerns about HP’s long-term business prospects have reduced theprice-to-earnings ratio to a historic low of five times this year’s expected earnings. Most of the damage was done onAugust 18th, when the stock plunged 20% due to three significant issues.
First, HP announced its intent to pay $10.3 billion, or over 10 times sales, for British software maker Autonomy. To highlighthow rich this valuation is, consider that HP was trading at 0.5 times sales just before announcing the deal. This huge price tagraised concerns that HP management, led by then CEO Leo Apotheker, was destroying shareholder value. It also called intoquestion Mr. Apotheker’s credibility, since he publicly stated in June that he would not make a large acquisition in the nearfuture. The second piece of bad news was that HP abandoned its long-term earnings guidance of $7 per share. The thirdannouncement was of a “potential spin off” of HP’s struggling PC business. Management’s lack of clarity regarding the timingand rationale for this major corporate action put the PC franchise at risk of share loss and further value erosion.
Despite these serious concerns, I bought more HP stock after it dropped, because the stock price decline was too extreme. Istill think the company has compelling products, especially in its server and storage units, and its printing business generatesprofitable, recurring revenue. While I acknowledge that the PC business is struggling, I’m not overly concerned, because itrepresents only 15% of HP’s earnings. And even though I don’t like the deal’s price, the Autonomy acquisition should greatlyimprove the company’s software and cloud computing offerings. Finally, in late September, the Board decided to replace LeoApotheker with Meg Whitman, the former eBay chief executive. Ms. Whitman has a history of creating value for shareholders,and represents an upgrade from her predecessor.
Oil and gas companies Energen and Plains Exploration and Productionreduced the NAV by 28¢ and 24¢, respectively. Energen’s stock fell27.6% to $40.89 from $56.50, while Plains’ shares declined 40.4% to$22.71 from $38.12. These shares fell because oil prices plunged duringthe third quarter due to concerns about weakening demand for thecommodity. Energen’s stock fell less than Plains, because it has a smallnatural gas utility operation, whose results aren’t impacted by oil prices.In addition, Energen has contracts in place to sell a portion of its 2012-2014 oil and gas production at fixed prices, so it’s not as affected byshort-term moves in commodity prices.
Financial services company SEI Investments fell 31.7% during thequarter from $22.51 to $15.38 and reduced the Fund’s NAV by 21¢.Since SEI earns money based on clients’ assets under management, thestock market’s decline during the quarter reduced the company’sexpected earnings, and the stock went down as a result.
Two companies helped the Fund’s NAV. Google, the world’s leading Internetsearch business, rose 1.6% from $506 to $514 and added 8¢ to the NAV. Wesold some of our position during the quarter at an average price just under$600, which contributed a significant portion of our gain. The stock went upbecause Google reported strong quarterly results, highlighted by 32% annualgrowth in sales. Unfortunately, the stock retreated from its quarterly highwhen Google announced its intent on August 15 to buy Motorola Mobilityfor $12.5 billion. While Google is paying a high price for Motorola Mobility,the deal will significantly strengthen the company’s patent portfolio thatsupports its mobile business.
Parnassus Equity Income Fund Sector Weightingsas of September 30, 2011 (percentage of net assets)
Portfolio Composition
0 5 10 15 20 25
Industrials
Health Care
Financials
Energy
Information Technology
Utilities
Materials
Telecom Services
Consumer Discretionary
Consumer Staples
Fund
S&P 500 Index
4.3%10.6%
15.1%12.5%
5.3%11.4%
8.5%3.9%
6.9%13.4%
14.6%11.9%
14.4%10.0%
1.6%3.4%
19.8%19.7%
0.0%3.2%
9.5%0.0%
Short-term Investments, Other Assets & Liabilities
Portfolio characteristics and holdings aresubject to change periodically.
10

Quarterly Report • Q3 2011 P A R N A S S U S F U N D S
The second winner was MasterCard, which rose 5.3% to $317 from $301 per share and added 6¢ to the NAV. In early August,the company announced annual revenues and earnings growth of 22% and 36%, respectively. The company’s paymentprocessing platform continues to expand across the globe, so I think there’s plenty more growth ahead for this company.
Outlook and StrategyThe global economy weakened again this quarter, and the possibility of a recession in the U.S. increased. The key issue is thatthe global deleveraging process, which began in the wake of the 2008 financial crisis, may take several more years tocomplete. While this process plays out, a significant amount of money that would otherwise contribute to economic growthinstead goes to pay down debt and absorb losses from defaulting borrowers.
The area I’m most concerned about is Europe, where Greece may soon default on its sovereign debts, and other economiessuch as Portugal, Italy and Spain are also showing signs of weakness. The risk is that these sovereign debt crises could pushlarge European banks into insolvency, because they lent large sums to these countries. Not only would a European bankingcrisis necessitate an enormous bailout, but it would also put a damper on business investment, which depends in large parton bank financing. Since many American companies do business in Europe, these problems across the Atlantic couldeventually affect our economy.
Moving to Asia, I’m increasingly concerned that China may experience a significant slowdown in growth. I continue to readreports that China’s real estate market is beginning to soften, bad loans are on the rise and questionable accounting standardsare hurting confidence. Slower growth in China has negative implications for the U.S. economy, because China is animportant trading partner for us.
Returning home, despite record deficit spending and low interest rates, the U.S. economic recovery that began in 2009appears to be weakening. Unfortunately, I don’t think that the Federal Reserve’s low interest rate strategy or PresidentObama’s job plan will help spur growth enough to make a meaningful drop in the 9.1% unemployment rate. History showsthat when economies experience financial shocks and then enter a period of deleveraging, the process takes many years toplay out. This means that short-term fixes probably won’t work, despite the best intentions of our representatives inWashington.
Notwithstanding my pessimism regarding the global economy’s near-term prospects, I’m optimistic that eventually we’llregain our footing and start to grow again. I’m excited about the 41 companies that are in the portfolio. These businessesshould thrive in a wide range of potential economic outcomes. One of the strengths of our relatively concentrated approach isthat even when the economic outlook is gloomy, there are still enough companies for me to build a high convictionportfolio.
As noted above, I reduced the Fund’s exposure in financial, technology and energy stocks. In contrast, I added to our exposurein economically-resistant healthcare companies with strong competitive advantages, such as Gilead Sciences, Abbott Labs,Novartis and Patterson Companies. These companies should grow earnings over the next several years even if the economystays weak. They are also trading at attractive valuations.
We own a high quality portfolio of stocks that reflect our time-tested investment approach. Our process has generatedstrong long-term returns and I’m confident that it will continue to do so. Thank you for your trust and investment in theParnassus Equity Income Fund.
Yours truly,
Todd C. AhlstenPortfolio Manager
11

P A R N A S S U S F U N D S Quarterly Report • Q3 2011
PARNASSUS MID-CAP FUND
Ticker: PARMX
As of September 30, 2011, the NAV of the Parnassus Mid-Cap Fund was $16.72, resulting in a loss of 17.31% for the thirdquarter. This compares to a loss of 18.90% for the Russell Midcap Index (the “Russell”) and a loss of 16.94% for the LipperMulti-Cap Core Average, which represents the average multi-cap core fund followed by Lipper (the “Lipper average”).Although we had a large loss for the quarter and fell slightly behind the Lipper average, we’re pleased that we outperformedthe Russell.
For the first nine months of 2011, the Fund is down 8.38% versus a loss of 12.34% for the Russell and a loss of 12.04% forthe Lipper average. We’re proud that the Fund has so handily outperformed both its benchmarks year-to-date.
The Fund’s long-term performance remains outstanding. Since we began managing the Fund three years ago, the annualizedreturn is 4.93%, better than the Russell’s 3.96% return and the Lipper average’s 1.13% return. The Fund’s five-year annualizedreturn is also well ahead of both indices.
Below is a table comparing the Parnassus Mid-Cap Fund with the Russell and the Lipper average for the one-, three- and five-year periods and for the period since inception on April 29, 2005.
Parnassus Mid-Cap FundAverage AnnualTotal Returns (%) One
YearThreeYears
FiveYears
SinceInception on
April 29,2005
GrossExpense
Ratio
NetExpense
Ratiofor periods ended9/30/2011
Parnassus Mid-Cap Fund 1.63 4.93 2.22 3.83 1.46 1.20
Russell Midcap Index -0.88 3.96 0.56 3.97 NA NA
Lipper Multi-Cap CoreAverage -2.40 1.13 -1.36 1.82 NA NA
Performance data quoted represent past performance and are no guarantee of future returns.
Current performance may be lower or higher than the performance data quoted. Current
performance information to the most recent month-end is on the Parnassus website
(www.parnassus.com). Investment return and principal value will fluctuate so that an
investor’s shares, when redeemed, may be worth more or less than their original principal cost.
Returns shown in the table do not reflect the deduction of taxes a share holder may pay on fund
distributions or redemption of shares. The Russell Midcap Index is an unmanaged index of
common stocks, and it is not possible to invest directly in an index. Index figures do not take
any expenses, fees or taxes into account, but mutual fund returns do. Mid-cap companies can
be more sensitive to changing economic conditions and have fewer financial resources than
large-cap companies. Before investing, an investor should carefully consider the investment
objectives, risks, charges and expenses of the Fund and should carefully read the prospectus,
which contains this and other information. The prospectus is available on the Parnassus
website, or one can be obtained by calling (800) 999-3505. As described in the Fund’s current
prospectus dated May 1, 2011, Parnassus Investments has contractually agreed to limit the
total operating expenses to 1.20% of net assets, exclusive of acquired fund fees, until May 1,
2012. This limitation may be continued indefinitely by the Adviser on a year-to-year basis.
Third Quarter ReviewMajor indices were flat for most of June, butdropped sharply in July and August. The marketfell as the long-running European financial crisisentered a new phase. The concern now is that debtdefaults and poor coordination among Europeanleaders could provoke bank failures and evencause some countries to abandon the euro. In theU.S., a lack of job creation, the stalled housingmarket and weak manufacturing trends weighedon economic growth. Making matters worse,political gridlock over raising the debt ceilingcaused the first-ever downgrade of U.S. sovereigndebt by a credit agency.
The Russell was not immune to the greater markets’downturn and plunged 18.90% during the quarter,more than erasing the 8.08% gain made in the firsthalf of the year. In the trailing twelve-months, theRussell is now down 0.88%, but it is still up104.18% from its low on March 9, 2009.
The Fund provided downside protection in thequarter, losing 17.31% compared to 18.90% forthe Russell. The Fund beat the Russell this quarterbecause of its relatively high exposure to largerstocks, which went down less than smaller stockswithin the mid-cap universe. The Fund was alsooverweighted, in comparison to the index, incompanies with higher returns on equity (ROE),an indication of profitability and efficiency. Sincethese companies did better than companies withlower ROEs during the quarter, this factor helpedour performance.
12

Quarterly Report • Q3 2011 P A R N A S S U S F U N D S
On a sector basis, we lost ground in the quarter due to the Fund being overweighted relative to the index in the energy andindustrial sectors, two of the index’s worst performing groups. The Fund’s underweighted positions in financial and materialsissues, relative to the index, were the most positive allocation decisions for the quarter.
Company AnalysisThe Fund’s performance was primarily affected by stock selection, as opposed to sector allocation. Poor stock selection in theenergy and financial sectors hurt the Fund the most, while good stock picking in the industrial and information technologysectors helped us. The five stocks that reduced the Fund’s NAV are written up below. We had only one stock that made asubstantial positive contribution to the Fund’s performance during the period.
First Horizon, a Tennessee-based bank, hurt the Fund the most, slicing 27¢ off the NAV, as its stock sank 37.5% from $9.54 to$5.96. Investors are concerned about the bank’s exposure to troubled mortgages and home equity loans. While we expect FirstHorizon to incur losses, we believe that the amount will be manageable, and that the market has over-reacted, especiallygiven the company’s well-capitalized balance sheet and core earnings power. We also like the stock because the shares aretrading at bargain-basement prices.
Shares of SEI Investments, the investment technology solutions provider and asset manager, plunged 31.7%, sinking from$22.51 to $15.38, while reducing the Fund’s NAV by 26¢. The company makes most of its revenue on fees earned from assetsunder administration and management, so the stock went down this quarter with the falling equity markets. Profitability hasalso been under pressure as sales cycles have lengthened due to economic uncertainty, and heavy investment continues in therecently launched service offering, the Global Wealth Platform.
Oil- and gas-producer Plains Exploration & Production plummeted 40.4%, from $38.12 to $22.71, decreasing each Fundshare by 22¢. Oil prices fell to the lowest level of the year this past quarter, moving from $95 per barrel to $79 per barrel,which reduced Plains’ profits.
Shares of Valeant Pharmaceuticals, a developer and marketer of specialty pharmaceutical and branded generic drugs, cost theFund 17¢, as its stock fell 28.6% from $51.96 to $37.12. The shares dropped after the company reported weaker-than-expectedfinancial projections, including slow growth in its U.S. neurologybusiness. We still like this well-managed company given its fast growing,overseas generics business and its role as a profitable acquirer in afragmented space.
Insperity, a provider of services that help small businesses manage theiremployees, cost the Fund 17¢ as its stock dropped 24.9% from $29.61to $22.25. Insperity makes money when more businesses sign up for itshuman resources services, so the stock went down during the quarter asinvestors anticipated rising unemployment. The company is alsoundergoing an expensive marketing and rebranding campaign, whichhas been a drag on profitability.
Our only material winner for the period was consumer productscompany WD-40, which added 3¢ to the Fund’s NAV, after the stockshot up 9.1% from $39.04 to $42.59. WD-40 uses petroleum to makeits products, so the stock moved higher early in the quarter when oilprices plunged. We sold the stock into this strength, believing that lowerinput costs wouldn’t make up for slumping sales due to the softeconomic environment.
Outlook and StrategyThe various growth policies enacted since the 2008 financial crisishaven’t been able to offset the weaknesses in our economy.Unemployment remains high, as do debt burdens for governmententities and consumers. Furthermore, the ugly discord in Washington
Parnassus Mid-Cap Fund Sector Weightingsas of September 30, 2011 (percentage of net assets)
Portfolio Composition
0 5 10 15 20 25
Industrials
Health Care
Financials
Energy
Information Technology
Utilities
Materials
Telecom Services
Short-term Investments, Other Assets & Liabilities
Consumer Discretionary
Consumer Staples
Fund
Russell Midcap Index
4.5%16.2%
6.1%7.0%
9.0%7.7%
5.5%7.3%
8.3%18.7%
13.4%10.1%
22.3%12.1%
4.9%6.2%
22.6%13.5%
0.0%1.2%
3.4%0.0%
Portfolio characteristics and holdings aresubject to change periodically.
13

P A R N A S S U S F U N D S Quarterly Report • Q3 2011
and a split government means that additional, meaningful Federal stimulus is unlikely. At the same time, the Federal Reserveis running out of options to boost growth, as is indicated by its latest plan, Operation Twist, which we doubt will have muchof an impact on economic activity. Additional negative factors informing our outlook are the ongoing European sovereigndebt crisis and hints of potential debt problems in China.
Since our investment decisions are company-specific, this outlook is only important to us, when we consider companies thatare especially sensitive to macro factors. Two sectors that contain highly economically-sensitive companies are consumerdiscretionary and financials. Not surprisingly, given our rather gloomy outlook, the portfolio is significantly underweightrelative to the Russell in both these sectors.
Conversely, our key overweight sectors are industrials and information technology, where we’ve identified businesses thatshould perform well even if the economy slows down. Our industrial exposure is composed mostly of service providers, likeWaste Management and Verisk, with high degrees of recurring revenue and strong competitive positions. These same positivefactors characterize two of our largest information technology holdings, Paychex and Fiserv.
Regardless of the environment, our core strategy is to execute our fundamental process for stock selection. This leads us toinvest in attractively valued companies with secular growth opportunities, durable competitive advantages and qualityleadership teams. We think this approach will lead to downside protection in declining markets, upside participation in risingmarkets and long-term outperformance.
Thank you for your investment.
Yours truly,
Matthew D. Gershuny Benjamin E. Allen Lori A. KeithPortfolio Manager Portfolio Manager Portfolio Manager
14

Quarterly Report • Q3 2011 P A R N A S S U S F U N D S
PARNASSUS SMALL-CAP FUND
Ticker: PARSX
As of September 30, 2011, the NAV of the Parnassus Small-Cap Fund was $18.79, resulting in a loss of 23.12% for the thirdquarter. By comparison, the Russell 2000 Index of smaller companies (“Russell 2000”) had a loss of 21.87% and the LipperSmall-Cap Core Average, which represents the average small-cap core fund followed by Lipper (“Lipper average”), had a lossof 21.33%. For the year-to-date, the Small-Cap Fund is down 21.54%, compared to a loss of 17.02% for the Russell 2000 anda loss of 16.13% for the Lipper average.
The Fund’s performance for this year looks terrible, but our longer-term performance still looks pretty good. Below is a tablecomparing the performance of the Small-Cap Fund with that of the Russell 2000 and the Lipper average for the one-, three-and five-year periods and the period since inception. As you can see from the table, we’re behind for the one-year period, butwe’re well ahead of both our benchmarks for the three- and five-year periods and the period since inception.
One reason our performance looks so bad this year is that many of our stocks have been hit by panic-selling amidst the sharpdowndraft of the stock market. We think that many of these quoted prices are far below the stocks’ intrinsic value, and whenreason prevails once again, the quotes will be substantially higher. We have not changed our investment objective and we’repicking stocks the same way we’ve always done for the Small-Cap Fund, and we think there’s a lot of intrinsic value in ourportfolio.
Parnassus Small-Cap FundAverage Annual TotalReturns (%) One
YearThreeYears
FiveYears
SinceInceptionApril 29,
2005
GrossExpense
Ratio
NetExpense
Ratiofor periods ended9/30/2011
Parnassus Small-Cap Fund -8.17 3.54 3.34 5.54 1.30 1.20
Russell 2000 Index -3.53 -0.37 -1.02 3.01 NA NA
Lipper Small-Cap CoreAverage -2.88 0.97 -0.75 2.87 NA NA
Performance data quoted represent past performance and are no guarantee of future returns.
Current performance may be lower or higher than the performance data quoted. Current
performance information to the most recent month-end is available on the Parnassus website
(www.parnassus.com). Investment return and principal value will fluctuate so that an
investor’s shares, when redeemed, may be worth more or less than their original principal cost.
Returns shown in the table do not reflect the deduction of taxes a shareholder may pay on fund
distributions or redemption of shares. The Russell 2000 Index is an unmanaged index of
common stocks, and it is not possible to invest directly in an index. Index figures do not take
any expenses, fees or taxes into account, but mutual fund returns do. Small-cap companies can
be particularly sensitive to changing economic conditions and have fewer financial resources
than large-cap companies. Before investing, an investor should carefully consider the
investment objectives, risks, charges and expenses of the Fund and should carefully read the
prospectus, which contains this and other information. The prospectus is on the Parnassus
website, or one can be obtained by calling (800) 999-3505. As described in the Fund’s current
prospectus dated May 1, 2011, Parnassus Investments has contractually agreed to limit the
total operating expenses to 1.20% of net assets, exclusive of acquired fund fees, until May 1,
2012. This limitation may be continued indefinitely by the Adviser on a year-to year basis.
Company AnalysisFive stocks reduced the value of each fund shareby 29¢ or more during the quarter, with nocompany making a substantial positivecontribution. The one that hurt us the most wasQuicksilver Resources, a natural gas-producer. Thestock sank 48.6% during the quarter from $14.76to $7.58 for a loss of 38¢ for each fund share.Natural gas prices dropped 15% during thequarter from $4.33 to $3.67 per million Britishthermal units, and this hurt the stock, but thestock sank even further when the companyannounced plans to spend more on drillingprograms without any indication that productionwould be higher. Despite the bad news, we’reholding the stock because the price is so low, andwe expect that Quicksilver will be able to increaseproduction and revenue over the next few years.
Oil- and gas-producer W&T Offshore saw its stockfall 47.3% from $26.12 to $13.76, while cutting33¢ off the NAV. Crude oil prices dropped sharplyduring the quarter from $95 to $79 a barrel, andthe company’s drilling costs have not dropped asmuch as the price of crude oil. We’re holding thestock, since we expect oil prices to rise again anddrilling costs to drop.
Homebuilder PulteGroup dropped 48.4% duringthe quarter from $7.66 to $3.95, chopping 33¢ offthe NAV. See the discussion on PulteGroup in theParnassus Fund section to get my views on thestock.
15

P A R N A S S U S F U N D S Quarterly Report • Q3 2011
Brocade Communications, a provider of storage and networking equipment, sliced 31¢ off each fund share, as its stock fell33.1% from $6.46 to $4.32. The company announced quarterly results that were below its previous guidance. Brocade’sfinancial results have been inconsistent since it acquired Foundry Networks in 2008, but we think execution will improveover time. The company has the leading market share in fiber channel for the data center and a strong product platform in thegrowing networking equipment space.
First Horizon, a Tennessee-based bank, cut 29¢ off each fund share, asits stock sank 37.5% from $9.54 to $5.96. Investors are concerned aboutthe bank’s exposure to mortgages and home equity loans in the nationalmarket. Early in the last decade, the bank had a disastrous foray into thenational lending market, and the stock is still suffering theconsequences. We think the bank can handle any additional losses itmay incur, because of its strong balance sheet and earning power. FirstHorizon has now pulled back to its base in Tennessee, where it hasprofitable, well-managed operations. Selling at only 75% of tangiblebook value, the stock is on the bargain table.
There were no stocks that made a substantial positive contribution tothe Fund’s performance during the period.
Yours truly,
Jerome L. DodsonPortfolio Manager
Parnassus Small-Cap Fund Sector Weightingsas of September 30, 2011 (percentage of net assets)
Portfolio Composition Fund
Russell 2000 Index
0 10 20 30 40 50
Industrials
Health Care
Financials
Energy
Information Technology
Utilities
Materials
Telecom Services
Short-term Investments, Other Assets & Liabilities
Consumer Discretionary
Consumer Staples
10.5%13.2%
1.2%4.3%
6.1%6.6%
5.3%3.5%
14.8%21.7%
16.2%12.9%
3.1%15.1%
3.1%4.4%
38.2%17.2%
1.5%0.0%
0.0%1.1%
Portfolio characteristics and holdings aresubject to change periodically.
16

Quarterly Report • Q3 2011 P A R N A S S U S F U N D S
PARNASSUS WORKPLACE FUND
Ticker: PARWX
As of September 30, 2011, the NAV of the Parnassus Workplace Fund was $18.04, resulting in a loss of 16.09% for the thirdquarter. This compares to a loss of 13.87% for the S&P 500 Index (“S&P 500”) and a loss of 15.06% for the Lipper Large-CapCore Average, which represents the average large-cap core fund followed by Lipper (“Lipper average”). For the year-to-date,the Workplace Fund lost 13.31%, compared to a loss of 8.69% for the S&P 500 and a loss of 10.63% for the Lipper average.
Below is a table comparing the Workplace Fund with the S&P 500 and the Lipper average for the past one-, three- and five-year periods, as well as the period since inception. You can see from the table that the Fund lags its benchmarks for theone-year period, but is substantially ahead of its benchmarks for the three- and five-year periods and for the period sinceinception.
Company AnalysisThe stock that hurt the Workplace Fund the most was Hewlett-Packard, which cut 44¢ off the NAV as it sank 38.3% from$36.40 to $22.45. See the comments in the Parnassus Fund section to get my views on the company.
Brocade Communications swooned 33.1% during the quarter from $6.46 to $4.32 for a loss of 32¢ for each fund share. Seethe comments in the Small-Cap Fund section for my take on the company.
SEI Investments manages assets and provides technology to investment managers such as Parnassus Investments. The stockplunged 31.7% during the quarter from $22.51 to $15.38, while chopping 30¢ off each fund share. Most of the company’s
Parnassus Workplace FundAverage Annual TotalReturns (%) One
YearThreeYears
FiveYears
SinceInceptionApril 29,
2005
GrossExpense
Ratio
NetExpense
Ratiofor periods ended9/30/2011
Parnassus Workplace Fund -4.29 6.25 4.24 5.36 1.25 1.20
S&P 500 Index 1.13 1.23 -1.18 1.75 NA NA
Lipper Large-Cap CoreAverage -1.51 0.11 -1.77 1.25 NA NA
Performance data quoted represent past performance and are no guarantee of future returns.
Current performance may be lower or higher than the performance data quoted. Current
performance information to the most recent month-end is available on the Parnassus website
(www.parnassus.com). Investment return and principal value will fluctuate so that an
investor’s shares, when redeemed, may be worth more or less than their original principal cost.
Returns shown in the table do not reflect the deduction of taxes a shareholder may pay on fund
distributions or redemption of shares. The S&P 500 Index is an unmanaged index of common
stocks, and it is not possible to invest directly in an index. Index figures do not take any
expenses, fees or taxes into account, but mutual fund returns do. Before investing, an investor
should carefully consider the investment objectives, risks, charges and expenses of the Fund and
should carefully read the prospectus, which contains this and other information. The prospectus
is available on the Parnassus website, or one can be obtained by calling (800) 999-3505. As
described in the Fund’s current prospectus dated May 1, 2011, Parnassus Investments has
contractually agreed to limit the total operating expenses to 1.20% of net assets, exclusive of
acquired fund fees, until May 1, 2012. This limitation may be continued indefinitely by the
Adviser on a year-to-year basis.
revenue comes from fees earned for managing andadministering assets, so the falling equity marketsreduced earnings and the stock suffered. Thecompany is also incurring heavy expenses to buildits new service called the Global Wealth Platform.
Corning dropped 31.9% during the quarter from$18.15 to $12.36, reducing the NAV by 28¢. Thecompany makes most of its profits by sellingspecial glass for computer screens or high-definition television sets. Manufacturers havereduced their orders for special glass, because theyexpect weaker demand for monitors andtelevision sets.
17

P A R N A S S U S F U N D S Quarterly Report • Q3 2011
First Horizon cost the Fund 24¢, because its stock dropped 37.5% from$9.54 to $5.96. See the comments in the Small-Cap Fund section for mytake on the company.
Yours truly,
Jerome L. DodsonPortfolio Manager
Parnassus Workplace Fund Sector Weightingsas of September 30, 2011 (percentage of net assets)
Portfolio Composition
0 10 20 30 40 6050 70
Industrials
Health Care
Financials
Energy
Information Technology
Utilities
Materials
Telecom Services
Short-term Investments, Other Assets & Liabilities
Consumer Discretionary
Consumer Staples
Fund
S&P 500 Index
13.4%10.6%
4.3%12.5%
1.5%11.4%
2.0%3.9%
12.1%13.4%
2.3%11.9%
4.5%10.0%
0.0%3.4%
54.6%19.7%
5.3%0.0%
0.0%3.2%
Portfolio characteristics and holdings aresubject to change periodically.
18

Quarterly Report • Q3 2011 P A R N A S S U S F U N D S
PARNASSUS FIXED-INCOME FUND
Ticker: PRFIX
As of September 30, 2011, the NAV of the Parnassus Fixed-Income Fund was $17.67, resulting in a gain of 3.84% for the thirdquarter (including dividends). This compares to a gain of 4.74% for the Barclays Capital U.S. Government/Credit Bond Index(“Barclays index”) and a gain of 2.38% for the Lipper A-Rated Bond Fund Average, which represents the average return of allA-rated bond funds followed by Lipper (“Lipper average”). Since the beginning of the year, the total return for the Fund was6.20%, compared to a gain of 7.47% for the Barclays index and a gain of 5.33% for the Lipper average.
Below is a table comparing the performance of the Fund with that of the Barclays index and the Lipper average. Averageannual total returns are for the one-, three-, five- and ten-year periods. The 30-day SEC yield for the Fund for September 2011was 0.82%.
Third Quarter ReviewIt was a challenging third quarter for global markets, as Europe’s sovereign debt crisis escalated, and U.S. economic datacontinued to point to a weak recovery. Global financial markets have not only been pummeled by the rising possibility of aGreek default, but also by a lower global economic growth outlook. Late in the quarter, the International Monetary Fund
Parnassus Fixed-Income FundAverage AnnualTotal Returns (%) One
YearThreeYears
FiveYears
TenYears
GrossExpense
Ratio
NetExpense
Ratiofor periods ended 9/30/2011
Parnassus Fixed-Income Fund 4.02 8.13 6.12 5.71 0.83 0.75
Barclays Capital U.S.Government/Credit Bond Index 5.14 8.41 6.51 5.73 NA NA
Lipper A-Rated Bond FundAverage 4.10 8.60 5.51 5.28 NA NA
Performance data quoted represent past performance and are no guarantee of future returns.
Current performance may be lower or higher than the performance data quoted. Current
performance information to the most recent month-end is available on the Parnassus website
(www.parnassus.com). Investment return and principal value will fluctuate so that an
investor’s shares, when redeemed, may be worth more or less than their original cost. Returns
shown in the table do not reflect the deduction of taxes a shareholder would pay in fund
distributions or redemption of shares. The Barclays Capital U.S. Government/Credit Bond
Index is an unmanaged index of bonds, and it is not possible to invest directly in an index.
Index figures do not take any expenses, fees, or taxes into account, but mutual fund returns do.
Before investing, an investor should carefully consider the investment objectives, risks, charges
and expenses of the Fund and should carefully read the prospectus, which contains this and
other information. The prospectus is on the Parnassus website, or one can be obtained by
calling (800) 999-3505. As described in the Fund’s current prospectus dated May 1, 2011,
Parnassus Investments has contractually agreed to reduce its investment advisory fee to the
extent necessary to limit total operating expenses to 0.75% of net assets for the Parnassus
Fixed-Income Fund. This limitation continues until May 1, 2012, and may be continued
indefinitely by the investment adviser on a year-to-year basis.
downgraded its global growth forecasts for both2011 and 2012. In the meantime, the FederalReserve Open Market Committee commented on“significant downside risks to the economicoutlook, including strains in global financialmarkets.”
In an attempt to revive the U.S. economy withcredit growth, Ben Bernanke, the Federal ReserveChairman, announced a plan to lower long-terminterest rates. Unlike previous monetaryinterventions, this new program will not pumpadditional money into the economy. Instead, theFederal Reserve Open Market Committee willmerely alter the composition of its securitiesportfolio, by selling $400 billion of Treasurysecurities with maturities below three years andreinvesting the proceeds in maturities of six to 30years.
As a result of this announcement and a generalflight to safety, Treasury yields fell to extremely lowlevels. The long-end of the yield curve, 10-year to30-year maturities, decreased the most. The 10-yearbond yield dropped 124 basis points (one basispoint equals 0.01%) to 1.92% during the thirdquarter. The yield on the 30-year bond fell 146basis points to 2.91%. This fall in interest rates wasquite significant, and Treasury bonds had thehighest quarterly returns in almost three years.
The Fund’s performance benefited from thisfalling yield environment, with a gain of 3.84%for the quarter. Our Treasury bonds were thebiggest winner, adding 50¢ to the NAV. Corporatebonds increased the NAV by 18¢, while ourconvertible bonds were flat.
19

P A R N A S S U S F U N D S Quarterly Report • Q3 2011
Despite the huge gain from the Treasury market, the Fund couldn’t keep up with the Barclays index. For the third quarter, theFund trailed the Barclays index by 90 basis points. This underperformance was mainly due to the fact that we had lessexposure than the benchmark to the U.S. government bond market. As of the end of the quarter, U.S. government bondsrepresented 62% of the Barclays index, compared to 51% for the Fund.
The Fund was ahead of the Lipper average by 146 basis points, primarily due to our higher weighting in the U.S. Treasurymarket. Most of our peers also owned mortgage-back securities (MBS) and commercial mortgage-back securities (CMBS),while we don’t currently have any exposure to these securities. During the third quarter, these securities didn’t perform as wellas U.S. Treasury bonds, as MBS returned only 2.36% and CMBS had a loss of 0.86%. This compares to a gain of 5.85% forU.S. government bonds.
Outlook and StrategyIn my view, the problems that led to a global panic in 2008 have been left unresolved and we are seeing them now reemergeamid slowing economic growth. The issue was, and still is, rooted in unsustainable increases in debt levels to fuelconsumption growth. When I look at policymakers’ responses, it seems to me that they haven’t grasped our predicament. Weare facing a global debt crisis with excessive leverage and slow growth, which is unlikely be solved by piling on more debt.
I think that the recent monetary stimulus will have limited lasting results in reviving the U.S. economy. Credit growth in theU.S. is lackluster, not because of high interest rates, but due to lack of confidence in the prospects for the U.S. economy. Ithink that households and businesses are currently more preoccupied with lowering their debt burdens to improve theirfinancial stability than adding more leverage.
Financial markets are likely to continue to be tremendously volatile, as the global economy is balancing on a knife’s edgebetween a slowdown and another outright recession. It’s still unclear which way the outlook may break, but both prospectsare definitely negative for investors’ sentiment. Adding to the uncertainty is the fact that most governments continue toimplement austerity and deficit reduction measures despite slowing growth.
Notwithstanding potential negative shocks coming from Europe or the developing markets, my view over the next quartersremains unchanged from last quarter. I think that the U.S. economy should continue to grow, albeit at a very tepid pace.Because I see more downside risks than upside potential, the portfolioremains in a defensive position for now. As of the end of the thirdquarter, U.S. Treasury bonds continue to be our largest holding,representing 51% of the Fund’s total net assets. The rest of the portfolioconsists of corporate bonds (33%), Treasury Inflation-ProtectedSecurities (3%), convertible bonds (3%), and cash and short-termsecurities (10%).
Cash and short-term investments have increased during the thirdquarter, because I think that the current yields offered by bonds are toolow. For now, I prefer to wait for better investment opportunities ratherthan chase higher yields in riskier investments.
As always, I remain vigilant to changes in the economic and financialoutlook and will position the portfolio accordingly.
Thank you for your trust and investments in the Parnassus Fixed-Income Fund.
Yours truly,
Minh T. BuiPortfolio Manager
Parnassus Fixed-Income Fund Sector Weightingsas of September 30, 2011 (percentage of net assets)
Fund
U.S. Government Treasury Bonds 53.9%
Corporate Bonds 32.7%
Convertible Bonds 3.0%
Short-term Investments, Other Assets& Liabilities 10.4%
100.0%
Portfolio characteristics and holdings aresubject to change periodically.
20

Quarterly Report • Q3 2011 P A R N A S S U S F U N D S
Responsible Investing NotesBy Milton Moskowitz
If you see the name Ferragamo, you might think: Italian shoes that cost $500. But think again. I am looking at a recent full-page magazine ad that shows a Ferragamo loafer and proclaims: “Ferragamo World Supports Socially Responsible Initiatives.”Most of the rest of the page is blank. At the bottom of the page, in 6-point type, is the legend: “AcumenFund.org. Changingthe way the world tackles poverty.” Do a Google search for “Acumen Fund” and you will discover that this is a non-profitorganization founded in 2001 with a mission to find innovative ways to help poor people around the world. Initial fundersincluded the Rockefeller Foundation and the Cisco Systems Foundation. Acumen’s approach is to invest in social enterprises– for-profit companies whose products and services are serving the poor in three areas: health, water, housing. And now yourealize that Ferragamo is fulfilling its social responsibility by funding Acumen’s work. Good job!
Ferragamo is just one of a dozen corporations which have been mounting advertising campaigns to display their goodintentions. Others include Goldman Sachs, Hitachi, Siemens, ExxonMobil and Chevron. Chevron’s campaign, which hasbeen running for several years, is very clever. It takes the criticism leveled at oil companies and replies, “We agree.” Alsonotable is the $13 million campaign just launched by the Japanese retailer, Uniglo. It features testimonials from celebritiesand unknowns who agreed to participate because Uniglo will donate money to their favorite charities. For example, DavidChang, owner of the Momofuko restaurants in New York, said he agreed to pose because Uniglo will send donations to agarden at P.S. 216 in Gravesend, Brooklyn, the first New York affiliate of the Edible Schoolyard program. Stuart Elliott, whowrites the advertising news column for the New York Times, said the campaign is designed to position Uniglo as a “socialbrand” rather than a “fashion brand.”
Just out is the 2011 list of the 100 Best Companies for Working Mothers. Compiled annually by Working Mother magazine,the list salutes companies that help employees balance their work and family lives. On the roster this year are 11 Parnassusportfolio companies: Abbott Laboratories, Accenture, Capital One, Cisco Systems, Hewlett-Packard, IBM, Intel, JPMorganChase, MasterCard, First Horizon National and Procter & Gamble. What do these companies have that is missing in otherfirms? Here are some comparisons:
• Flextime schedules: Every company on the list offers this option, compared to 53% nationally.• Paid maternity leave: 100%, compared to 16% nationally.• On-site lactation rooms: Offered by every company on the list, compared to 28% nationally.• Paid adoption leave: 79%, compared to 16% nationally.• Paid sick leave: 66%, compared to 37% nationally.
See the October issue of Working Mother for rundowns on all 100 companies.
Procter & Gamble, whose brands include Tide, Pampers, Charmin, Head & Shoulders and Gillette is a longtime holding ofthe Parnassus Equity Income Fund, and one reason it makes the Working Mother list is by providing women with a path to thetop. 42% of executives and managers at P&G are female. Also impressive is female representation on the board of directors.Of P&G’s 11 directors, five are women: Angela F. Braly, CEO of Wellpoint; Susan Desmond-Hellman, Chancellor of theUniversity of California at San Francisco and former top executive at Genentech; Meg Whitman, former CEO of eBay whobegan her career at P&G, recently ran for Governor of California and has just been named CEO of Hewlett-Packard; MaryAgnes Wilderotter, CEO of Frontier Communications; and Patricia A. Woertz, CEO of Archer Daniels Midland.
Finally, there is 101-year-old IBM, a holding of the Parnassus Workplace Fund. The company has forged an interestingpartnership with the Board of Education of New York City. They have created a new science-based high school, Pathways inTechnology or “P-Tech,” that opened its doors in September to 130 students, 80% of them from low-income families.Located in Brooklyn, P-Tech will go from grades nine to 14, with graduates receiving an associate’s degree. IBM helped tofund the school with $250,000. It also helped to design the curriculum, and it will match the students with mentors from theIBM workforce. All students will have a guaranteed job waiting for them at IBM. “It’s a ticket to the middle class,” said MayorMichael Bloomberg.
Milton Moskowitz is the co-author of the Fortune magazine survey, “The 100 Best Companies to Work For,” and the co-originatorof the annual Working Mother magazine survey, “The 100 Best Companies for Working Mothers.” Mr. Moskowitz serves as aconsultant to Parnassus Investments in evaluating workplaces for potential investments by the Parnassus Workplace Fund. NeitherFortune magazine nor Working Mother magazine has any role in the management of the Funds, and there is no affiliationbetween Parnassus and either publication.
21

P A R N A S S U S F U N D S Quarterly Report • Q3 2011
PARNASSUS FUNDPortfolio of Investments as of September 30, 2011 (unaudited)
Shares EquitiesMarket Value
($)Per
SharePercent ofNet Assets
1,560,000 Cisco Systems Inc. 24,164,400 15.49 6.8%1,350,000 Finisar Corp. 23,679,000 17.54 6.7%1,000,000 Intel Corp. 21,330,000 21.33 6.0%
825,000 Wells Fargo & Co. 19,899,000 24.12 5.6%350,000 QUALCOMM Inc. 17,020,500 48.63 4.8%
32,000 Google Inc. 16,460,160 514.38 4.6%1,300,000 Ciena Corp. 14,560,000 11.20 4.1%
450,000 JPMorgan Chase & Co. 13,554,000 30.12 3.8%600,000 Hewlett-Packard Company 13,470,000 22.45 3.8%500,000 Adobe Systems Inc. 12,085,000 24.17 3.4%
1,300,000 DR Horton Inc. 11,752,000 9.04 3.3%600,000 Lowe’s Cos., Inc. 11,604,000 19.34 3.3%
1,075,000 Applied Materials Inc. 11,126,250 10.35 3.1%750,000 Toll Brothers Inc. 10,822,500 14.43 3.1%850,000 Corning Inc. 10,506,000 12.36 3.0%
2,625,000 PulteGroup Inc. 10,368,750 3.95 2.9%2,400,000 Brocade Communications Systems Inc. 10,368,000 4.32 2.9%
210,000 Target Corp. 10,298,400 49.04 2.9%690,000 W&T Offshore Inc. 9,494,400 13.76 2.7%400,000 Insperity Inc. 8,900,000 22.25 2.5%300,000 eBay Inc. 8,847,000 29.49 2.5%230,000 Verisk Analytics Inc. 7,997,100 34.77 2.3%
1,100,000 KB Home 6,446,000 5.86 1.8%20,000 MasterCard Inc. 6,343,200 317.16 1.8%
1,375,000 Tellabs Inc. 5,898,750 4.29 1.7%1,090,000 MIPS Technologies Inc. 5,275,600 4.84 1.5%
300,000 SEI Investments Co. 4,614,000 15.38 1.3%200,000 Tower Group Inc. 4,572,000 22.86 1.3%
50,000 Nike Inc. 4,275,500 85.51 1.2%120,000 The Walt Disney Co. 3,619,200 30.16 1.0%100,000 Autodesk Inc. 2,778,000 27.78 0.8%
50,000 Teleflex Inc. 2,688,500 53.77 0.8%300,000 Quicksilver Resources Inc. 2,274,000 7.58 0.6%
50,000 Gilead Sciences Inc. 1,940,000 38.80 0.5%50,000 Scripps Networks Interactive Inc. 1,858,500 37.17 0.5%40,000 CVS Caremark Corp. 1,343,200 33.58 0.4%60,000 Staples Inc. 798,000 13.30 0.2%50,000 First Horizon National Corp. 298,000 5.96 0.1%
Total investment in equities 353,328,910 99.6%
Total short-term securities 1,367,981 0.4%
Other assets and liabilities (138,941) 0.0%
Total net assets 354,557,950 100.0%
Net asset value as of September 30, 2011 $32.78
22

Quarterly Report • Q3 2011 P A R N A S S U S F U N D S
PARNASSUS EQUITY INCOME FUNDPortfolio of Investments as of September 30, 2011 (unaudited)
Shares EquitiesMarket Value
($)Per
SharePercent ofNet Assets
7,173,772 Waste Management Inc. 233,578,016 32.56 6.7%2,825,000 Procter & Gamble Co. 178,483,500 63.18 5.1%
315,000 Google Inc. 162,029,700 514.38 4.6%2,575,000 Teleflex Inc. 138,457,750 53.77 4.0%6,878,143 Questar Corp. 121,811,913 17.71 3.5%2,380,000 Target Corp. 116,715,200 49.04 3.3%4,300,000 Sysco Corp. 111,370,000 25.90 3.2%
340,077 MasterCard Inc. 107,858,821 317.16 3.1%2,190,000 McCormick & Co. 101,090,400 46.16 2.9%3,785,000 Paychex Inc. 99,810,450 26.37 2.8%2,149,990 Royal Bank of Canada 98,297,543 45.72 2.8%2,800,000 CVS Caremark Corp. 94,024,000 33.58 2.7%4,050,000 Hewlett-Packard Company 90,922,500 22.45 2.6%2,000,000 Energen Corp. 81,780,000 40.89 2.3%1,575,000 Abbott Laboratories 80,545,500 51.14 2.3%1,250,000 United Parcel Service Inc. 78,937,500 63.15 2.3%4,000,000 MDU Resources Group Inc. 76,760,000 19.19 2.2%2,400,000 Iron Mountain Inc. 75,888,000 31.62 2.2%1,850,000 Gilead Sciences Inc. 71,780,000 38.80 2.0%1,250,000 Gen-Probe Inc. 71,562,500 57.25 2.0%2,500,000 VeriSign Inc. 71,525,000 28.61 2.0%4,600,000 SEI Investments Co. 70,748,000 15.38 2.0%1,250,000 Novartis AG (ADR) 69,712,500 55.77 2.0%1,400,000 QUALCOMM Inc. 68,082,000 48.63 1.9%1,070,000 Accenture PLC 56,367,600 52.68 1.6%
600,000 Praxair Inc. 56,088,000 93.48 1.6%2,200,000 Spectra Energy Corp. 53,966,000 24.53 1.5%1,200,000 Northwest Natural Gas Co. 52,920,000 44.10 1.5%1,175,000 AGL Resources Inc. 47,869,500 40.74 1.4%1,285,000 Valeant Pharmaceuticals International Inc. 47,699,200 37.12 1.4%1,000,000 Cooper Industries PLC 46,120,000 46.12 1.3%1,080,000 WD-40 Co. 43,027,200 39.84 1.2%2,500,000 Cisco Systems Inc. 38,725,000 15.49 1.1%1,104,900 Verisk Analytics Inc. 38,417,373 34.77 1.1%1,250,000 JPMorgan Chase & Co. 37,650,000 30.12 1.1%1,000,000 Aflac Inc. 34,950,000 34.95 1.0%
400,000 Nike Inc. 34,204,000 85.51 1.0%1,000,000 Pentair Inc. 32,010,000 32.01 0.9%1,047,714 Patterson Companies Inc. 29,996,052 28.63 0.9%2,000,000 W&T Offshore Inc. 27,520,000 13.76 0.8%
23

P A R N A S S U S F U N D S Quarterly Report • Q3 2011
PARNASSUS EQUITY INCOME FUNDPortfolio of Investments as of September 30, 2011 (unaudited) (continued)
Shares EquitiesMarket Value
($)Per
SharePercent ofNet Assets
1,000,000 Plains Exploration & Production Co. 22,710,000 22.71 0.6%
Total investment in equities 3,172,010,718 90.5%
Total short-term securities 393,372,603 11.2%
Other assets and liabilities (61,566,178) (1.7%)
Total net assets 3,503,817,143 100.0%
Net asset value as of September 30, 2011
Investor shares $24.23
Institutional shares $24.29
24

Quarterly Report • Q3 2011 P A R N A S S U S F U N D S
PARNASSUS MID-CAP FUNDPortfolio of Investments as of September 30, 2011 (unaudited)
Shares EquitiesMarket Value
($)Per
SharePercent ofNet Assets
92,000 Waste Management Inc. 2,995,520 32.56 6.0%40,000 Teleflex Inc. 2,150,800 53.77 4.3%60,000 Verisk Analytics Inc. 2,086,200 34.77 4.2%75,000 Paychex Inc. 1,977,750 26.37 4.0%72,000 Sysco Corp. 1,864,800 25.90 3.7%
100,000 Questar Corp. 1,771,000 17.71 3.6%77,500 Insperity Inc. 1,724,375 22.25 3.5%60,000 Patterson Companies Inc. 1,717,800 28.63 3.4%55,000 Equifax Inc. 1,690,700 30.74 3.4%33,000 Ecolab Inc. 1,613,370 48.89 3.2%
100,000 SEI Investments Co. 1,538,000 15.38 3.1%29,000 Fiserv Inc. 1,472,330 50.77 3.0%60,000 Adobe Systems Inc. 1,450,200 24.17 2.9%
225,000 First Horizon National Corp. 1,341,000 5.96 2.7%55,000 Synopsys Inc. 1,339,800 24.36 2.7%25,000 Check Point Software Technologies Ltd. 1,319,000 52.76 2.6%45,000 VeriSign Inc. 1,287,450 28.61 2.6%33,500 Scripps Networks Interactive Inc. 1,245,195 37.17 2.5%33,500 Valeant Pharmaceuticals International Inc. 1,243,520 37.12 2.5%30,000 Energen Corp. 1,226,700 40.89 2.5%25,000 McCormick & Co. 1,154,000 46.16 2.3%35,000 Iron Mountain Inc. 1,106,700 31.62 2.2%36,000 Noble Corp. 1,056,600 29.35 2.1%25,000 Motorola Solutions Inc. 1,047,500 41.90 2.1%90,000 Charles Schwab Corp. 1,014,300 11.27 2.0%42,500 Plains Exploration & Production Co. 965,175 22.71 1.9%50,000 MDU Resources Group Inc. 959,500 19.19 1.9%15,500 Gen-Probe Inc. 887,375 57.25 1.8%12,500 Compass Minerals International Inc. 834,750 66.78 1.7%24,000 Pentair Inc. 768,240 32.01 1.5%16,500 Cooper Industries PLC 760,980 46.12 1.5%45,000 Symantec Corp. 733,500 16.30 1.5%13,000 Teradata Corp. 695,890 53.53 1.4%15,000 Nordstrom Inc. 685,200 45.68 1.4%22,000 DENTSPLY International Inc. 675,180 30.69 1.4%24,000 Ultra Petroleum Corp. 665,280 27.72 1.3%
8,500 Pioneer Natural Resources Co. 559,045 65.77 1.1%6,000 Coach Inc. 310,980 51.83 0.6%6,500 Capital One Financial Corp. 257,595 39.63 0.5%
Total investment in equities 48,193,300 96.6%
Total short-term securities 1,948,032 3.9%
Other assets and liabilities (261,584) (0.5%)
Total net assets 49,879,748 100.0%
Net asset value as of September 30, 2011 $16.72
25

P A R N A S S U S F U N D S Quarterly Report • Q3 2011
PARNASSUS SMALL-CAP FUNDPortfolio of Investments as of September 30, 2011 (unaudited)
Shares EquitiesMarket Value
($)Per
SharePercent ofNet Assets
2,600,000 Finisar Corp. 45,604,000 17.54 7.4%5,000,000 Brocade Communications Systems Inc. 21,600,000 4.32 3.5%1,330,000 VCA Antech Inc. 21,253,400 15.98 3.4%
395,000 Teleflex Inc. 21,239,150 53.77 3.4%1,325,000 Calgon Carbon Corp. 19,305,250 14.57 3.1%
865,560 Insperity Inc. 19,258,710 22.25 3.1%2,000,000 Ceragon Networks Ltd. 19,100,000 9.55 3.1%1,060,000 Questar Corp. 18,772,600 17.71 3.0%3,100,000 First Horizon National Corp. 18,476,000 5.96 3.0%
725,000 Hanesbrands Inc. 18,132,250 25.01 2.9%760,278 Tower Group Inc. 17,379,955 22.86 2.8%
1,550,000 Ciena Corp. 17,360,000 11.20 2.8%3,970,000 Tellabs Inc. 17,031,300 4.29 2.8%3,850,000 Harmonic Inc. 16,401,000 4.26 2.6%2,050,000 Artio Global Investors Inc. 16,318,000 7.96 2.6%
475,000 Arbitron Inc. 15,713,000 33.08 2.5%1,200,000 First American Financial Corp. 15,360,000 12.80 2.5%
875,000 Websense Inc. 15,137,500 17.30 2.4%350,000 AGL Resources Inc. 14,259,000 40.74 2.3%
1,275,000 Pinnacle Financial Partners Inc. 13,948,500 10.94 2.3%1,830,000 Quicksilver Resources Inc. 13,871,400 7.58 2.2%
415,000 EZchip Semiconductor Ltd. 13,786,300 33.22 2.2%950,000 W&T Offshore Inc. 13,072,000 13.76 2.1%
2,100,000 PMC-Sierra Inc. 12,558,000 5.98 2.1%3,070,000 PulteGroup Inc. 12,126,500 3.95 2.0%1,200,000 Mentor Graphics Corp. 11,544,000 9.62 1.9%
400,000 Cyberonics Inc. 11,320,000 28.30 1.9%705,000 Quest Software Inc. 11,195,400 15.88 1.8%500,000 Energy XXI (Bermuda) Ltd. 10,725,000 21.45 1.7%
1,350,000 ClickSoftware Technologies Ltd. 10,516,500 7.79 1.7%476,487 Genomic Health Inc. 10,473,184 21.98 1.7%344,712 Salix Pharmaceuticals Ltd. 10,203,475 29.60 1.6%587,691 LHC Group Inc. 10,026,008 17.06 1.6%
1,650,000 KB Home 9,669,000 5.86 1.6%104,000 Bio-Rad Laboratories Inc. 9,440,080 90.77 1.5%650,000 Toll Brothers Inc. 9,379,500 14.43 1.5%
1,792,800 MIPS Technologies Inc. 8,677,152 4.84 1.4%184,000 WD-40 Co. 7,330,560 39.84 1.2%470,000 SEI Investments Co. 7,228,600 15.38 1.2%
2,106,600 DragonWave Inc. 6,951,780 3.30 1.1%470,000 Furiex Pharmaceuticals Inc. 6,688,100 14.23 1.1%200,000 VeriSign Inc. 5,722,000 28.61 0.9%250,000 Electronics for Imaging Inc. 3,367,500 13.47 0.5%
26

Quarterly Report • Q3 2011 P A R N A S S U S F U N D S
Shares EquitiesMarket Value
($)Per
SharePercent ofNet Assets
300,000 Glacier Bancorp Inc. 2,811,000 9.37 0.5%
Total investment in equities 610,332,654 98.5%
Total short-term securities 12,603,113 2.0%
Other assets and liabilities (3,089,816) (0.5%)
Total net assets 619,845,951 100.0%
Net asset value as of September 30, 2011 $18.79
27
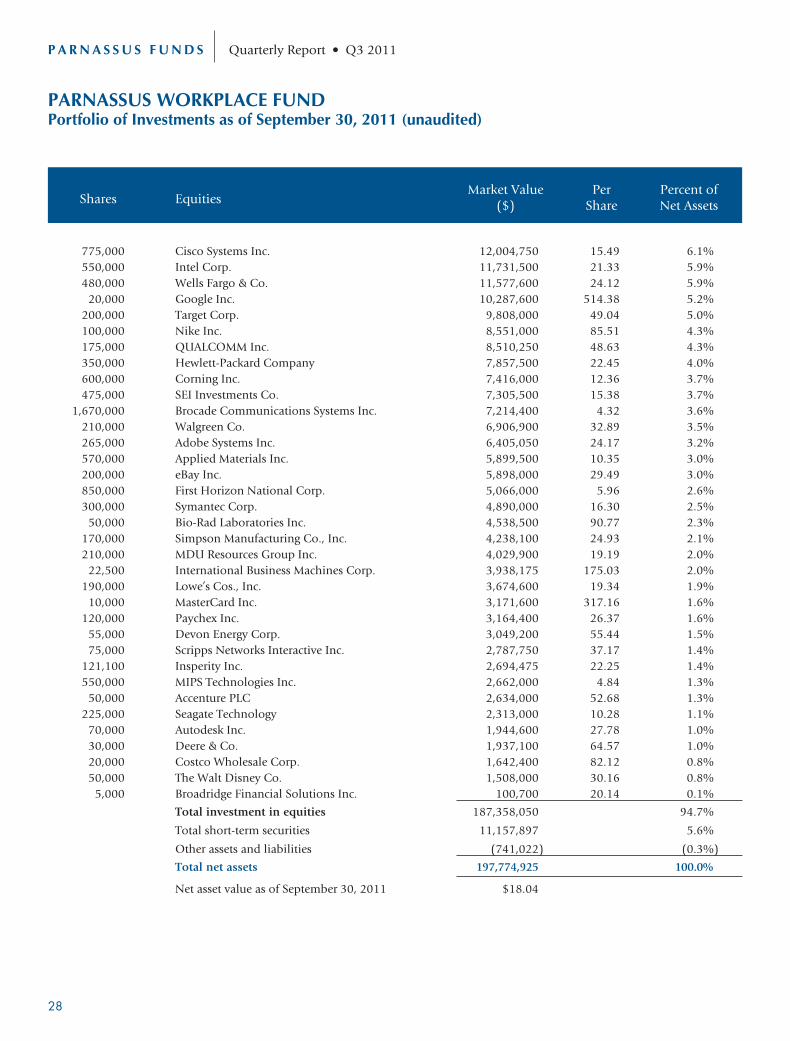
P A R N A S S U S F U N D S Quarterly Report • Q3 2011
PARNASSUS WORKPLACE FUNDPortfolio of Investments as of September 30, 2011 (unaudited)
Shares EquitiesMarket Value
($)Per
SharePercent ofNet Assets
775,000 Cisco Systems Inc. 12,004,750 15.49 6.1%550,000 Intel Corp. 11,731,500 21.33 5.9%480,000 Wells Fargo & Co. 11,577,600 24.12 5.9%
20,000 Google Inc. 10,287,600 514.38 5.2%200,000 Target Corp. 9,808,000 49.04 5.0%100,000 Nike Inc. 8,551,000 85.51 4.3%175,000 QUALCOMM Inc. 8,510,250 48.63 4.3%350,000 Hewlett-Packard Company 7,857,500 22.45 4.0%600,000 Corning Inc. 7,416,000 12.36 3.7%475,000 SEI Investments Co. 7,305,500 15.38 3.7%
1,670,000 Brocade Communications Systems Inc. 7,214,400 4.32 3.6%210,000 Walgreen Co. 6,906,900 32.89 3.5%265,000 Adobe Systems Inc. 6,405,050 24.17 3.2%570,000 Applied Materials Inc. 5,899,500 10.35 3.0%200,000 eBay Inc. 5,898,000 29.49 3.0%850,000 First Horizon National Corp. 5,066,000 5.96 2.6%300,000 Symantec Corp. 4,890,000 16.30 2.5%
50,000 Bio-Rad Laboratories Inc. 4,538,500 90.77 2.3%170,000 Simpson Manufacturing Co., Inc. 4,238,100 24.93 2.1%210,000 MDU Resources Group Inc. 4,029,900 19.19 2.0%
22,500 International Business Machines Corp. 3,938,175 175.03 2.0%190,000 Lowe’s Cos., Inc. 3,674,600 19.34 1.9%
10,000 MasterCard Inc. 3,171,600 317.16 1.6%120,000 Paychex Inc. 3,164,400 26.37 1.6%
55,000 Devon Energy Corp. 3,049,200 55.44 1.5%75,000 Scripps Networks Interactive Inc. 2,787,750 37.17 1.4%
121,100 Insperity Inc. 2,694,475 22.25 1.4%550,000 MIPS Technologies Inc. 2,662,000 4.84 1.3%
50,000 Accenture PLC 2,634,000 52.68 1.3%225,000 Seagate Technology 2,313,000 10.28 1.1%
70,000 Autodesk Inc. 1,944,600 27.78 1.0%30,000 Deere & Co. 1,937,100 64.57 1.0%20,000 Costco Wholesale Corp. 1,642,400 82.12 0.8%50,000 The Walt Disney Co. 1,508,000 30.16 0.8%
5,000 Broadridge Financial Solutions Inc. 100,700 20.14 0.1%
Total investment in equities 187,358,050 94.7%
Total short-term securities 11,157,897 5.6%
Other assets and liabilities (741,022) (0.3%)
Total net assets 197,774,925 100.0%
Net asset value as of September 30, 2011 $18.04
28

Quarterly Report • Q3 2011 P A R N A S S U S F U N D S
PARNASSUS FIXED-INCOME FUNDPortfolio of Investments as of September 30, 2011 (unaudited)
PrincipalAmount ($)
Convertible BondsMarket Value
($)Per
SharePercent ofNet Assets
2,000,000 NASDAQ OMX Group Inc.2.50%, due 08/15/2013 2,045,000 102.25 1.0%
2,000,000 NII Holdings Inc.3.13%, due 06/15/2012 2,015,000 100.75 1.0%
1,000,000 Intel Corp.2.95%, due 12/15/2035 1,013,750 101.38 0.5%
1,000,000 Hologic Inc.2.00%, due 12/15/2037 936,250 93.63 0.5%
Total investment in convertible bonds 6,010,000 3.0%
PrincipalAmount ($)
Corporate BondsMarket Value
($)Per
SharePercent ofNet Assets
3,500,000 TJX Cos., Inc.4.20%, due 08/15/2015 3,832,745 109.51 1.9%
3,000,000 Waste Management Inc.6.38%, due 03/11/2015 3,442,749 114.76 1.7%
3,000,000 Genentech Inc.4.75%, due 07/15/2015 3,366,243 112.21 1.7%
3,000,000 Praxair Inc.4.50%, due 08/15/2019 3,306,768 110.23 1.7%
2,800,000 Cisco Systems Inc.5.50%, due 02/22/2016 3,228,324 115.30 1.6%
3,000,000 Genzyme Corp.3.63%, due 06/15/2015 3,215,040 107.17 1.6%
3,000,000 Pentair Inc.5.00%, due 05/15/2021 3,132,990 104.43 1.6%
3,000,000 Applied Materials Inc.4.30%, due 06/15/2021 3,125,973 104.20 1.6%
3,000,000 CVS Caremark Corp.4.13%, due 05/15/2021 3,122,451 104.08 1.6%
2,500,000 Praxair Inc.4.38%, due 03/31/2014 2,700,280 108.01 1.4%
2,000,000 Waste Management Inc.7.13%, due 12/15/2017 2,471,276 123.56 1.2%
2,000,000 Burlington Northern Santa Fe Corp.5.65%, due 05/01/2017 2,312,468 115.62 1.2%
2,000,000 AGL Capital Corp.5.25%, due 08/15/2019 2,252,096 112.60 1.1%
2,000,000 Intuit Inc.5.75%, due 03/15/2017 2,247,830 112.39 1.1%
2,000,000 Procter & Gamble Co.4.95%, due 08/15/2014 2,234,766 111.74 1.1%
2,000,000 Burlington Northern Santa Fe Corp.4.70%, due 10/01/2019 2,228,202 111.41 1.1%
29

P A R N A S S U S F U N D S Quarterly Report • Q3 2011
PARNASSUS FIXED-INCOME FUNDPortfolio of Investments as of September 30, 2011 (unaudited) (continued)
PrincipalAmount ($)
Corporate BondsMarket Value
($)Per
SharePercent ofNet Assets
2,000,000 International Business Machines Corp.6.50%, due 10/15/2013 2,222,226 111.11 1.1%
2,000,000 Charles Schwab Corp.4.95%, due 06/01/2014 2,185,620 109.28 1.1%
2,000,000 Gilead Sciences Inc.4.50%, due 04/01/2021 2,155,602 107.78 1.1%
2,000,000 JPMorgan Chase & Co.5.15%, due 10/01/2015 2,110,572 105.53 1.1%
2,000,000 Adobe Systems Inc.3.25%, due 02/01/2015 2,099,824 104.99 1.1%
2,000,000 Fiserv Inc.3.13%, due 10/01/2015 2,035,884 101.79 1.0%
2,000,000 Wells Fargo & Co.3.00%, due 12/09/2011 2,010,142 100.51 1.0%
1,691,726 Southwest Air 07-1 Trust6.15%, due 08/01/2022 1,793,230 106.00 0.9%
1,493,000 Target Corp.5.13%, due 01/15/2013 1,578,180 105.71 0.8%
500,000 Procter & Gamble Co.3.50%, due 02/15/2015 537,288 107.46 0.3%
Total investment in corporate bonds 64,948,769 32.7%
PrincipalAmount ($)
U.S. Government Treasury BondsMarket Value
($)Per
SharePercent ofNet Assets
5,000,000 U.S. Treasury 4.38%, due 05/15/2040 6,435,950 128.72 3.2%6,000,000 U.S. Treasury 2.63%, due 06/30/2014 6,362,346 106.04 3.2%6,000,000 U.S. Treasury 2.38%, due 09/30/2014 6,345,468 105.76 3.2%6,000,000 U.S. Treasury 1.88%, due 06/30/2015 6,277,500 104.63 3.2%6,000,000 U.S. Treasury 2.13%, due 08/15/2021 6,105,960 101.77 3.1%5,000,000 U.S. Treasury 3.50%, due 02/15/2039 5,559,375 111.19 2.8%5,000,000 U.S. Treasury 2.75%, due 02/15/2019 5,435,940 108.72 2.7%5,000,000 U.S. Treasury 2.00%, due 11/30/2013 5,180,080 103.60 2.6%4,500,000 U.S. Treasury 3.13%, due 09/30/2013 4,753,827 105.64 2.4%4,000,000 U.S. Treasury 3.75%, due 08/15/2041 4,656,880 116.42 2.3%4,000,000 U.S. Treasury 3.75%, due 11/15/2018 4,627,188 115.68 2.3%4,500,000 U.S. Treasury 1.13%, due 06/15/2013 4,564,845 101.44 2.3%4,000,000 U.S. Treasury 3.38%, due 11/15/2019 4,536,248 113.41 2.3%4,000,000 U.S. Treasury 2.75%, due 05/31/2017 4,357,188 108.93 2.2%4,000,000 U.S. Treasury 1.75%, due 04/15/2013 4,091,080 102.28 2.1%3,500,000 U.S. Treasury 2.50%, due 06/30/2017 3,762,500 107.50 1.9%3,000,000 U.S. Treasury 3.63%, due 02/15/2020 3,463,125 115.44 1.7%3,000,000 U.S. Treasury 3.50%, due 05/15/2020 3,435,690 114.52 1.7%3,000,000 U.S. Treasury 2.50%, due 04/30/2015 3,204,141 106.80 1.6%3,000,000 U.S. Treasury 2.13%, due 05/31/2015 3,165,690 105.52 1.6%
30

Quarterly Report • Q3 2011 P A R N A S S U S F U N D S
PrincipalAmount ($)
U.S. Government Treasury BondsMarket Value
($)Per
SharePercent ofNet Assets
2,460,080 U.S. Treasury (TIPS) 1.88%, due 07/15/2013 2,575,012 104.67 1.4%
2,156,740 U.S. Treasury (TIPS) 1.75%, due 01/15/2028 2,498,450 115.84 1.3%
2,000,000 U.S. Treasury 3.63%, due 08/15/2019 2,303,124 115.16 1.2%
1,078,370 U.S. Treasury (TIPS) 1.63%, due 01/15/2018 1,206,511 111.88 0.6%
1,000,000 U.S. Treasury 1.50%, due 07/31/2016 1,026,880 102.69 0.5%
1,000,000 U.S. Treasury 1.50%, due 07/15/2012 1,010,352 101.04 0.5%
Total investment inU.S. government treasury bonds 106,941,350 53.9%
Total long-term investments 177,900,119 89.6%
Total short-term securities 19,484,112 9.8%
Other assets and liabilities 1,046,342 0.6%
Total net assets 198,430,573 100.0%
Net asset value as of September 30, 2011 $17.67
31

Go Paperless with E-DeliverySign up for electronic delivery of prospectuses, shareholder reportsand account statements at www.parnassus.com/gopaperlessIf you do not hold your account directly with Parnassus, please contactthe firm that holds your account about electronic delivery.
P A R N A S S U S F U N D S
1 Market Street, Suite 1600San Francisco, CA 94105(800) 999-3505www.parnassus.com
This report must be preceded or accompanied by a current prospectus.
Investment AdviserParnassus Investments1 Market Street, Suite 1600San Francisco, CA 94105
Legal CounselFoley and Lardner LLP777 E. Wisconsin Ave.Milwaukee, WI 53202
Independent Registered Public Accounting FirmDeloitte and Touche, LLP50 Fremont StreetSan Francisco, CA 94105
DistributorParnasssus Funds Distributor1 Market Street, Suite 1600San Francisco, CA 94105