quarterly bulletin - · pdf filequarterly bulletin september 2012 ... or transmitted in any...
TRANSCRIPT


Quarterly BulletinSeptember 2012
No. 265
South African Reserve Bank

Quarterly Bulletin September 2012
© South African Reserve BankAll rights reserved. No part of this publication may be reproduced, stored in a retrieval system, or transmitted in any form or by any means, electronic, mechanical, photocopying, recording or otherwise, without fully acknowledging the Quarterly Bulletin of the South African Reserve Bank as the source. The contents of this publication are intended for general information only and are not intended to serve as financial or other advice. While every precaution is taken to ensure the accuracy of information, the South African Reserve Bank shall not be liable to any person for inaccurate information or opinions contained in this publication.
Enquiries relating to this Bulletin should be addressed to: Head: Research Department South African Reserve Bank P O Box 427 Pretoria 0001 Tel. +27 12 313-3668/3676
http://www.reservebank.co.za ISSN 0038-2620

Quarterly Bulletin September 2012
ContentsQuarterly Economic ReviewIntroduction ............................................................................................................................1Domestic economic developments ........................................................................................3 Domestic output ..............................................................................................................3 Real gross domestic expenditure ....................................................................................5 Factor income ............................................................................................................... 10 Gross saving ................................................................................................................. 10 Employment .................................................................................................................. 11 Labour cost and productivity ......................................................................................... 14 Prices ............................................................................................................................ 16Foreign trade and payments ................................................................................................. 24 International economic developments ........................................................................... 24 Current account ............................................................................................................ 27 Financial account ..........................................................................................................32 Foreign debt ..................................................................................................................34 International reserves and liquidity .................................................................................35 Exchange rates .............................................................................................................35Monetary developments, interest rates and financial markets .............................................. 37 Money supply ................................................................................................................ 37 Credit extension ............................................................................................................39 Interest rates and yields ................................................................................................. 42 Money market ...............................................................................................................46 Bond market .................................................................................................................48 Share market .................................................................................................................49 Market for exchange-traded derivatives .........................................................................50 Real-estate market ........................................................................................................ 51 Non-bank financial intermediaries ................................................................................. 52 Flow of funds .................................................................................................................53Public finance .......................................................................................................................55 Non-financial public-sector borrowing requirement .......................................................55 Budget comparable analysis of national government finance ........................................58
Statement issued by Gill Marcus, Governor of the South African Reserve Bank
Statement of the Monetary Policy Committee19 July 2012 .........................................................................................................................65
Note to tables .................................................................................................................... 69
Statistical tables
Contents .......................................................................................................................... S–0Statistical tables ............................................................................................................... S–2Key information .............................................................................................................S–142


1Quarterly Bulletin September 2012
Quarterly Economic Review
IntroductionGlobal economic growth decelerated in the second quarter of 2012 with activity slowing across a wide range of advanced and emerging-market countries after having surprised on the upside in the first quarter of the year. Concerns around debt sustainability and austerity programmes in the euro area continued to weigh on projections for global growth. This contributed to a moderation in a wide range of international commodity prices, assisting in the containment of global inflation. Under these circumstances, monetary policy continued to be expansionary in most parts of the world, with expectations that the easy monetary policy stance would be maintained for a considerable period.
Economic activity in South Africa expanded at a firmer pace in the second quarter of 2012 with real gross domestic product rising at an annualised rate of 3,2 per cent, a half percentage point higher than in the first quarter of the year. The acceleration was mostly due to a brisk recovery in mining output as conditions normalised, following the substantial decline in the preceding quarter that had been brought about mainly by a protracted labour unrest-related shutdown of operations at a major platinum mine. Production of nickel and iron ore also registered firm increases in the second quarter, alongside higher coal output following the opening of a new coal mining shaft by a domestic petrochemicals group. Agricultural output growth also accelerated somewhat in the second quarter.
However, if the more volatile primary sector is excluded, real value added increased at a significantly slower pace in the second quarter of 2012. The main negatives were the manufacturing sector, with contractions in production across several subsectors, and the electricity sector, with lower output on account of fairly mild temperatures in the first half of the winter and power buy-back arrangements between Eskom and large industrial customers. By contrast, growth in the construction sector picked up over the period as civil construction activity gained momentum, countering subdued conditions in the residential and non-residential building subsectors. Tertiary sector output growth also lost some momentum in the second quarter, mainly reflecting a slackening in the real value added by the banking sector.
Real gross domestic expenditure maintained strong momentum and accelerated somewhat further in the second quarter of 2012, led by capital expenditure. As has been the case since the beginning of 2012, fixed capital formation recorded the strongest real growth rate among the components of domestic final demand. Real gross fixed capital expenditure by general government accelerated to a double-digit pace of increase in the quarter concerned, driven by spending at all three levels of government as the Presidential Infrastructure Co-ordinating Commission facilitated stronger efforts in this area. In similar vein public corporations, led by Eskom and Transnet, raised their real capital expenditure notably further during the period. Growth in real gross fixed capital formation by private business enterprises remained fairly low but picked up marginally in the second quarter of 2012 with notable contributions from the mining and communication sectors. Real inventory investment rose notably in the mining and trade sectors over the period. The trade sector recorded a firm build-up of inventories, not least due to the early harvesting and storage of a large part of the 2012 maize crop.
In contrast to the strengthening capital spending, growth in real final consumption expenditure by the household sector decelerated marginally in the second quarter of 2012, mirroring the slightly lower quarterly growth in household disposable income. Expenditure on durable and semi-durable goods recorded strong growth over the period, supported by favourable prices and financing costs. Spending on non-durable goods also rose steadily, but real expenditure on services recorded a modest contraction in the second quarter. While consumption expenditure remained closely aligned with disposable income over this period, an increase in the ratio of household debt to disposable income was registered in the second quarter, while the debt service cost ratio also inched higher.

Quarterly Bulletin September 20122
Real final consumption expenditure by general government increased further in the second quarter of 2012 as real spending on compensation of government employees continued to rise.
Import volumes held up fairly well in the second quarter of 2012, supported by the rising level of domestic expenditure. Despite a depreciation in the exchange value of the rand, export volumes declined notably, influenced by the general moderation in global demand. With South Africa’s terms of trade also registering a modest further deterioration, the deficit on the current account of the balance of payments widened to 6,4 per cent of gross domestic product, the highest deficit ratio since the third quarter of 2008. The shortfall on the current account was broadly matched by the surplus on the financial account of the balance of payments, with inward portfolio investment in the form of bonds making the largest contribution to the inflow. However, inward direct investment and other investment also contributed to the inflow of capital, the latter mainly in the form of foreign long-term loans to domestic non-bank private-sector companies.
The hesitant recovery in real economic activity was accompanied by modest increases in employment and a decrease in the unemployment rate over the year to June 2012. Wage settlement rates continued to exceed inflation in the first half of 2012, while in July government and the public-sector trade unions reached agreement on an increase of 7 per cent in the salaries of government employees.
Increases in productivity moderated the impact of higher salaries and wages on production cost, thereby helping to curb inflation. A welcome development in the first part of 2012 was a notable deceleration in inflation, with the targeted rate of consumer price inflation receding to 4,9 per cent in July 2012. This deceleration was essentially driven by lower rates of food and transport price inflation. Given the sizeable output gap and with targeted inflation decelerating, underlying measures of inflation hovering around the midpoint of the target range, and the projected future path for inflation comfortably within the target range, the Monetary Policy Committee (MPC) of the South African Reserve Bank (the Bank) in July 2012 decided to provide further support to the economic recovery by reducing the repurchase rate from 5,5 per cent to 5,0 per cent – the first change in the policy rate in 20 months. Other money-market interest rates followed the repurchase rate downwards.
Twelve-month growth in the broadly defined money supply, M3, and in overall bank loans and advances to the domestic private sector remained at single-digit levels in the first seven months of 2012, consistent with the sluggish domestic economic environment. Subdued conditions in the real-estate market continued to dampen growth in mortgage advances, whereas a number of smaller categories of advances, such as general loans to the household sector, credit card advances and instalment sale credit, registered brisk rates of increase over the period.
Long-term bond yields continued to ease in the first eight months of 2012, reflecting the improved outlook for inflation, expectations that low policy interest rates would be maintained for longer, approaching inclusion of South African bonds in a benchmark global government bond index, and comparatively subdued returns on alternative asset classes. On the JSE Limited (JSE)share prices reached new record highs, aided by rising company profits and higher international equity prices.
The borrowing requirement of the non-financial public sector remained well contained in the April–June 2012 quarter, as national government registered strong revenue collections while public corporations managed to fund a large part of their capital expenditure through operating surpluses. Import duty collections, income tax payments by individuals, value-added tax collections and income tax payments by companies all registered brisk increases, consistent with the firm pace of domestic expenditure. With government expenditure well under control the fiscal deficit for the quarter was modest and, while the level of the national government’s outstanding gross debt edged higher, it remained below 40 per cent of annual gross domestic product.

3Quarterly Bulletin September 2012
Domestic economic developments
Domestic output1
Real output growth in the South African economy picked up in the second quarter of 2012. Following growth at an annualised rate of 2,7 per cent in the first quarter of 2012, the pace of increase inched higher to 3,2 per cent in the second quarter. This acceleration was driven by the real value added by the primary sector, which bounced back following a fairly substantial decline in the preceding quarter. By contrast, real output of the secondary sector contracted, while in the tertiary sector the growth momentum slackened somewhat over the period. Measured over four quarters, real economic activity expanded by 2,1 per cent in the first quarter, rising to 3 per cent in the second quarter of 2012.
Real gross domestic product
Percentage change
QB3-2012NA01
2007 2008 2009 2010 2011 2012-8
-6
-4
-2
0
2
4
6
8
10 Quarter to quarter, seasonally adjusted annualised rates Year on year
Excluding the contribution of the generally more volatile primary sector, growth in the real gross domestic product slowed from 3,8 per cent in the first quarter of 2012 to 1,6 per cent in the second quarter.
Subsequent to contractions in the preceding five quarters, the real value added by the primary sector increased at an annualised rate of 23 per cent in the second quarter of 2012. This stronger growth performance was particularly evident in the mining sector.
Real gross domestic product
Percentage change at seasonally adjusted annualised rates
Sector2011 2012
1st qr 2nd qr 3rd qr 4th qr Year 1st qr 2nd qr
Primary sector ....................................... -4,7 -6,0 -14,7 -1,0 0,0 -11,2 23,0
Agriculture ......................................... -4,8 -9,5 -6,9 -5,0 -0,4 3,4 5,8
Mining................................................ -4,6 -4,5 -17,8 0,7 0,2 -16,8 31,2
Secondary sector .................................. 10,1 -6,5 -0,5 3,5 2,1 6,4 -0,5
Manufacturing .................................... 12,8 -8,8 -0,7 4,2 2,4 7,7 -1,0
Tertiary sector ........................................ 3,8 4,0 4,2 3,5 3,6 3,0 2,3
Non-primary sector ............................... 5,3 1,3 3,1 3,5 3,3 3,8 1,6
Total ...................................................... 4,6 1,0 1,7 3,2 3,1 2,7 3,2
1 The quarter-to-quarter growth rates referred to in this section are based on seasonally adjusted data.

Quarterly Bulletin September 20124
The real value added by the agricultural sector increased at an annualised rate of 5,8 per cent in the second quarter of 2012 compared with an increase of 3,4 per cent in the first quarter. This stronger output growth mainly reflected the harvesting of the bulk of the maize crop over the period. The commercial maize crop for the 2012/13 production season is estimated at 11,2 million ton, more than the 10,4 million ton harvested in 2011/12. In addition, livestock and horticultural farming made a positive contribution to agricultural production over the period.
Growth in the real value added by the mining sector rebounded in the second quarter of 2012 when it accelerated to an annualised rate of 31,2 per cent, following a sharp contraction of 16,8 per cent in the first quarter. The pick-up in mining output could mainly be attributed to firm increases in the production of platinum, nickel and iron ore, alongside a further solid contribution by the coal mining industry. More normal conditions in the platinum mining sector, which in the previous quarter had been negatively affected by a protracted labour unrest-related shutdown of operations at a major platinum mine, largely underpinned the recovery in mining operations. The higher demand for autocatalytic platinum due to an increase in domestic vehicle manufacturing also supported higher platinum production volumes. According to the National Association of Automobile Manufacturers of South Africa (NAAMSA), the export of vehicles is expected to gain further momentum in the second half of the year despite the slow recovery in global activity levels. Growth in coal production continued in the second quarter of 2012, underpinned by a steady increase in domestic and foreign demand. Furthermore, a domestic petrochemicals group opened a new coal shaft during the second quarter of 2012. In general, mining production continued to be affected by expectations of lower global demand, and by electricity and labour cost constraints in the domestic economy.
Having advanced at an annualised rate of 6,4 per cent in the first quarter of 2012, the real value added by the secondary sector contracted by 0,5 per cent in the second quarter. The disappointing performance was mainly due to declines in the real output of the manufacturing sector and the sector generating electricity, gas and water. The output of the construction sector increased further over the period.
The real value added by the manufacturing sector contracted at an annualised rate of 1 per cent in the second quarter of 2012, following a brisk increase of 7,7 per cent in the first quarter. The decline in the second quarter reflected lower production levels in the manufacturing of basic iron and steel, non-ferrous metal products and machinery; glass and non-metallic mineral products; textiles, clothing, leather and footwear; and of wood and wood products. In addition, the pace of increase in production in the subsector responsible for the manufacturing of petroleum, chemical products, rubber and plastic products slowed. Increased production was, however, evident in the subsectors for food and beverages; electrical machinery; motor vehicles, parts and accessories and other transport equipment.
The contraction in manufacturing production, which occurred notwithstanding the depreciation in the exchange rate of the rand, caused the contribution of manufacturing to overall growth in real gross domestic product to switch from adding 1,2 percentage points in the first quarter of 2012 to subtracting 0,2 of a percentage point in the second quarter. Export-orientated industries in manufacturing continued to face headwinds as global economic conditions deteriorated in general. The utilisation of production capacity in the sector increased from 80,5 per cent in the first quarter of 2012 to 81,3 per cent in the second quarter, still remaining substantially below a recent peak of 86,3 per cent registered in the first quarter of 2007.
After moving essentially sideways in the first quarter of 2012, the real value added by the sector supplying electricity, gas and water declined further at an annualised rate of 4,2 per cent in the second quarter. The decline in electricity production reflected, among other factors, the outcome of power buy-back arrangements between Eskom and large industrial customers, particularly ferrochrome smelters, in the period up to the end of May 2012. Furthermore, mild winter temperatures moderated electricity consumption, while some power stations were shut down due to maintenance work that was extended into the winter months, putting further strain on the supply of electricity.
Economic growth in the construction sector accelerated from an annualised rate of 3,8 per cent in the first quarter of 2012 to 4,3 per cent in the second quarter. The civil construction sector maintained its underlying upward momentum, in line with the recent upward trend in

5Quarterly Bulletin September 2012
the civil construction confidence index. Government introduced a number of new strategic infrastructure expansion programmes over the period in an attempt to improve service delivery. Activity in the residential and non-residential building sectors, however, remained subdued.
Growth in the real value added by the tertiary sector slowed to an annualised rate of 2,3 per cent in the second quarter of 2012 – following an increase of 3 per cent in the first quarter. The real output of the finance, insurance, real-estate and business services sector; the trade; and the transport, storage and communication sectors, increased at a slower pace over the period.
Real output growth of the trade sector moderated from an annualised rate of 3 per cent in the first quarter of 2012 to 2,8 per cent in the second quarter, mainly reflecting slower output growth in the wholesale trade and catering and accommodation subsectors. Domestic tourism was nevertheless underpinned by the introduction of more affordable travel and accommodation packages. By contrast, the motor trade subsector continued to benefit from the low interest rate environment, the introduction of new motor vehicle models and improved stock availability. Activity in the retail trade subsector also increased somewhat in the second quarter of 2012.
Following an increase of 2,5 per cent in the first quarter of 2012, growth in real value added by the transport, storage and communication sector slowed to 2,3 per cent in the second quarter. The moderation could primarily be attributed to lower activity in the land transport subsector, more specifically road transportation. Concurrently, growth in the real value added by the telecommunications subsector accelerated due to an increased number of subscribers and higher demand for data as competition between mobile service providers resulted in lower prices being offered. The refurbishment and improvement of fibre-optic cables extended broadband coverage during the quarter.
Growth in real value added by the finance, insurance, real-estate and business services sector decelerated from 4,1 per cent in the first quarter of 2012 to 2,3 per cent in the second quarter. The moderation could primarily be ascribed to a slackening in the real value added by the banking sector. By contrast, activity in the equity, bond and other financial markets remained relatively strong over the period. The Financial Sector Confidence Index decelerated to slightly below its long-term average in the second quarter of 2012.
The real value added by the general government increased at annualised rates of 2,3 per cent and 1,9 per cent in the first and second quarter of 2012 respectively. The slower growth in the second quarter reflected a moderation in employment gains over the period.
Real gross domestic expenditureGrowth in aggregate real gross domestic expenditure accelerated from an annualised rate of 4,3 per cent in the first quarter of 2012 to 4,7 per cent in the second quarter. This acceleration reflected increased spending by general government alongside a faster pace of gross fixed capital formation; the accumulation of real inventories also advanced at a somewhat faster pace over the period. Growth in real final consumption expenditure by households moderated somewhat in the second quarter of 2012.
Real gross domestic expenditure
Percentage change at seasonally adjusted annualised rates
Component2011 2012
1st qr 2nd qr 3rd qr 4th qr Year 1st qr 2nd qr
Final consumption expenditure
Households ...................................... 6,2 3,4 3,8 4,6 5,0 3,1 2,9
General government ......................... 9,4 -0,4 4,8 7,3 4,5 2,2 4,1
Gross fixed capital formation ................ 4,4 5,0 5,9 7,2 4,4 5,3 5,7
Domestic final demand ....................... 6,5 2,9 4,4 5,6 4,8 3,3 3,7
Change in inventories (R billions)* ......... 7,1 3,1 4,0 4,9 4,8 5,9 7,0
Gross domestic expenditure ............... 4,6 1,4 4,8 5,1 4,3 4,3 4,7
* At constant 2005 prices

Quarterly Bulletin September 20126
Real final consumption expenditure by households moderated further from an annualised rate of 3,1 per cent in the first quarter of 2012 to 2,9 per cent in the second quarter; this has been the lowest rate of increase to be registered since the second quarter of 2010. The slower pace of spending growth resulted from a contraction in real outlays on services, whereas firm growth in real expenditure was recorded across all other categories. Persistent increases in the prices of non-discretionary items, including the cost of transportation and electricity, probably eroded the purchasing power of the household sector to some extent.
Percentage change from quarter to quarter
Indices: 2005 = 100
Final consumption expenditure by households
-6
-4
-2
0
2
4
6
8
80
100
120
140
160
Seasonally adjusted
Seasonally adjusted annualised rates
Semi-durable goodsDurable goodsServicesNon-durable goods
Total
Components
2007 2008 2009 2010 2011 2012
QB3-2012NA03
Growth in real spending on durable goods decelerated slightly from 8,2 per cent in the first quarter of 2012 to 8,1 per cent in the second quarter. Lower spending was evident in the category for furniture and household appliances, while spending on recreational and entertainment goods moderated. Stronger increases were recorded in outlays on all other durable goods categories. The reduced spending on furniture and household appliances could probably be partly attributed to the slow rate of increase in the housing stock. Lower and more competitive prices of computers and some components of durable recreational and entertainment goods, in contrast, provided stimulus to continued growth in the sales of these goods.
Real final consumption expenditure by households
Percentage change at seasonally adjusted annualised rates
Component2011 2012
1st qr 2nd qr 3rd qr 4th qr Year 1st qr 2nd qr
Durable goods ...................................... 19,6 13,5 17,5 16,6 15,7 8,2 8,1
Semi-durable goods ............................. 12,5 7,8 6,7 7,3 7,0 2,9 7,8
Non-durable goods .............................. 5,0 2,1 2,0 2,2 2,9 3,5 3,8
Services ............................................... 2,9 1,0 1,4 2,9 3,8 1,6 -0,3
Total .................................................. 6,2 3,4 3,8 4,6 5,0 3,1 2,9

7Quarterly Bulletin September 2012
Subsequent to a somewhat slower pace of increase in the first quarter of 2012, real spending on semi-durable goods advanced at an annualised rate of 7,8 per cent in the second quarter. Expenditure on clothing and footwear, the largest component in this category, rose firmly in the second quarter of 2012, with consumers partly enticed by the more affordable prices of these items. Alongside strong growth in new motorcar sales, household expenditure on motorcar tyres, parts and accessories, however, tapered off over the period.
Real spending on non-durable goods showed steady increases at rates of 3,5 per cent and 3,8 per cent in the first and second quarters of 2012 respectively. Slower spending on food, beverages and tobacco was countered by higher spending on all other non-durable categories over the period. Although food price inflation slowed marginally in the second quarter, households seemed to be still moderating their purchases in response to recent strong price increases.
Real spending on services declined at an annualised rate of 0,3 per cent in the second quarter of 2012, switching from the 1,6 per cent growth rate recorded in the preceding quarter. Increased spending on household services and on transport and communication services was fully offset by a decline in spending on miscellaneous services over the period; largely attributable to a faster pace of increase in net travel receipts from abroad. More affordable travel and accommodation packages have made South Africa an attractive destination for international holidaymakers over the period.
Consistent with the still-brisk rate of increase in household consumption expenditure, household debt edged higher in the second quarter of 2012. The growth in household debt outpaced the growth in disposable income of households and caused the ratio of household debt to disposable income to increase from 75,6 per cent in the first quarter of 2012 to 76,3 per cent in the second quarter. The cost of servicing household debt rose from 6,8 per cent to 6,9 per cent of disposable income over the same period.
Household debt and debt-service ratios
Percentage of household disposable income
QB3-2012NA05
4
6
8
10
12
14
50
60
70
80
90
Debt-service cost
Household debt
Seasonally adjusted
1990 1992 1994 1996 1998 2000 2002 2004 2006 2008 2010 2012
Growth in real final consumption expenditure by general government accelerated from an annualised rate of 2,2 per cent in the first quarter of 2012 to 4,1 per cent in the second quarter. The stronger growth in the second quarter could be attributed to continued growth in real

Quarterly Bulletin September 20128
spending on compensation of employees. In addition, it reflected the statistical low base created by lower quarter-to-quarter growth in the first quarter of 2012 due to the absence of significant spending on armaments during the period.
2008 2009 2010 2011 20122007
Components of real domestic final demand
Percentage change from quarter to quarter
QB3-2012NA02
-6
-4
-2
0
2
4
6
8
-6
-3
0
3
6
9
12
15
-20
-10
0
10
20
30
Households: Final consumption expenditure
General government: Final consumption expenditure
Gross fixed capital formation
Seasonally adjusted annualised rates
Real spending on non-wage goods and services contracted in the second quarter of 2012. This decline caused the growth in government consumption expenditure, excluding the acquisition of armaments, to slow from 4,3 per cent in the first quarter of 2012 to 4,1 per cent in the second quarter.
Real gross fixed capital formation increased at an annualised rate of 5,7 per cent in the second quarter of 2012 following growth of 5,3 per cent in the first quarter. Improved capital outlays could be attributed to a faster pace of increase in capital spending by private business enterprises and by general government. Fixed capital spending by public corporations increased at a slower pace over the period.
Consistent with some improvement in private-sector confidence levels, growth in real gross fixed capital formation by private business enterprises accelerated from an annualised rate of 1,8 per cent in the first quarter of 2012 to 2,4 per cent in the second quarter. The mining sector continued to invest in ongoing projects, with the bulk of the capital spending occurring

9Quarterly Bulletin September 2012
in the categories for construction works and machinery and equipment. Investment activity in the manufacturing sector, however, increased at a slower pace over the period owing to a lack of new projects. Spending on machinery and equipment by the manufacturing sector nevertheless picked up slightly in the second quarter of 2012. The communications subsector continued to expand the optic fibre network, particularly to augment quality and to support the growth in data traffic through ongoing capital spending on more sophisticated data networks. Real capital investment by the finance and real-estate sector contracted in the second quarter of 2012, as investment in residential buildings remained fairly depressed.
Real gross fixed capital formation
Percentage change at seasonally adjusted annualised rates
Component2011 2012
1st qr 2nd qr 3rd qr 4th qr Year 1st qr 2nd qr
Private business enterprises ................ 4,9 5,3 5,4 6,2 5,3 1,8 2,4
Public corporations.............................. 6,2 6,0 9,0 9,6 4,2 13,1 9,1
General government ............................ -0,5 1,7 3,4 7,8 0,8 9,3 15,7
Total .................................................... 4,4 5,0 5,9 7,2 4,4 5,3 5,7
Real fixed capital expenditure by public corporations increased at an annualised rate of 9,1 per cent in the second quarter of 2012, following an increase of 13,1 per cent in the first quarter. This slower rate of increase in capital spending was primarily brought about by the slower uptake of new projects which had already been planned for the 2012/13 financial year. Ongoing capital expenditure was undertaken by Eskom as the construction of its Medupi, Kusile and Ingula power plants continued. Capital expenditure by Transnet continued, covering its ongoing transport operations. In the second quarter, the South African National Roads Agency (SANRAL) continued with its capital spending projects to improve the road network.
Public corporations
General government
Seasonally adjusted
Private business enterprises
Real gross fixed capital formation by institutional sector
QB3-2012NA04
2007 2008 2009 2010 2011 2012
Indices: 2008 = 100
50
75
100
125
150
Real gross fixed capital expenditure by general government accelerated in the second quarter of 2012, driven by ongoing spending at all three levels of government. The upgrading of public roads by provincial governments continued over this period. In addition, expenditure on water and sanitation projects, all of which are largely financed by local governments, rose further over this period. Capital spending on the health and education services infrastructure also continued.

Quarterly Bulletin September 201210
The level of real inventory investment increased from R5,9 billion in the first quarter of 2012 to R7,0 billion in the second quarter, as the pace of increase in domestic consumption and exports continued to slow in most of the sectors. Stock levels in the mining sector rose moderately in response to lower-than-expected demand amid increased production levels in the second quarter of 2012. The trade sector recorded a firm build-up of inventories following an increase in agricultural stocks-in-trade as the bulk of the 2012 maize crop was harvested and stored in silos during the quarter concerned. By contrast, slower inventory accumulation was mainly evident in the manufacturing sector.
Factor incomeGrowth over four quarters in total nominal factor income decreased from 9,4 per cent in the first quarter of 2012 to 8,6 per cent in the second quarter. This reflected a decrease in momentum in the gross operating surpluses of business enterprises. Compensation of employees rose at a slightly higher rate in the second quarter of 2012 compared with the first quarter.
Measured over one year, an increase of 8,1 per cent was recorded in total compensation of employees in the second quarter of 2012, slightly higher than the rate of 7,6 per cent registered in the first quarter of 2012. The increase in total remuneration of employees was evident in most sectors of the economy. The average wage settlement rate increased slightly to 7,7 per cent in the first half of 2012 compared with a rate of 7,5 per cent during the same period in 2011.
The year-on-year growth in the nominal gross operating surplus decelerated from a rate of 11,3 per cent in the first quarter of 2012 to 9,2 per cent in the second quarter. Consequently, the share of gross operating surplus in total factor income inched lower from 50,5 per cent in the first quarter of 2012 to 50 per cent in the second quarter. The moderation in the pace of growth in the gross operating surplus of business enterprises mainly resulted from slower growth in the operating surplus of the mining and manufacturing sectors in the second quarter of 2012. Lower commodity prices, increased production costs, and the effect of weaker domestic and global demand contributed to the decline in the operating surplus of the mining sector over the period.
Gross savingThe national saving ratio as measured by the ratio of gross domestic saving to gross domestic product decreased somewhat from 15,2 per cent in the first quarter of 2012 to 14,1 per cent in the second quarter. The deterioration in the saving performance could mainly be attributed to the weaker saving performance of corporate business enterprises. The lower saving ratio in the second quarter of 2012 suggested that South Africa to a larger extent had to rely on foreign saving to finance gross capital formation.
Gross saving by the corporate sector as a percentage of gross domestic product receded from 15,7 per cent in the first quarter of 2012 to 14 per cent in the second quarter. Strong growth in dividend payments was evident over the period. Corporate tax payments rose at a faster annual rate of 27,3 per cent in the second quarter of 2012 compared with 11,9 per cent in the first quarter, thereby adversely affecting the saving performance of incorporated business enterprises.
Dissaving by general government as a ratio of gross domestic product improved marginally from 2,2 per cent in the first quarter of 2012 to 1,6 per cent in the second quarter. The improvement in the government’s savings performance can be attributed to stronger growth in tax revenue over the period.
The gross saving rate of the household sector remained at 1,7 per cent in the first and second quarter of 2012. Marginally higher growth in both nominal disposable income and final consumption expenditure gave rise to the stable saving performance.

11Quarterly Bulletin September 2012
EmploymentEmployment in the formal non-agricultural sector of the economy increased in the first quarter of 2012 notwithstanding slower output growth. According to the Quarterly Employment Statistics (QES) survey of Statistics South Africa (Stats SA), the employment level increased by 2,4 per cent on a seasonally adjusted and annualised basis in the first quarter of 2012, following a marginal decrease in employment in the fourth quarter of 2011. This translates into an estimated 49 000 jobs being created, bringing the level of total formal non-agricultural employment to an estimated 8,40 million at the end of March 2012 compared with 8,35 million at the end of December 2011.2 The recent downward revision of South Africa’s growth prospects in anticipation of a further moderation in economic activity in the euro area and China may, however, temporarily dampen employment creation.
Aggregate employment
Millions
QB3-2012BC07
2009
Total employment (Quarterly Labour Force Survey)
Formal non-agricultural employment (Quarterly Employment Statistics)
Seasonally adjusted
Sources: Statistics South Africa and South African Reserve Bank
2010 2011 20122008
13,0
13,2
13,4
13,6
13,8
14,0
8,0
8,1
8,2
8,3
8,4
8,5
8,6
Employment gains in the formal non-agricultural sector of the economy in the first quarter of 2012 could mainly be attributed to an increase of 47 600 employment opportunities in the private sector, while only an estimated 1 500 new jobs were created in the public sector. The economy managed to generate approximately 101 000 new formal-sector jobs in the year to the first quarter of 2012. On a seasonally adjusted and annualised basis, employment gains took place at a notably faster pace in the private sector than in the public sector in the first quarter of 2012. Public-sector employment advanced at a moderate rate of 0,3 per cent in the first quarter of 2012, as national departments increased their staff complement by 0,4 per cent and provincial governments theirs by 0,3 per cent. These employment gains were partly countered by continued labour paring at certain public-sector enterprises.
After receding somewhat in the fourth quarter of 2011, private-sector employment increased at an annualised rate of 3,0 per cent in the first quarter of 2012. Encouragingly, this was the fastest pace at which private-sector employment had expanded since the current upward phase of the business cycle commenced. The increase occurred primarily due to employment gains in the electricity sector (at an annualised rate of 5,9 per cent); the finance, insurance, real-estate and business services sector (5,6 per cent); the trade, catering and accommodation services sector (4,5 per cent); the non-gold mining sector (4,0 per cent); the community, social and personal services sector (3,2 per cent); and the gold-mining sector (1,7 per cent). Job shedding occurred in the construction sector (4,4 per cent); and in the private transport, storage and communication sector (1,0 per cent). Of the 437 000 formal private-sector jobs lost during the most recent downward phase in the business cycle, only 170 000 employment opportunities have been reclaimed from the second quarter of 2010 up to the first quarter of 2012.
2 The QES data reported in this section are seasonally adjusted, unless stated to the contrary.

Quarterly Bulletin September 201212
Changes in enterprise-surveyed formal non-agricultural employment*
Sector
Change over one quarter Change over four quarters
to 1st qr 2012
Cumulative job losses (-)
gains (+) 2011 2012
2nd qr 3rd qr 4th qr 1st qr NumberPer cent
3rd qr 2008 to 1st qr 2010
2nd qr 2010 to 1st qr 2012
Finance, insurance, real-estate and business services sector.... 14 300 6 700 -9 800 25 200 36 400 2,0 163 400 90 400
Manufacturing sector ............... -8 400 -1 900 4 600 1 000 -4 700 -0,4 -118 300 -26 300Trade, catering and accommodation services .......... 11 200 8 800 -5 400 18 500 33 100 2,0 -75 700 46 900
Construction ............................. 7 500 11 200 800 -4 800 14 700 3,6 -52 100 9 400
Mining ...................................... 3 700 -1 800 3 800 4 300 10 100 2,0 -35 900 30 600
Gold mining .......................... -1 800 -6 900 -100 600 -8 100 -5,3 -8 900 -16 100
Other mining ......................... 5 500 5 100 3 900 3 700 18 200 5,0 -27 000 46 700
Electricity .................................. 1 000 -100 -200 900 1 600 2,7 -3 300 4 500Private transport, storage and communication services ........... -700 8 400 1 100 -600 8 100 3,2 -2 000 6 800Community, social and personal services .................................... -800 -3 500 -2 300 3 300 -3 400 -0,8 13 400 7 900
Total private sector .................. 27 900 27 700 -7 400 47 600 95 900 1,5 -437 300 170 300
Provinces ................................. 18 700 5 300 2 800 700 27 500 2,6 51 600 68 700
Local governments ................... 5 300 -800 500 1 100 6 200 2,5 15 000 15 800
National departments ............... 7 300 8 400 5 100 500 21 300 5,0 -800 34 400Public transport, storage and communication services ........... -1 900 -100 2 700 700 1 400 1,3 -4 900 3 400
Other public-sector enterprises ... -43 900 -1 500 -4 600 -1 500 -51 600 -27,8 -7 800 5 600
Total public sector ................... -14 500 11 400 6 500 1 500 4 800 0,2 53 100 128 000
Grand total .............................. 13 400 39 100 -900 49 100 100 700 1,2 -384 200 298 200
* Seasonally adjusted
Following continued job losses since the start of the 2008–09 recession, the manufacturing sector increased its job complement for a second consecutive quarter in the first quarter of 2012, albeit marginally, at an annualised rate of 0,4 per cent. These employment gains in the manufacturing sector followed notable increases in manufacturing output in the fourth quarter of 2011 and the first quarter of 2012. However, employment growth in the sector remained hesitant, with sentiment indicators suggesting a dim outlook for the domestic manufacturing sector. According to the Bureau for Economic Research at the University of Stellenbosch (BER) Manufacturing Survey for the second quarter of 2012, business confidence in manufacturing plunged from 47 index points in the first quarter of 2012 to 29 in the second quarter – the lowest reading in two years. Respondents also indicated a sharp deceleration in domestic order volume growth, with employment indicators dipping further into negative territory in the second quarter of 2012. In addition, the employment sub-index of the Kagiso Purchasing Managers Index (PMI) had remained below the neutral 50 level for eight consecutive quarters when it averaged 49,5 index points in the second quarter of 2012. Manufacturing sentiment indicators have declined largely on account of deteriorating global economic growth prospects, particularly in Europe, China and the United States (US).
Employment in the mining sector increased further by around 4 300 jobs in the first quarter of 2012, with most of the new employment opportunities being created in the non-gold mining sector. Although employment levels in the mining sector advanced moderately in the first quarter of 2012, the sector continued to face soaring input costs and output disruptions in the form of safety-related stoppages and industrial action, particularly in the platinum-mining sector. In addition, international commodity prices have receded since the fourth quarter of 2011 on account of weaker global demand for mining commodities. This, coupled with the relative

13Quarterly Bulletin September 2012
strength of the exchange value of the rand during the opening months of 2012, hampered the profitability of South African mining companies.
Manufacturing employment and the Kagiso PMI employment sub-index
Per cent Index
QB3-2012BC09
2009
Employment: Quarter-to-quarterannualised growth rate
Kagiso PMI: Employment sub-component(right-hand scale)
2010 2011 20122007 200835
40
45
50
55
60
-12
-8
-4
0
4
8
Following marginal decreases in employment in the third and fourth quarters of 2011, employment in the electricity sector increased briskly at an annualised rate of 5,9 per cent in the first quarter of 2012. Sustained capital spending by Eskom should continue to support job creation in the sector over the medium term.
Employment in the trade, catering and accommodation services sector rose at an annualised rate of 4,5 per cent in the first quarter of 2012, following a disappointing decrease of 1,3 per cent in the fourth quarter of 2011. The pick-up in employment in this sector occurred alongside a mild contraction in real retail sales in the first quarter of 2012. However, wholesale and vehicle trade volumes increased markedly over the period. Employment growth in this sector is closely correlated with growth in final consumption expenditure by households, which slowed notably in the first half of 2012. Recent trends in various demand-side sentiment indicators suggest a further moderation in consumption expenditure by households, which does not augur well for job creation in the trade, catering and accommodation services sector.
Growth in final consumption expenditure by households and employment in the trade, catering and accommodation services sector
Percentage change over four quarters
QB3-2012BC08
2009
Final consumption expenditure by households
Employment in trade, catering and accommodation services
2010 2011 20122007 2008-6
-4
-2
0
2
4
6
8
Quarterly Bulletin September 201214
Employment levels in the construction sector picked up meaningfully in the first three quarters of 2011, before losing momentum in the final quarter of that year. Disappointingly, the construction sector reduced its staff complement at an annualised rate of 4,4 per cent in the first quarter of 2012. Following two consecutive quarterly increases, the First National Bank (FNB)/BER Building Confidence Index fell back from 34 index points in the first quarter of 2012 to 27 in the second quarter, highlighting the tentative nature of the recovery in building activity. The hesitant recovery is corroborated by national cement sales which receded notably in the first quarter of 2012, after having increased in the previous three quarters. Conversely, the FNB/BER Civil Construction Confidence Index continued to rise for the third consecutive quarter in the second quarter of 2012. Demand for new construction projects, however, remained fairly weak in the first quarter of 2012, as government’s renewed commitment to infrastructure spending has yet to filter through to the construction sector.
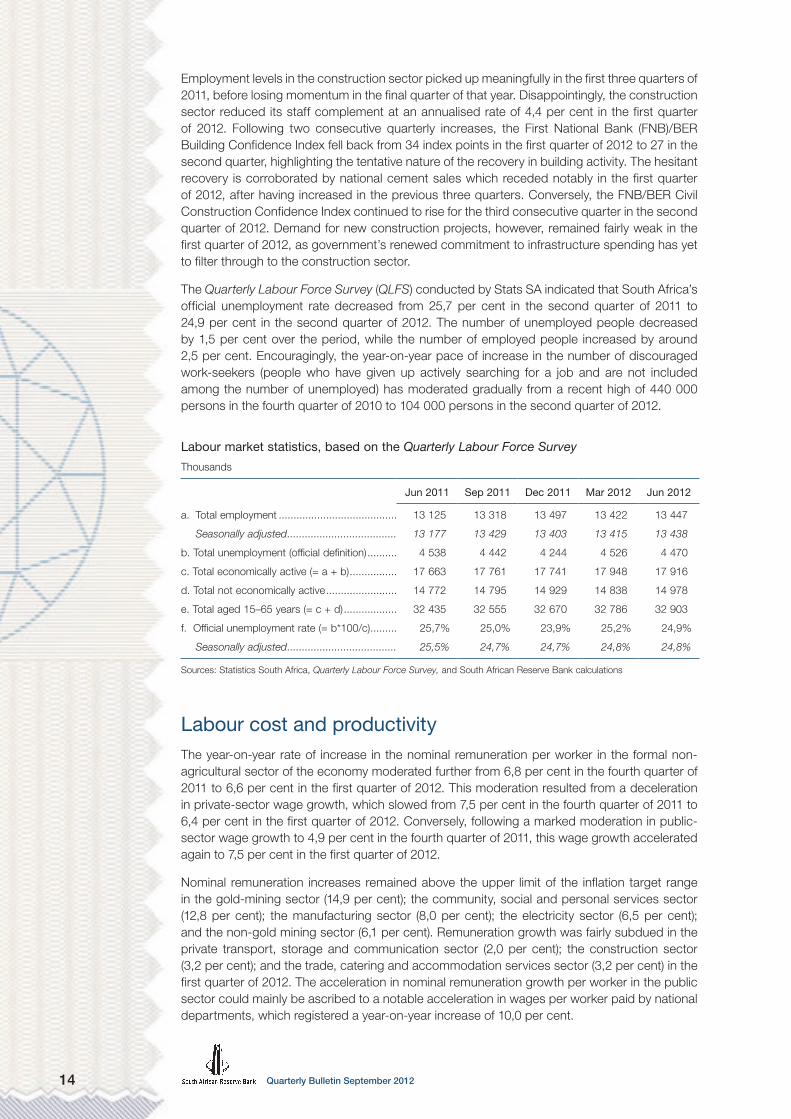
The Quarterly Labour Force Survey (QLFS) conducted by Stats SA indicated that South Africa’s official unemployment rate decreased from 25,7 per cent in the second quarter of 2011 to 24,9 per cent in the second quarter of 2012. The number of unemployed people decreased by 1,5 per cent over the period, while the number of employed people increased by around 2,5 per cent. Encouragingly, the year-on-year pace of increase in the number of discouraged work-seekers (people who have given up actively searching for a job and are not included among the number of unemployed) has moderated gradually from a recent high of 440 000 persons in the fourth quarter of 2010 to 104 000 persons in the second quarter of 2012.
Labour market statistics, based on the Quarterly Labour Force Survey
Thousands
Jun 2011 Sep 2011 Dec 2011 Mar 2012 Jun 2012
a. Total employment ........................................ 13 125 13 318 13 497 13 422 13 447
Seasonally adjusted ..................................... 13 177 13 429 13 403 13 415 13 438
b. Total unemployment (official definition) .......... 4 538 4 442 4 244 4 526 4 470
c. Total economically active (= a + b) ................ 17 663 17 761 17 741 17 948 17 916
d. Total not economically active ........................ 14 772 14 795 14 929 14 838 14 978
e. Total aged 15–65 years (= c + d) .................. 32 435 32 555 32 670 32 786 32 903
f. Official unemployment rate (= b*100/c) ......... 25,7% 25,0% 23,9% 25,2% 24,9%
Seasonally adjusted ..................................... 25,5% 24,7% 24,7% 24,8% 24,8%
Sources: Statistics South Africa, Quarterly Labour Force Survey, and South African Reserve Bank calculations
Labour cost and productivityThe year-on-year rate of increase in the nominal remuneration per worker in the formal non-agricultural sector of the economy moderated further from 6,8 per cent in the fourth quarter of 2011 to 6,6 per cent in the first quarter of 2012. This moderation resulted from a deceleration in private-sector wage growth, which slowed from 7,5 per cent in the fourth quarter of 2011 to 6,4 per cent in the first quarter of 2012. Conversely, following a marked moderation in public-sector wage growth to 4,9 per cent in the fourth quarter of 2011, this wage growth accelerated again to 7,5 per cent in the first quarter of 2012.
Nominal remuneration increases remained above the upper limit of the inflation target range in the gold-mining sector (14,9 per cent); the community, social and personal services sector (12,8 per cent); the manufacturing sector (8,0 per cent); the electricity sector (6,5 per cent); and the non-gold mining sector (6,1 per cent). Remuneration growth was fairly subdued in the private transport, storage and communication sector (2,0 per cent); the construction sector (3,2 per cent); and the trade, catering and accommodation services sector (3,2 per cent) in the first quarter of 2012. The acceleration in nominal remuneration growth per worker in the public sector could mainly be ascribed to a notable acceleration in wages per worker paid by national departments, which registered a year-on-year increase of 10,0 per cent.

15Quarterly Bulletin September 2012
Percentage change over four quarters
Per cent
Remuneration per worker and wage settlement rates
Private-sector remuneration per worker Public-sector remuneration per worker
Sources: Andrew Levy Employment Publications and South African Reserve Bank calculations
Andrew Levy wage settlement rate
2007 2008 2009 2010 2011 2012
0
5
10
15
20
25
0
2
4
6
8
10
12
14
QB3-2012BC06
According to Andrew Levy Employment Publications, the average wage settlement rate in collective bargaining agreements picked up from 7,3 per cent in the first quarter of 2012 to 7,7 per cent in the first half of 2012, implying wage settlements of around 8,1 per cent in the second quarter of 2012. The number of working days lost due to industrial action rose to 750 000 in the first half of 2012, compared with 400 000 for the corresponding period in 2011. Wages remained the major strike trigger and accounted for 86 per cent of working days lost and 58 per cent of the total number of strikes. In July 2012, after lengthy negotiations, government and public-sector trade unions agreed on an increase of 7 per cent in the salaries of government employees in 2012, with increases equal to consumer price inflation plus 1 percentage point in both 2013 and 2014.
Labour productivity and unit labour cost in the formal non-agricultural sector
Percentage change over four quarters
QB2-2012BC05
2007 2008 2009 2010 20112011 201220120
3
6
9
12
15
Labour productivityCompensation of employees per unit of real gross domestic product
Nominal unit labour cost

Quarterly Bulletin September 201216
Year-on-year growth in employment in the formal non-agricultural sector of the economy kept pace with output growth in the first quarter of 2012, resulting in productivity growth remaining unchanged at 0,9 per cent over the period. However, year-on-year growth in manufacturing output slowed alongside a moderation in the rate of job shedding, resulting in a deceleration in productivity growth in the manufacturing sector from 3,3 per cent in the fourth quarter of 2011 to 1,1 per cent in the first quarter of 2012.
Owing to the slight moderation in nominal remuneration growth per worker in the formal non-agricultural sector of the economy, growth in nominal unit labour cost slowed marginally from 5,8 per cent in the year to the fourth quarter of 2011 to 5,7 per cent in the year to the first quarter of 2012. In the manufacturing sector, however, the pace of increase in unit labour cost accelerated from 3,8 per cent to 6,8 per cent over the same period. When assessing unit labour cost using the broader national accounts measure of compensation of employees per unit of output (i.e., also including the agricultural sector and the informal sector), year-on-year growth in unit labour cost accelerated marginally from 5,4 per cent in the fourth quarter of 2011 to 5,5 per cent in the first quarter of 2012.
PricesIn an environment of declining commodity prices and subdued global inflation, headline consumer price inflation moderated from a recent high of 6,3 per cent in the year to January 2012 to 4,9 per cent in the year to July. This outcome, which resulted from a notable moderation in consumer goods price inflation, was more favourable than initially expected. Similarly, year-on-year producer price inflation for domestic output decelerated from a recent high of 10,6 per cent in October 2011 to 6,6 per cent in April 2012 and remained at this rate up to June, before moderating further to 5,4 per cent in July.
The short-term pace of increase in the producer price index for domestic output, expressed as a quarter-to-quarter seasonally adjusted and annualised rate, accelerated to 5,8 per cent in the first quarter of 2012, before moderating to 3,0 per cent in the second quarter. Likewise, the short-term pace of increase in the consumer price index decelerated from 7,7 per cent in the fourth quarter of 2011 to 5,8 per cent in the first quarter of 2012, before moderating further to 4,6 per cent in the second quarter.
Headline producer and consumer price inflation
Quarter-to-quarter percentage changes at seasonally adjusted annualised rates
Producer prices Consumer prices
2011: 1st qr ............................................................ 16,7 5,9
2nd qr ........................................................... 7,6 6,7
3rd qr ............................................................ 13,7 4,4
4th qr ............................................................ 4,4 7,7
2012: 1st qr ............................................................ 5,8 5,8
2nd qr ........................................................... 3,0 4,6
The deceleration in domestic producer price inflation from its recent peak of 10,6 per cent occurred alongside declining international commodity prices, as global economic growth prospects deteriorated throughout the first half of 2012. The moderation in overall headline producer price inflation was driven by
– mining and quarrying products, with price inflation slowing from 17,7 per cent in the year to September 2011 to 3,8 per cent in the year to July 2012;
– agricultural products, with price inflation slowing from 12,9 per cent in the year to October 2011 to 3,0 per cent in the year to July 2012; and
– products of petroleum and coal, with inflation decelerating from a high of 33,1 per cent in the year to November 2011 to 5,6 per cent in the year to July 2012.

17Quarterly Bulletin September 2012
Notwithstanding the general slowdown in producer price inflation, vigorous price increases continued in the year to July 2012 in the categories for food; electricity, gas, steam and water; leather and leather products; non-metallic mineral products; and other manufactured products.
In conformity with overall producer price inflation, the pace of increase in the prices of imported commodities moderated significantly in the first half of 2012, partly underpinned by an appreciation in the exchange rate of the rand in the opening months of the year. Year-on-year producer price inflation for imported agricultural products moderated to such an extent that it turned to deflation from December 2011 onwards, amounting to 3,0 per cent in May 2012, before prices increased again by 1,9 per cent in the year to July. Producer price inflation for imported mining commodities moderated from a year-on-year rate of 51,2 per cent in November 2011 to 16,4 per cent in July 2012, largely on account of notable declines in international crude oil prices. In addition, producer price inflation of imported manufactured goods remained subdued throughout the first half of 2012, amounting to a twelve-month rate of 1,5 per cent in July 2012.
After remaining within the inflation target range for 21 consecutive months up to October 2011, year-on-year headline consumer price inflation breached the upper limit of the inflation target range for six consecutive months, peaking at a rate of 6,3 per cent in January 2012. This twelve-month rate of increase subsequently moderated to 4,9 per cent in July 2012. The slackening in headline consumer price inflation resulted mainly from slower consumer goods price inflation, with the prices of food and non-alcoholic beverages, and to a lesser extent, petrol decreasing notably. The July 2012 headline inflation outcome marked the sixth consecutive month in which consumer price inflation outcomes were below consensus forecasts.
Consumer prices
Percentage change over twelve months
QB3-2012BC01
2009
Food prices Goods prices Targeted headline consumer prices
2010 2011 20122007 2008-3
0
3
6
9
12
15
18
21
Mirroring the movement in headline consumer price inflation, twelve-month consumer goods price inflation accelerated to 6,7 per cent in December 2011, before moderating significantly in subsequent months to 4,2 per cent in July 2012. The moderation in consumer goods price inflation was driven exclusively by a deceleration in the food and non-alcoholic beverages category, from a year-on-year rate of 11,1 per cent in December 2011 to 5,3 per cent in July 2012, and in the transport category, from a twelve-month rate of 6,4 per cent in November 2011 to 2,7 per cent in July 2012. Conversely, goods price inflation in the alcoholic beverages and tobacco category; and in the housing and utilities category accelerated somewhat in the first half of 2012, amounting to year-on-year rates of 7,4 per cent and 13,2 per cent respectively in June.

Quarterly Bulletin September 201218
The moderation in food and petrol price inflation resulted in an eighth consecutive monthly deceleration in consumer price inflation for non-durable goods, to a twelve-month rate of 6,3 per cent in July 2012. Semi-durable goods price inflation remained fairly subdued and amounted to 1,9 per cent in the year to July 2012. Despite accelerating marginally, consumer price inflation for durable goods remained in deflation for 29 consecutive months, registering a year-on-year rate of decline of 0,7 per cent in July 2012.
Consumer goods price inflation
Percentage change over twelve months
QB3-2012BC02
2009
Non-durable goods Durable goods
2010 2011 2012
Semi-durable goods Total goods
-6
-3
0
3
6
9
12
15
Cyclical turning points in consumer services price inflation generally lag those in consumer goods price inflation. Accordingly, twelve-month consumer services price inflation accelerated to 5,9 per cent in March 2012 and remained at this level up to June, before slowing marginally to 5,8 per cent in July. Despite consumer services price inflation remaining within the inflation target range of 3 to 6 per cent for 25 consecutive months, prices in the transport, health, education and restaurants and hotels categories nevertheless increased at rates in excess of the upper limit of the inflation target range. These price increases were counterbalanced by a deceleration in price inflation in the categories for housing utilities, communication, as well as recreation and culture services.
A slowdown in food price inflation was largely responsible for the easing of domestic inflationary pressures during the first half of 2012. The twelve-month rate of increase in the producer prices of food moderated notably from 10 per cent in October 2011 to 6,3 per cent in May 2012, before rising to 8,3 per cent in July. This deceleration in producer food price inflation mainly reflected the slowdown in agricultural food price inflation, from a recent peak of 11,9 per cent in the year to October 2011 to 2,3 per cent in the year to May 2012. Subsequently, agricultural food price inflation accelerated again to 9,0 per cent in July 2012. Despite remaining at fairly elevated levels, year-on-year manufactured producer food price inflation nonetheless moderated from a recent high of 10,9 per cent in February 2012 to 7,7 per cent in June before accelerating to 8,0 per cent in July.
Year-on-year consumer food price inflation slowed from a peak of 11,6 per cent in December 2011 to 5,4 per cent in July 2012, as the slowdown in producer food price inflation fed through to food prices at the consumer level. The moderation in consumer food price inflation resulted from lower rates of increase in the prices of most products in the consumer food basket, with the deceleration in meat prices being the most pronounced. Meat prices, representing the highest individual weight within the consumer food basket, decelerated from a year-on-year
19Quarterly Bulletin September 2012
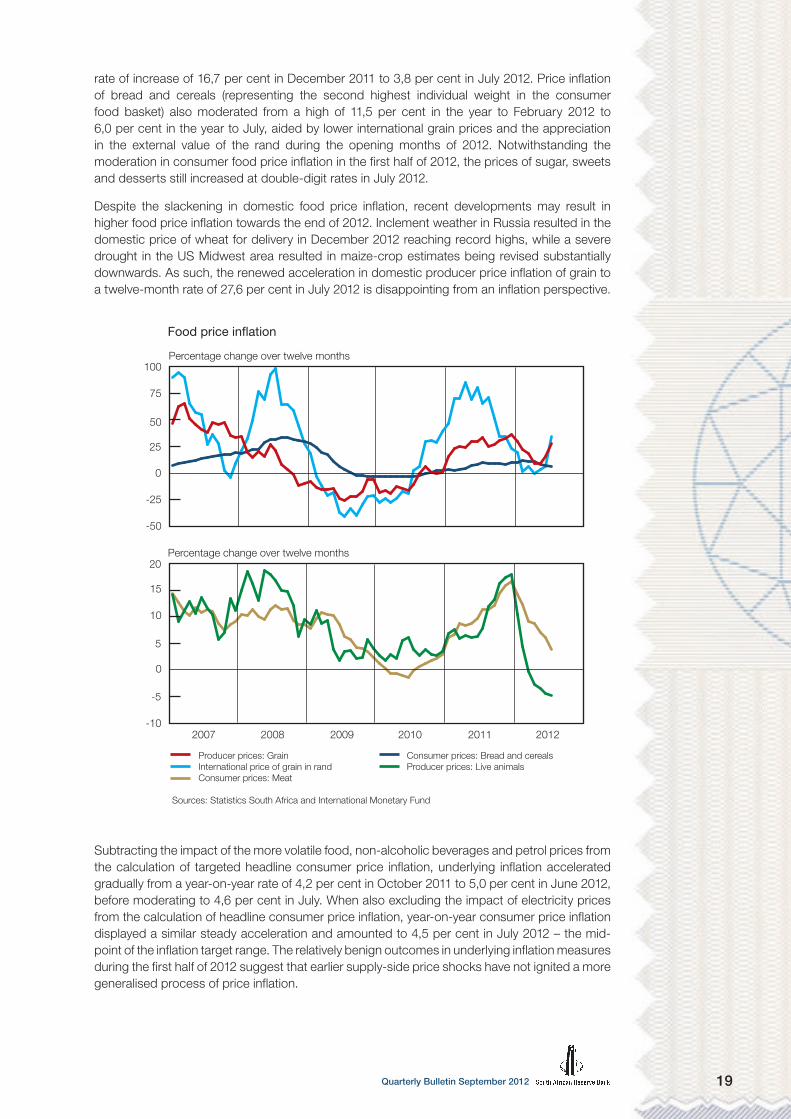
rate of increase of 16,7 per cent in December 2011 to 3,8 per cent in July 2012. Price inflation of bread and cereals (representing the second highest individual weight in the consumer food basket) also moderated from a high of 11,5 per cent in the year to February 2012 to 6,0 per cent in the year to July, aided by lower international grain prices and the appreciation in the external value of the rand during the opening months of 2012. Notwithstanding the moderation in consumer food price inflation in the first half of 2012, the prices of sugar, sweets and desserts still increased at double-digit rates in July 2012.
Despite the slackening in domestic food price inflation, recent developments may result in higher food price inflation towards the end of 2012. Inclement weather in Russia resulted in the domestic price of wheat for delivery in December 2012 reaching record highs, while a severe drought in the US Midwest area resulted in maize-crop estimates being revised substantially downwards. As such, the renewed acceleration in domestic producer price inflation of grain to a twelve-month rate of 27,6 per cent in July 2012 is disappointing from an inflation perspective.
Percentage change over twelve months
Percentage change over twelve months
Food price in�ation
Producer prices: Grain International price of grain in rand Consumer prices: Meat
Sources: Statistics South Africa and International Monetary Fund
Consumer prices: Bread and cereals Producer prices: Live animals
2007 2008 2009 2010 2011 2012
-50
-25
0
25
50
75
100
-10
-5
0
5
10
15
20
QB3-2012BC04
Subtracting the impact of the more volatile food, non-alcoholic beverages and petrol prices from the calculation of targeted headline consumer price inflation, underlying inflation accelerated gradually from a year-on-year rate of 4,2 per cent in October 2011 to 5,0 per cent in June 2012, before moderating to 4,6 per cent in July. When also excluding the impact of electricity prices from the calculation of headline consumer price inflation, year-on-year consumer price inflation displayed a similar steady acceleration and amounted to 4,5 per cent in July 2012 – the mid-point of the inflation target range. The relatively benign outcomes in underlying inflation measures during the first half of 2012 suggest that earlier supply-side price shocks have not ignited a more generalised process of price inflation.

Quarterly Bulletin September 201220
An analysis of price changes based on the Classification of Individual Consumption by Purpose (COICOP) categories confirms that underlying inflationary pressures in the economy remained reasonably restrained in the year to July 2012. The twelve-month rate of increase in three of the twelve categories exceeded the upper limit of the inflation target range of 6 per cent in July 2012. Of the remaining categories, six recorded price increases within the inflation target range, while three categories registered rates of increase below the lower limit of the inflation target range of 3 per cent.
Underlying measures of consumer price inflation
Percentage change over twelve months
QB3-2012BC03
2009
Targeted measure of inflation Headline CPI excluding food* and petrol Headline CPI excluding food*, petrol and electricity* Food includes non-alcoholic beverages
2010 2011 20122007 20080
3
6
9
12
15
The three categories that increased at rates above 6 per cent in July 2012 – collectively accounting for almost 11 per cent of the total consumer price basket – were alcoholic beverages and tobacco; education; and restaurants and hotels. The six categories that increased at rates between 3 and 6 per cent in July 2012 have a combined weight of almost 76 per cent in the total consumer price basket, while the three categories that increased at rates below the lower limit of the inflation target range have a combined weight of almost 13 per cent in the total consumer price basket.
Headline consumer price inflation in COICOP categories
Percentage change over twelve months
Category Weights July 2012
Education .................................................................... 2,19 9,0
Alcoholic beverages and tobacco ................................ 5,58 7,2
Restaurants and hotels ................................................ 2,78 6,1
Housing and utilities .................................................... 22,56 5,7
Food and non-alcoholic beverages .............................. 15,68 5,3
Health .......................................................................... 1,47 5,2
Miscellaneous goods and services .............................. 13,56 5,1
Transport ..................................................................... 18,80 4,6
Clothing and footwear ................................................. 4,11 3,6
Household content and services ................................. 5,86 2,6
Recreation and culture ................................................ 4,19 0,9
Communication ........................................................... 3,22 -1,0
All items headline consumer price index ................... 100,00 4,9
Italics indicate categories where the latest inflation rate falls between 3 and 6 per cent
Box: Grain price developments and inflation prospects
Developments in grain prices have a large bearing on inflation outcomes and the inflation trajectory mainly through the bread and cereals category, which constitutes almost 22 per cent of the consumer food price basket. In addition, grain price developments affect consumer price inflation through changes in the production cost of meat products, as they influence livestock feed costs.
Whereas in the opening months of 2012 market participants expected international grain prices to decrease in the current season on account of historically large areas planted in especially the US, the opposite outcome transpired more recently. Following a severe deterioration of maize crop prospects in the US as a result of drought coupled with extreme heat conditions during the critical stages of crop development, maize prices increased, on average, by 23 per cent in July 2012 compared with the preceding month. Simultaneously, international wheat prices surged by 19 per cent amid a worsening of production prospects in the Russian Federation and expectations of a firm demand for wheat from the livestock sector for the second consecutive season due to tight maize supplies.
Grain prices
Indices: 2000 = 100
50
100
150
200
250
300International cereal pricesDomestic agricultural grain pricesDomestic manufactured grain mill product pricesConsumer prices of bread and cereals
2000 2002 2004 2006 2008 2010 2012
PW01
Sources: Food and Agriculture Organization of the United Nations and Statistics South Africa
South Africa, being a small and open economy, is subject to international food price developments through import and export parity pricing practices. Given the surge in the international price of grain more recently, coupled with reduced domestic crop estimates, domestic maize and wheat prices consequently increased steeply. In fact, the prices of white and yellow maize respectively increased by 23,2 per cent and 25,6 per cent from May to July 2012, while that of wheat increased by 22,1 per cent.
According to most recent crop estimates made in August 2012, the size of the expected commercial maize crop for the 2012 harvesting season is 11,2 million tons, which is 4,3 per cent lower than the original estimate. However, this most recent maize crop estimate still exceeds the final crop for 2011 by 8 per cent. Concerning wheat production, the preliminary estimate of hectares planted decreased by 8,8 per cent compared with the previous season. This is the smallest area planted since the early 1930s. This decrease in the area planted resulted primarily from less favourable soil moisture conditions at the outset of the 2012 wheat planting season. Local wheat plantings are, however, not projected to continue the declining trend of the previous decade.
As indicated in the figure at the bottom of page 21, changes in the agricultural producer prices of grain precede those in the producer prices of manufactured grain products. As products move through inventory holdings and various stages of production, these changes are then transmitted through the price formation process, eventually impacting the consumer prices of bread and cereal products. While the lags between these various stages in the price formation process are not constant over price cycles, a fair amount of consistency in terms of the sequencing of price changes is nevertheless clearly evident in the accompanying graph. Following a deceleration in the rates of increase in the producer prices of grain since the closing months of 2011 and the production

21Quarterly Bulletin September 2012
Domestic spot prices of maize and wheat
Rand per ton
0
1 000
2 000
3 000
4 000
5 000
2000 2002 2004 2006 2008 2010 2012
PW02
Source: JSE Limited
Yellow maizeWhite maizeWheat
prices of manufactured grain in the opening months of 2012, price increases of bread and cereals moderated thereafter. Given this relationship in terms of price trends, it can be expected that the most recent rise in the producer prices of grain will place upward pressure on bread and cereal prices towards the end of 2012. It is generally expected that maize meal price increases will peak at around 10 per cent, while inflation in the price of brown bread will be in excess of 20 per cent, year-on-year, within the next six months.
Domestic grain price inflation
Percentage change over twelve months
PW03
-60
-40
-20
0
20
40
60
80
Producer prices of agricultural grainConsumer prices of bread and cereals
2000 2002 2004 2006 2008 2010 2012
Producer prices of manufactured grain products
Source: Statistics South Africa
Climate allowing, the current attractive producer prices of maize bode well for the area to be planted in the approaching planting season, and should support the adequacy of supplies in 2013. For monetary policy an important question is how much of the present and near-term movements in food price inflation will still be left at the operational time horizon of monetary policy, that is, 18 to 24 months into the future.

Quarterly Bulletin September 201222
An analysis of price changes based on the Classification of Individual Consumption by Purpose (COICOP) categories confirms that underlying inflationary pressures in the economy remained reasonably restrained in the year to July 2012. The twelve-month rate of increase in three of the twelve categories exceeded the upper limit of the inflation target range of 6 per cent in July 2012. Of the remaining categories, six recorded price increases within the inflation target range, while three categories registered rates of increase below the lower limit of the inflation target range of 3 per cent.
Underlying measures of consumer price inflation
Percentage change over twelve months
QB3-2012BC03
2009
Targeted measure of inflation Headline CPI excluding food* and petrol Headline CPI excluding food*, petrol and electricity* Food includes non-alcoholic beverages
2010 2011 20122007 20080
3
6
9
12
15
The three categories that increased at rates above 6 per cent in July 2012 – collectively accounting for almost 11 per cent of the total consumer price basket – were alcoholic beverages and tobacco; education; and restaurants and hotels. The six categories that increased at rates between 3 and 6 per cent in July 2012 have a combined weight of almost 76 per cent in the total consumer price basket, while the three categories that increased at rates below the lower limit of the inflation target range have a combined weight of almost 13 per cent in the total consumer price basket.
Headline consumer price inflation in COICOP categories
Percentage change over twelve months
Category Weights July 2012
Education .................................................................... 2,19 9,0
Alcoholic beverages and tobacco ................................ 5,58 7,2
Restaurants and hotels ................................................ 2,78 6,1
Housing and utilities .................................................... 22,56 5,7
Food and non-alcoholic beverages .............................. 15,68 5,3
Health .......................................................................... 1,47 5,2
Miscellaneous goods and services .............................. 13,56 5,1
Transport ..................................................................... 18,80 4,6
Clothing and footwear ................................................. 4,11 3,6
Household content and services ................................. 5,86 2,6
Recreation and culture ................................................ 4,19 0,9
Communication ........................................................... 3,22 -1,0
All items headline CPI ................................................ 100,00 4,9
Italics indicate categories where the latest inflation rate falls between 3 and 6 per cent

23Quarterly Bulletin September 2012
From June 2012 to July, the year-on-year rates of change in two of the twelve COICOP categories accelerated, while the rates of change in seven categories decelerated and stayed the same in the remaining three categories.
Administered price inflation decelerated from a recent peak of 13,4 per cent in the year to November 2011, to 7,5 per cent in the year to July 2012. The slowdown in administered price inflation could be attributed entirely to a deceleration in price inflation in the transport category, in particular petrol price inflation, which more than halved from a recent year-on-year peak of 30,0 per cent in October 2011 to 8,9 per cent in July 2012. Despite the slowdown in administered price inflation, it nonetheless contributed significantly to consumer price inflation, as twelve-month administered price inflation remained above the upper limit of the inflation target range for 32 consecutive months up to July 2012. With the exception of the prices of communication, television licences, motor licences and motor registrations, all other administered prices increased at rates in excess of the upper limit of the inflation target range in July 2012. When excluding the effect of petrol prices from the calculation of administered prices, this twelve-month rate of increase decelerated to 7,1 per cent in July 2012, after hovering just below the 9,0 per cent level for eleven consecutive months. Excluding electricity prices from the above-mentioned calculation as well, the rate of increase in administered prices also remained fairly stable for twelve consecutive months, amounting to 6,4 per cent in the year to July 2012.
Inflation expectations for 2012, as measured by the Survey of Inflation Expectations conducted by the BER, remained unchanged at 6,1 per cent in the second quarter of 2012 – the third consecutive quarter that expectations in respect of 2012 have remained at this level. Financial analysts revised their forecasts for all three survey years downwards from the previous quarter, while business executives revised their forecasts downwards for 2013 and 2014. Conversely, trade unions increased their forecast over the entire three-year horizon. In addition, households increased their inflation expectation for 2012 by 0,5 percentage points to a level of 6,7 per cent – the highest level since the fourth quarter of 2010. On balance, however, inflation expectations continue to straddle the upper limit of the inflation target range.
Headline consumer price inflation expectations
Per cent, as surveyed in the second quarter of 2012
Average inflation expected for:Financial analysts
Business representatives
Trade union representatives
All surveyed participants
2012..................................................... 5,9 6,2 6,2 6,1
2013..................................................... 5,3 6,3 6,5 6,0
2014..................................................... 5,3 6,4 6,6 6,1
Source: Bureau for Economic Research, Stellenbosch University

Quarterly Bulletin September 201224
Foreign trade and payments
International economic developmentsGlobal economic growth moderated to 2,8 per cent in the second quarter of 2012 after having surprised on the upside in the first quarter of the year. The slowdown in growth was relatively broad-based, with moderations recorded in many advanced and emerging-market economies. In some countries economic activity even contracted during the period.
The International Monetary Fund (IMF) lowered its global growth projections in the July 2012 World Economic Outlook Update to 3,5 per cent for 2012 and 3,9 per cent for 2013. The downward revisions reflected less favourable growth in many major emerging-market economies as a result of spillover effects from the euro area debt crisis and the delayed impact of earlier policy tightening. Weaker-than-expected activity in the euro area, particularly in the peripheral countries, primarily gave rise to the downward adjustments of earlier growth projections.
The IMF’s real output growth projection for the sub-Saharan African (SSA) region was revised downwards by 0,1 of a percentage point to 5,4 per cent for 2012 and remained unchanged at 5,3 per cent for 2013. Activity in SSA is expected to be underpinned by the extraction of natural resources (i.e., oil, gas and minerals) in several countries and the economic recovery in Western Africa. Modest global growth could, however, restrain export growth in many SSA countries.
Real output growth in advanced economies decelerated in the second quarter of 2012. Growth in the US continued to be affected by the unfolding fiscal and banking crisis in Europe and domestic fiscal policy concerns, and moderated to 1,7 per cent in the second quarter after decelerating to 2,0 per cent in the previous quarter. Positive contributions to second-quarter growth came from personal consumption expenditure, exports and fixed capital formation, which were partly offset by an increase in imports and negative contributions from private inventory investment and government expenditure.
Real output in Japan grew at a rapid pace of 5,5 per cent in the first quarter of 2012, underpinned by reconstruction spending, a sharp pickup in private consumption expenditure and inventory rebuilding. Japan’s output growth, however, moderated significantly to 1,4 per cent in the second quarter as export growth slowed due to the appreciation of the yen and the adverse impact of subdued growth in the euro area. Japan registered a record trade deficit in the first half of 2012, following increased energy imports due to the closure of all Japan’s nuclear power plants. Only two were restarted in July 2012.
Euro area real production contracted by 0,7 per cent in the second quarter of 2012, after stagnating in the first quarter. Tension in the financial markets of the euro area intensified further, with Spanish and Italian sovereign debt spreads rising as fiscal consolidation paths deteriorated. Concerns over the solvency of European banks increased due to large sovereign exposures, particularly in peripheral countries. Tighter financing conditions, weak confidence levels and fiscal consolidation restricted private investment and consumption spending. Consequently, the unemployment rate in the euro area rose to 11,3 per cent in July 2012, its highest level since the inception of the monetary union.
The growth performance of the United Kingdom (UK) deteriorated further in the second quarter of 2012, with real output contracting by 1,8 per cent, signifying a further deepening of the economic recession in the wake of the European debt crisis.
The slowdown in economic growth in emerging-market economies was fairly pervasive in the second quarter of 2012. Economic growth in emerging Europe is expected to moderate to 2,6 per cent in the second quarter of 2012. Economic activity was subdued in Russia and contracted in Hungary. Output growth in emerging Asia moderated marginally to 7,0 per cent in the second quarter of 2012. The European debt crisis and uncertainty about Greece’s future have dampened external demand for the products of export-orientated Asian economies such as China, South Korea, Taiwan and Malaysia. China recorded second-quarter growth of 7,2 per cent, the sixth consecutive quarter of single-digit growth. Apart from facing weak external

25Quarterly Bulletin September 2012
demand for exports, Chinese growth has been marked by modest consumption spending, retail sales and manufacturing growth. Growth in real economic activity in emerging Latin America moderated to 1,9 per cent in the second quarter of 2012 as subdued activity in the US, the continuing European debt crisis and lower global commodity prices continued to weigh on growth prospects in the region. Weaker growth in the region was underpinned by moderating growth rates in Argentina, Mexico and Venezuela. Brazil and Chile, however, recorded faster growth in the second quarter.
Growth in the volume of world trade slowed to an annualised quarterly rate of 1,3 per cent in the second quarter of 2012 compared with a rate of 3,1 per cent in the previous quarter. The growth in the volume of world trade remains below its long-term average.
World trade and export volumes in advanced and emerging economies
Indices: 2000 = 100
50
100
150
200
250
World trade
Emerging economies(Exports)
Advanced economies(Exports)
2003 2005 2007 2009 2011 2012
Source: CPB Netherlands Bureau for Economic Policy Analysis
INTRO3
After remaining stable at levels of around US$125 per barrel, Brent crude oil prices started to decline at the beginning of the second quarter of 2012 and approached prices of around US$92 per barrel towards the end of June 2012. This sharp slowdown in oil prices was due to concerns about the recovery of the global economy, the euro area debt crisis and the stronger-than-expected slowdown in emerging-market economies, especially China. Oil prices, however, rebounded sharply by almost 30 per cent to levels of around US$116 per barrel in mid-August 2012 as a result of the sanctions on Iran and Hurricane Isaac threatening oil production in the Gulf of Mexico.
During the second quarter of 2012, world oil demand fell to 88,8 million barrels per day, down from 89,4 million barrels per day in the first quarter. The demand for oil decreased in Europe, China and Japan, but increased in the US, Brazil, Russia and India. Oil production from the Organization of the Petroleum Exporting Countries (OPEC) edged higher to 38,0 million barrels per day in the first quarter of 2012, driven by higher output in Libya, Saudi Arabia, Iraq and Kuwait. Iran’s oil production has, however, declined by 20 per cent since the end of 2011 as sanctions were starting to have a negative impact. The International Energy Agency (IEA) estimated that oil exports from Iran had fallen by almost 40 per cent during the same period as the country had to stockpile oil that could not be exported. Towards the end of August 2012 Brent crude oil futures prices traded at around US$112 per barrel for delivery in the fourth quarter of 2012 and US$111 per barrel for delivery in the first quarter of 2013.

Quarterly Bulletin September 201226
International crude oil prices
INTRO1
J M M J S N J M M J S N J M M J S N J M M J S N J M M J S N J M M J S N
US dollar per barrel
Futures prices (on 27 August 2012)
30
60
90
120
150Spot price
Source: Bloomberg
2008 2009 2010 2011 2012 2013
Global headline inflation trended upwards from mid-2009, reaching a recent high of 4,7 per cent in September 2011 before starting to lose momentum. World inflation has since decelerated to 3,1 per cent in July 2012, following the earlier decline in oil prices, alleviating inflationary pressures in both advanced and emerging-market economies. The US experienced moderating price pressures in the second quarter of 2012, driven primarily by external factors. The core measure of inflation, which excludes food and energy, was unchanged from the previous quarter at an average rate of 2,3 per cent in the second quarter of 2012. Year-on-year headline consumer price inflation in Japan moderated to 0,1 per cent in the second quarter of 2012. Core inflation, which excludes food and energy prices, remained negative, increasing the deflationary risks in the subsequent quarters of 2012. Annual consumer price inflation slowed somewhat in the euro area in the second quarter of 2012, with inflation at 2,4 per cent in July 2012. Inflationary pressures in the UK moderated noticeably in the second quarter of 2012, reflecting lower costs of food, transportation, fuel and utilities.
Global consumer price developments
Per cent
-2
0
2
4
6
8
10
12
World
Emerging and developing countries
Advanced economies
Source: IMF International Financial Statistics
2001 2003 2005 2007 2009 2011 2012
INTRO4
Consumer price inflation in emerging Europe moderated on average in the second quarter of 2012, but accelerated again in July 2012, especially in Hungary, Romania, Russia and Turkey. Inflation in most emerging Asian economies (except India) eased in the second quarter of 2012.

27Quarterly Bulletin September 2012
This was mainly due to lower oil prices as many emerging Asia countries are dependent on imported oil. In China, easing inflation was largely due to a fall in food prices which has, until recently, been the main driver of inflation. Inflation in emerging Latin America continued to ease in the second quarter of 2012. This trend was driven by Brazil where consumer price inflation moderated for the third consecutive quarter. Chile, Colombia, Ecuador, Peru and Venezuela also recorded lower inflation, although Venezuela is still experiencing an inflation rate in excess of 20 per cent. Argentina was the only country in the region that recorded higher inflation in the second quarter.
Inflationary pressures moderated in the Southern African Development Community (SADC) member countries in the second quarter of 2012. However, double-digit inflation rates were recorded in Tanzania, Angola and Malawi. Inflation is expected to moderate in the remainder of 2012 due to lacklustre consumer demand in these countries.
The US Federal Funds rate remained unchanged at an exceptionally low level throughout the second quarter of 2012. The Federal Open Market Committee (FOMC) noted that inflation had moderated due to lower oil prices, while longer-term inflation expectations had remained stable. The Bank of Japan has kept its key policy rate unchanged at 0,05 per cent since October 2010. The European Central Bank (ECB) has lowered its policy rate to record lows by reducing the main refinancing rate to 0,75 per cent in July 2012. The Bank of England maintained the official bank rate at 0,5 per cent, but increased the stock of asset purchases financed by the issuance of central bank reserves by £50 billion to £375 billion during the second quarter of 2012.
The central banks of Canada and New Zealand have kept their policy rates unchanged for some time. However, the Reserve Bank of Australia has since late 2011 lowered its policy rate by a cumulative 125 basis points to 3,5 per cent due to a favourable inflation outlook, coupled with weaker-than-expected growth prospects.
Moderating inflationary pressures and growth concerns in China have led the People’s Bank of China to lower interest rates twice in two months. In the second quarter lending rates were reduced by a cumulative 56 basis points to 6 per cent. The one-year benchmark deposit rate was also lowered by a cumulative 50 basis points to 3 per cent. These were the first reductions since the second half of 2008. In India the high rates of inflation have made it difficult for the monetary authorities to lower rates despite the need to stimulate growth. Owing to lower inflation rates and weaker economic prospects, the Bank of Korea lowered interest rates by 25 basis points to 3 per cent in July 2012. Monetary policy rates were kept unchanged in most emerging European economies, mindful of heightened global economic uncertainties. However, the Czech Republic and Hungary both reduced their key policy rates by 25 basis points in recent months. Most central banks in emerging Latin America continued to keep their policy rates unchanged in the second quarter of 2012. In July and August 2012, the central bank of Colombia, however, lowered its policy rate by a cumulative 50 basis points to 4,75 per cent, citing weaker-than-expected global growth and moderating inflationary pressures. The Brazilian central bank continued to lower its policy rate aggressively from the beginning of the second quarter to a historic low of 7,5 per cent.
All SADC member countries kept their policy rates unchanged in the second quarter of 2012. Kenya (not a member of SADC) reduced its key policy rate by 150 basis points to 16,5 per cent in June 2012.
Current account 3
In the second quarter of 2012 economic activity in many countries continued to be adversely affected by the relatively unbalanced global economic recovery and a moderation in global demand, especially from Europe. Weaker growth prospects for the euro area not only negatively impacted external trade balances of export-led economies with significant direct trade linkages with Europe, but through spillover effects also had a negative bearing on export growth of other trading-partner countries indirectly exposed to the euro area. In South Africa the moderation in export earnings coincided with a further increase in the value of merchandise imports, resulting in the deficit on the trade account of the balance of payments increasing significantly from R42,0 billion in the first quarter of 2012 to R75,7 billion in the second quarter. Simultaneously, the shortfall on the service, income and current transfer account widened notably, aggravated by higher dividend payments to the rest of the world.
3 Unless stated to the contrary, the current-account transactions referred to in this section are seasonally adjusted and annualised.

Quarterly Bulletin September 201228
Balance of payments on current account
R billions, seasonally adjusted and annualised
2011 2012
2nd qr 3rd qr 4th qr Year 1st qr 2nd qr
Merchandise exports .............................................. 652,4 671,8 714,8 671,2 697,7 688,6
Net gold exports ..................................................... 70,4 83,5 85,0 75,3 79,3 79,2
Merchandise imports .............................................. -696,9 -739,0 -816,9 -730,1 -819,0 -843,5
Trade balance ........................................................ 25,9 16,3 -17,1 16,4 -42,0 -75,7
Net services, income and current transfer payments ....................................... -114,4 -137,8 -93,1 -115,2 -110,5 -124,3
Balance on current account .................................. -88,5 -121,5 -110,2 -98,8 -152,5 -200,0
As a percentage of gross domestic product ....... -3,0 -4,1 -3,6 -3,3 -4,9 -6,4
As a result, the deficit on the current account of the balance of payments rose from 4,9 per cent of gross domestic product in the first quarter of 2012 to 6,4 per cent in the second quarter. The larger imbalance reflected the simultaneous deterioration in the trade and services accounts over the period.
2008 2009 2010 2011 20122007
Balance of payments: Current account
Percentage of gross domestic product
QB3-2012BOP05
Trade account
Services, income and current transfer account
Balance on current account
-4
-3
-2
-1
0
1
2
3
-8
-6
-4
-2
0
-10
-8
-6
-4
-2
0
Seasonally adjusted and annualised
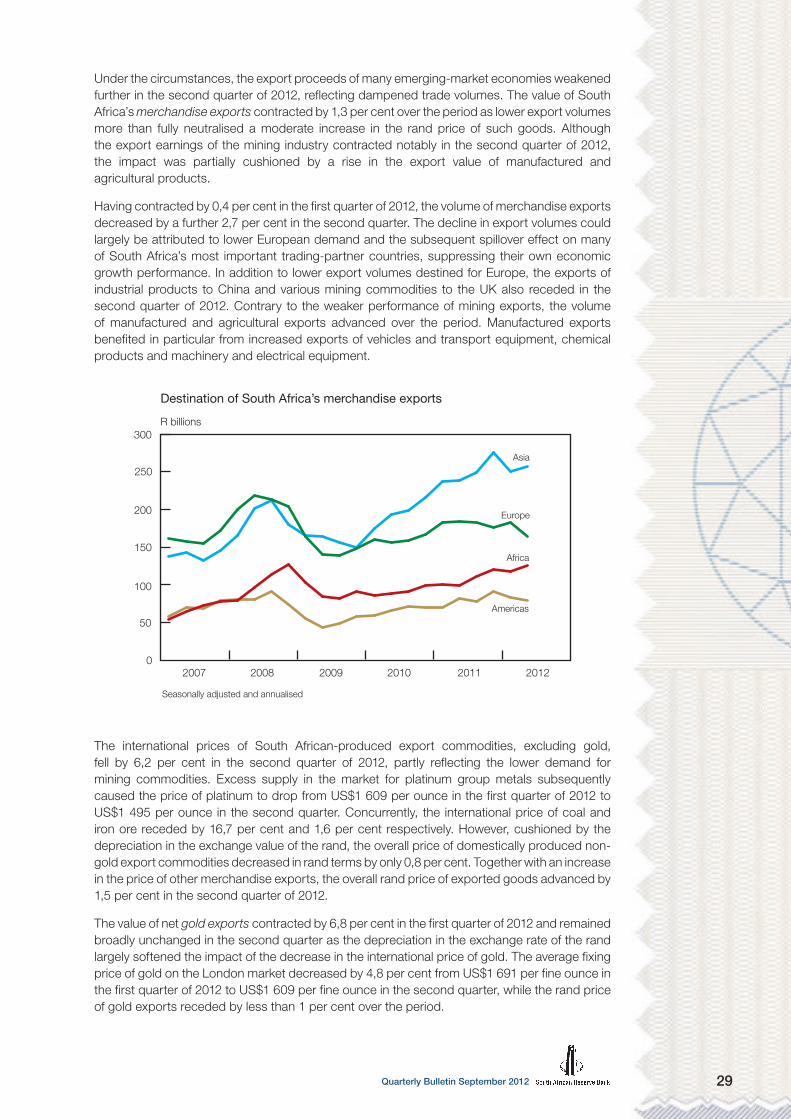
29Quarterly Bulletin September 2012
Under the circumstances, the export proceeds of many emerging-market economies weakened further in the second quarter of 2012, reflecting dampened trade volumes. The value of South Africa’s merchandise exports contracted by 1,3 per cent over the period as lower export volumes more than fully neutralised a moderate increase in the rand price of such goods. Although the export earnings of the mining industry contracted notably in the second quarter of 2012, the impact was partially cushioned by a rise in the export value of manufactured and agricultural products.
Having contracted by 0,4 per cent in the first quarter of 2012, the volume of merchandise exports decreased by a further 2,7 per cent in the second quarter. The decline in export volumes could largely be attributed to lower European demand and the subsequent spillover effect on many of South Africa’s most important trading-partner countries, suppressing their own economic growth performance. In addition to lower export volumes destined for Europe, the exports of industrial products to China and various mining commodities to the UK also receded in the second quarter of 2012. Contrary to the weaker performance of mining exports, the volume of manufactured and agricultural exports advanced over the period. Manufactured exports benefited in particular from increased exports of vehicles and transport equipment, chemical products and machinery and electrical equipment.
Destination of South Africa’s merchandise exports
R billions
QB3-2012BOP07
2007 2008 2009 2010 2011 20120
50
100
150
200
250
300
Asia
Americas
Europe
Africa
Seasonally adjusted and annualised
The international prices of South African-produced export commodities, excluding gold, fell by 6,2 per cent in the second quarter of 2012, partly reflecting the lower demand for mining commodities. Excess supply in the market for platinum group metals subsequently caused the price of platinum to drop from US$1 609 per ounce in the first quarter of 2012 to US$1 495 per ounce in the second quarter. Concurrently, the international price of coal and iron ore receded by 16,7 per cent and 1,6 per cent respectively. However, cushioned by the depreciation in the exchange value of the rand, the overall price of domestically produced non-gold export commodities decreased in rand terms by only 0,8 per cent. Together with an increase in the price of other merchandise exports, the overall rand price of exported goods advanced by 1,5 per cent in the second quarter of 2012.
The value of net gold exports contracted by 6,8 per cent in the first quarter of 2012 and remained broadly unchanged in the second quarter as the depreciation in the exchange rate of the rand largely softened the impact of the decrease in the international price of gold. The average fixing price of gold on the London market decreased by 4,8 per cent from US$1 691 per fine ounce in the first quarter of 2012 to US$1 609 per fine ounce in the second quarter, while the rand price of gold exports receded by less than 1 per cent over the period.

Quarterly Bulletin September 201230
International prices of selected South African export commodities
US dollar indices: 2005 = 100
QB3-2012BOP03
2007 2008 2009 2010 2011 20120
100
200
300
400
500
600
700
Copper Platinum
Nickel Coal
Gold Iron ore
This marginal decline in the rand price of gold coincided with a muted decrease in the volume of net gold exports in the second quarter of 2012, following a contraction in the preceding three quarters. These developments were symptomatic of the weak performance of the mining industry in general.
Value of mining exports
R billions
QB3-2012BOP04
2007 2008 2009 2010 2011 20120
100
200
300
400
500
Seasonally adjusted and annualised
The volume of merchandise imports advanced moderately by 1,0 per cent in the second quarter of 2012 following an increase of 0,8 per cent in the first quarter. Notwithstanding the increased demand for imported vehicles and transport equipment (including the acquisition of an aircraft and a ship), and machinery and electrical equipment in the second quarter of 2012, the volume of non-oil imports contracted over the period, weighed down by reduced demand for textiles and articles made thereof, chemical products and other non-oil mining products. While demand for non-oil imports edged lower, this came off a high base. The volume of crude oil imports rose significantly in the second quarter of 2012 after contracting in the first quarter of 2012 due to an unplanned shutdown prompted by maintenance work that had to be undertaken at a Durban single-buoy mooring.
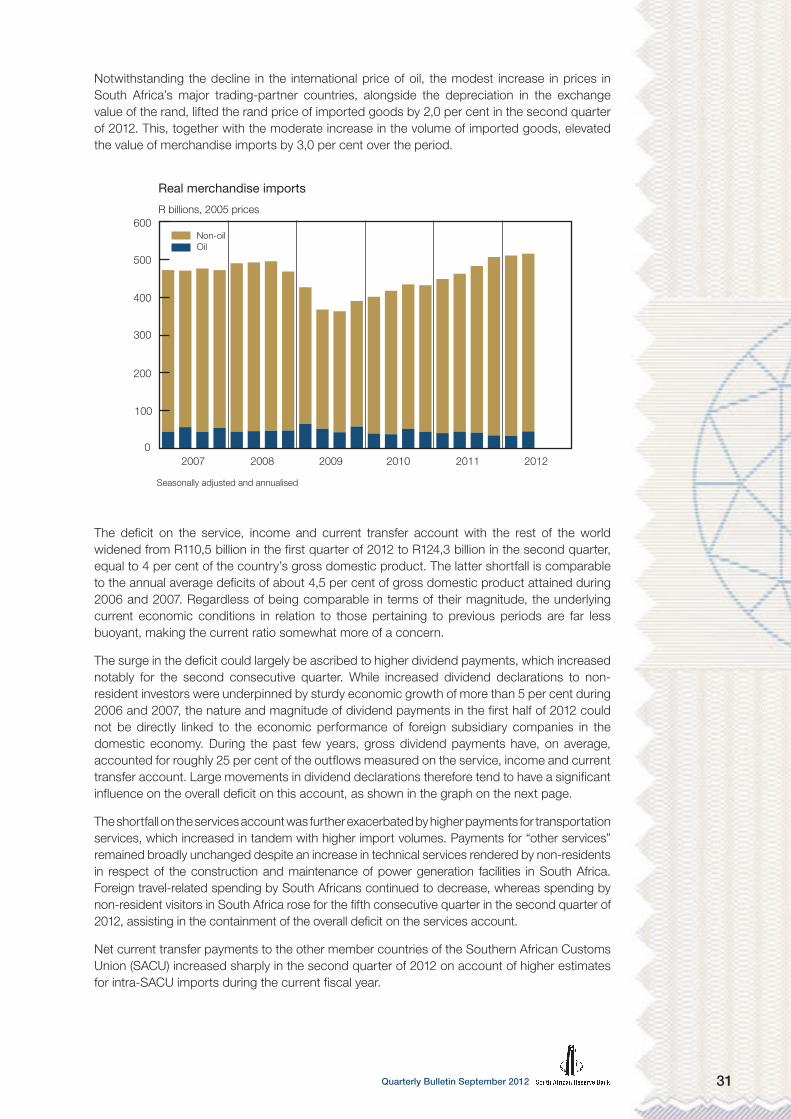
31Quarterly Bulletin September 2012
Notwithstanding the decline in the international price of oil, the modest increase in prices in South Africa’s major trading-partner countries, alongside the depreciation in the exchange value of the rand, lifted the rand price of imported goods by 2,0 per cent in the second quarter of 2012. This, together with the moderate increase in the volume of imported goods, elevated the value of merchandise imports by 3,0 per cent over the period.
Real merchandise imports
R billions, 2005 prices
2007 2008 2009 2010 2011 20120
100
200
300
400
500
600Non-oilOil
QB3-2012BOP06
Seasonally adjusted and annualised
The deficit on the service, income and current transfer account with the rest of the world widened from R110,5 billion in the first quarter of 2012 to R124,3 billion in the second quarter, equal to 4 per cent of the country’s gross domestic product. The latter shortfall is comparable to the annual average deficits of about 4,5 per cent of gross domestic product attained during 2006 and 2007. Regardless of being comparable in terms of their magnitude, the underlying current economic conditions in relation to those pertaining to previous periods are far less buoyant, making the current ratio somewhat more of a concern.
The surge in the deficit could largely be ascribed to higher dividend payments, which increased notably for the second consecutive quarter. While increased dividend declarations to non-resident investors were underpinned by sturdy economic growth of more than 5 per cent during 2006 and 2007, the nature and magnitude of dividend payments in the first half of 2012 could not be directly linked to the economic performance of foreign subsidiary companies in the domestic economy. During the past few years, gross dividend payments have, on average, accounted for roughly 25 per cent of the outflows measured on the service, income and current transfer account. Large movements in dividend declarations therefore tend to have a significant influence on the overall deficit on this account, as shown in the graph on the next page.
The shortfall on the services account was further exacerbated by higher payments for transportation services, which increased in tandem with higher import volumes. Payments for “other services” remained broadly unchanged despite an increase in technical services rendered by non-residents in respect of the construction and maintenance of power generation facilities in South Africa. Foreign travel-related spending by South Africans continued to decrease, whereas spending by non-resident visitors in South Africa rose for the fifth consecutive quarter in the second quarter of 2012, assisting in the containment of the overall deficit on the services account.
Net current transfer payments to the other member countries of the Southern African Customs Union (SACU) increased sharply in the second quarter of 2012 on account of higher estimates for intra-SACU imports during the current fiscal year.

Quarterly Bulletin September 201232
Balance on the services, income and current transfer account
R billions
QB3-2012BOP08
2007 2008 2009 2010 2011 2012-150
-120
-90
-60
-30
0
Balance excluding gross dividend payments
Balance including gross dividend payments
Seasonally adjusted and annualised
Trend
Trend
South Africa’s terms of trade remained in high territory but deteriorated further in the second quarter of 2012 as marginally higher prices of South Africa’s export commodities were outpaced by steeper increases in import prices.
Financial accountAdverse economic and political developments in global financial markets continued to dominate capital flows to emerging-market economies. In fact, concerns about global financial stability and a change in risk perceptions towards emerging-market economies again turned investors’ sentiment negative in the second quarter of 2012. Nonetheless, foreign capital inflows accounted for in the financial account of South Africa’s balance of payments amounted to R48,0 billion in the second quarter of 2012, following an inflow of R50,5 billion in the first quarter. As a ratio of gross domestic product, these net inflows slowed from 6,6 per cent to 6,0 per cent over the period. Similar to the previous quarter, the net inflow of capital in the second quarter of 2012 was largely dominated by inward portfolio investment; on a net basis, the other investment category recorded a smaller capital inflow over the period.
Net financial transactions not related to reserves
R billions
2011 2012
2nd qr 3rd qr 4th qr Year 1st qr 2nd qr
Change in liabilities
Direct investment .............................. 15,4 2,8 18,7 42,1 7,7 5,7
Portfolio investment .......................... 35,1 -21,4 12,5 47,0 28,9 22,7
Other investment .............................. 13,9 11,5 7,2 31,7 -3,7 17,3
Change in assets
Direct investment .............................. -1,6 12,9 6,0 4,6 -5,0 -4,6
Portfolio investment .......................... -10,5 -9,9 -3,0 -44,5 -13,8 -5,5
Other investment .............................. -17,0 8,7 -28,8 -3,6 13,4 -11,5
Total financial transactions*................. 23,4 34,5 19,9 131,3 50,5 48,0
As a percentage of gross domestic product ............................. 3,2 4,6 2,6 4,4 6,6 6,0
* Including unrecorded transactions

33Quarterly Bulletin September 2012
Foreign-owned assets in South Africa
Foreign direct investment flows into South Africa amounted to R5,7 billion in the second quarter of 2012 compared with R7,7 billion in the first quarter. The recent inward movement of capital mainly reflected the further acquisition of equity and loans granted by foreign parent companies to domestic subsidiary companies.
Foreign portfolio investment into South Africa remained robust and increased by R22,7 billion in the second quarter of 2012, following an inflow of R28,9 billion in the first quarter. Despite the sustained volatility in global financial markets and fickle investor sentiment, non-resident investors continued to accumulate South African-issued debt securities over the period. Non-resident investors increased their holdings of domestic bonds by R18,9 billion in the second quarter of 2012 following net purchases of R34,9 billion in the preceding quarter. The inward movement of capital was partly neutralised by the redemption of a R10 billion international bond issue that matured over the same period. Non-resident investors’ sentiment towards domestic equity securities changed somewhat in the second quarter of 2012 when they became net purchasers of equity to the value of R3,9 billion. This marginal accumulation was preceded by a notable disposal of domestic equity securities since the start of 2011.
Net portfolio investment
R billions
2007 2008 2009 2010 2011 2012-120
-100
-80
-60
-40
-20
0
20
40
60Debt securitiesEquity securities
QB1-2012BOP09
Other investment liabilities changed from a net capital outflow of R3,7 billion in the first quarter of 2012 to a net inflow of R17,3 billion in the second quarter. These inflows mainly reflected long-term loans extended to the non-bank private sector as well as an increase in rand deposits with the domestic banking sector.
South African-owned assets abroad
South African companies continued to extend funding to their foreign subsidiaries and associated companies in the second quarter of 2012, albeit at a slower pace than in the first quarter of 2012. Consequently, outward direct investment recorded an outflow of R4,6 billion in the second quarter of 2012 compared with a net outflow of R5,0 billion in the preceding quarter.
Outward foreign portfolio investment by South African institutional and individual investors contracted somewhat in the second quarter of 2012. The acquisition of foreign equity and debt securities amounted to R5,5 billion over the period, significantly lower than the R13,8 billion registered in the first quarter. The contraction could, in part, be attributed to the prevailing uncertainty in the global financial markets and the depreciation in the exchange rate of the rand during the second quarter of 2012.

Quarterly Bulletin September 201234
Other outward investment from South Africa switched abruptly from an inflow of R13,4 billion in the first quarter of 2012 to an outflow of R11,5 billion in the second quarter. This outflow of capital was largely brought about by an increase in the deposits of the domestic banking sector with their foreign counterparty banks.
Foreign debtSouth Africa’s total outstanding foreign debt amounted to an all-time high of US$118,5 billion at the end of March 2012. Expressed in rand terms, the country’s external debt increased by R4 billion from R906 billion at the end of the fourth quarter of 2011 to R910 billion at the end of the first quarter 2012. As a result, the external debt ratios to gross domestic product and total export earnings deteriorated in the first quarter of 2012.
The country’s rand-denominated debt continued to trend upwards in the first quarter of 2012 owing to non-resident investors’ sustained appetite for domestically issued debt securities. In addition, the domestic banking sector increased its short-term loan commitments obtained under repurchase agreements.
South Africa’s external debt
US$ billions at end of period
2011 2012
1st qr 2nd qr 3rd qr 4th qr 1st qr
Foreign currency-denominated debt................... 49,8 53,5 51,6 50,9 53,3
Bearer bonds .................................................... 21,1 22,2 21,3 20,9 22,9
Other ................................................................ 28,7 31,3 30,3 30,0 30,4
Public sector ................................................. 7,1 7,8 7,8 7,6 8,3
Monetary sector ............................................ 9,0 11,0 10,0 9,9 11,0
Non-monetary private sector ......................... 12,6 12,5 12,5 12,5 11,1
Rand-denominated debt ..................................... 58,5 61,2 56,2 60,6 65,2
Bonds ............................................................... 24,6 29,7 27,9 30,3 33,1
Other ................................................................ 33,9 31,5 28,3 30,3 32,1
Total foreign debt ................................................ 108,3 114,7 107,8 111,5 118,5
As a percentage of gross domestic product ..... 28,3 28,5 25,9 27,3 29,2
As a percentage of total export earnings .......... 98,4 98,4 88,0 90,6 96,4
After declining for two consecutive quarters, the country’s foreign currency-denominated debt increased from US$50,9 billion at the end of the fourth quarter of 2011 to US$53,3 billion at the end of the first quarter of 2012. International bonds issued by the National Treasury and the domestic banking sector, in addition to the continued foreign funding obtained by parastatals, were mainly responsible for the rise in foreign currency-denominated debt. These capital inflows were, however, partly countered by the redemption of a sizeable long-term loan by a domestic company in the manufacturing sector.
An analysis of debt according to maturity suggests that the ratios of both short- and long-term debt, relative to gross domestic product, have been deteriorating since the end of September 2011.

35Quarterly Bulletin September 2012
External debt
Percentage of gross domestic product
QB3-2012BOP10
2007 2008 2009 2010 2011 20120
5
10
15
20
25
30
Medium and long termShort-term original maturity
International reserves and liquidity South Africa’s overall balance-of-payments position (i.e., the change in the country’s net international reserves resulting from balance-of-payments transactions) decreased by R3,8 billion in the second quarter of 2012, following an increase of R7,7 billion in the first quarter.
The country’s gross gold and other foreign reserves (i.e., the official international reserves of the Bank before accounting for reserve-related liabilities) declined from US$50,7 billion at the end of March 2012 to US$49,2 billion at the end of June, before increasing again to US$50,0 billion at the end of August. The decline in the price of gold, together with the appreciation of the US dollar against major currencies, partly contributed to the decrease in international reserves.
The international liquidity position of the country declined by US$1,0 billion from US$48,9 billion at the end of March 2012 to US$47,9 billion at the end of June, before increasing to US$48,3 billion at the end of August. Since the end of March 2012 the level of import cover remained broadly unchanged at approximately 19 weeks’ worth of imports of goods and services.
Exchange ratesAfter having increased by 4,4 per cent in the first quarter of 2012, the nominal effective exchange rate of the rand lost some momentum and decreased by 4,8 per cent in the second quarter. The depreciation in the exchange value of the rand was mainly due to heightened risk aversion, following an array of economic data that seemed to suggest that the global economic recovery might be slower than anticipated. Domestically, the currency was weighed down by the wider-than-expected current-account deficit and the moderation in economic activity in the opening months of 2012.

Quarterly Bulletin September 201236
Exchange rates of the rand
Percentage change
30 Sep 2011to
31 Dec 2011
31 Dec 2011to
31 Mar 2012
31 Mar 2012to
30 Jun 2012
30 Jun 2012to
31 Aug 2012
Weighted average* .............................. 0,7 4,4 -4,8 -1,8
Euro ..................................................... 3,3 2,5 -1,9 -1,1
US dollar .............................................. -1,3 5,9 -7,5 -1,5
Chinese yuan........................................ -2,6 5,9 -6,7 -1,5
British pound ........................................ -0,2 2,0 -5,3 -2,6
Japanese yen ....................................... -0,3 12,0 -10,5 -2,7
* Against a basket of 15 currencies
During April and May 2012, the nominal effective exchange rate of the rand decreased by 0,8 per cent and 5,8 per cent respectively. Pronounced declines were registered against the US dollar and the Japanese yen. The rand, however, gained some ground in June, mainly due to progress made in addressing the euro area debt crisis and confirmation by Citigroup that it would include South African government bonds in its World Government Bond Index (WGBI) from October 2012. In addition, the successful issuance of an international bond by a public corporation also contributed positively towards the strength of the rand. The exchange rate of the rand appreciated by 1,9 per cent in June and 1,7 per cent in July 2012, supported by the resolution of the European Union (EU) summit to create a European Banking Union. The modest rebound of economic activity in China and monetary easing by major central banks assisted the currencies of most emerging-market economies over the period. During August 2012, however, the domestic currency retracted somewhat alongside challenges faced by the domestic platinum industry and declining prices of South African export commodities.
Selected exchange rates: US dollar per domestic currency unit
Indices: January 2007 = 100
QB3-2012BOP13
2007 2008 2009 2010 2011 201265
75
85
95
105
115
125
135
145
South African rand Turkish lira
Brazilian real Mexican peso
Stronger domestic currency = higher
Following an increase of 0,8 per cent in March 2012, the real effective exchange rate of the rand decreased by 3,1 per cent in April and by a further 0,8 per cent in June, boosting the external price competitiveness of local exporters.
The average net daily turnover in the domestic market for foreign exchange remained broadly unchanged at US$19,5 billion from the first quarter of 2012 to the second quarter. A decline in the value of swap transactions was almost fully countered by an increase in the value of spot transactions by monetary and resident counterparties over the period.

37Quarterly Bulletin September 2012
Monetary developments, interest rates and financial markets
Money supplyTwelve-month growth in the broadly defined money supply (M3) followed a relatively flat trajectory in the first five months of 2012, fluctuating between 5 and 6 per cent, before increasing to 7,0 per cent in June. Apart from the moderate downward impact of reclassification of some deposit holdings into debt instruments4 in the first quarter of 2012, lacklustre growth in M3 occurred against the backdrop of a moderation in the deposit holdings of non-financial companies. The deposit holdings of non-financial companies initially recorded robust growth in the latter part of 2011 alongside improving commodity prices, but moderated somewhat in the first half of 2012 as growth in nominal gross domestic product slowed in a sluggish domestic and global economic environment. By contrast, growth in the deposit holdings of the household sector trended higher during the second quarter of 2012, supported by a moderate improvement in employment creation and above-inflation wage settlements during this period. The slackening growth in money supply during the early part of 2012 broadly emulated the trend during the first half of 2011, and contrasted rather sharply with the healthy growth recorded during the second half of 2011. In July 2012 year-on-year growth in M3 increased further to 8,3 per cent.
-5
0
5
10
15
20
25
30
35
Growth in M3
Percentage change
2007 2008 2009 2010 2011 2012
Quarterly at seasonally adjusted annualised rates Over twelve months
QB3-2012MB01
The moderation in M3 growth was also evident in the quarter-to-quarter5 growth rate, which receded from a high of 14,0 per cent in the fourth quarter of 2011 to low single-digit values in both the first and the second quarters of 2012.
Alongside the lustreless domestic economic activity, most of the interest-bearing deposit categories of M3 contracted during the second quarter of 2012, with the exception of other short- and medium-term deposits, which attracted the bulk of deposits. Notes and coin also accelerated, reflecting an elevated transactions demand for cash.
Overall, M3 money supply increased by R25,7 billion in the second quarter of 2012, a significant improvement from the contraction of R31,7 billion recorded in the first quarter. The rise in the deposit holdings of the household sector, amounting to R25,1 billion, was solely responsible for the expansion in M3 growth, while corporate-sector deposits contributed a mere R0,6 billion during the second quarter of 2012. The year-on-year growth in M3 deposit holdings of the household sector continued to exceed that of corporate-sector deposit holdings, accelerating to a high of 13,4 per cent in May 2012, before falling back to 12,6 per cent in June and 12,4 per cent in July. Growth in the deposit holdings of the corporate sector moderated to 3,8 per cent in May, but rebounded to 6,7 per cent in July.
4 Amendments to the BA 900 survey became effective in January 2012 and had a moderate impact on the historical comparability of data. The essential underlying trends in the data remain unchanged.
5 The quarter-to-quarter growth rates referred to in this section are based on seasonally adjusted and annualised data.

Quarterly Bulletin September 201238
-100
-50
0
50
100
150
200
Maturity analysis of growth in money supply
R billions
Half-yearly data
2007 2008 2009 2010 2011 2012
QB3-2012MB02
Notes and coin Call and overnight deposits Long-term deposits**
* Unexpired maturities of more than one day and up to six months, and savings deposits** Unexpired maturities of more than six months
Cheque and transmission deposits Other short- and medium-term deposits*
Growth in M3 deposits during the second quarter of 2012 was weighed down by a slackening in the deposit holdings of the non-financial corporate sector, which may have been drained by rising tax payments. Year-on-year growth in the deposits of non-financial companies decelerated from 12,5 per cent in March 2012 to 9,9 per cent in April, before recovering to 12,6 per cent in July. Growth in the deposit holdings of financial companies continued at a sluggish pace to reach an all-time low negative 0,8 per cent in May 2012, before turning to positive growth in June and July.
QB3-2012MB03
HouseholdsCompanies
Financial companiesNon-financial companies
Percentage change over twelve months
M3 deposit holdings of households and companies
2007 2008 2009 2010 2011 2012
-10
0
10
20
30
40
-10
0
10
20
30
40
50

39Quarterly Bulletin September 2012
In a statistical sense, net foreign assets made the largest contribution to the expansion in M3 during the second quarter of 2012, supported by claims on the private sector. The increase in net foreign assets was brought about by an increase in foreign currency loans and advances, and loans granted under resale agreements to the foreign sector. Claims on the private sector were driven by continued growth in loans and advances. Net claims on the government sector declined, primarily as a result of an increase in government deposits, aided by corporate income tax collections that fell due during the period.
Statistical counterparts of change in M3
R billions
2011 2012
3rd qr 4th qr 1st qr 2nd qr
Net foreign assets ................................................ 16,9 25,3 -23,4 37,6
Net claims on the government sector ................... 26,8 -12,9 -5,6 -16,7
Claims on the private sector ................................. 60,6 37,0 74,1 12,0
Net other assets and liabilities .............................. -28,1 27,4 -77,6 -7,2
Total change in M3 .............................................. 76,3 76,9 -31,7 25,7
The income velocity of circulation of M3 increased from 1,38 in the first two quarters of 2011 to 1,39 in the third quarter and remained at this level until the first quarter of 2012 as money supply growth kept pace with growth in nominal gross domestic product. The income velocity increased to 1,41 in the second quarter of 2012 when growth in nominal gross domestic product exceeded growth in money supply.
Credit extensionAfter displaying firm growth in the opening months of 2012, twelve-month growth in banks’ total loans and advances extended to the private sector became more hesitant in the second quarter of 2012 and retreated from a three-year high of 9,2 per cent in March 2012 to 8,1 per cent and 7,3 per cent in June and July respectively. A deterioration in demand conditions during the second quarter of 2012, coupled with a slower pace of growth in domestic industrial output, eroded business confidence and resulted in some unwinding of working capital-induced credit demand by the corporate sector. However, growth in credit extended to the household sector recorded a steady increase during the second quarter, as general loans gained favour alongside instalment sale finance.
-5
0
5
10
15
20
25
30
35
Total loans and advances to the private sector
Percentage change
2007 2008 2009 2011 20122010
Quarterly at seasonally adjusted annualised rates Over twelve months
QB3-2012MB04

Quarterly Bulletin September 201240
The slower pace of growth in credit extension to the private sector was also reflected in the quarter-to-quarter and seasonally adjusted annualised growth which came to 7,2 per cent in the second quarter of 2012, considerably lower than the 11,9 per cent recorded in the first quarter. Despite the moderation, the quarterly growth still exceeded the growth rates recorded during 2011.
The category for other loans and advances, which accounted for most of the growth in total loans and advances over the preceding three quarters, contributed negatively towards growth in credit extension in the second quarter of 2012, largely offsetting the positive contributions made by instalment sale credit and leasing finance and mortgage advances.
Quarterly changes in banks’ total loans and advances by type
R billions
2011 2012 Composition, June 2012
4th qr 1st qr 2nd qrPercentage
of total
Household sector
Instalment sale credit and leasing finance ................. 7,0 5,0 6,4 8,7
Mortgage advances .................................................. 3,8 9,2 4,4 36,5
Other loans and advances ........................................ 16,8 13,9 12,8 11,8
Total loans and advances to the household sector ... 27,6 28,2 23,6 57,0
Corporate sector
Instalment sale credit and leasing finance ................. 1,0 1,6 2,2 3,9
Mortgage advances .................................................. 0,3 -4,6 2,6 13,7
Other loans and advances ........................................ 15,8 47,1 -28,1 25,4
Total loans and advances to the corporate sector .... 17,1 44,1 -23,4 43,0
Total loans and advances to the private sector ...... 44,7 72,2 0,2 100,0
Twelve-month growth in instalment sale credit and leasing finance gained further traction in the first half of the year, largely on account of continued growth in the instalment sale credit category. Growth in instalment sale credit continued to benefit from lively consumer demand for motor vehicles and other durables in an environment of low interest rates. Leasing finance, however, remained the least-favoured form of credit and has been recording negative rates of growth since late 2007.
0
3
6
9
12
15
Instalment sale credit and leasing �nance, and vehicle sales
R billions Number (thousands)
0
10
20
30
40
50
60
2007 2008 2009 2010 2011 2012
New business payouts for instalment sale credit and leasing finance NAAMSA: Total new vehicle sales (right-hand scale)Seasonally adjusted
QB3-2012MB17

41Quarterly Bulletin September 2012
Measured over twelve months, growth in aggregate instalment sale credit and leasing finance accelerated further from 8,4 per cent in April to 10,0 per cent in June and 10,3 per cent in July, equalling growth rates last recorded in 2008.
Although mortgage advances made a positive contribution towards the overall growth in credit extension during the second quarter of 2012, the sluggish pace of growth observed during the first quarter of 2012 continued into the second quarter. Year-on-year growth in mortgage advances, traditionally the largest contributor to private-sector credit, has been fluctuating around the 2 per cent level since August 2011, alongside sluggish demand conditions in the property market. In July 2012 growth came to 1,9 per cent. Capital repayments on existing mortgage bonds continued to exceed new loans paid out, contributing to the moderation in growth in mortgage advances in recent months.
-5
0
5
10
15
20
25
30
35
40
House prices, residential buildings completed and mortgage advances
Percentage change over twelve months Index: 2005 = 100
60
90
120
150
2007 2008 2009 2010 2011 2012
Absa House Price Index Mortgage advances Smoothed* real value of residential buildings completed (right-hand scale)
* Henderson 13-term moving average
QB3-2012MB16
A sharp decline in growth of general loans to the corporate sector contributed towards a significant slowdown in the category for other loans and advances in the second quarter of 2012. By contrast, general loans to the household sector recorded strong growth in the second quarter of 2012, buoyed by the low interest rate environment; easier lending requirements; the extension of maximum loan repayment terms on general loans by some niche banks; and the active promotion of these types of loans. General loans constitute the bulk of unsecured credit to the household sector; its twelve-month growth eased during the first half of 2012 and levelled out at 30 per cent from April to June before increasing to 32,8 per cent in July. Measured over twelve months, growth in other loans and advances receded from a recent high of 19,6 per cent in March 2012 to 14,2 per cent in July. Within the other two sub-components of other loans and advances, twelve-month growth in credit card advances remained firm in the second quarter of the year, accelerating from 12,0 per cent in March 2012 to 14,4 per cent in July. Growth in bank overdrafts was somewhat volatile during this period, receding from 12,7 per cent in April to 9,3 per cent in May, before rebounding to 14,3 per cent in July.
Banks’ loans and advances to the household sector, which account for approximately 57 per cent of total outstanding loans and advances, continued to improve and surpassed the twelve-month growth in credit extension to the corporate sector in the second quarter of 2012. Year-on-year growth in credit extension to households increased from 7,2 per cent in April to 8,1 per cent in July 2012.

Quarterly Bulletin September 201242
Quarterly changes in other loans and advances by type
R billions
2011 2012
3rd qr 4th qr 1st qr 2nd qr
Household sector
Overdrafts ...................................................................... -1,0 1,0 2,5 -0,7
General loans ................................................................. 3,4 13,9 9,2 11,2
Credit card advances ..................................................... 1,1 1,9 2,3 2,4
Other loans and advances to the household sector ........ 3,5 16,8 13,9 12,8
Corporate sector
Overdrafts ...................................................................... 1,4 5,0 21,6 -8,6
General loans ................................................................. 30,3 11,0 25,3 -19,8
Credit card advances ..................................................... 0,0 -0,1 0,2 0,3
Other loans and advances to the corporate sector ......... 31,7 15,8 47,1 -28,1
Total other loans and advances to the private sector .... 35,2 32,6 61,1 -15,3
The sturdy growth in credit extension to the corporate sector observed during the first quarter of 2012 reversed in the second quarter of the year as companies probably abstained from borrowing amid global uncertainty and sluggish domestic demand conditions. Alternative forms of financing available to companies, such as the issuance of debt securities in a favourable interest rate environment, probably also contributed to the weak demand for bank credit. Measured over twelve months, growth in loans and advances to the corporate sector fell from a recent high of 12,2 per cent in March 2012 to 6,2 per cent in July.
Interest rates and yields With the policy interest rate having been kept unchanged for 20 months, the Monetary Policy Committee (MPC) of the Bank lowered the repurchase rate by 50 basis points to 5,0 per cent from 20 July 2012. This has brought the policy rate to its lowest level since early 1980. The more accommodative policy stance was brought about by concerns about continued slack in the domestic economy, aggravated by the protracted problems in the euro area, and their possible knock-on effects.
Targeted in�ation and the repurchase rate
Per cent
2
3
4
5
6
7
8
2011 2012 2013 20142010
Targeted inflation Repurchase rate
Upper inflation target limit
Lower inflation target limit
Forecast values for 2013 and 2014: South African Reserve Bank’s inflation forecast (July 2012) Bureau for Economic Research inflation expectations (second quarter 2012 survey) Reuters forecast (July 2012 )
QB3-2012MB06

43Quarterly Bulletin September 2012
The MPC viewed the prevailing conditions as being appropriate for further monetary accommodation, and felt that it would not undermine the domestic inflation outlook. The risks to the inflation forecast were seen to be relatively balanced, with inflation expected to remain within the target range over the forecast period. The Reuters consensus inflation forecast reflected broadly similar expectations, while inflation expectations surveyed by the BER reflected expectations slightly outside the target range over the next two years. The MPC statement discussing developments underlying recent monetary policy decisions is reproduced in full from page 65 of this Bulletin.
Short-term money-market rates generally followed the reduced repurchase rate and declined across all maturities. The three-month Johannesburg Interbank Agreed Rate (Jibar), which stood at 5,58 per cent just before the MPC meeting in July 2012, for example, declined by 50 basis points to 5,08 per cent and remained at this level to the end of August. Similarly, the twelve-month Jibar, which displayed a downward bias during the second quarter of 2012, declined by a further 48 basis points from 5,88 per cent on 19 July 2012 to 5,40 per cent on 24 July 2012. The rate increased somewhat to 5,44 per cent on 31 August 2012. The tender rate on 91-day Treasury bills also moved lower from its narrow range of between of 5,55 and 5,59 per cent in the second quarter of 2012, tracking the downward movement in the repurchase rate and stabilising close to 5,0 per cent in late August.
4,8
5,0
5,2
5,4
5,6
5,8
6,0
6,2
6,4
6,6
6,8
Money-market rates
Per cent
QB3-2012MB08
Jan Mar JulMay Sep Jan Mar JulMay SepNovSep Nov20112010 2012
Repurchase rate3-month Jibar12-month Jibar91-day Treasury bills
Amid renewed global uncertainties and lower-than-expected domestic inflation outcomes, forward rate agreements (FRAs) started to follow a persistent downward trend during the second quarter of 2012, reversing some of the increases encountered during the first quarter. The 9x12-month FRA initially trended down from a recent high of 6,05 per cent on 20 March 2012 to 5,18 per cent on 19 July 2012 before declining more abruptly to a historical low of 4,69 per cent shortly after the reduction in the repurchase rate. The rate fluctuated moderately higher to 4,80 per cent on 31 August 2012.
The downward trend in forward rates before the reduction in the repurchase rate shows that some market participants anticipated the possibility of further monetary policy accommodation in the medium term, contrary to the predominant surveyed market view of unchanged interest rates. After the reduction in the policy rate, the FRA yield curve flattened somewhat, implying that interest rates were expected to remain at current levels for the medium term, before picking up gradually thereafter.

Quarterly Bulletin September 201244
Interest rate expectations
Per cent
4,0
4,5
5,0
5,5
6,0
6,5
2nd qr 3rd qr 4th qr 2nd qr 3rd qr 4th qr1st qr 1st qr2012 2013 2014
FRAs: end-June FRAs: end-July Reuters (median) June survey Reuters (median) July survey
QB3-2012MB10
Consistent with the orderly conditions that prevailed in the interbank market, the South African Benchmark Overnight Rate on Deposits (Sabor) and the implied rate on one-day rand funding in the foreign-exchange swap market (overnight FX rate) remained fairly stable and fluctuated well within the standing facility limits during the second quarter of 2012. The overnight FX rate fluctuated moderately higher from 5,33 per cent on 23 April 2012 to 5,77 per cent on 2 July, before adjusting lower in response to the change in the repurchase rate. On 31 August the rate stood at 5,14 per cent. The Sabor rate, which has remained anchored around 5,29 per cent for most of the first half of 2012, declined to a historical low of 4,80 per cent on 28 July 2012 before increasing moderately to 4,81 per cent on 31 August 2012.
Alongside the reduction in the repurchase rate on 20 July 2012, the predominant rate on mortgage loans declined by 50 basis points to 8,50 per cent, recording its lowest level since early 1974. Lending rates offered by banks generally declined in July in concert with the reduction in the repurchase rate.
After remaining constant for twenty months reflecting the unchanged repurchase rate, most of the interest rates prescribed in terms of the National Credit Act decreased on 20 July 2012, as indicated in the following table:
National Credit Act maximum interest rates: Changes on 20 July 2012
Per cent
Maximum rate per annum
Category From 19 Nov 2010 to 19 Jul 2012
As from 20 Jul 2012
Mortgage agreements ............................................. 17,1 16,0
Credit facilities ......................................................... 22,1 21,0
Unsecured credit transactions ................................. 32,1 31,0
Developmental credit agreements:
For the development of a small business .............. 32,1 31,0
For low-income housing (unsecured) ..................... 32,1 31,0
Short-term credit transactions ................................. 60,0 60,0
Other credit agreements .......................................... 22,1 21,0
Incidental credit agreements .................................... 24,0 24,0

45Quarterly Bulletin September 2012
Similarly, the official rate of interest applicable to fringe benefit taxation, as defined in the Income Tax Act, declined from 6,5 per cent to 6,0 per cent on 1 August 2012.
In line with lower government bond yields, interest rates on the RSA government fixed-rate retail bonds were lowered twice thus far in 2012, as shown in the accompanying table. The amount in issue for all retail bonds increased at a somewhat slower pace compared with the corresponding period of 2011, rising by R0,8 billion in the first half of 2012 to reach R11,8 billion at the end of June.
Interest rates on fixed-rate RSA government retail bonds
Per cent
Effective from: 2-year bond 3-year bond 5-year bond
1 Sep 2011 ............................................................. 7,25 7,50 8,00
1 May 2012 ............................................................. 6,75 7,00 7,50
1 Aug 2012 ............................................................. 6,00 6,50 7,00
Despite the depreciation in the exchange value of the rand and large government bond issuances, South African bond yields declined to a 47-year low in 2012. For instance, the daily average yield on the R157 government bond (maturing in 2014/15/16) declined from a recent high of 7,09 per cent on 25 November 2011 to 5,45 per cent on 31 August 2012. This was in response to the firm demand for local bonds by non-residents, the approaching inclusion of South African government bonds in the Citigroup World Government Bond Index (WGBI), the release of better-than-expected inflation data and the recent reduction in the repurchase rate. The noticeable decline in nominal yields, and to a lesser extent the decline in real yields, resulted in lower break-even inflation rates across all maturities to below the 6 per cent level – indicating a more encouraging inflation outlook.
Per cent
Nominal
Real: Inflation-linked bonds
Government bond yields
R157 (3-year) R186 (14-year) R209 (24-year)
R197 (11-year) R202 (21-year)
2007 2008 2009 2010 2011 2012
QB3-2012CMFF01
4
6
8
10
12
1,0
1,5
2,0
2,5
3,0
3,5

Quarterly Bulletin September 201246
Given the significant decline in bond yields, the level of the yield curve moved lower across all maturities during the first eight months of 2012. The extreme short end of the curve dropped off along with the bond switching exercise of the National Treasury and the reduction in the repurchase rate, with bond yields in the medium-term category declining more pronouncedly than longer-term bond yields. The yield gap, computed as the difference between the yields at the extreme long and short ends of the curve, narrowed from 379 basis points on 14 December 2011 to 330 basis points on 31 August 2012.
Yield curve
QB3-2012CMFF02
3025201510504
5
6
7
8
9
10Per cent
14 December 2011
31 August 2012
Unexpired maturity in years
The JPMorgan Emerging Markets Bond Index Plus (EMBI+)6 yield spread above US government bonds widened from 319 basis points in March 2012 to 419 basis points in May as volatility in global financial markets manifested, before narrowing to 325 basis points in July. The sovereign risk premium on South African government US dollar-denominated bonds in the two-year maturity range trading in international markets narrowed from 182 basis points in November 2011 to 77 basis points in July 2012, reflecting robust investor demand for these South African bonds.
Together with increased demand, the currency risk premium7 on South African government bonds first widened from 435 basis points in October 2011 to 514 basis points in May 2012 as the yield on the US dollar-denominated South African bond declined more pronouncedly than the yield on the rand-denominated South African bond. Subsequently, the yield on rand-denominated South African bonds declined more decidedly, resulting in a narrowing in the currency risk premium to 451 basis points in July.
Money marketDuring the second quarter of 2012 and ensuing two months to August 2012, the actual daily liquidity requirement of the private-sector banks varied within a broad range of between R4,1 billion and R25,6 billion, wider than the estimated liquidity requirement, which oscillated between R10,5 billion and R21,7 billion. Large deviations in the actual daily liquidity requirement during the second quarter of 2012 were mainly concentrated at the end of reserve maintenance periods where private-sector banks are obliged to satisfy, on average, their statutory cash reserve requirements. During the stated period, banks are allowed to hold reserves that are either below or above the minimum reserve requirement for liquidity management purposes, as long as their average holdings meet the required level. The length of the maintenance period in South Africa is one full month, calculated from the 15th calendar day of the preceding month to the 14th calendar day of the following month.
6 EMBI+ measures total returns on US dollar-denominated debt instruments of emerging-market economies.
7 The differential between South African government bond yields on rand-denominated debt issued in the domestic market and on dollar-denominated debt issued in the US in the two-to-three-year maturity range.
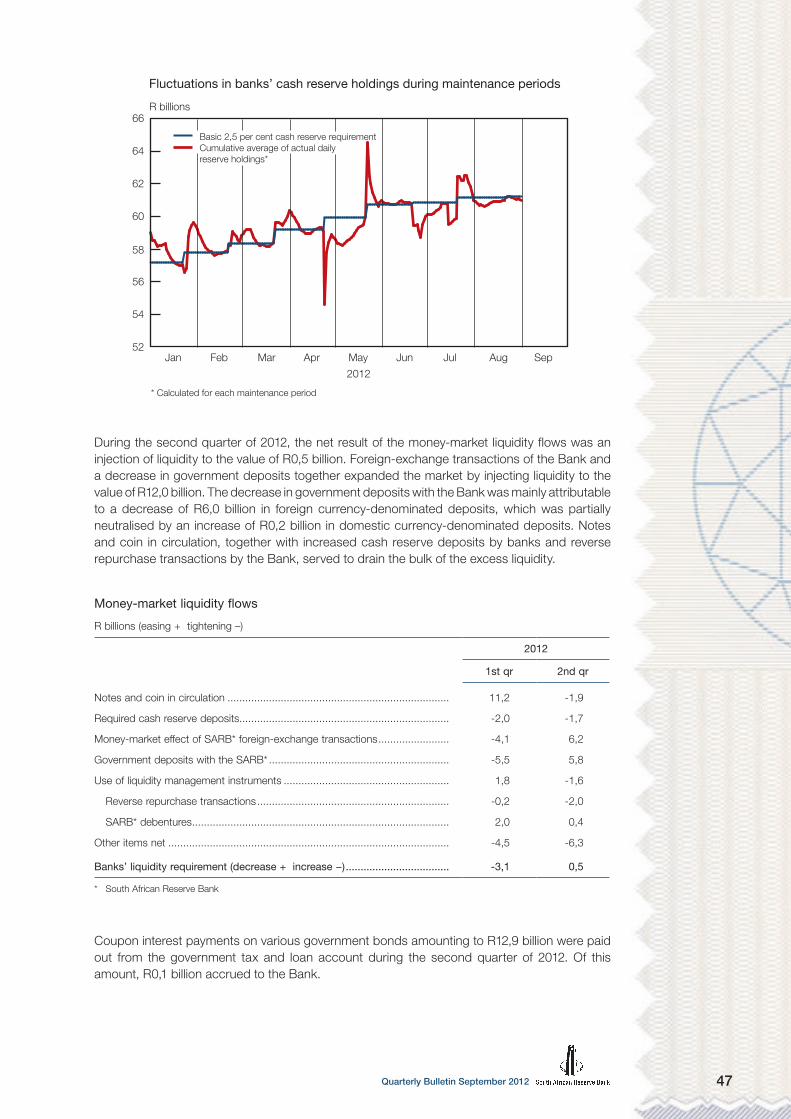
47Quarterly Bulletin September 2012
52
54
56
58
60
62
64
66
Fluctuations in banks’ cash reserve holdings during maintenance periods
R billions
Jan Feb Mar Apr May Jun Jul Aug Sep
2012
Basic 2,5 per cent cash reserve requirement Cumulative average of actual daily reserve holdings*
* Calculated for each maintenance period
QB3-2012MB13
During the second quarter of 2012, the net result of the money-market liquidity flows was an injection of liquidity to the value of R0,5 billion. Foreign-exchange transactions of the Bank and a decrease in government deposits together expanded the market by injecting liquidity to the value of R12,0 billion. The decrease in government deposits with the Bank was mainly attributable to a decrease of R6,0 billion in foreign currency-denominated deposits, which was partially neutralised by an increase of R0,2 billion in domestic currency-denominated deposits. Notes and coin in circulation, together with increased cash reserve deposits by banks and reverse repurchase transactions by the Bank, served to drain the bulk of the excess liquidity.
Money-market liquidity flows
R billions (easing + tightening –)
2012
1st qr 2nd qr
Notes and coin in circulation ........................................................................... 11,2 -1,9
Required cash reserve deposits....................................................................... -2,0 -1,7
Money-market effect of SARB* foreign-exchange transactions ........................ -4,1 6,2
Government deposits with the SARB* ............................................................. -5,5 5,8
Use of liquidity management instruments ........................................................ 1,8 -1,6
Reverse repurchase transactions ................................................................. -0,2 -2,0
SARB* debentures ....................................................................................... 2,0 0,4
Other items net ............................................................................................... -4,5 -6,3
Banks’ liquidity requirement (decrease + increase −) ................................... -3,1 0,5
* South African Reserve Bank
Coupon interest payments on various government bonds amounting to R12,9 billion were paid out from the government tax and loan account during the second quarter of 2012. Of this amount, R0,1 billion accrued to the Bank.

Quarterly Bulletin September 201248
Bond marketActivity in the primary bond market was robust in the first seven months of 2012, dominated by public-sector issuances. Net issues of R107 billion were made by the public sector in this period, with the national government accounting for the bulk of the funding activity. Issuances by the private sector also progressed – especially issuances by financial companies – and amounted to R58,5 billion over the same period. The total outstanding nominal value of debt securities listed on the JSE Limited (JSE) increased by R163 billion in the seven months to July 2012, compared with net issues of R122 billion in the corresponding period of 2011, bringing the amount outstanding to R1,5 trillion at the end of July 2012.
After Eskom and Transnet raised funds from international bond markets in the first quarter of 2011, a long spell elapsed before Transnet again utilised the international bond markets for funding when it issued a US$1 billion ten-year bond with a coupon rate of 4,0 per cent in the United States in July 2012.
Trading activity in the secondary bond market remained brisk in 2012, alongside lower bond yields and higher volumes traded. Turnover of R15,1 trillion in the first seven months of 2012 or R103 billion per trading day was approximately 20 per cent more than in the corresponding period of 2011. Repurchase agreements accounted for 67 per cent and standard transactions for 32 per cent of the total value traded thus far in 2012.
Turnover in the secondary bond market by trade type
QB3-2012CMFF03
0
400
800
1 200
1 600
2 000
2 400
2 800
2007 20102009 2011 20122008
Repurchase agreement Free of value
StandardOption exercised and structured deal
R billions
Interest in rand-denominated bond issuances in the European bond markets was somewhat adversely affected by the continued concerns over the eurozone debt crisis. This was noticeable from the net redemptions of R1,3 billion recorded in the first seven months of 2012, compared with net issues of R5,5 billion registered in the same period of 2011. The issuance of rand-denominated bonds by non-residents in the Japanese Uridashi bond market, however, remained positive with net issues of R1,9 billion recorded in the seven months to July 2012, as indicated in the accompanying table.
Rand-denominated bonds issued in international bond markets, January to July
R millions
Eurorand Uridashi Total
2011 2012 2011 2012 2011 2012
Issues ................................................ 9 432 5 511 5 046 7 892 14 478 13 403
Redemptions ..................................... 3 930 6 775 6 488 6 017 10 418 12 792
Net .................................................... 5 502 -1 264 -1 442 1 875 4 060 611

49Quarterly Bulletin September 2012
Non-resident investors continued to show keen interest in the South African secondary bond market thus far in 2012, boosted by the inclusion of local government bonds in the Citigroup WGBI. Interest was exhibited in both the first and second quarters of 2012, when net purchases of respectively R20,6 billion and R28,6 billion were recorded. Non-residents increased their holdings of local debt securities by a further R12,5 billion in July, reflecting their search for yield and the change in risk sentiment. This brought cumulative net purchases of local bonds by non-residents in the first seven months of 2012 to R61,7 billion – higher than the net purchases recorded in the full year 2011.
Share marketIn June 2012 a significant amount of equity capital was raised by a resources company – with a primary listing on a foreign bourse – through the waiver of pre-emptive rights. Nevertheless, the equity capital raised by companies listed on the JSE in the domestic and international primary share markets of R46,5 billion in the first seven months of 2012 was still 22 per cent lower than the amount raised in the corresponding period of 2011. This was amid the lowering of economic growth projections for South Africa by some forecasting agencies, and constrained consumer and business confidence. The resources sector accounted for the lion’s share at 43 per cent of total funds raised thus far in 2012 and the preferred method of raising capital was through the waiver of pre-emptive rights to the amount of R27,5 billion over the same period.
The turnover in the secondary share market of the JSE at R2,0 trillion or R13,7 billion per day in the first seven months of 2012 was approximately 9 per cent higher when compared with the same period of 2011. Price effects dominated the increase in turnover as share prices were on average 6 per cent higher over the same period. This was despite the dwindling contribution by non-residents to total turnover from a 30 per cent participation rate in the 1990s to an average of 15 per cent in 2011 and thus far in 2012. In conjunction with soaring share prices the total market capitalisation of the JSE rocketed to an all-time high of R7,5 trillion in July 2012, representing an increase of 9 per cent thus far in 2012.
Turnover in the secondary share market
QB3-2012CMFF04
0
50
100
150
200
250
300
350
2007 20102009 2011 20122008
R billions Per cent
0
5
10
15
20
25
Total turnover Non-residents' participation rate (right-hand scale)
Aligned with global risk aversion due to concerns over global growth and the eurozone crisis, non-residents were net sellers of local shares to the value of R4,1 billion in the first quarter of 2012. Subsequently, non-residents increased their purchases of local shares which contributed to net purchases of R3,2 billion in the second quarter, before reverting to net sales of R0,7 billion in July.

Quarterly Bulletin September 201250
South African share prices remained at elevated levels in 2012. The FTSE/JSE All-Share Price Index (Alsi) increased by 26 per cent from a recent low of 28 391 index points on 8 August 2011 to a new all-time high of 35 898 index points on 27 August 2012. The Alsi was bolstered by rising company profits, higher international equity prices, as well as expectations that European leaders would reach an agreement to help the struggling European banks and thereby contain the crisis. Thereafter, the Alsi declined marginally by 1 per cent to 35 389 index points on 31 August.
A concern from the markets remains the ongoing eurozone debt crisis, reflected for instance in the downward revision by a rating agency of the outlook for the triple–A rated government bonds of Germany, Netherlands and Luxembourg from stable to negative in July 2012. It was further worsened by fears that Spain might need a formal bailout and the negative influence of suspending short-selling of their shares for three months by the Spanish market regulator. The domestic share price increase was more pronounced in local currency terms, in US dollar terms the Alsi increased only by 2 per cent from 8 August 2011 to 31 August 2012, while the Standard & Poor’s (S&P) 500 Composite Index rose strongly by 26 per cent during the same period. The Euro Stoxx 50 Index in US dollars, on the other hand, registered a decline of 7 per cent from 8 August 2011 to 31 August 2012.
Share prices in US dollar
Indices
QB3-2012CMFF05
500
1 000
1 500
2 000
1 000
2 000
3 000
4 000
5 000
6 000
7 000
2007 2008 2009 2010 2011 2012
S&P 500 Composite Index (right-hand scale)
Euro Stoxx 50 Index
FTSE/JSE All-Share Price Index
Market for exchange-traded derivativesThe JSE announced in July 2012 a further expansion of its foreign-referenced commodity product range to include Quanto contracts on crude oil, copper and gold. These products will provide market participants with the flexibility of accessing international commodity markets while trading the contracts in local currency, thus buffering participants against exchange rate fluctuations.
Trading activity in commodity futures and options contracts on the Commodity Derivatives Division of the JSE reached a recent monthly high in July 2012 – the highest level since June 2008 – which contributed to an increase of 25 per cent in the number and 46 per cent in the value of contracts traded in the first seven months of 2012 compared with the corresponding period of 2011. This was alongside the solid increase in monthly average grain prices recently, which followed the depreciation in the exchange value of the rand and higher international grain prices on the back of mounting supply concerns over drought conditions in the US.

51Quarterly Bulletin September 2012
Agricultural commodity prices
Rand per ton
QB3-2012CMFF06
0
1 000
2 000
3 000
4 000
5 000
6 000
7 000
2007 2008 2009 2010 2011
White maizeSunflower seedInternational maize price (Chicago Boardof Trade)
WheatSoya beansInternational wheat price (US Hard Red Winter)
Trade in currency futures and options contracts buoyed trading activity on the Yield-X market of the JSE in 2012. The increased trade followed the introduction of Chinese yuan/rand currency contracts and new Can-Do options contracts, as the JSE continued to provide flexibility and portfolio diversification to investors trading in the volatile foreign-exchange market. Robust trading activity brought the total number of contracts traded on Yield-X during the first seven months of 2012 to 10,2 million, some 34 per cent higher than the 7,6 million contracts traded in the corresponding period of 2011. Turnover in all derivatives traded on the JSE during the first seven months of 2012 is indicated in the table below.
Derivatives turnover on the JSE, January to July 2012
Type of derivative Value(R billions)
Change over one year(Per cent)
Equity futures and options on futures .................................................... 2 364 3
Warrants ................................................................................................ 0,4 -33
Commodity futures and options ............................................................ 286 46
Interest rate derivatives .......................................................................... 211 91
Currency derivatives .............................................................................. 67 27
Real-estate marketThe three house price barometers depicted in the graph at the top of page 52 are now in positive territory. However, price increases remained subdued, reflecting fairly sluggish economic growth, lower transaction volumes in the residential property market and very little growth in mortgage finance – impacted by poor demand for such credit on account of both demand and supply dynamics in the credit market. After declining by 20 per cent in 2010, the nominal value of residential buildings completed recorded a year-on-year increase of 2 per cent in 2011 and 5 per cent in the first half of 2012.

Quarterly Bulletin September 201252
House prices and residential buildings completed
Three-month moving average of monthly percentage changes R billions
QB3-2012CMFF07
2007 2008 2009 2010 2011 2012-1,5
-1,0
-0,5
0,0
0,5
1,0
1,5
2,0
2,5
3,0
3,5
-1,5
-1,0
-0,5
0,0
0,5
1,0
1,5
2,0
2,5
3,0
3,5
Absa house prices Lightstone house prices
First National Bank house prices Value of residential buildings completed (right-hand scale)
Non-bank financial intermediariesGross inflows8 to non-bank financial institutions9 increased by 10 per cent from the second quarter of 2011 to R364 billion in the second quarter of 2012, alongside an improvement in economic activity and disposable income of households. Gross inflows into longer-term saving vehicles, namely life insurers and retirement funds, rose by 13 per cent to R163 billion during the same period, as higher wages and the recovery in employment levels supported premiums and contributions received. Buoyed by an increase in inflows to retail funds, the gross sales by unit trusts grew by 8 per cent from the second quarter of 2011 to R201 billion in the second quarter of 2012. Investment income accruing to these intermediaries picked up notably over this period.
Non-bank financial intermediaries’ financial flows
R billions
QB3-2012CMFF08
2007 2008 2009 2010 2011 2012150
200
250
300
350
400
Gross inflows
Gross outflows
Gross outflows10 recorded by these institutions grew at a brisk pace of 11 per cent from the second quarter of 2011 to R317 billion in the second quarter of 2012. Large outflows were particularly registered in the unit trusts industry, where investors reduced holdings of money-market funds in favour of higher-yielding asset classes. Benefits paid by the retirement funds remained high as members continued to withdraw their pension benefits. Insurance policies surrendered ticked up slightly over the same period.
8 Consisting of investment income, contributions from pension and provident funds, insurance premiums, and sales of units by unit trusts.
9 Include insurers, pension and provident funds, and unit trusts.
10 Consisting of benefits and claims paid, surrenders, repurchases of units and administrative expenses.

53Quarterly Bulletin September 2012
Estimated funds available for investment, measured as the difference between gross inflows and outflows, amounted to R46,6 billion in the second quarter of 2012, contributing to a cumulative R84,3 billion in the first half of the year. The bulk of these funds was invested in domestic fixed-interest instruments.
Flow of fundsThe non-resident sector’s inflows into the domestic economy increased as a higher net lending position of R42,8 billion was recorded in the first quarter of 2012 compared with R21,4 billion in the final quarter of 2011. Most of the inflows in the first quarter of 2012 were used to acquire debt securities which amounted to R34,0 billion, including the January 2012 international bond issue by the South African government equivalent to R11,7 billion. Equity purchases by non-residents amounted to R2,7 billion during the first quarter of 2012. Although this injection of funds by non-residents helped to finance domestic economic activity, it also created future commitments in the form of interest payments.
The pace of intermediation by financial institutions slowed to R81,5 billion in the first quarter of 2012, due to a decline in contractual savings and deposits. As a share of total flows, this intermediation accounted for 26 per cent in the first quarter of 2012, after recording 39 per cent in the fourth quarter of 2011. As an intermediation instrument loans increased significantly, not least due to the unabating demand for unsecured loans, while fixed-interest securities declined. Similarly, mortgage loans extended continued to wane for the fourth consecutive quarter during the period under review.
Financial intermediation by instrument
QB3-2012CMFF09
-100
-50
0
50
100
150
200
250
300
Loans Equity Fixed-income securities
R billions
2008 2009 20102007 2011 2012
During the first quarter of 2012 the general government sector recorded a net borrowing position of R34,5 billion, which was higher than the R21,3 billion registered in the fourth quarter of 2011. This deficit was due to increased capital spending related to bulk water and electricity provision. The general government sector met the shortfall by issuing mainly bonds amounting to R36,9 billion locally and a long-term bond equivalent to R11,7 billion internationally. Bond issuances were taken up by a wide range of entities, including insurers and pension funds, banks, other financial institutions and non-residents.
The corporate business sector continued to invest in infrastructure during the first quarter of 2012, adding R115 billion to the economy’s existing stock. The public business enterprises’ capital spending increased by 3 per cent to R34,5 billion from the amount recorded in the final quarter of 2011, with their investment mainly concentrated in the transport and electricity sectors. State-owned enterprises funded such spending through the incurrence of loans, issuance of bonds and reduction of cash and deposits during the review period.

Quarterly Bulletin September 201254
Capital investment by corporate private business enterprises increased by 6 per cent to R80,3 billion during the first quarter of 2012. Their net lending position increased from R11,6 billion in the fourth quarter of 2011 to R15,8 billion in the first quarter of 2012. Corporate private business enterprises also increased their net acquisition of financial assets by R31,8 billion during the review period.
The household sector recorded a net borrowing position for the second consecutive quarter, as borrowing activity improved steadily during the first quarter of 2012. Total borrowing recorded by the sector amounted to R30,9 billion during the first quarter of 2012, in line with the amount incurred during the fourth quarter of 2011. Despite the improved credit demand, the rate of increase in mortgage borrowing remained subdued amid weakness in the residential property market. Parallel to this, the households’ interest in retirement and life funds slowed to R12,7 billion and their cash and deposit holdings to R7,6 billion.
Households’ accumulation of assets by type of instrument
R billions
QB3-2012CMFF10
2007 2008 2009 2010 2011 2012-5
0
5
10
15
20
25
30
35
40
Interest in retirement and life funds
Monetary deposits
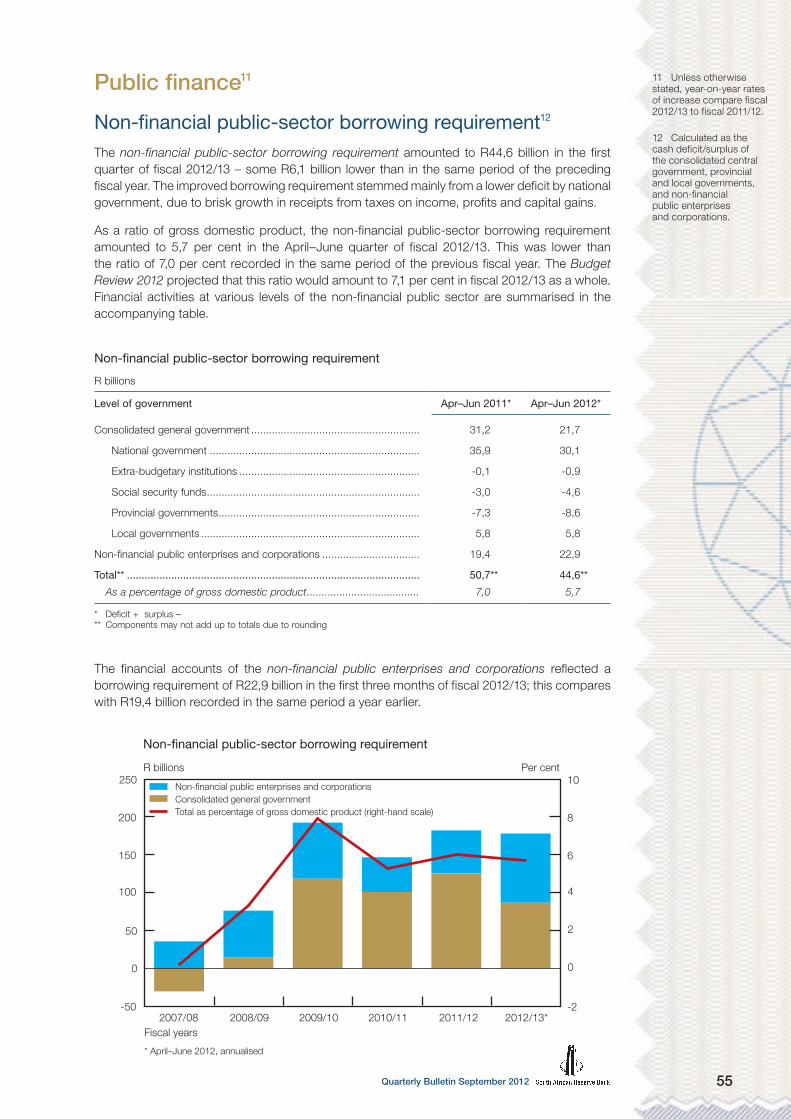
55Quarterly Bulletin September 2012
Public finance11
Non-financial public-sector borrowing requirement12
The non-financial public-sector borrowing requirement amounted to R44,6 billion in the first quarter of fiscal 2012/13 – some R6,1 billion lower than in the same period of the preceding fiscal year. The improved borrowing requirement stemmed mainly from a lower deficit by national government, due to brisk growth in receipts from taxes on income, profits and capital gains.
As a ratio of gross domestic product, the non-financial public-sector borrowing requirement amounted to 5,7 per cent in the April–June quarter of fiscal 2012/13. This was lower than the ratio of 7,0 per cent recorded in the same period of the previous fiscal year. The Budget Review 2012 projected that this ratio would amount to 7,1 per cent in fiscal 2012/13 as a whole. Financial activities at various levels of the non-financial public sector are summarised in the accompanying table.
Non-financial public-sector borrowing requirement
R billions
Level of government Apr–Jun 2011* Apr–Jun 2012*
Consolidated general government ......................................................... 31,2 21,7
National government ....................................................................... 35,9 30,1
Extra-budgetary institutions ............................................................. -0,1 -0,9
Social security funds ........................................................................ -3,0 -4,6
Provincial governments .................................................................... -7,3 -8,6
Local governments .......................................................................... 5,8 5,8
Non-financial public enterprises and corporations ................................. 19,4 22,9
Total** ................................................................................................... 50,7** 44,6**
As a percentage of gross domestic product ...................................... 7,0 5,7
* Deficit + surplus –** Components may not add up to totals due to rounding
The financial accounts of the non-financial public enterprises and corporations reflected a borrowing requirement of R22,9 billion in the first three months of fiscal 2012/13; this compares with R19,4 billion recorded in the same period a year earlier.
2012/13*2011/122010/112009/102008/092007/08-50
0
50
100
150
200
250
Non-financial public-sector borrowing requirement
R billions Per cent
QB3-2012PF12
Fiscal years
* April–June 2012, annualised
Non-financial public enterprises and corporations Consolidated general government Total as percentage of gross domestic product (right-hand scale)
-2
0
2
4
6
8
10
11 Unless otherwise stated, year-on-year rates of increase compare fiscal 2012/13 to fiscal 2011/12.
12 Calculated as the cash deficit/surplus of the consolidated central government, provincial and local governments, and non-financial public enterprises and corporations.

Quarterly Bulletin September 201256
The Budget Review 2012 projected that the state-owned enterprises would record a deficit of R76,9 billion in fiscal 2012/13 as a whole. No firm conclusions regarding fiscal developments in the remainder of the year should be drawn from the outcome of one quarter, given the quarter-to-quarter volatility of the data. The increase in the borrowing requirement was mainly as a consequence of the intensification in capital spending during the April–June quarter by non-financial public corporations, notably Eskom and Transnet. Financing of the capital spending would be supported by a combination of higher cash flows from increases in tariffs, equity and debt. As a share of gross domestic product, capital spending equalled 3,6 per cent during the period under review. This was slightly lower than the ratio recorded in April–June 2011.
2012/13*2011/122010/112009/102008/092007/080
20
40
60
80
100
120
140
Infrastructure spending by non-financial public enterprises and corporations
R billions Per cent
QB3-2012PF13
Fiscal years
* April–June 2012, annualised
R billions Percentage of gross domestic product (right-hand scale)
0
1
2
3
4
5
During President Jacob Zuma’s announcement in his State of the Nation Address to Parliament in February 2012, it was indicated that Transnet would spend R300 billion in a capital-expansion programme to redirect the transportation of minerals, such as coal, from roads to rail. The state-owned entity has recently secured a US$1 billion ten-year bond. The bond attracted an interest rate of 4,0 per cent, or 262,5 basis points above the 10-year US Treasuries, and was the group’s single largest issuance without a government guarantee. About 70 per cent of the funding for the market demand strategy would be secured from operating cash flows. However, Transnet would still have to raise about R86 billion between now and 2019 to fund the programme.
A review of the national government finance statistics indicated that cash receipts from operating activities increased faster than cash payments for operating activities, thus yielding a smaller cash deficit than in the first quarter of fiscal 2011/12. Cash receipts from operating activities amounted to R195 billion in the first quarter of fiscal 2012/13, or a year-on-year rate of increase of 16,6 per cent. The strong increase in revenue was buoyed by brisk growth in receipts from taxes.
Cash payments for operating activities increased by 10,5 per cent year on year and equalled R223 billion, mainly as a result of grants paid, which accounted for the lion’s share of national government expense. Grants comprised almost two-thirds of national government cash payments for operating activities. The net result of national government receipts and expenditure was a cash deficit of R30,1 billion in the first quarter of the current fiscal year, some R5,8 billion lower than the cash deficit recorded in April–June 2011.
In the April–June quarter of 2012, provincial governments’ financial activities resulted in a cash surplus of R8,6 billion. This was higher than the cash surplus of R7,3 billion recorded in the same period of the preceding fiscal year. The Budget Review 2012 projected that provincial governments would record a cash surplus of R7,4 billion in fiscal 2012/13 as a whole.

57Quarterly Bulletin September 2012
Total provincial revenue, primarily driven by grants from national government, amounted to R98,8 billion during the first quarter of fiscal 2012/13. Provincial grants, comprising equitable share transfers and conditional grants allocated for specific purposes, accounted for about 74,7 per cent of transfers paid by national government and amounted to R96,1 billion in the period under review. These grants increased at a year-on-year rate of 8,4 per cent.
Provincial government expenditure amounted to R90,1 billion in the April–June quarter of fiscal 2012/13, or 7,7 per cent more than in the same period of the previous fiscal year. Pronounced growth in provincial expenditure was driven by personnel costs, which amounted to R54,7 billion. Spending in this category was 8,1 per cent higher when compared with April–June 2011.
At the end of June 2012, the Gautrain Project reached the end of its 69th month of development, indicating that the project had overrun the development period by 15 months. During the first three months of fiscal 2012/13, some R0,4 billion was spent on this project, bringing the total amount spent in the 69 months to R32,1 billion since inception. The Gautrain made its first passenger run to the new Park Station in the Johannesburg central business district on Thursday, 7 June 2012. Including the Gautrain Project spending, net investment in non-financial assets amounted to R6,2 billion in the April–June quarter of 2012, or 12,4 per cent higher when compared with the same period of 2011.
The provincial government surplus resulted in an increase in provincial governments’ deposits with the Corporation for Public Deposits from R6,4 billion at the end of March 2012 to R13,8 billion at the end of June. At the same time, provincial governments’ deposits with private banks decreased from R14,5 billion to R12,7 billion, while their overdrafts from banks increased from R1,1 billion at the end of March 2012 to R2,0 billion at the end of June.
The financial activities of the consolidated local governments during the first quarter of fiscal 2012/13 resulted in a preliminary cash deficit of R5,8 billion. This remained broadly unchanged compared with the same period a year earlier. The levelled cash deficit resulted from strong growth in capital spending and negative growth in operating expense, offset by growth in cash receipts.
Municipal own revenue increased by 12,0 per cent to amount to R43,0 billion, accounting for 90,1 per cent of total local government revenue during the period under review. Sales of electricity and gas, together with property rates received, were the main sources of municipal own revenue, and rose by 12,2 per cent and 19,6 per cent respectively. National government transfers to local government were budgeted to amount to R77,3 billion for fiscal 2012/13 as a whole. The Budget Review 2012 estimated that an amount of R9,0 billion would be transferred from the National Revenue Fund to metropolitan municipalities under the general fuel levy sharing agreement in fiscal 2012/13 as a whole.
Cash paid for operating activities of local governments amounted to R42,3 billion during April–June 2012. Compared with a year earlier, both compensation of employees and amounts paid for bulk purchases of water and electricity increased moderately. Net investment in non-financial assets amounted to R11,1 billion – some 29,9 per cent higher when compared with the same period a year earlier. This resulted in total expenditure by municipalities amounting to R53,5 billion.
Local governments continued to increase their participation in the bond market, with the latest issue of a R0,8 billion 12-year bond by Ekurhuleni municipality during May 2012. This brought the total outstanding marketable bonds of local governments to R14,1 billion as at the end of the second quarter of 2012. All municipal commercial paper were redeemed as at 30 June 2012.
Extra-budgetary institutions recorded a cash surplus of R0,9 billion in the first quarter of fiscal 2012/13 – or R0,8 billion lower than a year earlier. Preliminary estimates indicated that the financial position of social security funds had improved, and had recorded a cash surplus of R4,6 billion in the second quarter of 2012 relative to a cash surplus of R3,0 billion recorded in the same period a year earlier. The surplus position can be attributed to an increase in social benefit contributions and a decline in the unemployment levels during the period under review from 0,3 per cent to 24,9 per cent when compared with the rate as at the end of March 2012.

Quarterly Bulletin September 201258
2012/13**2011/122010/112009/102008/092007/080
2
4
6
8
10
12
14
Unemployment Insurance Fund contributions and payouts
R billions Per cent
QB3-2012PF03
Fiscal years
As at 31 March of each fiscal year* As at June 2012** April–June 2012, annualised
Unemployment rate (right-hand scale) Contributions Payouts
20
22
24
26
*
Budget comparable analysis of national government financeNational government expenditure amounted to R213 billion in the April–June quarter of fiscal 2012/13, a year-on-year rate of increase of 7,5 per cent. The increase resulted from higher current payments along with transfers and subsidies. Equitable share transfers to provinces were also higher. The overall increase in national government expenditure was well aligned with government’s projections for the full fiscal year, if not somewhat on the low side: the Budget Review 2012 projected national government expenditure to increase at a rate of 8,9 per cent and amount to R968 billion in fiscal 2012/13 as a whole. As a ratio of gross domestic product, national government expenditure amounted to 27,0 per cent in April−June 2012, in comparison to 27,3 per cent in the same period a year earlier.
Current payments by the Justice, Crime Prevention and Security Cluster increased by 8,6 per cent year on year, and accounted for 78,1 per cent of total current payments on voted amounts. The increase in this cluster was mainly driven by the Departments of Police, Defence and Military Veterans. Increased spending by the Department of Police was aimed at improving the overall capacity in this area through the employment of additional personnel, improvement of physical resources such as basic equipment and capital infrastructure, skills development and technological enhancements. For the last-mentioned department, the additional allocations were for improvements in conditions of service for regular and reserve force members, strengthening border safeguarding, and modernising some landward capabilities.
Growth in transfers and subsidies amounted to 5,4 per cent year on year, with the Social Services Cluster contributing the most towards this spending category. The Departments of Basic Education, Higher Education and Training, as well as Social Development emulated the increase in social services transfer payments. Increased spending by the departments responsible for education was mainly to improve the quality of learning in basic education schools and to provide financial support to universities. Spending on transfers and subsidies by the Department of Social Development increased by 9,4 per cent and was mainly to provide income support to vulnerable groups.

59Quarterly Bulletin September 2012
0
50
100
150
200
250
Expenditure by national government
R billions Per cent
QB3-2012PF04
Fiscal years
* April–June 2012
R billions Four-quarter cumulative percentage change over one year (right-hand scale)
0
5
10
15
20
25
2012/13*2011/122010/112009/102008/092007/08
Interest paid on national government debt equalled R18,5 billion in the first quarter of fiscal 2012/13 – an increase of 15,4 per cent. The increase in interest payments mainly resulted from higher issuances of domestic government bonds and Treasury bills to finance the deficit; the interest rates on these debt instruments moved lower over the period. As the budget started with a weaker prognosis for growth, higher issuances were expected with the government committed to the pursuance of a countercyclical fiscal policy. Interest payments for the full fiscal year 2012/13 were budgeted to amount to R89,3 billion and increase by 16,9 per cent year on fiscal year.
National government expenditure
R billions
Item Apr–Jun 2011 Apr–Jun 2012
Voted amounts ...................................................................................... 107,7 114,8
Current payments .............................................................................. 31,4 33,7
Transfers and subsidies ..................................................................... 75,1 79,2
Payments for capital assets ............................................................... 1,2 1,8
Interest .................................................................................................. 16,0 18,5
Equitable share transfers to provinces ................................................... 72,1 77,3
Other statutory amounts* ...................................................................... 2,2 2,5
Total** ................................................................................................... 198,1 213,0
As a percentage of gross domestic product ...................................... 27,3 27,0
* Including standing appropriation** Components may not add up to totals due to rounding
Of the nationally raised revenue, R77,3 billion was paid to provinces as their equitable share in the first three months of fiscal 2012/13, which was an increase of 7,1 per cent year on year. This increase in equitable share transfers to provinces was mainly intended to extend and improve service delivery outcomes in health and education. Equitable share transfers to provinces were expected to total over a third of total national government expenditure and represent a major source of provincial governments’ revenue. In the first quarter of fiscal 2012/13, no payments were made in terms of the general fuel levy sharing with metropolitan municipalities.

Quarterly Bulletin September 201260
After taking into account cash-flow adjustments,13 national government’s cash-flow expenditure in the first three months of fiscal 2012/13 equalled R211 billion – some R11,4 billion more than in the same period a year earlier.
National government revenue amounted to R184 billion in the first three months of fiscal 2012/13, reflecting a brisk year-on-year rate of increase of 13,9 per cent. The original budget projections provided for national government revenue to increase by 8,0 per cent and total R799 billion in fiscal 2012/13. All major components of revenue recorded solid increases and contributed to the higher revenue collections.
The increase in taxes on income, profits and capital gains was driven by strong growth in personal and corporate income tax collections, boosted by higher provisional payments. The provisional payments by corporate institutions were mainly from the banking, mining and petroleum sectors. In the February 2012 Budget the Minister of Finance announced the replacement of the secondary tax on companies (STC) at a rate of 10 per cent with a withholding tax on dividends as from April, with the latter tax set at a rate of 15 per cent. This higher rate triggered a rush for companies to bring forward their dividend payments under the more affordable STC regime. The outcome of these actions was a significant increase in STC receipts in order to avoid the higher withholding tax rate effective in April 2012. Withholding tax collections could be expected to be somewhat subdued during the year as a result of initially muted dividend declarations under the new dispensation.
Corporate and personal income tax collections
Four-quarter cumulative percentage change over one year
QB3-2012PF05
Fiscal years
* April–June 2012
Corporate income tax Personal income tax
-30
-20
-10
0
10
20
30
40
2012/13*2011/122010/112009/102008/092007/08
Taxes on property recorded an increase of 2,6 per cent in the first three months of fiscal 2012/13, reflecting a positive turnaround in economic activity in the domestic financial markets, despite the continued weakness in the property market. Taxes on goods and services recorded a strong increase in April–June 2012, emanating from strong collections of value-added tax (VAT), and a solid increase in fuel levy and excise duty collections. Domestic VAT increased briskly due to higher domestic economic activity, with the highest VAT growth recorded in the finance, agencies and other services, and construction sectors. VAT refunds amounted to R34,7 billion in April–June 2012, a year-on-year rate of increase of 9,3 per cent. The increase in machinery and vehicle imports contributed to higher import VAT, and also partly to higher VAT refunds.
Collections from customs duties increased by 9,8 per cent year on year, and resulted mainly from higher imports of vehicles and clothing, which boosted collections from taxes on international trade and transactions.
13 Transactions arising from timing differences between the recording of transactions and bank clearances, and late departmental requests for funds.

61Quarterly Bulletin September 2012
National government gross VAT collections and VAT refunds
R billions
QB3-2012PF06
Fiscal years
* April–June 2012
0
20
40
60
80
100
2012/13*2011/122010/112009/102008/092007/08
Gross VAT collections
VAT refunds
Non-tax receipts increased substantially when compared with the first quarter of the previous fiscal year, mainly on account of R932 million in dividends received from Vodacom.
National government revenue in fiscal 2012/13
Revenue source
Originally budgeted ActualApr–Jun 2012
R billions Percentage change* R billions Percentage
change*
Taxes on income, profits and capital gains ......... 475,7 11,5 116,9 18,0
Income tax on individuals ................................ 287,2 14,3 62,9 13,8
Income tax on companies ............................... 169,5 -3,3 44,2 11,8
Payroll taxes ....................................................... 11,1 9,4 2,6 6,7
Taxes on property ............................................... 8,6 10,4 2,1 2,6
Taxes on goods and services ............................. 294,5 11,6 61,4 12,8
Value-added tax .............................................. 209,7 9,8 43,1 14,2
Taxes on international trade and transactions ..... 36,4 6,6 6,5 22,5
Other revenue ..................................................... 15,2 -20,0 4,8 36,8
Less: SACU** payments ..................................... 42,2 93,7 10,5 93,7
Total revenue ..................................................... 799,3 8,0 183,7 13,9
* Fiscal 2011/12 to fiscal 2012/13 ** Southern African Customs Union
The net outcome of national government revenue and expenditure was a cash-book deficit before borrowing and debt repayment of R29,3 billion in the first three months of fiscal 2012/13. This deficit was R7,6 billion lower than the cash-book deficit recorded in the same quarter of fiscal 2011/12, reflecting both faster growth in national government revenue and slower growth in expenditure. As a ratio of gross domestic product, the cash-book deficit amounted to 3,7 per cent, well below the value of 5,1 per cent recorded during the same period a year earlier. The full-year cash-book deficit was originally budgeted to amount to R168 billion or 5,1 per cent of estimated gross domestic product in fiscal 2012/13.

Quarterly Bulletin September 201262
The primary balance14 of national government is one of the key indicators of fiscal sustainability. In the first quarter of fiscal 2012/13, national government recorded a primary deficit of R10,8 billion, or 1,4 per cent of gross domestic product – almost half the primary deficit ratio of 2,9 per cent recorded a year earlier.
Netting national government revenue and expenditure yielded a cash-flow deficit of R28,2 billion, or R10,3 billion less than the deficit recorded in April–June 2011. Extraordinary payments amounted to R1,4 billion, which comprised mainly a premium on debt portfolio restructuring. After accounting for extraordinary transactions and the profit on revaluation of foreign debt at redemption, the net borrowing requirement amounted to R26,6 billion, some R12,5 billion lower than the borrowing requirement recorded in the previous fiscal year.
National government financing in fiscal 2012/13
R billions
Originally budgeted
2012/13Apr–Jun
2012Apr–Jun
2011
Deficit ........................................................................................ 168,4 28,21 38,51
Plus: Extraordinary payments ..................................................... – 1,4 0,5
Cost/Profit on revaluation of foreign debt at redemption2 .. -2,3 -2,9 0,1
Less: Extraordinary receipts ....................................................... – 0,1 0,0
Net borrowing requirement ....................................................... 166,1 26,6 39,1
Treasury bills ............................................................................... 22,0 11,4 7,4
Domestic government bonds ..................................................... 119,5 38,3 33,3
Foreign bonds and loans ............................................................ -9,8 -12,1 -1,0
Change in available cash balances3 ............................................ 34,3 -11,0 -0,6
Total net financing4 .................................................................... 166,1 26,6 39,1
1 Cash-flow deficit2 Cost + profit –3 Increase – decrease + 4 Components may not add up to totals due to rounding
The South African capital and money markets continued to benefit from strong investor appetite for debt instruments, which enabled government easily to finance the largest part of the net borrowing requirement domestically. Government raised R38,3 billion from the net issues of domestic government bonds in the first quarter of fiscal 2012/13, with inflation-linked bonds contributing R10,3 billion and retail bonds R0,3 billion. Since the introduction of inflation-linked bonds in March 2000, the outstanding balance of these bonds has risen to R217 billion as at 30 June 2012.
In June 2012 two new fixed-income bonds were introduced, namely the R2023 (with a 7,75 per cent coupon rate) and the R2048 (8,75 per cent coupon), raising R2,0 billion for the fiscus during the month. Three new inflation-linked bonds were launched during July 2012, namely the I2025 (2 per cent coupon), I2038 (2,25 per cent coupon) and I2050 (2,5 per cent coupon). These bonds were all named according to their respective years of maturity. During May–June 2012, R206 and R201 bonds (with normal maturity dates in 2014) were partly redeemed to an amount of R20,5 billion and switched to bonds with longer maturities stretching as far as 2041.
Domestic financing through short-term debt instruments was acquired at an average interest rate of 5,7 per cent, while domestic long-term nominal yield instruments were sold at an average interest rate of 8,1 per cent per annum. The average remaining maturity of national government’s domestic marketable bonds increased from 130 months to 132 months between March and June 2012.
14 The deficit/surplus recalculated by excluding interest payments from total expenditure.

63Quarterly Bulletin September 2012
QB3-2012PF09
Not exceeding 1 year Exceeding 1 but not 3 years Exceeding 3 but not 10 years Exceeding 10 years
June 2011
53%48%
37%42%
3% 2%
7% 8%
June 2012
National government domestic marketable debt by outstanding maturity
National government recorded net redemptions of foreign bonds and loans to the value of R12,1 billion in April–June 2012. The average outstanding maturity of foreign marketable bonds of national government lengthened from 90 months as at 31 March 2012 to 95 months as at the end of June.
National government’s financing activities increased its available cash balances by R11,0 billion in the first three months of fiscal 2012/13, bringing these balances to R206 billion as at 30 June 2012. Deposits with the Bank decreased from R131 billion to R121 billion between March and June 2012.
Funding from the South African capital market continued to dominate over foreign funding, with domestic debt of national government accounting for about 90 per cent of total gross loan debt. Domestic debt of national government increased from R1 057 billion at the end of March 2012 to R1 110 billion at the end of June. This reflected the issuance of Treasury bills and domestic long-term bonds, alongside the introduction of two new fixed-income government bonds.
Composition of domestic national government debt
R billions
QB2-2012PF08
As at 31 March of each fiscal year* As at 30 June 2012
2012/13*2011/122010/112009/102008/092007/080
200
400
600
800
1 000
1 200Retail bonds and other debt instruments Inflation-linked bondsTreasury bills and short-term loans from the Corporation for Public DepositsFixed-income and zero-coupon bonds
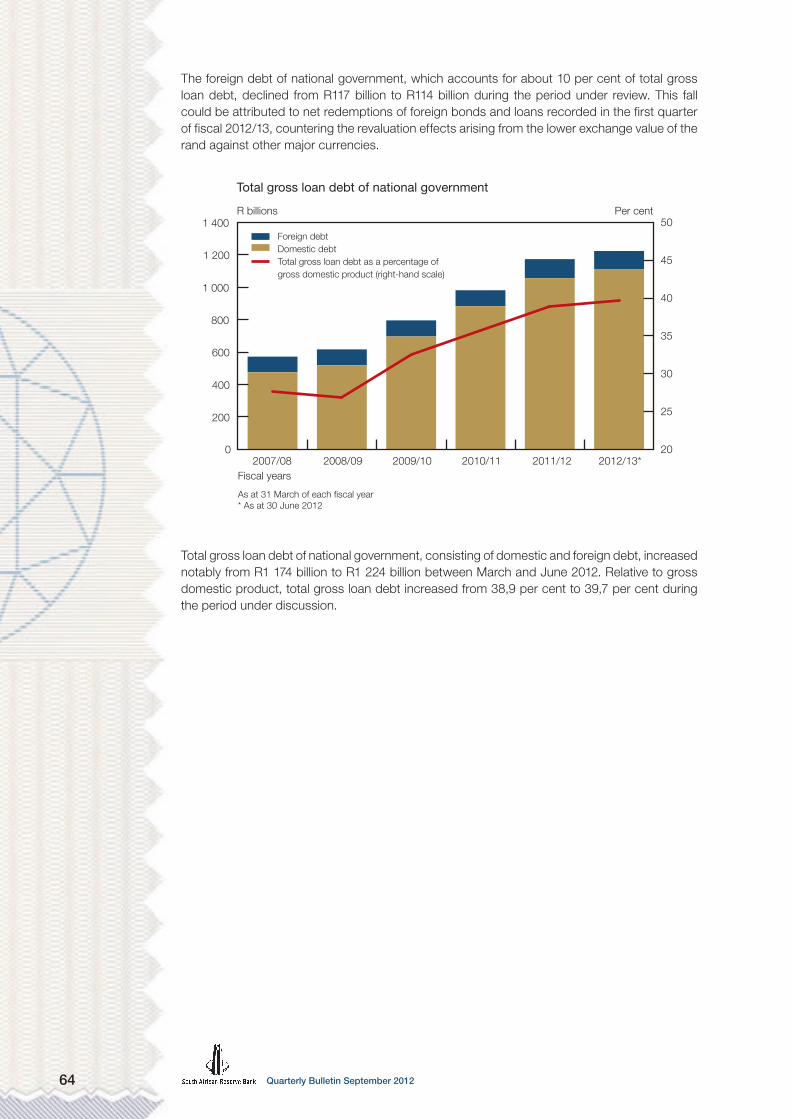
Quarterly Bulletin September 201264
The foreign debt of national government, which accounts for about 10 per cent of total gross loan debt, declined from R117 billion to R114 billion during the period under review. This fall could be attributed to net redemptions of foreign bonds and loans recorded in the first quarter of fiscal 2012/13, countering the revaluation effects arising from the lower exchange value of the rand against other major currencies.
2012/13*2011/122010/112009/102008/092007/080
200
400
600
800
1 000
1 200
1 400
Total gross loan debt of national government
R billions Per cent
QB3-2012PF11
Fiscal years
As at 31 March of each fiscal year* As at 30 June 2012
Foreign debt Domestic debt Total gross loan debt as a percentage of gross domestic product (right-hand scale)
20
25
30
35
40
45
50
Total gross loan debt of national government, consisting of domestic and foreign debt, increased notably from R1 174 billion to R1 224 billion between March and June 2012. Relative to gross domestic product, total gross loan debt increased from 38,9 per cent to 39,7 per cent during the period under discussion.

65Quarterly Bulletin September 2012
Statement of the Monetary Policy Committee19 July 2012
Issued by Gill Marcus, Governor of the South African Reserve Bank, at a meeting of the Monetary Policy Committee (MPC) in Pretoria
Since the previous meeting of the Monetary Policy Committee (MPC), there have been further indications of a generalised slowdown in the global economy, amid the continuing risks posed by the banking and sovereign debt crisis in the eurozone. This negative outlook has contributed to renewed monetary policy easing in a number of countries, including in emerging-market economies, in an environment of declining commodity prices and subdued global inflation.
Domestic inflation has continued its downward trend, and is expected to remain within the target range over the forecast period. However, despite some moderate employment creation over the past year, the economic growth outlook appears to be threatened by global developments and deteriorating domestic business and consumer confidence.
The year-on-year inflation rate as measured by the consumer price index (CPI) for all urban areas was 5,5 per cent in June 2012, down from 5,7 per cent in May. The categories of food, housing and utilities, and transport together accounted for 3,5 percentage points of the inflation outcome. Food prices increased by 6,0 per cent, petrol by 14,2 per cent and electricity by 17,1 per cent on a year-on-year basis. Core inflation, as measured by the exclusion of food, petrol and electricity from CPI, increased in line with expectations from 4,4 per cent in May to 4,6 per cent in June. Administered prices, excluding petrol, increased at a year-on-year rate of 8,7 per cent in both May and June.
Year-on-year producer price inflation moderated further, measuring 6,6 per cent in both April and May 2012, its lowest rate of increase since April 2011. More than half of this outcome was accounted for by mining and quarrying and electricity price increases. Food price inflation continued its downward trend with agricultural prices increasing at a year-on-year rate of 1,7 per cent in May, while manufactured food prices increased by 8,4 per cent.
The inflation forecast of the Bank has been revised downwards since the previous meeting of the MPC, apart from the final quarter of 2014 when a slightly higher outcome is forecast. With inflation expected to have peaked at an average of 6,1 per cent in the first quarter of 2012, it is now expected to continue to moderate over the next few quarters, reaching a low of 4,9 per cent in the second quarter of 2013. Inflation is then expected to remain fairly stable around the 5 per cent level to the end of 2014. Inflation is expected to average 5,6 per cent in 2012, and 5,1 per cent in both 2013 and 2014. The improved forecast is mainly due to lower-than-expected recent inflation outcomes.
The forecast for core inflation is also more favourable, although the upward trend is expected to continue in the short term. Core inflation is expected to measure 5,4 per cent in the final quarter of 2012 and the first quarter of 2013, before declining and averaging 4,8 per cent in 2014.
Inflation expectations as reflected in the survey conducted by the Bureau for Economic Research at Stellenbosch University in the second quarter of 2012 were almost unchanged since the previous quarter and remain anchored at around the upper end of the target range. On average, respondents expect inflation to average 6,1 per cent in 2012 and 6,0 per cent and 6,1 per cent in the next two years respectively. The break-even inflation rates declined across all maturities since the previous meeting of the MPC to within the target range.
The outlook for the global economy has worsened somewhat since the previous meeting of the MPC, with mounting evidence of a broad-based global slowdown. Negative indicators include a fall in the global manufacturing Purchasing Managers Index (PMI) to its lowest level in three years. The lack of meaningful progress towards a resolution of the eurozone crisis continues to be a source of global instability and risk, despite initiatives to stabilise the banking sector. The growth outlook for the region remains negative, as fiscal austerity measures and bank deleveraging continue to impact adversely on growth and on unemployment rates that
Quarterly Bulletin September 201266
have reached new euro-era highs. In the first quarter of 2012, most of the eurozone members recorded negative or marginally positive growth, particularly those in the periphery. The United Kingdom (UK) economy is currently also experiencing a recession.
The United States (US) economy slowed in the second quarter and the outlook has deteriorated. Concerns relating to the so-called fiscal cliff (the possible sharp contraction of fiscal policy in 2013) are beginning to weigh on consumption and investment decisions, and these pressures are expected to intensify during the second half of this year. Any resolution of this issue seems unlikely before the end of 2012.
Spill-over effects have also been felt in emerging markets. China recorded a growth rate of 7,6 per cent in the second quarter of 2012, the slowest since early 2009, amid a property-market downturn and weak exports. It is still unclear if the policy responses of the Chinese authorities will be sufficient to contain this trend. Materially slower growth has also been recorded in India and Brazil.
In response to these developments, monetary policy has been eased in a number of both advanced and emerging-market countries. In the UK, the Bank of England increased the size of its asset purchase programme, and although the Federal Open Market Committee has not resumed its programme of quantitative easing, the maturity extension programme has been extended and monetary policy is expected to remain highly accommodative for a prolonged period.
Global inflation continues to be benign, given the slowing growth prospects and lower commodity prices. One area of risk to the inflation outlook emanates from the higher grain prices in response to the continuing drought in the US.
The increasingly unfavourable and volatile global backdrop continues to impact on the rand exchange rate, primarily through changing risk perceptions in global financial markets. Since the previous meeting of the MPC, exchange rate volatility has increased and the rand has fluctuated in a range of between R8,06 and R8,70 against the US dollar, partly in response to fluctuations of the euro against the US dollar. The rand has, however, appreciated since the previous meeting by around 3,4 per cent against the US dollar, by 5,5 per cent against the euro and by 3,7 per cent on a trade-weighted basis.
During this period the rand was also impacted by strong inflows into the domestic bond market, following the confirmation that South Africa will be included in the Citibank World Government Bond Index (WGBI) from late September. Since the beginning of the year, non-residents have been net purchasers of South African government bonds to the value of R60,1 billion. In June alone net purchases of bonds by non-residents amounted to R21,7 billion, the second-highest monthly inflow ever into the bond market. Much of this is estimated to have been real money inflows, which possibly contributed to the generally appreciating exchange rate trend in that month and declining yields in the domestic government bond market. These inflows are expected to persist for some time after the actual inclusion in the index, and will not only help fund the fiscal deficit but also the widening current-account deficit of the balance of payments.
The rand is expected to remain vulnerable to erratic shifts in global risk perceptions. While a deterioration of global risk sentiment could cause further rand weakness, this could be offset to some extent by continued inflows into the bond market or the possible resumption of quantitative easing in the US.
The domestic economy appears to be slowing further, following the 2,7 per cent annualised growth rate recorded in the first quarter of 2012. The Bank’s forecast of gross domestic product (GDP) growth for 2012 has been revised down from 2,9 per cent to 2,7 per cent, and to 3,8 per cent in 2013. The forecast for 2014 remains unchanged at 4,1 per cent. However, given the possibility of a more widespread global downturn, the risks to this forecast are seen to be on the downside, with the external impact coming through trade links and commodity prices. The Bank’s estimate of the output gap is unchanged at around 3,5 per cent. The composite leading business cycle indicator of the Bank declined for the second consecutive month in April, indicative of the uncertain and subdued outlook.

67Quarterly Bulletin September 2012
The mining sector is expected to achieve positive but modest growth in the second quarter of 2012 following the 16,8 per cent annualised contraction in the first quarter. In May the three-month-to-three-month growth was 1,3 per cent and 0,8 per cent on a year-on-year basis. Despite this improvement, the mining sector is expected to face a number of challenges, including declining commodity prices, and further domestic cost pressures which have already resulted in stresses for some platinum mines.
The manufacturing sector, which grew at an annualised rate of 7,7 per cent in the first quarter of 2012, is showing some signs of moderation in the second quarter. In May the sector grew at a year-on-year real rate of 4,2 per cent, but contracted by 0,9 per cent on a three-month-to-three-month basis. The Kagiso/BER Purchasing Managers Index fell to 48,2 index points in June, its lowest level since August 2011, as the sub-indices for business activity and new sales orders declined further. This is consistent with the weaker RMB/BER Business Confidence Index which declined by 11 index points to 41 in the second quarter.
Growth in real gross fixed capital formation lost momentum, having moderated from an annualised 7,2 per cent rate in the final quarter of 2011 to 5,3 per cent in the first quarter of 2012. Of concern is the substantial decline in the growth of private-sector fixed capital formation to 1,8 per cent, following successive quarters of steady increases in excess of 5 per cent during 2011. This development, if sustained, will contribute to the fragility of the growth outlook. By contrast, increases of 13,1 per cent and 9,3 per cent were recorded by public corporations and general government, reflecting capital spending on infrastructure. This was consistent with the improvement in the FNB/BER Civil Construction Confidence Index. However, the FNB Building Confidence Index declined further and remains at low levels, with the real value of building plans passed declining by 8,7 per cent on a three-month-to-three-month basis in April.
Final consumption expenditure by households, which grew by 5,0 per cent in 2011, also appears to be slowing somewhat, with growth having moderated to 3,1 per cent in the first quarter of 2012. While real retail sales increased by 6,4 per cent on a year-on-year basis, the momentum appears weaker, with sales declining by 0,8 per cent on a month-on-month basis in May, while in the three months to May compared with the previous three months, sales increased by 0,4 per cent. The FNB/BER Consumer Confidence Index deteriorated in the second quarter, with the index declining from 5 to -3, the lowest level of the index since 2008. According to the RMB/BER Business Confidence Index, confidence of retailers declined markedly during the same period to its lowest level in two years. Somewhat anomalously, new vehicle sales have remained relatively buoyant.
Growth in credit extension to the private sector remains relatively subdued, with twelve-month growth in total loans and advances to the private sector increasing by 8,0 per cent in May. Growth in credit extension to the corporate sector moderated during April and May, while credit extension to households continued to increase, with growth over twelve months of 7,5 per cent in May. This includes the growth in general loans (including personal loans) which has shown a softer trend but still at elevated levels of 30,4 per cent. Mortgage advances remained subdued, reflecting continued weakness in the housing market, while instalment sale credit and leasing finance increased steadily in line with positive vehicle sales. Despite the increase in personal loans, household debt to disposable income declined further to 74,7 per cent in the first quarter of 2012. Personal loans now account for 11,0 per cent of total household debt, but have not led to excessive consumption expenditure.
Formal-sector employment creation has remained slow. According to the Quarterly Employment Statistics (QES) of Statistics South Africa, in the four quarters to the first quarter of 2012, just over 100 000 jobs were created, representing an increase of 1,2 per cent.
The outlook for wage growth is uncertain. Growth in nominal remuneration per worker declined from 6,8 per cent in the year to the fourth quarter of 2011, to 6,6 per cent in the first quarter of 2012, while unit labour cost increases declined from 5,8 per cent to 5,7 per cent. This trend may have been reversed recently. According to Andrew Levy Employment publications, the average wage settlement rates amounted to 7,7 per cent in the first half of 2012. The outcome of the public-sector wage settlement will be important in this respect.

Quarterly Bulletin September 201268
Administered price increases have remained relatively unchanged, but we still await Nersa’s determination of tariff increases to be granted to Eskom for the coming years. Some of the other important cost-push factors may have reached a lower turning point recently. Domestic food price inflation is still expected to moderate further in the short term, but the medium-term outlook is clouded by the drought-induced increases in maize, wheat and soya bean prices in the US. This has already impacted on domestic prices of both maize and wheat, and poses some upside risk to the inflation outlook.
Brent crude oil prices also rebounded from their recent lows of around US$90 per barrel, partly due to geopolitical factors. Currently oil is trading at around US$105 per barrel, well below the levels of almost US$130 per barrel that prevailed earlier this year, and prices are expected to be constrained by weak global demand. The domestic petrol price has declined by a total of R1,40 per litre in the past two months, although a slight increase may be recorded next month.
The MPC is concerned about the increased downside risks posed to the domestic economy by global developments. The problems in the eurozone are likely to persist for a protracted period and since the previous meeting the negative growth outlook has spread beyond Europe, in particular to the US, China, India and other emerging-market economies. The negative spill-over effects to South Africa are likely to intensify. This unfavourable outlook is reinforced further by the fragile domestic private-sector investment and consumption trends which are confirmed by declining business and consumer confidence. The MPC therefore sees the risks to the growth forecast to be on the downside.
The MPC also considered the inflation environment to have improved somewhat, notwithstanding possible pressures coming from food and energy prices in the medium term. Upside pressure on inflation could be offset to some extent by lower global commodity prices, while demand pressures are expected to remain muted. Although the exchange rate is likely to remain vulnerable to global risk aversion, the rand has shown some resilience in recent weeks. The MPC expects inflation to remain within the target range over the forecast period and sees the risks to the inflation forecast to be relatively balanced.
In the light of these developments the MPC views the prevailing conditions to be appropriate for further monetary accommodation to the economy that will not undermine the inflation outlook. The MPC has therefore decided to reduce the repurchase rate by 50 basis points to 5,0 per cent from Friday, 20 July 2012. While it is recognised that such a move on its own will not overcome the challenges facing the economy, it is felt that it can help alleviate some of the pressures faced by some sectors. A sustained increase in the potential output of the economy will require a concerted and co-ordinated effort from both government and the private sector. The MPC will continue to monitor both domestic and global developments, and will act appropriately in line with its mandate.

69Quarterly Bulletin September 2012
Note to tablesAnalysis of extra-budgetary institutions and social security funds – Tables S–65 and S–66
The administration of social grants function was reallocated from provincial governments to the national sphere of government during fiscal 2006/07. Subsequently, the South African Social Security Agency (SASSA) was formed to perform this function. The agency reports to the Ministry of Social Development. Data for SASSA have since been included in the social security funds accounts and have now been revised in accordance with the updated Institutional Sector Classification Guide for South Africa published in December 2011. SASSA financial data have been excluded from social security funds and incorporated in the extra-budgetary institutions analysis as from fiscal 2006/07.

Quarterly Bulletin September 201270

71Quarterly Bulletin September 2012

Quarterly Bulletin September 201272