quarterly report for period ended june 30, 2015 (sec form 17-q
TRANSCRIPT


COVER SHEET
C E O 2 5 3 6
S.E.C. Registration Number
A B O I T I Z E Q U I T Y V E N T U R E S , I N C .
( Company's Full Name )
3 2 N D S T R E E T , B O N I F A C I O G L O B A L
C I T Y , T A G U I G C I T Y , M E T R O M A N I L A
P H I L I P P I N E S
(Business Address: No. Street City / Town / Province )
CATHERINE R. ATAY
(02) 886-2451
Contact Person Contact Person
Company Telephone Number
3rd Monday of May 1 2 3 1
1 7 - Q
0 5 1 8
Month Day
FORM TYPE
Month Day
Fiscal Year
Annual Meeting
N/A
Secondary License Type, if Applicable
SEC
N/A
Dept. Requiring this Doc
Amended Articles Number/Section
x
Total No. of Stockholders Domestic Foreign
- - - - - - - - - - - - - - - - - - - - - - - - - - - - - - - - - - - - - - - - - - - - - - - - - - - - - - - - - - - - - - - - - - - - - -
To be accomplished by SEC Personnel concerned
File Number LCU
Document I.D. Cashier
S T A M P S
Remarks = Pls. use black ink for scanning purposes

SECURITIES & EXCHANGE COMMISSION
SEC FORM 17-C
QUARTERLY REPORT UNDER SECTION 17 OF THE SECURITIES REGULATION CODE (SRC)
AND SRC RULE 17.2(c) THEREUNDER
1. June 30, 2015
Date of Report (Date of earliest event reported) 2. SEC Identification Number CEO2536 3. BIR TIN 003-828-269-V 4. ABOITIZ EQUITY VENTURES, INC.
Exact name of registrant as specified in its charter 5. Philippines 6.
Province, country or other jurisdiction Industry Classification Code of incorporation
7. 32
nd Street, Bonifacio Global City,Taguig City, Metro Manila, Philippines 1634
Address of principal office Postal Code 8. (02) 793-2800
Registrant’s telephone number, including area code 9. N.A.
Former name or former address, if changed since last report 10. Securities registered pursuant to Sections 4 and 8 of the RSA
Title of Each Class Number of Shares of Common Stock Outstanding and Amount of Debt Outstanding Common Stock P1 Par Value 5,554,266,807 Amount of Debt Outstanding (As of June 30, 2015) P125,553,174,000.00
11. Are any or all of the securities listed on a Stock Exchange? Yes [ x ] No [ ]
If yes, state the name of such Stock Exchange and the class/es of securities listed therein: Philippine Stock Exchange Common
12. Indicate by check mark whether the registrant:
(a) has filed all reports required to be filed by Section 17 of the Code and SRC Rule 17 thereunder or Sections 11 of the RSA and RSA Rule 11(a)-1 thereunder, and Sections 26 and 141 of the Corporation Code of the Philippines, during the preceding twelve (12) months (or for such shorter period the registrant was required to file such reports)

Yes [ x ] No [ ]
(b) has been subject to such filing requirements for the past ninety (90) days.
Yes [ x ] No [ ]
PART I--FINANCIAL INFORMATION Item 1. Financial Statements. Please refer to the financial statements and schedules attached herewith.
Item 2. Management's Discussion and Analysis or Plan of Action of Financial Condition and Results of Operations
The following discussion and analysis of the financial condition and results of operations of Aboitiz Equity Ventures, Inc. (“AEV” or the “Company” or the "Parent Company") and its subsidiaries should be read in conjunction with the unaudited condensed consolidated financial statements and accompanying disclosures set forth elsewhere in this report. TOP FIVE KEY PERFORMANCE INDICATORS Management uses the following indicators to evaluate the performance of the registrant and its subsidiaries: 1. EQUITY IN NET EARNINGS OF INVESTEES
Equity in net earnings (losses) of investees represents the group's share in the undistributed
earnings or losses of its associates and joint ventures for each reporting period subsequent to
acquisition of said investment. This account reflects the result of the operating performance of an
associate or a joint venture and indicates its contribution to the group's consolidated net income.
Manner of Computation: Investee's Net Income (Loss) x Investor's % ownership - Goodwill
Impairment Cost
2. EARNINGS BEFORE INTEREST, TAXES, DEPRECIATION & AMORTIZATION (EBITDA)
The Company computes EBITDA as earnings before extra-ordinary items, net finance expense,
income tax provision, depreciation and amortization. It provides management and investors with a
tool for determining the ability of the group to generate cash from operations to cover financial
charges and income taxes. It is also a measure to evaluate the group's ability to service its debts and
to finance its capital expenditure and working capital requirements.
3. CASH FLOW GENERATED
Using the Statement of Cash Flows, management determines the sources and usage of funds for the
period and analyzes how the group manages its profit and uses its internal and external sources of

capital. This aids management in identifying the impact on cash flow when the group's activities are
in a state of growth or decline, and in evaluating management's efforts to control the impact.
4. CURRENT RATIO
Current ratio is a measurement of liquidity, calculated by dividing total current assets by total
current liabilities. It is an indicator of the group's short-term debt paying ability. The higher the
ratio, the more liquid the group.
5. DEBT-TO-EQUITY RATIO
Debt-to-Equity ratio gives an indication of how leveraged the group is. It compares assets provided
by creditors to assets provided by shareholders. It is determined by dividing total debt by
stockholders' equity.
KEY PERFORMANCE INDICATORS (KPI)
(Amounts in thousands except financial ratio data)
JAN-JUN 2015 JAN-JUN 2014
EQUITY IN NET EARNINGS OF INVESTEES
2,242,037
2,904,297
EBITDA
18,201,079
19,098,889
CASH FLOW GENERATED:
Net cash flows from operating activities
17,689,376
14,528,201
Net cash flows used in investing activities
(9,509,624)
(9,212,599)
Net cash flows used in financing activities
(5,758,923)
(10,413,087)
Net Increase (Decrease) in Cash & Cash Equivalents
2,420,829
(5,097,485)
Cash & Cash Equivalents, Beginning
50,481,566
36,118,190
Cash & Cash Equivalents, End
52,924,204
30,996,217
JUN 30, 2015 DEC. 31, 2014
CURRENT RATIO
2.24 2.76
DEBT-TO-EQUITY RATIO
1.16 1.08
All the KPI values were within management's expectation during the period in review. Management teams of the different businesses continued to effectively handle their respective operations and financial requirements. As a result, profitability had been sustained and financial position remained strong and liquid.

Associates continued to generate substantial earnings and enhance the consolidated bottomline, despite the 23% decline in their income contribution to the Group. Consolidated EBITDA, which decreased by 5%, translated into additional cash inflows coming from subsidiaries' operations and from dividend payments of associates. The internally-generated funds were then used to finance capital expenditures, settle maturing financial obligations and pay cash dividends. With higher borrowings at the end of June 2015, debt-to-equity ratio edged up to 1.16x (versus end-2014's 1.08x). Meanwhile, current ratio stood at 2.24x (versus end-2014's 2.76x) as increase in current liabilities outpaced the increase in current assets. REVIEW OF JAN-JUN 2015 OPERATIONS VERSUS JAN-JUN 2014 RESULTS OF OPERATIONS For the period ended June 2015, AEV and its subsidiaries posted a consolidated net income of P7.82 billion (bn), an 18% year-on-year (YoY) decrease. This translates to earnings per share of P1.41 for the period in review. In terms of income contribution, power group still accounted for the bulk at 76%, followed by the food, banking and real estate groups at 11%, 11% and 3%, respectively. The Group generated a non-recurring net loss of P110 million (versus P785 million (mn) gain in 2014) mainly from foreign exchange loss on the revaluation of dollar-denominated loans and placements. Stripping out this one-off item, the Group’s core net income for the current period amounted to P7.93 bn, down 9% YoY. BUSINESS SEGMENTS The individual performance of the major business segments is discussed as follows: Power Aboitiz Power Corporation (AboitizPower) ended the period with an income contribution of P6.17 bn, a 9% decline from last year's P6.79 bn. Power generation group's bottomline contribution to AEV fell 16% to P4.93 bn from P5.84 bn in the same period last year. This was substantially attributed to the following: a.) lower sales registered by the Tiwi-Makban plants due to a decline in steam flow during the current period; b.) the 28% decrease in the average selling price of the group’s bilateral sales as fuel costs continued to decline; c.) decrease in equity earnings from SN Aboitiz Power-Benguet, Inc. (SNAP-Benguet) owing to the implementation in February 2014 of Binga plant’s new contract for ancillary services, which resulted in lower average selling prices; and d.) the foreign exchange loss recorded by the group vis-à-vis last year’s gain. AboitizPower’s attributable net generation for the period in review grew by 3% YoY, from 5,555 gigawatt-hours (GWh) to 5,709 GWh, due to the 7% YoY growth in power sales through bilateral contracts. In line with the group’s efforts to reduce its exposure to spot market sales, bilateral sales constitute 87% of total power sold during the current period, and as a consequence, spot sales decreased by 21% YoY to 685 GWh. On the other hand, attributable sales on a capacity basis slightly increased to 1,795 megawatts (MW) from 1,766 MW last year as the increase in capacity sales of SNAP Benguet and Therma Mobile, Inc. (TMO) more than offset the drop in Tiwi-Makban’s capacity sales.

Meanwhile, AboitizPower's distribution group's earnings contribution to AEV grew by 20% from P1.11 bn to P1.33 bn. Driven by the growth in sales registered by Davao Light & Power Company, Inc. (Davao Light), Visayan Electric Co., Inc. (VECO), Subic EnerZone Corporation (Subic EnerZone), as well as the fresh contribution of Lima Enerzone Corporation (Lima EnerZone) which was acquired in June 2014, attributable electricity sales rose by 10% to 2,338 GWh, from 2,122 GWh in the same period last year. Meanwhile, the group's gross margin during the period was largely unchanged at P1.57 per kilowatt-hour (kWh). Banking Union Bank of the Philippines' (UnionBank or UBP) income contribution fell 42%, from P1.50 bn to P866.4 mn. This was mainly due to the 37% drop in total other income to P2.3 billion owing to the trading losses incurred during the current period, vis-a-vis the trading gains generated in the same period last year. Meanwhile, net interest income grew by 7% to P5.6 bn as a result of higher average levels of loans during the second quarter. Food Income contribution from Pilmico Foods Corporation (Pilmico or PFC) and its subsidiaries amounted to P885 mn, up 37% YoY, mainly attributed to the strong performance of Feeds Philippines and the fresh earnings contribution of Feeds Vietnam, the business that was acquired in the third quarter of 2014. Flour's earnings also strengthened due to higher sales volume and better gross profit on lower raw materials cost. The improvement in Net Income After Tax (NIAT) of the Feeds and Flour business more than made up for the decline in Farms’ bottomline, resulting from lower prevailing market selling price. Real Estate Income contribution of Aboitiz Land, Inc. (AboitizLand) amounted to P213 mn, 18% higher than P181 mn for the same period last year. The growth was mainly driven by strong industrial lot sales generated by Lima Land, Inc. (Lima Land). MATERIAL CHANGES IN LINE ITEMS OF REGISTRANT’S STATEMENTS OF INCOME AND OF COMPREHENSIVE INCOME For the period ended June 30, 2015, consolidated net income allocable to the equity holders of AEV registered an 18% decline, reaching P7.82 bn from P9.49 bn posted in the previous year. Operating profit for the current period amounted to P13.10 bn, a 2% increase YoY, as the P741 mn increase in revenues surpassed the P490 mn rise in costs and expenses. This increase was mainly attributed to the outstanding performance of the Food Group. Food Group showed a 26% improvement in operating profit (P1.42 bn vs P1.13 bn) resulting from stronger Feeds and Flour margins which more than offset the decline in margins contribution of Farms. Power subsidiaries' operating profit remained flat at P11.7 bn. Share in net earnings of associates dropped by 23% YoY (P2.24 bn vs P2.90 bn in the first half of 2014) mainly due to the decline in net income of UBP and SNAP-Benguet. This was attributed to UBP's recognition of trading losses which was in contrast with last year's trading gains, and SNAP-Benguet's recording of lower ancillary revenue.

The drop in equity earnings and other income, coupled with the increase in income tax provision, more than offset the increase in operating profit, and as a result, pulled down the Group's overall profitability. Meanwhile, the P278 mn increase in interest income earned on higher cash held during the current period more than offset the P64 mn rise in interest expense resulting from higher level of debt. Other income declined by 83% YoY (P314 mn vs P1.85 bn in the first half of 2014) mainly due to gains amounting to P634 mn generated from the sale of Aboitiz Jebsen Transport Corporation (Aboject) and Cebu International Container Terminal , Inc. (CICTI) in First Quarter 2014 versus nil in the current period. Foreign exchange (FX) differential further contributed to the decline (P110 mn loss vs P248 mn gain in First Quarter 2014), resulting from the restatement of the dollar-denominated debt and placements of the power group. Net income attributable to non-controlling interests dipped to P2.50 bn, from P2.68 bn in First Quarter 2014, substantially due to the decrease in AboitizPower's net income, 23% of which belongs to minority shareholders. AEV's consolidated comprehensive income attributable to equity holders correspondingly decreased by 30%, from P10.47 bn in First Half of 2014 to P7.30 bn in the First Quarter 2015. The 18% decrease in consolidated net income combined with 150% decrease in AEV's share of an associate's fair valuation differential on its available-for-sale (AFS) investments, accounted for this decline. CHANGES IN REGISTRANT’S RESOURCES, LIABILITIES AND SHAREHOLDERS' EQUITY Assets Compared to year-end 2014 level, consolidated assets increased 4.5% to P294 bn as of June 30, 2015, due to the following: a. Cash & Cash Equivalents increased by 5% (P52.92 bn vs P50.48 bn as of December 31, 2014)
mainly due to excess cash generated from the P10.4 bn cash dividends received, reduced by P6.1 bn cash dividends paid, P1.0 bn capital infusion into Cebu Praedia Development Corporation (CPDC) , Apo Agua Infrastructura, Inc. (Apo Agua Infrastructura), and Aseagas Corporation (Aseagas), and P629 mn acquisition of PETNET, Inc (PETNET).
b. Investments in and Advances to Associates increased by P303 mn (P52.57 bn vs P52.27 bn as
of December 31, 2014) mainly due to the recording of P2.24 b share in earnings of associates. This increase was partially reduced by the P1.12 bn cash dividends received from associates during the period, P539 million share of a banking associate's fair valuation loss on its Available-forSale (AFS) investments during the current period, and P289 mn collection of advances.
c. AFS investments increased by 347% (P287 mn vs P64 mn as of December 31, 2014) mainly due
to the first-time consolidation of PETNET's P236 mn worth of AFS investments. d. Gross of depreciation expense, the resulting P10.75 bn combined growth in Property Plant and
Equipment (PPE), Investment Properties (IP), and Land and Improvements (LI) was mainly due to the following: 1.) P8.18 bn on-going construction of AboitizPower's power plants, Aseagas' biomass plant and Food Group's swine farms and plant facilities; 2.) P1.23 billion acquisition of AboitizPower generation and distribution assets; 3.) P655 mn purchase of a piece of

property by CPDC; 4.) P200 million various capital expenditures by Real Estate and Food Groups; and 5.) P481 million purchase of additional land for future development by the Real Estate Group.
e. Derivative Assets (current and non-current) increased by 9% (P123 mn vs P113 mn as of
December 31, 2014) mainly due to unrealized mark-to-market gains recognized on outstanding hedging instruments during the current period.
f. Other Current Assets increased by 19% (P4.79 bn vs P4.04 bn in December 31, 2014)
substantially due to Power Group’s increase in prepaid insurance and build-up of input value-added tax (VAT) arising from the ongoing plant construction.
g. Deferred Income Tax Assets increased by 15% (P404 mn vs P350 mn as of December 31, 2014)
mainly due to the corresponding deferred tax benefit recognized on the unrealized foreign exchange losses and Non-Operating Loss Carry-Over (NOLCO) generated by the power group during the current period.
h. Goodwill increased by 33% (P2.07 bn vs P1.55 bn as of December 31, 2014) due to the positive
goodwill amounting to P516 mn generated from the acquisition of PETNET shares. i. Other Noncurrent Assets (ONCA) increased by 6% (P12.06 billion vs P11.38 billion as of
December 31, 2014) primarily due to the build-up of deferred input VAT by the power group arising from the ongoing construction of its power plants.
The above increases were tempered by the decrease in Pension Asset by 10% (P120 mn vs P134 mn as of December 31, 2014) due to accrual of defined benefit expense during the current period. Liabilities Consolidated short-term bank loans increased by 51% (P11.06 bn vs P7.34 bn as of December 31, 2014) while long-term liabilities increased by 3% (P114.76 bn vs P111.44 bn as of December 31, 2014). The increase in short-term loans (STL) was mainly due to the P5.09 bn availment by the Power Group and first-time consolidation of P446 million PETNET STL, offset by the P2.13 bn settlement by the Food Group. The P3.32 bn net increase in long-term debt was substantially due to the P4.26 bn combined additional loan availment by Therma South, Inc. (TSI), Food Group and Aseagas to finance ongoing plant construction, reduced by the payment of maturing finance lease and loan amortizations. Trade and other payables, inclusive of noncurrent portion, were higher by 22%, from P15.98 bn to P19.49 bn mainly due to the increase in payables to suppliers of certain power subsidiaries resulting from ongoing plant construction. Income tax payable increased by 70%, from P695 mn to P1.18 bn due to recording of additional income tax liability of the power group for the current period. Customers deposits increased by 6%, from P5.94 bn to P6.31 bn mainly due to the growth in the customer base of power distribution subsidiaries. Deferred income tax liabilities (DTL) rose by 7%, from P1.76 bn to P1.88 bn, mainly due to the recording of deferred tax provision on some unrealized gains generated during the current period.

Equity Equity attributable to equity holders of the parent increased by 2% from year-end 2014 level of P107.94 bn to P109.97 bn, mainly due to the following: 1.) P1.67 bn increase in Retained Earnings resulting from the P7.82 bn net income recorded during the period, reduced by the P6.15 bn cash dividends declared, and 2.) P885 mn sale of treasury shares. This was partially countered by the P526 mn share of UBP's unrealized mark-to market loss on its AFS investments. MATERIAL CHANGES IN LIQUIDITY AND CASH RESERVES OF REGISTRANT For the period ended June 2015, the Group continued to support its liquidity mainly from cash generated from operations, additional loans availed and dividends received from associates. Compared to the cash inflow for the same period in 2014, consolidated cash generated from operating activities in the first half of 2015 increased by P3.16 bn to P17.69 bn, despite the decrease in earnings before interest, depreciation and amortization (EBIDA) mainly due to the growth in trade payables during the current period. The current period ended up with P9.51 bn net cash used in investing activities versus P9.21 bn last year. This was mainly due to the higher cash spent on PPE acquisitions and lower cash dividends received from associates. On disposal of investments, additional cash was generated from the sale of Abojeb and CICTI last year, vis-a-vis nil during the period in review. The increase in cash usage was partially offset by lower capital infusion into associates during the current period (nil vs P2.50 bn in the first half of 2014). Net cash used in financing activities was P5.76 bn versus P10.41 bn in the first half of 2014. This was attributed to the lower cash dividends paid by AEV (P6.15 bn vs P9.94 bn in first half of 2014), and the P885 mn sale of treasury shares. For the period in review, net cash inflows surpassed cash outflows, resulting in a 5% increase in cash and cash equivalents, from P50.48 bn as of year-end 2014 to P52.92 bn as of June 30, 2015. FINANCIAL RATIOS Backed by strong operating cash inflows, liquidity was adequately preserved. Current ratio stood at 2.24x from 2.76x at the start of the year, since current liabilities grew stronger than current assets. Debt-to-equity ratio climbed slightly to 1.16:1 (versus year-end 2014’s 1.08:1). This was mainly due to the growth in total liabilities which outpaced the mild increase in equity. OUTLOOK FOR THE UPCOMING YEAR/KNOWN TRENDS, EVENTS, UNCERTAINTIES WHICH MAY HAVE MATERIAL IMPACT ON REGISTRANT
The Philippines’ strong GDP growth, the roll-out of the government’s Public-Private Partnership (PPP) Program, as well as the robustness and liquidity of the country’s financial system, provides AEV and its business units opportunities to sustain growth over the long-term. To complement the business units’ various initiatives, AEV also formed the AEV Business Development Team, whose key objective is to scan the market for opportunities, and if deemed acceptable from both risk and return basis, develop and execute the project.

New Core Business AEV has identified infrastructure as its fifth leg of core businesses. AEV foresees huge public and private investments in the sector over the next 10-15 years and intends to play an active role in the many opportunities in this space. Infrastructure meets the Company’s growth criteria by being scalable, diversifying income streams, tapping on existing core competencies and providing AEV with strong recurring profits and cash flow. AEV is supportive of the government’s PPP program, however, the Company also intends to explore selective acquisition opportunities and greenfield project developments. New Business Development AEV seeks to capture opportunities in sectors in which it believes it could further leverage on its core competencies, are scalable, and with strong recurring profits and cash flow. To this end, the Company formed a Business Development Team in late 2011 to evaluate new business opportunities that don’t fall squarely into the Company’s traditional core business areas of power, banking, and food. Earlier, AEV disclosed a couple of initiatives which it hopes will serve as new avenues of growth in the years to come. 1. Aseagas Corporation The business model of the company as originally approved will shift from producing liquid bio-methane to power generation due to the drastic drop in oil prices during the second quarter of 2014, which saw it fall from an all-time high of $111/barrel to $48/barrel, 38% below the 10-year average of $78.2/barrel. Aseagas aims to take advantage of the feed-in-tariff (FIT) scheme where participants are guaranteed a fixed tariff for a period of twenty (20) years. The company has already amended the Biomass Renewable Energy Operating Contract (BREOC) with the Department of Energy (DOE). The DOE endorsement, which is one of the requirements for a point to point application with the National Grid Corporation of the Philippines (NGCP) to secure certificate for FIT eligibility, has since been secured. At the moment, the FIT rate is expected to be at P6.63/kWh. AEV’s wholly-owned subsidiary Aseagas will invest $60 mn for an initial plant with a power capacity of 8.8 MW. The power plant is expected to have a 90% capacity factor producing 68,302,080 kWh per annum. A notes facility of P2.0 bn has already been closed to fund the project. The construction commenced last March 18, 2014 and is expected to be completed in December 2015. Should the pilot project be successful, operations could then be easily scaled up. 2. Davao Bulk Water Supply Project AEV and J.V. Angeles Construction Corp. (JVACC) established Apo Agua Infrastructurato develop the Davao City Bulk Water Supply Project. Apo Agua Infra will design, construct and operate a hydroelectric powered-raw water treatment facility and a conveyance system which will deliver a minimum, contracted volume of 109.5MM cu.m (equivalent to 300 million liters per day (MLD)) of treated bulk water to Davao City, the third largest city in the Philippines, over a 30-year period. Apo Agua Infra is a 70-30 joint venture owned by AEV and JVACC, respectively. Hedcor, Inc., an affiliate of AEV specializing in the design, construction and operations of mini-hydropower plants, will provide the technical and operational expertise for the hydro-electric component of the project. On the other hand, JVACC will bring its 50 years of experience in construction and development of water-related infrastructure to the partnership.

JVACC submitted an unsolicited proposal to the local water agency in early 2013. On June 20, 2014, JVACC informed AEV that it received, on behalf of the Jose V. Angeles Construction Consortium, the Notice of Award (NoA) from the Davao City Water District (DCWD) for the financing, design, construction and operations of the Tamugan Surface Water Development Project. On March 17, 2015, Apo Agua Infra signed the Contractual Joint Venture Agreement and Bulk Water Purchase Agreement (BWPA) with DCWD. Currently, Apo Agua Infra is securing the necessary permits and financing requirements to implement the project. Project construction is expected to commence in 1-2 years once all the necessary permits and funding are secured. 3. Bidding for the Operation and Maintenance of the existing LRT Line 2 (LRT2) system and the
Masinag Extension system AEV submitted the pre-qualification documents on January 27, 2015 to the Department of Transportation and Communication (DOTC) for the bidding of the operation and maintenance of the existing LRT Line 2 (LRT2) system and the Masinag Extension system. AEV is participating in the bidding through a consortium referred to as the Aboitiz-SMRT Transport Solutions Consortium, in partnership with SMRT International Pte. Ltd. SMRT International Pte. Ltd is a wholly-owned subsidiary of SMRT Corporation Ltd. (SMRT), a multi-modal transport service provider in Singapore offering rail, bus and taxi services. SMRT is the largest rail operator in Singapore, operating three (3) of the five (5) metro lines and a light rail system. 4. Bidding for the P123.8 bn Laguna Lakeshore Project AEV, through Team Trident consortium, filed the pre-qualification documents with the Department of Public Work and Highways (DPWH) for the bidding to finance, design, construct, operate and maintain the Laguna Lake Expressway-Dike Project under the PPP Program of the government. Team Trident is a consortium among AEV, Ayala Land, Inc. (ALI), Megaworld Corporation (MEG), SM Prime Holdings, Inc. (SMPH) and the lead member, Trident Infrastructure and Development Corporation (TIDC). TIDC is a joint venture company among AEV, ALI, MEG and SMPH incorporated for purposes of pre-qualifying for the bidding and evaluating the feasibility of the Project. 5. Bidding for the operations, maintenance and expansion of the Bacolod-Silay, Iloilo, Davao,
Laguindingan and New Bohol air gateways
In a disclosure dated April 8, 2015, AEV confirmed that it bought the bidding documents for the auction of the operations, maintenance and expansion of the Bacolod-Silay, Iloilo, Davao, Laguindingan and New Bohol air gateways. AEV is still evaluating the feasibility of the project based on available information. The final decision to participate in the project is subject to Board approval.
Power (Generation Business)
AboitizPower believes that its power generation business is in a very good position to benefit from the opportunities that developments concerning the electricity industry will bring. The company’s sound financial condition, coupled with a number of initiatives that the company is undertaking will allow it to create additional generating capacity over the next several years. On the other hand, the expiration of the income tax holiday (ITH) of several of the company’s plants over the next few years is expected to have some impact on earnings.

1. Expiration of Income Tax Holiday Several of the AboitizPower’s plants were eligible for an ITH upon their acquisition by the Company. Upon the expiration of the ITH, the respective plants will now be assessed a corporate income tax in accordance with the relevant laws. SN Aboitiz Power-Benguet, Inc. The Binga Plant obtained an ITH extension from the Board of Investments (BOI) in October 9, 2012. The ITH for Binga expired last August 11, 2015. 2. Increase in Attributable Generating Capacity Notwithstanding the challenges over the short-term, AboitizPower has built the necessary foundation to sustain its growth trajectory over the long term. Over the next several years, AboitizPower looks to expanding its portfolio of generation assets by implementing the following projects.
- Greenfield and Brownfield developments 14 MW Sabangan Hydro Power Plant Project. This involves the construction and operation of a hydropower plant facility in Mt. Province, in Northern Luzon by first half 2015. This project will be undertaken by a wholly owned subsidiary of AboitizPower, Hedcor Sabangan, Inc. The project, which is the first to be constructed in Mt. Province, has been validated to have successfully commissioned on June 2, 2015. 300-MW CFB Coal-Fired Power Plant in Davao. AboitizPower, through 100%-owned subsidiary Therma South, Inc., is constructing a 2 x 150 MW CFB coal-fired power plant in Davao, which is the biggest load center on the island of Mindanao. The project broke ground in May 2012. The engineering, procurement and construction (EPC) contract for the power block was awarded to Formosa Heavy Industries (FHI) with FHI supplying the CFB boilers and Fuji as major subcontractor/supplier of the turbine-generators. The EPC contract for the balance of plant equipment and their integration with the power block was awarded to a consortium led by Black & Veatch Corporation. The Mindanao-wide blackout that occurred last April 2015 affected the commissioning schedule of Unit 2 of TSI. Commercial operations of Unit 2 are now re-scheduled for February 2016. Meanwhile, Unit 1, which is currently undergoing testing, is expected to be commissioned within the third quarter of this year. 600-MW (net) Coal-Fired Power Plant in Subic. This is a project by Redondo Peninsula Energy, Inc. (RP Energy), a joint venture among Meralco PowerGen Corporation (MPGC), Aboitiz subsidiary Therma Power, Inc. (TPI) and Taiwan Cogeneration International Corporation (TCIC). AboitizPower, through TPI, will have an equity interest of 25% in RP Energy. The project involves the construction and operation of a 2 x 300 MW (net) circulating-fluidized-bed (CFB) coal-fired power plant located within the Subic Bay Freeport Zone. On November 15, 2012, RP Energy was issued an amended Environmental Compliance Certificate (ECC) to cover two high-efficiency 300-MW (net) units with main steam reheat systems. Site preparation is substantially completed. The selected EPC contractor is Hyundai with Foster Wheeler and Toshiba as major subcontractors/suppliers of the CFB boilers and turbine-generators, respectively. Hyundai has not yet been notified to proceed with the works because of the filing with the Supreme Court of a petition for a Writ of Kalikasan and environmental protection order by

an ad hoc group of individuals and organizations. The petition was remanded to the Court of Appeals for a hearing. The Court of Appeals denied the issuance of Writ of Kalikasan for lack of merit, but nonetheless, nullified RP Energy’s Environmental Compliance Certificate and land lease with SBMA on grounds of Department of Energy and Natural Resources (DENR) non-compliance with procedural requirements and SBMA failure to secure local government units’ (LGUs) approvals/endorsements, respectively. This decision was the subject of three Petitions for Review on Certiorari to the Supreme Court filed by RP Energy, DENR and SBMA, the resolution of which may reach into 2015. On February 3, 2015, the Supreme Court promulgated its decision denying the petition for Writ of Kalikasan and declaring valid the project’s ECC and land lease with SBMA, paving the way for the project to proceed. In view of the Supreme Court’s decision, full development and implementation of project has been resumed with the expected commercial operation of the power plant now planned by late 2018.
420-MW Pulverized Coal-Fired Expansion Unit 3 in Pagbilao, Quezon. AboitizPower, through wholly owned subsidiary TPI, and TeaM (Philippines) Energy Corporation (TEPEC), whose shareholders are Marubeni Corporation (Marubeni) and Tokyo Electric Company (TEPCO), through TPEC Holdings Corporation (TPEC Holdco) have formed Pagbilao Energy Corporation (PEC) to own Unit 3. The terms and conditions of the joint investment were finalized in a definitive shareholder agreement between the Parties. Unit 3 will be located within the premises of the existing 728-MW Pagbilao Units I and II Coal-Fired Thermal Power Plant in Quezon province. Marubeni and TEPCO are also shareholders of TeaM Energy Corporation, which owns and operates the Pagbilao Units 1 and 2 under a build-operate-transfer contract with the National Power Corporation (NPC). AboitizPower’s wholly owned subsidiary, Therma Luzon, Inc. (TLI), is the Administrator of the Energy Conversion Agreement between TeaM Energy Corporation and NPC under an Independent Power Producer Administration Agreement with the Power Sector Assets and Liabilities Management Corporation (PSALM), which manages the assets and Independent Power Producer (IPP) contracts of NPC. On April 25, 2014, PEC entered into a contract with a contractor consortium comprised of Mitsubishi Hitachi Power Systems Ltd, Daelim Industrial Co, Ltd, DESCO, Inc. and Daelim Philippines, Inc. to provide the EPC services required for the project. Notice to Proceed with the works was issued to the consortium on April 30, 2014. The debt financing for the project closed on May 30, 2014. The plant construction commenced last September 2014 and the target commercial operation is planned for year-end 2017. 340-MW CFB Coal-Fired Project in Toledo City, Cebu. This is a project of Therma Visayas, Inc. (TVI), a partnership between AboitizPower and Vivant Corporation (Vivant). AboitizPower will have an equity interest of 80% in TVI. This project involves the construction of a 2 x 170-MW coal-fired power project located south of Toledo City. The project site was acquired in December 2011. The Environmental Compliance Certificate for the project was issued in May 2013. Technical specifications, contract drawings, contract conditions, and requests for EPC proposals were issued on July 15, 2013, with a submittal deadline of November 15, 2013, thereafter extended to November 29, 2013. The EPC contract was awarded to Hyundai Engineering Co. Ltd. (HEC) and limited notice to proceed (LNTP) with engineering design and detailed subsurface investigations of the site issued on May 30, 2014. This was followed by the project notice to proceed (NTP) for all EPC activities on March 18, 2015. Turnover of the

first unit is targeted for the first half of 2018, with the second unit following three months thereafter. 68 MW Manolo Fortich Hydropower Plant Project. Hedcor Bukidnon, Inc (Hedcor Bukidnon) started the construction of the Manolo Fortich project second quarter of 2015. It is composed of the 43 MW Manolo Fortich 1 and 25 MW Manolo Fortich 2. Hedcor Bukidnon has completed the Memorandum of Agreement with the LGUs. The project broke ground in April 2015 and the target commercial operation is planned for year-end 2017. Other Greenfield and Brownfield developments. AboitizPower, together with its subsidiaries and associate company, is engaged in the origination and development of other greenfield and brownfield project opportunities, for example:
AboitizPower recently partnered with SunEdison to develop photovoltaic solar project opportunities in the Philippines. This is consistent with the Company’s focus on environmental sustainability and diversified power generation technologies.
SNAP's Greenfield Development Program aims to grow its renewable portfolio by looking at potential small and large hydro projects in the Philippines, primarily within its current host communities in northern Luzon.
SNAP-Greenfield secured renewable energy service contracts (RESCs) from the DOE on December 2, 2013 for its proposed 6-MW Maris South Canal and 1.75-MW Maris North Canal mini-hydropower projects located downstream of the National Irrigation Administration (NIA)-owned and -operated Maris dam and reservoir. The Maris dam and reservoir, which form the tailwater of Magat hydroelectric power plant, is situated at the boundary of Alfonso Lista, Ifugao and Ramon, Isabela. Earlier this year, SNAP-Greenfield filed for the assignment of the said RESCs to SN Aboitiz Power-Magat, Inc. (SNAP-Magat), which was subsequently approved by the DOE. The Feasibility Study for the Maris South Canal hydropower project is already completed. SNAP is currently in the Pre-Construction stage and targets end of 2015 for the commencement of construction of the project upon securing agreement with NIA for the project implementation. SN Aboitiz Power-Ifugao, Inc. has also secured on July 24, 2014 RESCs for its proposed 350-MW hydropower complex project in Ifugao, with a potential to increase the final capacity based on the result of the feasibility study currently being finalized. The project is composed of three facilities: the Alimit hydropower plant, the Alimit pumped storage facility, and the Olilicon hydropower plant. Both the Maris and Alimit projects are currently in feasibility study stage. SNAP-Magat and the NIA held the groundbreaking ceremony for the optimization of the Maris Reservoir on November 4, 2014. Maris Optimization is a project of NIA with SNAP-Magat as its project partner. It aims to refurbish and improve the Maris dam structure and raise the Maris Reservoir by adding a set of 3-m high stoplogs. The project is expected to improve the Maris dam structure operational safety and add some eight million cubic meters of storage to increase efficiency of NIA irrigation water delivery and provide flexibility to Magat hydropower plant operation. While construction is ongoing, NIA is also expropriating remaining lands in the area. The construction is expected to be completed in the first quarter of 2016.

Hedcor group continually explores hydropower potentials located in Luzon and Mindanao. Based on current findings, Hedcor sees the potential of building plants with capacities ranging from 20 MW to 105 MW. When the projects pass the evaluation stage and once permits are secured, the two-year construction period for the hydropower plant facilities will commence.
Additionally, Hedcor Inc.’s Ferdinand L. Singit (FLS) Power Plant has completed its expansion in June 2015 from 4.9 MW to 6.1 MW with the installation of new turbines and generators.
AboitizPower is also exploring new geothermal resources. Currently, pre-development works are ongoing in several areas namely, Negron-Cuadrado located in Central Luzon and Mt. Apo located in Mindanao. Both the Negron-Cuadrado and Mt. Apo geothermal projects have been awarded geothermal renewable energy service contracts (GRESC) by the DOE.
3. Participation in the Government’s Privatization Program for its Power Assets AboitizPower continues to closely evaluate the investment viability of the remaining power generation assets that PSALM intends to auction off. AboitizPower is also keen on participating in PSALM’s public auction for the IPP Administrator contracts, which involves the transfer of the management and control of total energy output of power plants under contract with NPC to the IPP administrators. Power (Distribution Business) AboitizPower remains optimistic that it will realize modest growth on its existing distribution utilities. It continually seeks efficiency improvements in its operations to maintain healthy margins.
On December 13, 2006, the ERC issued the Rules for Setting Distribution Wheeling Rates (RDWR) for privately-owned distribution utilities entering Performance Based Regulation (PBR) for the second and later entry points, setting out the manner in which this new PBR rate-setting mechanism for distribution-related charges will be implemented. PBR replaces the Return on Rate Base (RORB) mechanism which has historically determined the distribution charges paid by customers. Under PBR, the distribution-related charges that distribution utilities can collect from customers over a 4-year regulatory period is set by reference to projected revenues which are reviewed and approved by the ERC and used by the ERC to determine a distribution utility’s efficiency factor. For each year during the regulatory period, a distribution utility’s distribution charges are adjusted upwards or downwards taking into consideration the utility’s efficiency factor as against changes in overall consumer prices in the Philippines. The ERC has also implemented a Performance Incentive Scheme whereby annual rate adjustments under PBR will take into consideration the ability of a distribution utility to meet or exceed service performance targets set by the ERC, such as the average duration of power outages, the average time of restoration to customers and the average time to respond to customer calls, with utilities being rewarded or penalized depending on their ability to meet these performance targets.
Cotabato Light & Power Company’s (Cotabato Light) Second Regulatory Period ended on March 31, 2013. A reset process should have been initiated 18 months prior to the start of the Third

Regulatory Period covering April 1, 2013 to March 31, 2017. The reset process, however, has been delayed due to the issuance of an Issues Paper on the Implementation of PBR for Distribution Utilities under the RDWR by the ERC in 2013. This paper aims to revisit various matters relating to the reset process. The ERC has solicited comments from industry participants and has held several public consultations in Manila, Cebu and Davao from January to March 2014. In addition, several focus group discussions (attended by representatives from the academe, consumer groups, distribution utilities (DUs) and NGCP) were held in Manila, Cebu and Cagayan de Oro from April to May 2014. These discussions aimed to focus on particular topics which included valuation of the regulatory asset base, annual revenue requirement building blocks, WACC, among others. ERC has yet to release a final position paper on what would be its future actions on the implementation of PBR.
Similar to Cotabato Light, VECO and Davao Light’s Second Regulatory Period also already ended on June 30, 2014. The three DUs are still implementing the distribution, supply and metering charges approved for the last year of the Second Regulatory Period.
For Subic EnerZone Corporation's (SEZ) and San Fernando Electric Light & Power Co., Inc.'s (SFELAPCO) fourth regulatory year covering October 1, 2014 to September 30, 2015, ERC released the Decisions for the rate translation application on April 2015. The new rates shall be implemented in the aforementioned period or until such time that a reset process allows the DUs to revise its distribution, supply and metering charges.
On June 19, 2014, AboitizPower acquired 100% ownership interest of Lima Enerzone Corporation (formerly: Lima Utilities Corporation) (Lima Enerzone) from Lima Land, Inc. (Lima Land), a wholly owned subsidiary of AboitizLand. Lima Enerzone is the electricity distribution utility serving the LiMA Technology Center located in Batangas. The acquisition is in line with the company’s strategy of expanding its EnerZone brand. The ERC has posted for comments the draft Rules Governing the Issuance of Licenses or Authorization to Retail Electricity Suppliers (RES) and Prescribing the Requirements and Conditions Therefor (2015 RES Rules) and Revised Rules for Contestability. These rules affect the distribution utilities by being the Local RES and could be potential for additional margins for the business. A public consultation is scheduled regarding these matters on August 14, 2015 at the ERC Main Office. Market and Industry Developments
1. Open Access and Retail Competition Per Electric Power Industry Reform Act, the conditions for the commencement of the Open Access and Retail Competition in a particular grid are as follows:
(a) Establishment of the Wholesome Electricity Spot Market (WESM); (b) Approval of unbundled transmission and distribution wheeling charges; (c) Initial implementation of the cross subsidy removal scheme; (d) Privatization of at least 70% of the total capacity of generating assets of NPC within the
respective grids; and (e) Transfer of the management and control of at least 70% of the total energy output of
power plants under contract with NPC to the IPP administrators. Under the Open Access and Retail Competition, an eligible contestable customer, which is defined as an end-user with a monthly average peak demand of at least 1 MW for the preceding 12 months,

will have the option to source their electricity from eligible suppliers that have secured a Retail Electricity Supplier license (RES) from the ERC. Commencement of Open Access In June 2011, ERC declared December 26, 2011 as the Open Access Date to mark the commencement of the full operations of the competitive retail electricity market in Luzon and Visayas. However, after careful deliberation, the ERC acknowledged that not all the necessary rules, systems and infrastructures required for the implementation of the Open Access and Retail Competition have been put in place to meet the contemplated timetable for implementation. In October 2011, the ERC announced the deferment of the Open Access Date. In September 2012, the ERC declared the start of Open Access on December 26, 2012. Open Access commercial operations under an interim development system have been implemented starting June 26, 2013. The implementation of Open Access starting June 26, 2013 enabled AboitizPower to increase its contracted capacity through the delivery of power to affiliate and non-affiliate RES companies. AboitizPower has two wholly owned subsidiaries (i.e. Aboitiz Energy Solutions, Inc. (AESI) and AdventEnergy, Inc. (AdventEnergy) ) that are licensed RES. Open Access allowed AESI and AdventEnergy to enter into contracts with the eligible contestable customers. Moreover, Open Access also facilitated AboitizPower to contract with other RES companies. Currently, AboitizPower has signed contracts equivalent to approximately 300 MW through its RES companies. The ERC issued Resolution 22 Series of 2013 ERC issued revised licensing regulation for RES companies operating in the Retail Supply Segment last December 19, 2013. Items amended include the following:
Restriction for Generator, IPPA and DU affiliates in securing license as a RES company;
Transfer of live Retail Supply Contracts (RSCs) for RES with expired license to another licensed RES;
Determination of full retail competition to be made by ERC not later than June 25, 2015;
Contracted capacities of RES affiliates to be included in the grid limitations imposed on Generation Companies;
End-user affiliate RES limited to supplying up to 50% of its total contestable customer affiliates;
RES companies are limited to procuring up to 50% of its generation requirements from affiliate Generation Companies;
Annual submission of 5-year Business Plan; and
Submission of live Retail Supply Contracts for review by the ERC. Since Resolution 22 Series of 2013 limits the retail suppliers and creates non-assurance of renewal of RES license for existing retailers, the Retail Electricity Suppliers Association (RESA) challenged its legality at the Pasig RTC. Trial is suspended to give way to amicable settlement of issues between RESA and ERC. However, ERC has issued Resolution No. 17, Series of 2014, which holds in abeyance the evaluation of RES license applications, and suspends the issuance of RES licenses, pending the ERC's promulgation of the amended RES License Rules. DOE Circular No. 2015-06-0010 The DOE released a circular with the following pertinent provisions:

All Contestable Customers (CCs) with an Average Demand of 1MW and above, which are currently being served by their franchised DUs are mandated to secure their respective Retail Supply Contracts (RSCs) no later than 25 Jun 2016 with any licensed RES, any prospective/currently-operating generation company with a RES license. After which, the CC and its counterparty shall submit to the DOE and ERC its signed RSC for assessment, monitoring, policy and rule-making purposes.
All CCs with an average demand ranging from 750 kW and 999 kW for the preceding 12-month period are mandated to secure their RSCs with a RES no later than 25 Jun 2016. Effective 26 Jun 2016, Aggregators shall be allowed to compete with RES, generation company, and prospective generation company.
Lowering Contestability Threshold Below 750 kW- All electricity end-users with an average demand ranging from 501 kW to below 750 kW for the preceding 12 months may be allowed to choose their respective RES effective 26 Jun 2018.
2. Interim Mindanao Electricity Market (IMEM) The DOE issued Department Circular No. 2013-05-0008 “Promulgating the Interim Mindanao Electricity Market Implementing Rules”. Correspondingly, DOE also issued DC No. 2013-09-0020 approving pertinent IMEM Manuals. The IMEM has the following features:
Day-ahead pricing and scheduling;
Zonal pricing;
IMEM is for available resource capacity after taking out bilateral contract quantities;
In-Day Market is for imbalances or deviation from day-ahead schedules only; and
Deviations from day-ahead schedule will be subject to penalties and incentives. The IMEM started on December 3, 2013 and the first IMEM billing period ended on December 25, 2013. The first IMEM billing period has not been fully settled and succeeding billing periods were still not billed by the Philippine Electricity Market Corporation (PEMC). Last March 2014, PEMC suspended the implementation of IMEM. 3. Price Hike Issue for November and December 2013 Billing Months Due to the maintenance shutdown of Malampaya Natural Gas Field, the dispatch of Natural Gas-fired power plants were affected which caused the increase in the WESM prices in November and December 2013 Billing Months. The Supreme Court issued a Temporary Restraining Order (TRO) in GR Nos. 210245 and 201255, pegging the generation charge of Meralco to P5.6673/kWh. The TRO should have ended last February 2014, but this has been extended indefinitely through a notice provided by the Supreme Court last April 22. The extended TRO also includes the generators non-collection of the increase in generation charge. Issuance of ERC Case No. 2014-021MC ERC issued ERC Case No. 2014-021 MC “In the Matter of the Prices in the Wholesale Electricity Spot Market (WESM) For the Supply Months of November and December 2013 and the Exercise by the Commission of its Regulatory Powers to Intervene and Direct the Imposition of Regulated Prices therein without Prejudice to the ongoing Investigation on the Allegation of Anti-Competitive Behavior and Possible Abuse of Market Power Committed by some WESM Participants” on March 3, 2014. The ERC issued an Order to VOID the WESM Prices in Luzon for November and December

billing periods and declares the imposition of regulated prices in lieu thereof, in the exercise of its police power. The ERC Order adjusted prices retroactively. Regulated prices are calculated based on the load weighted average of the ex-post nodal energy prices and meter quantity of the same day same interval that have not been administered from December 26, 2012 to September 25, 2013. The Order includes the availment of oil-based plants of additional compensation to cover their full Fuel and Variable O&M Costs. Several subsidiaries and affiliates of AboitizPower, most notably SNAP Magat, SN AP Benguet, AP Renewales, Inc. (APRI), and TLI, will be affected by the decision as they had exposure to the spot market during the November-December period either as purchasers (as in the case of TLI), or as sellers. Various generators filed their Motions for Reconsideration with the ERC. However, in an Order dated October 15, 2014, the ERC denied these Motions of Reconsideration. After the denial, several generators filed an Appeal to the Court of Appeals. 4. Reserve Market The DOE issued Department Circular No. DC2013-12-0027, “Declaring the Commercial Launch for the Trading of Ancillary Service in Luzon and Visayas under the Philippine Wholesale Electricity Spot Market” dated December 2, 2013. The said Department Circular sets the responsibility of the PEMC, NGCP, National Electrification Administration and all WESM Members with regards to the operation of the Reserve Market. The trial operations started on February 26, 2014, and PEMC is still reviewing its results before certifying for market readiness. The Pricing and Cost Recovery Mechanism of the Reserve Market is still under review by the ERC under ERC Case # 2007-004RC. The last hearing was on March 13, 2014. The Reserve Market will cover three (3) reserve categories, namely: Frequency Regulation, Contingency Reserve and Dispatchable Reserve. The Reserve Market will also include the scheduling of the ancillary services under the Ancillary Services Procurement Agreement with NGCP. No date has been set for the launch of the Reserve Market. 5. Renewable Energy Act of 2008 (RE Law) implementation
The RE Law was signed into law by Former President Arroyo on December 16, 2008 and became effective in January 2009. Among the RE Law’s declared policies is to accelerate and develop the use of the country’s renewable energy (RE) resources to (a) reduce the country’s dependence on fossil fuels, thereby minimizing exposure to price fluctuations in the international markets, and (b) reduce or prevent harmful emissions and promote a healthy and sustainable environment. The RE Law offers fiscal and non-fiscal incentives to RE developers, including developers of hybrid systems, subject to certification by the DOE in consultation with the BOI. These incentives include income tax holiday for the first Series As of commercial operations; duty-free importations of RE machinery, equipment and materials effective within ten years upon issuance of certification, provided, said machinery, equipment and materials are directly and actually needed and exclusively used in RE facilities; special realty tax rates on civil works, equipment, machinery and other improvements of a registered RE developer not exceeding 1.50% of the net book value; net operating loss carry-over; corporate tax rate of 10% after the seventh year; accelerated depreciation; zero-percent value-added tax on sale of fuel or power generated from RE sources and other emerging sources using technologies such as fuel cells and hydrogen fuels and on purchases of local supply of goods, properties and services needed for the development, construction and

installation of RE facilities; cash incentives for missionary electrification; tax exemption on the sale of carbon emission credits; and tax credit on domestic purchases of capital equipment and services. All fiscal incentives apply to all RE capacities upon effectivity of the RE Law. RE producers from intermittent RE resources are given the option to pay transmission and wheeling charges on a per kilowatt-hour basis at a cost equivalent to the average per kilowatt-hour rate of all other electricity transmitted through the grid. Qualified and registered RE generators with intermittent RE resources shall be considered “must dispatch” based on available energy and shall enjoy the benefit of priority dispatch. Electricity generated from RE resources for the generator’s own consumption and/or for free distribution to off-grid areas is exempt from the universal charge. The RE Law further provides financial assistance from government financial institutions for the development, utilization and commercialization of renewable energy projects, as may be recommended and endorsed by the DOE. Pursuant to Department Circular No. DO2009-05-008 dated May 25, 2009 (Rules and Regulations Implementing the Renewable Energy Act of 2008), the DOE, the BIR and the Department of Finance (DOF) shall, within six months from its issuance, formulate the necessary mechanism and/or guidelines to implement the entitlement to the general incentives and privileges of qualified RE developers. However, as of this date, no specific guidelines or regulations have been issued by the relevant implementing agencies. Such being the case, the RE companies of AboitizPower, such as APRI, Luzon Hydro Corporation, Hedcor Sibulan, Inc., Hedcor Tamugan, Inc., SNAP-Magat and SNAP-Benguet, filed on August 6, 2010 a request before the BIR Law Division for a ruling on the application of zero-rated value-added tax on all its local purchases of goods and services needed for the development of RE plant facilities, exploration and development of RE sources and their conversion into power. To date, the said request is still pending with the BIR Law Division. In Resolution No. 10, Series of 2012 (as amended by ERC Case No. 2014-004RM), the ERC adopted the following FIT and degression rates for electricity generated from biomass, run-of-river hydropower, solar and wind resources:
FIT Rate (P/kWh) Degression Rate
Wind 8.53 0.5% after year 2 from effectivity of FIT
Biomass 6.63 0.5% after year 2 from effectivity of FIT
Solar 9.68 and8.69* 6% after year 1 from effectivity of FIT
Hydro 5.90 0.5% after year 2 from effectivity of FIT
*New solar FIT rate as per ERC Case No. 2014-004RM, as necessitated by the new installation target for Solar Energy Generation set by the Department of Energy (DOE)
On July 23, 2012, the ERC promulgated ERC Resolution No. 10, Series of 2012, with approved solar FIT rate of P9.68/kWh and installation target of 50 MW. After the DOE increased the installation target of solar, a new FIT rate of P8.69/kWh was approved by the ERC that shall be valid until March 15, 2016. For the Solar Plants that have been commissioned prior to the effectivity of the ERC Decision the original Solar FIT of P9.68/kWh shall apply. In early 2014, the ERC issued the guidelines on the collection of the FIT allowance (FIT-All) and the disbursement of the FIT-All Fund by Transco. The FIT-All shall be a uniform charge to be collected for the guaranteed payment of the FIT for electricity generator from emerging renewable energy technologies and actually delivered to the transmission and/or distribution network by RE

developers. The DUs and RES entities started collecting the FIT from their respective customers on February 2015. Similarly, in 2013, the ERC had issued the rules enabling the net metering program for RE. The rules, among others, seek to encourage end-users to participate in RE generation by requiring distribution utilities, upon the request of a distribution end-user with an installed RE system, to enter into a net metering agreement with such end-user, subject to technical considerations and without discrimination. The National Renewable Energy Board (NREB) is presently in the process of preparing the Renewable Portfolio Standards which, under the RE Law, shall be a market-based policy requiring electricity suppliers to source an agreed portion of their energy supply from eligible RE resources. It is likewise in the process of drafting rules enabling the net metering program for RE, which shall govern distributed generation and providing for the criteria of eligibility of RE developers to the FIT. In March 20, 2015, DOE issued DC 2015-03-0001, “Promulgating the Framework for the Implementation of the Must Dispatch and Priority Dispatch of Renewable Energy Resources in the Wholesale Spot Market”. In the said Circular, DOE directed PEMC to amend the WESM Rules to allow Must Dispatch of RE plants and Priority Dispatch of Biomass power plants. It also directed NGCP to determine maximum penetration limits of RE plants, among others. 6. Competitive Selection Process in securing Power Supply Agreements The DOE issued Department Circular No. DC2015-06-0008, “Mandating all Distribution Utilities to Undergo Competitive Selection Process (CSP) in securing Power Supply Agreements (PSA)”. The DOE recognizes that CSP in the procurement of PSAs by the DUs ensures security and certainty of electricity prices of electric power to end-users in the long term. The principles that will guide the DUs in undertaking CSPs are the following:
• Increase the transparency needed in the procurement process in order to reduce risks; • Promote and instill competition in the procurement and supply of electric power to all electricity end-users; • Ascertain least-cost outcomes that are unlikely to be challenged in the future as the political and institutional scenarios should change; and • Protect the interest of the general public.
This Circular shall apply to any entity that owns, operates, or controls one or more distribution systems in the main grid and off-grid areas, such as but not limited to:
• Electric Cooperatives (ECs); • Private Investor-Owned Distribution Utilities (PIOUs); • Local Government Unit Owned-and-Operated Distribution Systems/Utility (LGUOUs); • Multi-Purpose Cooperatives duly authorized by appropriate Government agencies to operate electric power system; • Entities duly authorized to operate within economic zones; and • Other duly authorized entities engaged in the distribution of electricity.
Financial Services UnionBank’s initiatives on strengthening its customer franchise will continue to be at the forefront as it prioritizes customer satisfaction through enhanced retail focus, superior innovation and product customization, and stronger sales management approach. UnionBank will continue to invest in

technology, cultivate partnerships and rationalize branch network expansion in strategic areas to maximize growth channels with respect to both deposits and loan accounts. UnionBank will continue to focus on improving the performance of its earning assets portfolio, with loan asset acquisition in the retail, middle-market and corporate sectors. UnionBank will implement a disciplined asset allocation built on good governance and effective risk management to ensure momentum of recurring income stream. At the same time, UnionBank is focusing on improving its deposit liabilities mix by targeting low-cost funds (i.e. CASA). Likewise, UnionBank will continue to enhance operating efficiencies through cost containment efforts and improvements in its business processes and systems to align with international standards and best practices, and increase in manpower productivity with the help of functional and developmental trainings as well as appropriate matching of job, skills and capabilities. UnionBank will also promote customer advocacy by cultivating employee engagement throughout the organization. UnionBank believes that by doing this, it can optimize employee behavior to drive long-term financial and operational performance and growth. In line with this, UnionBank initiated “middle-out” strategic programs, which strive to propel UnionBankers to higher levels of engagement, particularly through the conduct of culture conversations, fostering REaCh Programs and celebrating DNA Stories. City Savings Bank, Inc. (CitySavings), the thrift bank subsidiary of UnionBank, will continue with its unique focus as the preferred Teachers’ Bank in the Philippines, particularly expanding its customer franchise in areas outside of its present coverage. It will continuously enhance its products and services to strengthen its market position in its present niche and tap other civil servant market segments. The combined unique strengths of UnionBank and CitySavings’ management team as well as its attainted technological and financial capabilities will catapult both to greater heights towards elevating the lives of its stakeholders and the communities it serves. In June 2015, AEV invested around P1.0 bn to acquire a 51% stake in PETNET. Included in this investment is an injection of new capital for branch expansion. PETNET is a remittance firm with over 2,500 company owned and sub-agent locations. It is also the largest Western Union agent network in the country. The Company believes that PETNET has a large growth and development potential with the continued increase in remittances from OFWs (overseas Filipino workers) and with a large opportunity to distribute complementary products through an extensive network of outlets. Food Manufacturing Pilmico operates primarily in a demand-driven market. The fast rising private consumption in the coming years will bring in greater demand and drive larger volume production. For these reasons, the company strives to achieve efficiencies through economies of scale and integration. It aims to maintain margins and widen market share through strategic expansion and by continuing to be a low cost producer. With the ASEAN integration in play, Pilmico expects competition to get stiffer both on the domestic and regional fronts. We expect the bar for innovation and quality to be raised as we compete head-on with regional players.

The company will export its flour products in the ASEAN region, build a Pilmico Research & Training Bakery in Cebu as well as explore the commissary business. These are in line with the company’s aim of strengthening its Flour business in its battle for market share against cheaper imported flour. The Farms business will increase its sow level to 14,000 heads by 2017, build additional farms facilities, accelerate capability for its meats business and operate its own layers farms. In response to the demand of the consumers, the Feeds business will increase its feeds production capacities in Iligan and Tarlac, build a new inter-island pier facility for raw materials and finished goods, and introduce additional feeds products. Internationally, Pilmico VHF Joint Stock Company is set to expand the capacity of its aqua feed mill in Vietnam. Pilmico is also setting up representative office in Vietnam, in addition to the existing representative office in Indonesia. Moreover, the company will also actively pursue other opportunities in the region through mergers and acquisition. Property For over two decades, Aboitiz Land has continuously renewed its commitment to deliver high quality homes to Cebuano families. This is reflected by the growing number of “vecinos” (Spanish term for neighbors) within the AboitizLand community. Now, the company’s primary undertaking is to grow the business on a national scale, while intensifying its market position in Cebu. Together with the economy’s positive outlook is the favorable demographics and increasing number of families. This exciting development brings AboitizLand to see significant growth opportunities in the mid-market segment. To continue its presence in Cebu, A 50-hectare property in the North will be launched within the year. At present, the company is poised to address the increasing housing gap by acquiring land in key areas and planning for future developments across the country. The Industrial segment of AboitizLand had a significant surge in its income contribution after the acquisition of Lima Land, the developer of Lima Technology Center in Batangas. Now, a 150-hecatre expansion is in progress to further augment the company’s revenue and profit levels. 2014 was also a stellar year for the company’s commercial business unit as major players, SM Hypermarket and Jollibee joined AboitizLand’s growing roster of merchants. An expansion in its Pueblo Verde development is also underway, making it a key destination for shopping and dining. After the incorporation of Cebu District Property Enterprise, Inc. in February 2014, a joint venture with AyalaLand, the first residential condo will already be launched within the year. The commercial development will also break ground this year, targeted to be operational in 2017. These new business lines will provide the company a growth platform for expansion. Given the booming economy, AboitizLand is geared up to face the challenges from intensifying competition, as well as take advantage of opportunities from strong economic advancement. The company will continue to strive to keep growing by launching new projects, tapping new markets and developing new land for its vision of development and expansion.
PART II--OTHER INFORMATION There are no significant information on the company which requires disclosure herein and/or were not included in SEC Form 17-C.


INTERIM CONDENSED CONSOLIDATED BALANCE SHEETS(Amounts in thousands)
June 30, 2015 December 31, 2014Unaudited Audited
ASSETSCurrent AssetsCash and cash equivalents 52,924,204 50,481,566 Trade and other receivables 16,059,833 16,639,775 Inventories 7,528,723 7,664,499 Derivative assets 49,785 53,500 Other current assets 4,790,514 4,041,372
Total Current Assets 81,353,059 78,880,712
Noncurrent Assets
Trade receivables - net of current portion 321,040 292,414 Investments and advances 52,570,648 52,267,310 Property, plant and equipment 134,687,257 126,203,724 Land and improvements 2,451,309 1,970,211 Investment properties 3,954,671 4,441,417 Intangible asset - service concession rights 3,353,660 3,400,354 Available-for-sale (AFS) investments 287,256 64,244 Net pension assets 120,338 133,882 Derivative asset - net of current portion 73,094 59,044 Deferred income tax assets 404,211 350,005 Goodwill 2,066,209 1,550,106 Other noncurrent assets 12,056,949 11,383,133 Total Noncurrent Assets 212,346,642 202,115,844
TOTAL ASSETS 293,699,701 280,996,556
LIABILITIES AND EQUITYCurrent LiabilitiesBank loans 11,061,158 7,343,700Current portions of:
Long-term debts 2,880,868 2,907,302Long-term obligation on Power Distribution System (PDS) 40,000 40,000Obligations under finance lease 1,971,739 1,971,739
Trade and other payables 19,138,936 15,631,565Income tax payable 1,180,096 694,604Total Current Liabilities 36,272,797 28,588,910Noncurrent LiabilitiesNoncurrent portions of:
Obligations under finance lease 51,670,287 52,489,282Long-term debts 57,969,122 53,814,682Long-term obligation on PDS 231,599 216,015Trade and other payables 347,851 345,915
Customers’ deposits 6,306,965 5,943,305Asset retirement obligation 2,404,512 2,353,250Deferred income tax liabilities 1,876,914 1,760,139Net pension liability 543,760 550,094Total Noncurrent Liabilities 121,351,010 117,472,682
Total Liabilities 157,623,807 146,061,592
Equity Attributable to Equity Holders of the Parent
Capital stock 5,694,600 5,694,600 Additional paid-in capital 7,683,568 6,911,044 Other equity reserves:
Gain on dilution 5,376,176 5,376,176 Excess of book value over acquisition cost of an acquired subsidiary 469,540 469,540 Acquisition of non-controlling interests (1,577,075) (1,577,075)
Other components of equity:
Net unrealized mark-to-market gains on AFS investments 15,661 14,627 Cumulative translation adjustments 44,035 35,533 Actuarial losses on defined benefit plans (701,348) (708,448)Share in actuarial losses on defined benefit plans of associates (320,289) (315,444)Share in cumulative translation adjustments of associates (285,499) (277,293)Share in net unrealized mark-to-market losses on AFS investments of an
associate (2,022,844) (1,496,305)
Retained earnings 96,663,414 94,995,596 Treasury stock at cost (1,065,585) (1,178,397)
109,974,354 107,944,154
Non-controlling Interests 26,101,540 26,990,810
Total Equity 136,075,894 134,934,964
TOTAL LIABILITIES AND EQUITY 293,699,701 280,996,556
ABOITIZ EQUITY VENTURES, INC. AND SUBSIDIARIES

ABOITIZ EQUITY VENTURES, INC. AND SUBSIDIARIES
INTERIM CONDENSED CONSOLIDATED STATEMENTS OF INCOMEFor the six months ended June 30, 2015 and June 30, 2014
(Amounts in thousands, except earnings per share amounts)
(Unaudited)
2015 2014 2015 2014
OPERATING REVENUES 55,071,339 54,330,562 28,042,196 28,590,187
OPERATING EXPENSES 41,971,617 41,481,457 21,797,962 22,211,412
FINANCIAL INCOME (EXPENSES)
Interest income 502,020 224,226 224,551 96,621
Interest expense (3,445,633) (3,382,118) (1,512,165) (1,486,583)
(2,943,613) (3,157,892) (1,287,614) (1,389,962)
OTHER INCOME - NET
Share in net earnings of associates 2,242,038 2,904,297 1,132,720 1,379,911
Other income - net 314,276 1,845,641 9,658 993,098
2,556,314 4,749,938 1,142,378 2,373,009
INCOME BEFORE INCOME TAX 12,712,423 14,441,151 6,098,998 7,361,822
PROVISION FOR INCOME TAX 2,386,249 2,278,630 1,153,877 1,297,751
NET INCOME 10,326,174 12,162,521 4,945,121 6,064,071
ATTRIBUTABLE TO:Equity holders of the parent 7,821,288 9,485,132 3,735,474 4,616,999
Non-controlling interests 2,504,886 2,677,388 1,209,646 1,447,073
10,326,174 12,162,520 4,945,120 6,064,072
EARNINGS PER COMMON SHARE
Basic and diluted, for income for the year attributable to
ordinary equity holders of the parent1.409 1.718 0.672 0.836
For the six months ended June 30 For the quarter ended June 30

ABOITIZ EQUITY VENTURES, INC. AND SUBSIDIARIES
INTERIM CONDENSED CONSOLIDATED STATEMENTS OF COMPREHENSIVE INCOME(Amounts in thousands)(Unaudited)
2015 2014 2015 2014
NET INCOME ATTRIBUTABLE TO:
Equity holders of the parent 7,821,288 9,485,132 3,735,474 4,616,999
Non-controlling interests 2,504,886 2,677,388 1,209,646 1,447,073
10,326,174 12,162,520 4,945,120 6,064,072
OTHER COMPREHENSIVE INCOME (LOSS)
Items that may be reclassified to consolidated statements of income:Net unrealized mark-to-market gains on AFS investments 14,715 2,294 13,258 695 Movement in cumulative translation adjustments 11,747 (43,771) 41,172 (46,960)
Share in movement in cumulative translation adjustments of associates (8,206) (16,575) 897 (91,817) Share in movement in net unrealized mark-to-market gains (losses) on AFS
investments of an associate (525,138) 1,044,299 (1,048,380) 645,920
(506,882) 986,247 (993,053) 507,838
Items that will not be reclassified to consolidated statements of income:Movement in actuarial gains (losses) on defined benefit plans 7,100 42,295 (12) (3,377) Share in movement in actuarial losses on defined benefit plans of
associates (4,845) (69,786) (4,728) (7,458)
2,255 (27,491) (4,740) (10,835)
TOTAL COMPREHENSIVE INCOME 9,821,547 13,121,276 3,947,327 6,561,075
ATTRIBUTABLE TO:Equity holders of the parent 7,298,334 10,467,006 2,712,542 5,149,628 Non-controlling interests 2,523,213 2,654,270 1,234,785 1,411,447
9,821,547 13,121,276 3,947,327 6,561,075
For the six months ended June 30 For the quarter ended June 30

ABOITIZ EQUITY VENTURES, INC. AND SUBSIDIARIES
INTERIM CONDENSED CONSOLIDATED STATEMENTS OF CHANGES IN EQUITYFOR THE PERIODS ENDED JUNE 30, 2015, DECEMBER 31, 2014 AND JUNE 30, 2014
Capital Stock
Additional
Paid-in Gain on
Excess of Book
Value over
Acquisition Cost of
an Acquired
Acquisition of
Non-
controlling
Net Unrealized
Mark-to-market
Gains (Losses) on
AFS
Cumulative
Translation
Actuarial Losses
on Defined
Benefit
Share in
Actuarial Losses
on Defined
Benefit Plans of
Share in
Cumulative
Translation
Adjustments of
Share in Net
Unrealized Mark-to-
market Gains (Losses)
on AFS Investments &
Underwriting
Accounts of an Retained Treasury Non-controllingCommon Capital Dilution Subsidiary Interests Investments Adjustments Plans Associates Associates Associate Earnings Stock Total Interests Total
Balances at January 1, 2015 5,694,600 6,911,044 5,376,176 469,540 (1,577,075) 14,627 35,533 (708,448) (315,444) (277,293) (1,496,305) 94,995,596 (1,178,397) 107,944,154 26,990,810 134,934,964
Net income for the period - - - - - - - - - - - 7,821,288 - 7,821,288 2,504,886 10,326,174 Other comprehensive income
Movement of net unrealized mark-to-
market gains on AFS investments - - - - - 1,034 - - - - - - - 1,034 13,680 14,714 Movement in cumulative translation
adjustments - - - - - - 8,502 - - - - - - 8,502 3,246 11,748 Actuarial gains on defined benefit plans, net
of tax - - - - - - - 7,100 - - - - - 7,100 - 7,100 Share in movement in actuarial losses on
defined benefit plan of associates - - - - - - - - (4,845) - - - - (4,845) - (4,845) Share in cumulative translation adjustment
of associates - - - - - - - - - (8,206) - - - (8,206) - (8,206) Share in movement in unrealized mark-to-
market losses on AFS investments of an
associate - - - - - - - - - - (526,539) - - (526,539) 1,401 (525,138)
Total comprehensive income (loss) for the year - - - - - 1,034 8,502 7,100 (4,845) (8,206) (526,539) 7,821,288 - 7,298,334 2,523,213 9,821,547
Excess of acquisition cost over carrying value of
non-controlling interests - - - - - - - - - - - - - - - - Cash dividends - P1.11 per share - - - - - - - - - - - (6,153,470) - (6,153,470) - (6,153,470)
Cash dividends paid to non-controlling interests - - - - - - - - - - - - - - (3,634,521) (3,634,521) Sale of treasury shares - 772,524 - - - - - - - - - - 112,812 885,336 - 885,336 Changes in non-controlling interests - - - - - - - - - - - - - - 222,038 222,038
Balances at June 30, 2015 5,694,600 7,683,568 5,376,176 469,540 (1,577,075) 15,661 44,035 (701,348) (320,289) (285,499) (2,022,844) 96,663,414 (1,065,585) 109,974,354 26,101,540 136,075,894
Attributable to owners of the parent

Capital Stock
Additional
Paid-in Gain on
Excess of Book
Value over
Acquisition Cost of
an Acquired
Acquisition of
Non-
controlling
Net Unrealized
Mark-to-market
Gains (Losses) on
AFS
Cumulative
Translation
Actuarial Losses
on Defined
Benefit
Share in
Actuarial Losses
on Defined
Benefit Plans of
Share in
Cumulative
Translation
Adjustments of
Share in Net
Unrealized Mark-to-
market Gains (Losses)
on AFS Investments &
Underwriting
Accounts of an Retained Treasury Non-controllingCommon Capital Dilution Subsidiary Interests Investments Adjustments Plans Associates Associates Associate Earnings Stock Total Interests Total
Balances at January 1, 2014 5,694,600 6,110,957 5,376,176 469,540 (1,262,862) 7,881 (14,534) (857,602) (156,925) (295,546) (3,403,534) 86,554,345 (1,295,163) 96,927,333 25,622,139 122,549,472
Net income for the period - - - - - - - - - - - 9,485,132 - 9,485,132 2,677,388 12,162,520 Other comprehensive income
Movement of net unrealized mark-to-
market gains on AFS investments - - - - - 7,635 - - - - - - - 7,635 (5,341) 2,294 Movement in cumulative translation
adjustments - - - - - - - - - - - - - - (43,771) (43,771) Actuarial gains on defined benefit plans, net
of tax - - - - - - - 42,294 - - - - - 42,294 - 42,294 Share in movement in actuarial losses on
defined benefit plan of associates - - - - - - - - (65,359) - - - - (65,359) (4,427) (69,786) Share in cumulative translation adjustment
of associates - - - - - - - - - (46,995) - - - (46,995) 30,421 (16,574) Share in movement in unrealized mark-to-
market gains on AFS investments of an
associate - - - - - - - - - - 1,044,299 - - 1,044,299 - 1,044,299
Total comprehensive income (loss) for the year - - - - - 7,635 - 42,294 (65,359) (46,995) 1,044,299 9,485,132 - 10,467,006 2,654,270 13,121,276
Excess of acquisition cost over carrying value of
non-controlling interests - - - - - - - - - - - - - - - - Acquisition of non-controlling interest - - - - (161,945) - - - - - - - - (161,945) - (161,945) Cash dividends - P1.80 per share - - - - - - - - - - - (9,939,369) - (9,939,369) - (9,939,369)
Cash dividends paid to non-controlling interests - - - - - - - - - - - - - - (3,471,398) (3,471,398) Changes in non-controlling interests - - - - - - - - - - - - - - (699,068) (699,068)
Balances at June 30, 2014 5,694,600 6,110,957 5,376,176 469,540 (1,424,807) 15,516 (14,534) (815,308) (222,284) (342,541) (2,359,235) 86,100,108 (1,295,163) 97,293,025 24,105,943 121,398,968
Attributable to owners of the parent

Capital Stock
Additional
Paid-in Gain on
Excess of Book
Value over
Acquisition Cost of
an Acquired
Acquisition of
Non-
controlling
Net Unrealized
Mark-to-market
Gains (Losses) on
AFS
Cumulative
Translation
Actuarial Losses
on Defined
Benefit
Share in
Actuarial Losses
on Defined
Benefit Plans of
Share in
Cumulative
Translation
Adjustments of
Share in Net
Unrealized Mark-to-
market Gains (Losses)
on AFS Investments &
Underwriting
Accounts of an Retained Treasury Non-controllingCommon Capital Dilution Subsidiary Interests Investments Adjustments Plans Associates Associates Associate Earnings Stock Total Interests Total
Balances at January 1, 2014 5,694,600 6,110,957 5,376,176 469,540 (1,262,862) 7,881 (14,534) (857,602) (156,925) (295,546) (3,403,534) 86,554,345 (1,295,163) 96,927,333 25,622,139 122,549,472
Net income for the period - - - - - - - - - - - 18,380,620 - 18,380,620 5,184,246 23,564,866 Other comprehensive income
Movement of net unrealized mark-to-
market gains on AFS investments - - - - - 6,746 - - - - - - - 6,746 (5,341) 1,405 Movement in cumulative translation
adjustments - - - - - - 50,067 - - - - - - 50,067 14,472 64,539 Actuarial gains on defined benefit plans, net
of tax - - - - - - - 149,154 - - - - - 149,154 - 149,154 Share in movement in actuarial losses on
defined benefit plan of associates - - - - - - - - (158,519) - - - - (158,519) (14,074) (172,593) Share in cumulative translation adjustment
of associates - - - - - - - - - 18,253 - - - 18,253 (5,185) 13,068 Share in movement in unrealized mark-to-
market gains on AFS investments of an
associate - - - - - - - - - - 1,907,229 - - 1,907,229 7,143 1,914,372
Total comprehensive income (loss) for the year - - - - - 6,746 50,067 149,154 (158,519) 18,253 1,907,229 18,380,620 - 20,353,550 5,181,261 25,534,811
Excess of acquisition cost over carrying value of
non-controlling interests - - - - (314,213) - - - - - - - - (314,213) - (314,213) Cash dividends - P1.80 per share - - - - - - - - - - - (9,939,369) - (9,939,369) - (9,939,369)
Cash dividends paid to non-controlling interests - - - - - - - - - - - - - - (3,752,913) (3,752,913) Sale of treasury shares - 800,087 - - - - - - - - - - 116,766 916,853 - 916,853 Changes in non-controlling interests - - - - - - - - - - - - - - (59,677) (59,677)
Balances at December 31, 2014 5,694,600 6,911,044 5,376,176 469,540 (1,577,075) 14,627 35,533 (708,448) (315,444) (277,293) (1,496,305) 94,995,596 (1,178,397) 107,944,154 26,990,810 134,934,964
Attributable to owners of the parent

ABOITIZ EQUITY VENTURES, INC. AND SUBSIDIARIES
INTERIM CONDENSED CONSOLIDATED STATEMENTS OF CASH FLOWS(Amounts in thousands)
(Unaudited)
2015 2014 2015 2014
CASH FLOWS FROM OPERATING ACTIVITIES:
Income before income tax 12,712,424 14,441,151 6,098,998 7,361,823 Adjustments for: Interest expense 3,445,633 3,382,118 1,512,165 1,486,583 Depreciation and amortization 2,348,616 2,431,976 1,195,061 1,266,765 Net unrealized foreign exchange loss (gain) 198,265 (438,458) 211,166 (687,075) Provision for losses on investments & advances 13,937 13,937 -
Amortization of computer softwares and other intangibles 8,318 9,944 5,265 3,406 Write-off of project costs and others 228 - - - Gain on sale of investments in shares of stock - (518,277) - 115,697 Unrealized mark-to-market losses on derivatives - 257 - - Dividend income (332) (65) (332) (0) Gain on sale of property, plant & equipment (1,534) (7,126) (1,725) (6,829) Interest income (502,020) (224,226) (224,551) (96,621)
Share in net earnings of associates (2,242,038) (2,904,297) (1,132,720) (1,379,911)
Operating income before working capital changes 15,981,497 16,172,997 7,677,263 8,063,837 Decrease (increase) in operating assets 461,730 (129,180) (975,870) (1,614,164) Increase (decrease) in operating liabilities 3,340,191 (40,383) 1,079,295 1,765,971
Net cash generated from operations 19,783,418 16,003,434 7,780,688 8,215,644 Income and final taxes paid (2,094,041) (1,475,233) (1,679,653) (1,123,996)
Net cash flows from operating activities 17,689,377 14,528,201 6,101,035 7,091,648
CASH FLOWS FROM INVESTING ACTIVITIES:Cash dividends received 1,119,558 2,493,366 1,083,593 1,551,426 Interest received 532,833 242,894 321,844 109,307 Disposals of (additions to):
Investments in and advances to associates 289,492 (2,409,838) 289,491 (2,175,462) AFS investments 3,882 5,341 3,882 (1) Land and improvements (481,098) (276,166) 341,815 (190,523) Property, plant and equipment - net (10,213,263) (9,034,880) (6,649,424) (4,492,477)
Proceeds from sale of investments in shares of stock - 606,133 - - Increase in intangible assets (14,130) (16,569) (7,335) (10,839) Disposal of a subsidiary/ies (Acquisition through business combination), net of
cash disposed (acquired) (23,646) 254,344 (23,646) 1 Increase in noncurrent assets (723,252) (1,077,224) (237,725) (405,120)
Net cash flows used in investing activities (9,509,624) (9,212,599) (4,877,506) (5,613,688)
CASH FLOWS FROM FINANCING ACTIVITIES:Net proceeds from long-term debt 4,092,680 4,780,012 2,738,551 2,106,032 Payments of finance lease obligation (3,599,443) (3,439,605) (1,603,211) (1,711,262)
Cash dividends paid to non-controlling interest (3,634,521) (3,471,398) (3,135,308) (3,140,731) Net proceeds from bank loans 3,229,097 3,111,800 3,671,590 3,096,595
Interest paid (578,601) (443,830) (271,133) (133,746) Acquisition of non-controlling interests - (1,010,697) - (115,697)
Cash dividends paid to equity holders of the parent (6,153,470) (9,939,369) (6,153,470) (9,939,369) Re-issuance (Acquisition) of treasury shares 885,335 - 610,510 -
Net cash flows used in financing activities (5,758,923) (10,413,087) (4,142,471) (9,838,179) NET INCREASE (DECREASE) IN CASH AND CASH EQUIVALENTS 2,420,830 (5,097,485) (2,918,942) (8,360,218)
EFFECT OF FOREIGN EXCHANGE RATE CHANGES ON CASH & CASH
EQUIVALENTS 21,808 (24,488) 23,779 (39,861)
CASH AND CASH EQUIVALENTS AT BEGINNING OF PERIOD 50,481,566 36,118,190 55,819,367 39,396,296
CASH AND SHORT-TERM INVESTMENTS AT END OF PERIOD 52,924,204 30,996,217 52,924,204 30,996,217
For the six months ended June 30 For the quarter ended June 30

ABOITIZ EQUITY VENTURES, INC. AND SUBSIDIARIES
CONSOLIDATED FINANCIAL STATEMENTS SCHEDULES AND DISCLOSURES(Amounts in Thousands, Except Earnings per Share and Exchange Rate Data and When Otherwise Indicated)
A. Components of Revenues, Costs & Expenses, and Other Comprehensive Income
1. Revenues
2015 2014 2015 2014Sale of:
Power and electricity 41,948,981 43,989,504 21,290,920 23,352,544 Goods 10,425,569 7,681,573 5,247,924 3,849,869
Real estate 1,266,149 1,344,767 672,350 665,415 Fair value of swine 959,583 949,466 508,582 523,515 Service fees 410,506 320,732 294,246 179,654 Others 60,551 44,520 28,174 19,191
55,071,339 54,330,562 28,042,196 28,590,187
2. Costs & Expenses
2015 2014 2015 2014Cost of generated and purchased power 23,943,484 26,669,651 12,424,123 18,141,018 Cost of goods sold 8,809,346 6,613,939 4,302,015 3,280,664 Operating expenses 8,499,509 7,314,006 4,702,762 346,381 Cost of real estate sales 719,278 883,861 369,062 443,349
41,971,617 41,481,457 21,797,962 22,211,412
3. Other Comprehensive Income
2015 2014Available-for-sale financial assets:
Net unrealized valuation gains arising during the period 14,714 2,294
Less: Reclassification adjustments for losses included in profit or loss 0 14,714 0 2,294
Share in movement in net unrealized mark-to-market gains (losses) on AFS investments of an associate (525,138) 1,044,299
Movement in actuarial gains on defined benefit plans 10,144 60,420
Exchange differences in translating foreign currency-denominated transactions 11,747 (43,771)
Share in movement in actuarial losses on defined benefit plans of associates (6,922) (99,695)
Share in movement in cumulative translation adjustments of associates (8,206) (16,575)
(503,661) 946,972
Income tax relating to components of other comprehensive income (loss) (966) 11,783
Other comprehensive income (loss) for the period (504,627) 958,755
B. Tax Effects Relating to Each Component of Other Comprehensive Income
Before-Tax
Amount
Tax (Expense)
Benefit
Net-of-Tax
Amount
Available-for-sale financial assets:
Net unrealized valuation gains arising during the period 14,714 14,714
Share in movement in net unrealized mark-to-market losses on AFS investments of an associate (525,138) (525,138) Movement in actuarial gains on defined benefit plans 10,144 (3,043) 7,101 Exchange differences in translating foreign currency-denominated transactions 11,747 11,747
Share in movement in actuarial losses on defined benefit plans of associates (6,922) 2,077 (4,845)
Share in movement in cumulative translation adjustments of associates (8,206) (8,206)
Other comprehensive loss for the period (503,661) (966) (504,627)
Before-Tax
Amount
Tax (Expense)
Benefit
Net-of-Tax
Amount
Available-for-sale financial assets:
Net unrealized valuation gains arising during the period 2,294 2,294
Share in movement in net unrealized mark-to-market gains on AFS investments of an associate 1,044,299 1,044,299 Movement in actuarial gains on defined benefit plans 60,420 (18,126) 42,294 Exchange differences in translating foreign currency-denominated transactions (43,771) (43,771)
Share in movement in actuarial losses on defined benefit plans of associates (99,695) 29,908 (69,787)
Share in movement in cumulative translation adjustments of associates (16,575) (16,575)
Other comprehensive income for the period 946,972 11,782 958,754
For the six months ended June 30, 2015
For the six months ended June 30, 2014
For the six months ended
June 30
For the quarter ended
June 30
For the six months ended
June 30
For the quarter ended
June 30
For the six months ended June 30

C. Investments and Advances
June 30, 2015 December 31, 2014
Acquisition cost:Balance at beginning of period 29,191,049 27,968,228Additions during the period - 1,502,520Disposals during the period - -279,699Balance at end of period 29,191,049 29,191,049
Accumulated equity in net earnings:Balance at beginning of period 24,628,963 23,143,839Share in net earnings for the period 2,242,038 7,244,240Disposals during the period – 4,081Dividends received or receivable (1,119,226) (5,763,197) Balance at end of period 25,751,775 24,628,963
Gain on dilution 1,014,136 1,014,137 Share in net unrealized mark-to-market losses on AFS investment of an
associate (1,993,870) (1,468,733) Share in cumulative translation adjustments of associates (375,489) (375,489) Share in actuarial losses on retirement benefit plans of associates (364,309) (359,464)
53,223,292 52,630,463Advances to associates 28,087 317,578Investments in associates at equity 53,251,379 52,948,041Less allowance for impairment loss 680,731 680,731
52,570,648 52,267,310
% OwnershipNature of Business June 30, 2015
Manila-Oslo Renewable Enterprise, Inc. Holding company 83.33 SN Aboitiz Power-Magat, Inc. (SNAP-Magat) Power generation 50.00 SN Aboitiz Power-Benguet, Inc. (SNAP-Benguet) Power generation 50.00 East Asia Utilities Corporation Power generation 50.00 Accuria, Inc. * Holding company 49.54 Hijos de F. Escaño, Inc. Holding company 46.73 Union Bank of the Philippines (UBP) Banking 47.43 San Fernando Electric Light & Power Co., Inc. Power distribution 43.78 Pampanga Energy Ventures, Inc. Holding company 42.84 STEAG State Power, Inc. Power generation 34.00 Cebu Energy Development Corp. Power generation 26.40 Redondo Peninsula Energy, Inc. * Power generation 25.00 Southern Philippines Power Corporation Power generation 20.00 Western Mindanao Power Corporation Power generation 20.00 Cebu District Property Enterprise, Inc. Real estate 50.00
* No commercial operations.
D. Trade and Other Payables
June 30, 2015 December 31, 2014
Trade 10,726,282 8,052,295
Others 8,412,654 7,579,270
19,138,936 15,631,565
Trade payables are non-interest bearing and are usually on 30-90 days’ terms.
Others include nontrade payables, insurance liabilities, accrued taxes and fees, withholding taxes and other accrued
expenses, and are generally payable within 12 months from the balance sheet date.
Investees and the corresponding equity ownership of Aboitiz Equity Ventures, Inc. (AEV) and its subsidiaries (the Group) are as follows:

E. Bank Loans
Interest Rate Amount Interest Rate Amount
Financial institutions - unsecured:Peso loans 2.4% - 2.8% 10,419,867 1.9% - 3.5% 7,343,700 US dollar loans 1.9% - 2.5% 446,391 - Vietnamese Dong loans 4.4% 194,900 -
11,061,158 7,343,700
F. Long-term Debts
Interest Rate Amount Interest Rate Amount
Company:
Financial and non-financial institutions - unsecured 4.41% - 5.23% 9,188,000 4.41% - 5.23% 9,188,000 Subsidiaries:
Therma South, Inc. (TSI)
Financial institution - secured 4.5% - 5.14% 24,000,000 4.5% - 6.43% 24,000,000
Aboitiz Power Corporation (AP)
Financial and non-financial institutions - unsecured 5.21% - 6.10% 10,000,000 5.21% - 6.10% 10,000,000 Visayan Electric Company, Inc.
Financial and non-financial institutions- unsecured 3.5% - 4.81% 1,792,000 3.5% - 4.81% 1,792,000 Luzon Hydro Corporation
Financial institution - secured 2% - 2.75% 1,643,531 2.00% - 2.75% 1,728,428 Pilmico Foods Corporation
Financial institutions - secured 5.19% - 5.65% 2,372,000 5.35% - 5.65% 1,372,000 Davao Light & Power Co., Inc.
Financial institutions - unsecured 3.50% - 4.81% 1,344,000 3.50% - 4.81% 1,344,000
Aseagas CorporationFinancial institution - secured 4.78% - 5.06% 1,492,864 4.89% - 5.06% 995,106
Pilmico Animal Nutrition CorporationFinancial institution - secured 5.02% - 6.47% 1,650,000 6.47% 950,000
AboitizLand, Inc.
Financial institutions:
Peso - unsecured 7.56% - 7.68% 584,000 7.56% - 7.68% 585,404 Peso - secured 4.67% - 6.89% 165,000 4.67% - 6.89% 187,500 US Dollar - secured 1.31% - 1.59% 126,781 1.31% - 1.59% 131,208
Hedcor, Inc.
Financial institution - secured 5.25% 783,000 5.25% 810,000 Cebu Praedia Development Corporation
Financial institutions - unsecured 4.12% - 5.11% 540,000 4.12% - 5.11% 540,000 Subic Enerzone Corporation
Financial institutions - unsecured 5.61% - 6.06% 395,500 5.61% - 6.06% 395,500 Cotabato Light & Power Co., Inc.
Financial institution - unsecured 3.50% to 4.81% 268,800 3.50% - 4.81% 268,800 Joint Operation
Pagbilao Energy CorporationFinancial institution - secured 4.70% to 6.68% 5,223,500 4.70% - 6.68% 3,173,501
Total 61,568,976 57,461,447Less deferred financing costs 718,986 739,463
60,849,990 56,721,984Less current portion 2,880,868 2,907,302
57,969,122 53,814,682
G. Debt Securities
Issuer Interest Rate Amount
AEV 4.4125% p.a. 6,200,000
AEV 4.6188% p.a. 1,800,000
AP 5.21%/p.a. 6,634,370
AP 6.10%/p.a. 3,365,630
H. Earnings Per Common Share
Earnings per common share amounts were computed as follows:
Jan-Jun 2015 Jan-Jun 2014
a. Net income attributable to equity holders of the parent 7,821,288 9,485,132
b. Weighted average number of common shares issued and outstanding 5,551,617 5,521,872
Earnings per share (a/b) 1.409 1.718
June 30, 2015 December 31, 2014
June 30, 2015 December 31, 2014
7-year bonds to mature on November 21, 2020
10-year bonds to mature on November 21, 2023
10-year bonds to mature on September 10, 2021
12-year bonds to mature on September 10, 2026
As of June 30, 2015 and December 31, 2014, AEV and Aboitiz Power Corporation (AP) registered and issued peso-denominated fixed-rate retail
bonds totalling P18.0 billion under the following terms:
Maturity

I. Operating Segment Information
Operating segments are components of the Group that engage in business activities from which they may earn revenues and incur
expenses, whose operating results are regularly reviewed by the Group’s Chief Operating Decision Maker (CODM) to make decisions
about how resources are to be allocated to the segment and assess their performances, and for which discrete financial information
is available.
For purposes of management reporting, the Group’s operating businesses are organized and managed separately according to
services provided, with each segment representing a strategic business segment. The Group’s identified operating segments, which
are consistent with the segments reported to the Board of Directors (BOD), which is the Group’s CODM, are as follows:
• power segment, which is engaged in power generation and sale of electricity;
• food manufacturing segment, which is engaged in the production of flour and feeds and swine breeding;
• financial services segment, which is engaged in banking and money remittace operations;
• real estate segment, which is engaged in real property development for sale and lease; and
• the parent company and others, which includes the operations of the Company and the service provider subsidiaries that cater
mainly to the Group.
The Group has only one geographical segment as the bulk of its assets are located in the Philippines. The Group operates and
derives principally all of its revenue from domestic operations. Thus, geographical business information is not required.
Management monitors the operating results of its segments separately for the purpose of making decisions about resource
allocation and performance assessment. Segment revenue and segment expenses are measured in accordance with Philippine
Financial Reporting Standards (PFRS). The presentation and classification of segment revenue and segment expenses are consistent
with the consolidated statement of income. Interest expense and financing charges, depreciation and amortization expense and
income taxes are managed on a per segment basis.
The Group has inter-segment revenues in the form of management fees as well as inter-segment sales of electricity which are
eliminated in consolidation. The transfers are accounted for at competitive market prices on an arm’s-length transaction basis.
Segment assets do not include deferred income tax assets, pension asset and other noncurrent assets. Segment liabilities do not
include deferred income tax liabilities, income tax payable and pension liability. Adjustments as shown below include items not
presented as part of segment assets and liabilities.
Revenue is recognized to the extent that it is probable that economic benefits will flow to the Group, and that the revenue
can be reliably measured.

Financial information on the operations of the various business segments are summarized as follows:
Power Financial Services
Food
Manufacturing Real Estate
Parent Company
and Others Eliminations Consolidated
REVENUES
Third parties 42,054,748 - 11,385,152 1,218,151 413,288 - 55,071,339
Inter-segment 51,217 - - - 68,735 (119,952) -
Total revenue 42,105,965 - 11,385,152 1,218,151 482,023 (119,952) 55,071,339
RESULTS
Segment results 11,727,493 - 1,300,889 252,451 (181,111) - 13,099,722
Unallocated corporate income
(expenses) 250,913 - 22,192 11,968 29,203 - 314,276
INCOME FROM OPERATIONS 13,413,998
Interest Expense (3,084,828) - (107,759) (29,195) (223,851) - (3,445,633)
Interest Income 395,777 - 18,564 19,503 68,176 - 502,020
Share in net earnings of associates 1,378,174 866,437 - (826) 7,324,784 (7,326,530) 2,242,038
Provision for Income tax (2,014,733) - (342,355) (21,801) (7,360) - (2,386,249)
NET INCOME 10,326,174
OTHER INFORMATION - as of June 30, 2015
Segment assets 55,325,177 - 8,704,817 6,083,127 11,239,938 - 81,353,059
Investments and advances 25,811,777 25,589,650 - 1,491,203 83,777,399 (84,099,381) 52,570,648
Unallocated corporate assets 141,961,906 - 4,719,445 6,538,225 6,040,403 516,015 159,775,994
Consolidated total assets 293,699,701
Segment liabilities 128,687,249 - 8,257,519 4,620,259 12,432,271 25,739 154,023,037
Unallocated corporate liabilities 2,841,462 - 266,989 466,570 25,749 - 3,600,770
Consolidated total liabilities 157,623,807
Capital expenditures (10,213,263)
Depreciation and amortization 2,064,820 - 205,338 14,374 72,402 - 2,356,934
January - June 30, 2015

Power Financial Services
Food
Manufacturing Real Estate
Parent Company
and Others Eliminations Consolidated
REVENUES
Third parties 44,070,412 - 8,631,039 1,317,157 311,954 - 54,330,562
Inter-segment 45,242 - - - 133,004 (178,246) -
Total revenue 44,115,654 - 8,631,039 1,317,157 444,958 (178,246) 54,330,562
RESULTS
Segment results 11,742,896 - 950,031 221,793 (65,615) - 12,849,105
Unallocated corporate income (expenses) 1,274,274 - 15,788 (110,406) 665,985 - 1,845,641
INCOME FROM OPERATIONS 14,694,746
Interest Expense (3,014,727) - (74,948) (29,403) (263,040) - (3,382,118)
Interest Income 182,878 - 5,351 8,913 27,084 - 224,226
Share in net earnings of associates 1,401,245 1,503,587 - - 7,665,446 (7,665,981) 2,904,297
Provision for Income tax (2,013,881) - (248,398) (15,600) (751) - (2,278,630)
NET INCOME 12,162,521
OTHER INFORMATION - as of December 31, 2014
Segment assets 56,726,089 - 7,968,619 6,607,461 7,903,047 (324,504) 78,880,712
Investments and advances 24,816,278 26,307,238 - 1,492,028 83,851,069 (84,199,303) 52,267,310
Unallocated corporate assets 135,218,653 - 3,470,332 5,745,741 5,413,896 (88) 149,848,534
Consolidated total assets 280,996,556
Segment liabilities 118,420,852 – 8,497,988 4,409,160 12,027,494 (298,739) 143,056,755
Unallocated corporate liabilities 2,259,729 – 148,637 546,087 50,384 – 3,004,837
Consolidated total liabilities 146,061,592
Capital expenditures (9,034,880)
Depreciation and amortization 2,208,956 - 166,064 5,448 61,452 - 2,441,920
January - June 30, 2014
January - June 30, 2014

J. Financial Risk Management Objectives and Policies
The Group’s principal financial instruments comprise cash and cash equivalents, AFS investments, bank loans, long-
term debt, obligations under finance lease and non-convertible, cumulative, redeemable preferred shares. The main
purpose of these financial instruments is to raise finances for the Group’s operations and its investments in existing
subsidiaries and associates and in new projects. The Group has other financial assets and liabilities such as trade and
other receivables, trade and other payables and customer deposits which arise directly from operations.
The Group also enters into derivative transactions, particularly foreign currency forwards, to economically hedge its
foreign currency risk from foreign currency denominated liabilities and purchases.
Interest rate risk
The Group’s exposure to market risk for changes in interest rates relates primarily to its long-term debt obligations.
To manage this risk, the Group determines the mix of its debt portfolio as a function of the level of current interest
rates, the required tenor of the loan, and the general use of the proceeds of its various fund raising activities. As of
June 30, 2015, 2.90% of the Group’s long-term debt had floating interest rates ranging from 1.31% to 2.75%, and
97.10% are with fixed rates ranging from 3.50% to 7.68%. As of December 31, 2014, 3.26% of the Group’s long-term
debt had floating interest rates ranging from 1.31% to 2.75%, and 96.74% are with fixed rates ranging from 3.50% to
7.68%.
The following tables set out the carrying amounts, by maturity, of the Group’s financial instruments that are exposed
to interest rate risk:
Risk Management Structure
The BOD is mainly responsible for the overall risk management approach and for the approval of risk strategies and
principles of the Group.
Financial Risk Committee
The Financial Risk Committee has the overall responsibility for the development of risk strategies, principles,
frameworks, policies and limits. It establishes a forum of discussion of the Group’s approach to risk issues in order to
make relevant decisions.
Treasury Service Group
The Treasury Service Group is responsible for the comprehensive monitoring, evaluating and analyzing of the Group’s
risks in line with the policies and limits.
The main risks arising from the Group’s financial instruments are interest rate risk resulting from movements in
interest rates that may have an impact on outstanding long-term debt; credit risk involving possible exposure to
counter-party default on its cash and cash equivalents, AFS investments and trade and other receivables; liquidity risk
in terms of the proper matching of the type of financing required for specific investments; and foreign exchange risk in
terms of foreign exchange fluctuations that may significantly affect its foreign currency denominated placements and
borrowings.
Market Risk
The risk of loss, immediate or over time, due to adverse fluctuations in the price or market value of instruments,
products, and transactions in the Group’s overall portfolio (whether on or off-balance sheet) is market risk. These are
influenced by foreign and domestic interest rates, foreign exchange rates and gross domestic product growth.

As of June 30, 2015
Less than 1 year 1-5 years
More than 5
years Total
Long-term debtsFloating rate 246,868 1,360,359 155,327 1,762,554 Fixed rate 2,634,000 14,981,365 41,472,071 59,087,436
2,880,868 16,341,724 41,627,398 60,849,990
As of December 31, 2014
Less than 1 year 1-5 years More than 5 years Total
Long-term debtsFloating rate 243,658 1,354,664 252,436 1,850,758 Fixed rate 2,663,644 5,735,424 46,472,158 54,871,226
2,907,302 7,090,088 46,724,594 56,721,984
The interest expense and other finance charges recognized according to source are as follows:
January-June
2015
January-June
2014Finance lease obligation 2,560,377 2,769,849 Bank loans and long-term debt 786,432 533,675 Customers’ deposits 24,052 1,501 Other long-term obligations 74,772 77,093
3,445,633 3,382,118
Increase
(decrease) in
basis points
Effect on income
before tax
June 30, 2015 200 (17,481)
(100) 8,740
June 30, 2014 200 (19,342)
(100) 9,671
Interest on financial instruments classified as floating rate is repriced at intervals of less than one year. Interest on
financial instruments classified as fixed rate is fixed until the maturity of the instrument. The other financial
instruments of the Group that are not included in the above tables are non-interest-bearing and are therefore not
subject to interest rate risk. The Group’s derivative assets and liabilities are subject to fair value interest rate risk.
The following table demonstrates the sensitivity to a reasonably possible change in interest rates, with all other
variables held constant, of the Group’s income before tax (through the impact on floating rate borrowings):
The Group’s sensitivity to an increase/decrease in interest rates pertaining to derivative instruments is expected to be
insignificant due to their short-term maturities and immateriality relative to the total assets and liabilities of the
Group.
There is no other impact on the Group’s equity other than those already affecting the consolidated statements of
income.

US Dollar
Philippine Peso
equivalent1 US Dollar
Philippine Peso
equivalent2
Loans and receivables:Cash and cash equivalents $ 91,375 4,120,108 $ 57,659 2,578,504Trade and other receivables 1,513 68,239 7,482 334,588AFS investments 196 8,838 - -
Total financial assets 93,084 4,197,185 65,141 2,913,092
Other financial liabilities:
Bank loans3 14,222 641,291 - -Trade and other payables 2,806 126,523 16,983 759,470Long-term debt 39,090 1,762,554 41,385 1,850,758
Finance lease obligation 601,843 27,137,101 614,635 27,486,477
Total financial liabilities 657,961 29,667,469 673,003 30,096,705
Total net financial liabilities $ (564,877) (25,470,284) $ (607,862) (27,183,613)1USD1 = P45.0902USD1 = P44.7203The original currency of these loans is Vietnamese Dong.
Effect on income
before tax
June 30, 2015
US Dollar denominated accounts (1,273,514)
US Dollar denominated accounts 1,273,514
December 31, 2014
US Dollar denominated accounts (1,359,181)
US Dollar denominated accounts 1,359,181 US Dollar weakens by 5%
Foreign exchange risk
The foreign exchange risk of the Group pertains significantly to its foreign currency denominated borrowings,
including obligations under finance lease. To mitigate the risk of incurring foreign exchange losses, foreign currency
holdings are matched against the potential need for foreign currency in financing equity investments and new
projects. As of June 30, 2015 and December 31, 2014, foreign currency denominated borrowings account for 23.53%
and 24.75%, respectively, of total consolidated borrowings.
June 30, 2015 December 31, 2014
The following table demonstrates the sensitivity to a reasonably possible change in the US dollar exchange rates, with
all other variables held constant, of the Group’s income before tax as of:
Equity price risk
Equity price risk is the risk that the fair value of traded equity instruments decrease as the result of the changes in the
levels of equity indices and the value of the individual stocks.
As of June 30, 2015 and December 31, 2014, the Group’s exposure to equity price risk is minimal.
The increase in US dollar rate represents the depreciation of the Philippine peso while the decrease in US dollar rate
represents appreciation of the Philippine peso.
There is no other impact on the Group’s equity other than those already affecting the consolidated statement of
income.
US Dollar strengthens by 5%
US Dollar weakens by 5%
US Dollar strengthens by 5%
Increase/ (decrease)
in US Dollar

Cash and cash equivalents and trade and other receivables, which are all short-term in nature, have balances of
P52.92 billion and P16.06 billion as of June 30, 2015 and P50.48 billion and P16.64 billion as of December 31, 2014,
respectively. These financial assets will be used to fund short-term and operational liquidity needs of the Group.
In managing its long-term financial requirements, the policy of the Group, is that not more than 25% of long term
borrowings should mature in any twelve-month period. As of June 30, 2015 and December 31, 2014, the portion of
the total long-term debt, inclusive of customers’ deposits, that will mature in less than one year is 4.02% and 4.17%,
respectively. For its short-term funding, the policy of the Group is to ensure that there are sufficient working capital
inflows to match repayments of short-term debt.
Credit risk
For its cash investments, AFS investments and receivables, the Group’s credit risk pertains to possible default by the
counterparty, with a maximum exposure equal to the carrying amount of these assets. With respect to cash and AFS
investments, the risk is mitigated by the short-term and or liquid nature of its cash investments mainly in bank
deposits and placements, which are placed with financial institutions of high credit standing. With respect to
receivables, credit risk is controlled by the application of credit approval, limit and monitoring procedures. It is the
Group’s policy to enter into transactions with a diversity of credit-worthy parties to mitigate any significant
concentration of credit risk. The Group ensures that sales are made to customers with appropriate credit history and
has internal mechanism to monitor the granting of credit and management of credit exposures.
Liquidity risk
Liquidity risk is the risk that an entity in the Group will be unable to meet its obligations as they become due. The
Group manages liquidity risk by effectively managing its working capital, capital expenditure and cash flows, making
use of a centralized treasury function to manage pooled business unit cash investments and borrowing requirements.
Currently, the Group is maintaining a positive cash position, conserving its cash resources through renewed focus on
working capital improvement and capital reprioritization. The Group meets its financing requirements through a
mixture of cash generated from its operations and short-term and long-term borrowings. Adequate banking facilities
and reserve borrowing capacities are maintained.
The Group is in compliance with all of the financial covenants per its loan agreements, none of which is expected to
present a material restriction on funding or its investment policy in the near future. The Group has sufficient undrawn
borrowing facilities, which could be utilized to settle obligations.
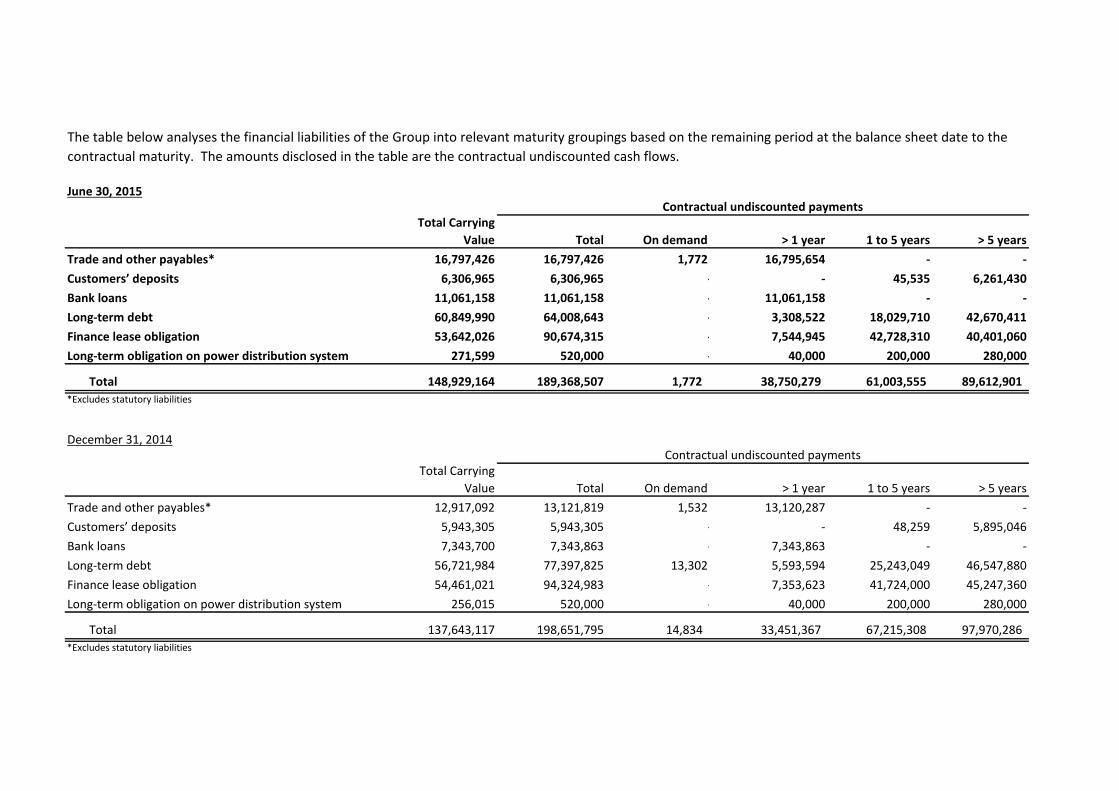
Total Carrying
Value Total On demand > 1 year 1 to 5 years > 5 years
Trade and other payables* 16,797,426 16,797,426 1,772 16,795,654
-
-
Customers’ deposits 6,306,965 6,306,965 - - 45,535 6,261,430
Bank loans 11,061,158 11,061,158 - 11,061,158
-
-
Long-term debt 60,849,990 64,008,643 - 3,308,522 18,029,710 42,670,411
Finance lease obligation 53,642,026 90,674,315 - 7,544,945 42,728,310 40,401,060
Long-term obligation on power distribution system 271,599 520,000 - 40,000 200,000 280,000
Total 148,929,164 189,368,507 1,772 38,750,279 61,003,555 89,612,901
*Excludes statutory liabilities
Total Carrying
Value Total On demand > 1 year 1 to 5 years > 5 years
Trade and other payables* 12,917,092 13,121,819 1,532 13,120,287
-
-
Customers’ deposits 5,943,305 5,943,305 - - 48,259 5,895,046
Bank loans 7,343,700 7,343,863 - 7,343,863
-
-
Long-term debt 56,721,984 77,397,825 13,302 5,593,594 25,243,049 46,547,880
Finance lease obligation 54,461,021 94,324,983 - 7,353,623 41,724,000 45,247,360
Long-term obligation on power distribution system 256,015 520,000 - 40,000 200,000 280,000
Total 137,643,117 198,651,795 14,834 33,451,367 67,215,308 97,970,286
*Excludes statutory liabilities
December 31, 2014Contractual undiscounted payments
The table below analyses the financial liabilities of the Group into relevant maturity groupings based on the remaining period at the balance sheet date to the
contractual maturity. The amounts disclosed in the table are the contractual undiscounted cash flows.
Contractual undiscounted paymentsJune 30, 2015

Gearing ratios of the Group as of June 30, 2015 and December 31, 2014 are as follows:
June 30, 2015 December 31, 2014
Bank Loans 11,061,158 7,343,700
Long-term obligations 114,492,016 111,183,005
Cash and cash equivalents (52,924,204) (50,481,566)
Net Debt (a) 72,628,970 68,045,139
Equity 136,075,894 134,934,964
Equity and Net Debt (b) 208,704,864 202,980,103
Gearing Ratio (a/b) 34.80% 33.52%
K. Financial Instruments
Fair Value of Financial Instruments
Capital management
Capital includes equity attributable to the equity holders of the parent. The primary objective of the Group’s capital
management is to ensure that it maintains a strong credit rating and healthy capital ratios in order to support its business
and maximize shareholder value.
The Group manages its capital structure and makes adjustments to it, in light of changes in economic conditions. To
maintain or adjust the capital structure, the Group may adjust the dividend payment to shareholders, return capital to
shareholders or issue new shares. The Group is not subject to any externally imposed capital requirements.
The Group monitors capital using a gearing ratio, which is net debt divided by equity plus net debt. The Group’s policy is to
keep the gearing ratio at 70% or below at the consolidated level. The Group determines net debt as the sum of interest-
bearing short-term and long-term obligations (comprised of long-term debt, obligations under finance lease, and payable to
preferred shareholder of a subsidiary) less cash and short-term deposits.
Certain entities within the Group that are registered with the Board of Investments are required to raise minimum amount
of capital in order to avail of their registration incentives. As of June 30, 2015 and December 31, 2014, these entities have
complied with this requirement as applicable.
No changes were made in the objectives, policies or processes during the periods ended June 30, 2015 and December 31,
2014.
A financial instrument is regarded as quoted in an active market if quoted prices are readily available from an exchange,
dealer, broker, pricing services or regulatory agency and those prices represent actual and regularly occurring market
transactions on an arm’s length basis. For a financial instrument with an active market, the quoted market price is used as
its fair value. On the other hand, if transactions are no longer regularly occurring even if prices might be available and the
only observed transactions are forced transactions or distressed sales, then the market is considered inactive. For a
financial instrument with no active market, its fair value is determined using a valuation technique (e.g. discounted cash
flow approach) that incorporates all factors that market participants would consider in setting a price.
Fair value is defined as the amount at which the financial instrument could be sold in a current transaction between
knowledgeable willing parties in an arm’s length transaction, other than in a forced liquidation or sale. Fair values are
obtained from quoted market prices, discounted cash flow models and option pricing models, as appropriate.

Carrying Fair Carrying FairAmount Value Amount Value
Financial liabilitiesFinance lease obligation 53,642,026 59,730,732 54,461,021 67,425,952Long-term debt - fixed rate 59,087,436 59,235,438 54,871,226 55,094,367 Long-term obligation on PDS 271,599 419,383 256,015 415,314
Total 113,001,061 119,385,553 109,588,262 122,935,633
Floating-rate borrowings. Since repricing of the variable-rate interest bearing loan is done on a quarterly basis, the carrying
value approximates the fair value.
The following methods and assumptions are used to estimate the fair value of each class of financial instruments:
June 30, 2015 December 31, 2014
The carrying amounts of cash and cash equivalents, trade and other receivables, and trade and other payables approximate
fair value due to the relatively short-term maturity of these financial instruments.
Cash and cash equivalents, trade and other receivables, bank loans and trade and other payables
Finance lease obligation. The fair value of the finance lease obligation was calculated by discounting future cash flows using
applicable interest rates. The disclosed fair value is determined using Level 3 inputs.
Fixed-rate borrowings. The fair value of fixed rate interest-bearing loans is based on the discounted value of future cash
flows using the applicable rates for similar types of loans. The disclosed fair value is determined using Level 3 inputs.
Customers’ deposits. The fair value of bill deposits approximates the carrying values as these deposits earn interest at the
prevailing market interest rate in accordance with regulatory guidelines. The timing and related amounts of future cash
flows relating to transformer and lines and poles deposits cannot be reasonably and reliably estimated for purposes of
establishing their fair values using an alternative valuation technique.
Long-term obligation on PDS. The fair value of the long-term obligations on power distribution system is calculated by
discounting expected future cash flows at prevailing market rates. The disclosed fair value is determined using Level 3
inputs.
The fair value is calculated by reference to prevailing interest rate differential and spot exchange rate as of valuation date,
taking into account its remaining term to maturity. The disclosed fair value is determined using Level 2 inputs.
The Group enters into non-deliverable short-term forward contracts with counterparty banks to manage its foreign
currency risks associated with foreign currency-denominated liabilities and purchases. It also enters into an interest rate
swap agreement to fully hedge its floating rate exposure on its foreign currency-denominated loan and par forward
contracts to hedge the floating rate exposure on foreign-currency denominated payments.
As of June 30, 2015 and December 31, 2014, the Group recognized net derivative assets relating to these contracts
amounting to P78.8 million and P112.5 million, respectively.
Redeemable preferred shares. The fair values of the redeemable preferred shares are based on the discounted value of
future cash flows using the applicable rates for similar types of borrowings.
Set out below is a comparison by category of carrying amounts and fair values of the Group’s financial instruments whose
fair values are different from their carrying amounts.
AFS investments. The fair values of AFS investments are based on quoted market prices, except for unquoted equity shares
which are carried at cost since fair values are not readily determinable.
Derivative financial instruments

June 30, 2015 December 31, 2014
At beginning of period 112,544 30,877
10,335 55,600
- (897)Fair value of settled instruments - 26,964 At end of period 122,879 112,544
fair value are observable, either directly or indirectly
Level 3: techniques which use inputs which have a significant effect on the recorded fair value
that are not based on observable market data
June 30, 2015Total Level 1 Level 2 Level 3
Carried at fair value:
AFS investments 245,022 245,022 - -
Derivative asset 122,879 - 122,879 -
Disclosed at fair value:
Obligations under finance lease 59,730,732 - - 59,730,732
Long-term debt - fixed rate 58,865,232 - - 58,865,232
Long-term obligation on PDS 419,383 - - 419,383
December 31, 2014
Total Level 1 Level 2 Level 3
Carried at fair value:
AFS investments 13,720 13,720 - -
Derivative asset 112,544 - 112,544 -
Disclosed at fair value:
Obligations under finance lease 67,425,952 - - 67,425,952
Long-term debt - fixed rate 55,094,367 - - 55,094,367
Long-term obligation on PDS 415,314 - - 415,314
The movements in fair value changes of all derivative instruments for the year ended June 30, 2015 and December 31,
2014 are as follows:
During the period ended June 30, 2015 and December 31, 2014, there were no transfers between level 1 and level 2 fair
value measurements and transfers into and out of level 3 fair value measurement.
Net changes in fair value of derivatives designated as accounting
hedges
The loss amounting to nil in 2015 and P0.9 million in 2014 from the net fair value changes relating to the forward contracts
is included as “Foreign exchange gains - net” under “Other income - net”. The changes in the fair value of the interest rate
swap designated as a cash flow hedge were deferred in equity under “Cumulative translation adjustments”.
Net changes in fair value of derivatives not designated as
accounting hedges
As of June 30, 2015, the Group held the following financial instruments that are measured and carried or disclosed at fair
value:
Level 1: quoted (unadjusted) prices in active markets for identical assets or liabilities
Level 2: other techniques for which all inputs which have a significant effect on the recorded
The Group uses the following hierarchy for determining and disclosing the fair value of financial instruments by valuation
technique:
Fair Value Hierarchy

L. Disclosures
1. Company Information
2. Basis of Financial Statement Preparation and Changes in Accounting Policies
Basis of Financial Statement Preparation
Changes in Accounting Policies
The accounting policies adopted are consistent with those of the previous financial year except for the new and revised PFRS and Philippine
Interpretations which the Group has adopted starting January 1, 2015. Except as otherwise indicated, adoption of the following new and amended PFRS
and Philippine Interpretations did not have any significant impact to the Group’s consolidated financial statements:
Amendment to PAS 19 requires an entity to consider contributions from employees or third parties when accounting for defined benefit plans.
Where the contributions are linked to service, they should be attributed to periods of service as a negative benefit. It clarifies that, if the amount of
the contributions is independent of the number of years of service, an entity is permitted to recognize such contributions as a reduction in the
service cost in the period in which the service is rendered, instead of allocating the contributions to the periods of service.
This amendment is not applicable to the Group since the entities in the Group have defined benefit plans which do not require contributions from
employees or third parties.
The Annual Improvements to PFRSs (2010-2012 cycle) are effective for annual periods beginning on or after January 1, 2015 and are not expected to
have a material impact on the Group. They include:
This improvement is applied prospectively and clarifies various issues relating to the definitions of performance and service conditions which are
vesting conditions, including:
a. A performance condition must contain a service condition
b. A performance target must be met while the counterparty is rendering service
c. A performance target may relate to the operations or activities of an entity, or to those of another entity in the same group
d. A performance condition may be a market or non-market condition
e. If the counterparty, regardless of the reason, ceases to provide service during the vesting period, the service condition is not satisfied.
Aboitiz Equity Ventures, Inc. (the Company) was originally incorporated in the Philippines as Cebu Pan Asian Holdings, Inc. and registered with the
Securities and Exchange Commission on September 11, 1989. The Company changed its corporate name to the present one on December 29, 1993 and
its ownership was opened to the general public through an initial public offering of its shares on November 16, 1994.
The Company and its subsidiaries (collectively referred to as the “Group”) are engaged in various business activities mainly in the Philippines, including
power generation and distribution, food manufacturing, banking and financial services, and real estate development. The Company is the publicly-listed
holding and management company of the Group. The parent and the ultimate parent of the Company is Aboitiz & Company, Inc. (ACO).
The registered office address of the Company is 32nd Street, Bonifacio Global City, Taguig City, Metro Manila, Philippines.
The accompanying unaudited condensed consolidated financial statements include the accounts of the Company and its subsidiaries collectively referred
to as “Group”.
The unaudited condensed consolidated financial statements are prepared in compliance with Philippine Accounting Standard (PAS) 34, Interim Financial
Reporting. Accordingly, the unaudited condensed consolidated financial statements do not include all of the information and disclosures required in the
December 31, 2014 annual audited consolidated financial statements, and should be read in conjunction with the Group’s annual consolidated financial
statements as of and for the year ended December 31, 2014
The preparation of the financial statements in compliance with PFRS requires management to make estimates and assumptions that affect the amounts
reported in the financial statements and accompanying notes. The estimates and assumptions used in the accompanying unaudited condensed
consolidated financial statements are based upon management’s evaluation of relevant facts and circumstances as of the date of the unaudited
condensed consolidated financial statements. Actual results could differ from such estimates.
The unaudited condensed consolidated financial statements are presented in Philippine peso, the Group’s functional currency, and all values are
rounded to the nearest thousands, except for earnings per share and exchange rates and as otherwise indicated.
On July 28, 2015, the Audit Committee of the Board of Directors approved and authorized the release of the accompanying unaudited condensed
consolidated financial statements of Aboitiz Equity Ventures, Inc. and subsidiaries.
Annual Improvements to PFRSs (2010-2012 cycle)
• PFRS 3, Business Combinations - Accounting for Contingent Consideration in a Business Combination
• PAS 19, Employee Benefits - Defined Benefit Plans: Employee Contributions (Amendments)
• PFRS 2, Share-based Payment - Definition of Vesting Condition

The amendment is applied prospectively for business combinations for which the acquisition date is on or after July 1, 2014. It clarifies that a
contingent consideration that is not classified as equity is subsequently measured at fair value through profit or loss whether or not it falls within the
scope of PAS 39 (or PFRS 9, if early adopted). The Group shall consider this amendment for future business combinations.
• PFRS 8, Operating Segments - Aggregation of Operating Segments and Reconciliation of The Total of the
Reportable Segments’ Assets to the Entity’s Assets
a. An entity must disclose the judgments made by management in applying the aggregation criteria in the standard, including a brief description of
operating segments that have been aggregated and the economic characteristics (e.g., sales and gross margins) used to assess whether the
segments are “similar”.
b. The reconciliation of segment assets to total assets is only required to be disclosed if the reconciliation is reported to the chief operating decision
maker, similar to the required disclosure for segment liabilities.
• PAS 16, Property, Plant and Equipment, and PAS 38, Intangible Assets - Revaluation Method - Proportionate
Restatement of Accumulated Depreciation and Amortization
The amendment is applied retrospectively and clarifies that the asset may be revalued by reference to the observable data on either the gross or
the net carrying amount. In addition, the accumulated depreciation or amortization is the difference between the gross and carrying amounts of
the asset.
• PAS 16, Property, Plant and Equipment, and PAS 41, Agriculture - Bearer Plants (Amendments)
The amendments clarify the principle in PAS 16 and PAS 38 that revenue reflects a pattern of economic benefits that are generated from operating a
business (of which the asset is part) rather than the economic benefits that are consumed through use of the asset. As a result, a revenue-based
method cannot be used to depreciate property, plant and equipment and may only be used in very limited circumstances to amortize intangible
assets. The amendments are effective prospectively for annual periods beginning on or after January 1, 2016, with early adoption permitted. These
amendments are not expected to have any impact to the Group given that the Group has not used a revenue-based method to depreciate its non-
current assets.
• PAS 40, Investment PropertyThe amendment is applied prospectively and clarifies that PFRS 3, and not the description of ancillary services in PAS 40, is used to determine if the
transaction is the purchase of an asset or business combination. The description of ancillary services in PAS 40 only differentiates between
investment property and owner-occupied property (i.e., property, plant and equipment).
New Accounting Standards, Interpretations, and Amendments to Existing Standards Not Yet Effective as of January 11, 2015:
The Group will adopt the standards and interpretations enumerated below when these become effective. Except as otherwise indicated, the Group does
not expect the adoption of these new and amended PFRS and Philippine Interpretations to have significant impact on its financial statements.
• PAS 16, Property, Plant and Equipment, and PAS 38, Intangible Assets - Clarification of Acceptable Methods of
Depreciation and Amortization (Amendments)
• PAS 24, Related Party Disclosures - Key Management Personnel Services
Annual Improvements to PFRSs (2011-2013 cycle)
• PFRS 3, Business Combinations - Scope Exceptions for Joint Arrangements
The amendment is applied retrospectively and clarifies that a management entity, which is an entity that provides key management personnel
services, is a related party subject to the related party disclosures. In addition, an entity that uses a management entity is required to disclose the
expenses incurred for management services.
The Annual Improvements to PFRSs (2011-2013 cycle) are effective for annual periods beginning on or after January 1, 2015 and are not expected to
have any material impact on the Group. They include:
The amendments are applied retrospectively and clarify that:
• PFRS 13, Fair Value Measurement - Portfolio Exception
The amendment is applied prospectively and clarifies the following regarding the scope exceptions within PFRS 3:
a. Joint arrangements, not just joint ventures, are outside the scope of PFRS 3.
b. This scope exception applies only to the accounting in the financial statements of the joint arrangement itself.
The amendment is applied prospectively and clarifies that the portfolio exception in PFRS 13 can be applied not only to financial assets and financial
liabilities, but also to other contracts within the scope of PAS 39.

• PFRS 7, Financial Instruments: Disclosures - Servicing Contracts
PFRS 7 requires an entity to provide disclosures for any continuing involvement in a transferred asset that is derecognized in its entirety. The
amendment clarifies that a servicing contract that includes a fee can constitute continuing involvement in a financial asset. An entity must assess
the nature of the fee and arrangement against the guidance in PFRS 7 in order to assess whether the disclosures are required. The amendment is to
be applied such that the assessment of which servicing contracts constitute continuing involvement will need to be done retrospectively. However,
comparative disclosures are not required to be provided for any period beginning before the annual period in which the entity first applies the
amendments.
Annual Improvements to PFRSs (2012-2014 cycle)
• PFRS 5, Non-current Assets Held for Sale and Discontinued Operations - Changes in Methods of Disposal
PFRS 14 is an optional standard that allows an entity, whose activities are subject to rate-regulation, to continue applying most of its existing
accounting policies for regulatory deferral account balances upon its first-time adoption of PFRS. Entities that adopt PFRS 14 must present the
regulatory deferral accounts as separate line items in the balance sheets and present movements in these account balances as separate line items in
the statement of income and statement of other comprehensive income. The standard requires disclosures on the nature of, and risks associated
with, the entity’s rate-regulation and the effects of that rate-regulation on its financial statements. PFRS 14 is effective for annual periods beginning
on or after January 1, 2016. This standard is not applicable since the Group is an existing PFRS preparer.
The Annual Improvements to PFRSs (2012-2014 cycle) are effective for annual periods beginning on or after January 1, 2016 and are not expected to have any material
impact on the Group. They include:
The amendment is applied prospectively and clarifies that changing from a disposal through sale to a disposal through distribution to owners and
vice-versa should not be considered to be a new plan of disposal, rather it is a continuation of the original plan. There is, therefore, no interruption
of the application of the requirements in PFRS 5. The amendment also clarifies that changing the disposal method does not change the date of
classification.
• PFRS 11, Joint Arrangements - Accounting for Acquisitions of Interests in Joint Operations (Amendments)
• PFRS 14, Regulatory Deferral Accounts
• PFRS 10, Consolidated Financial Statements and PAS 28, Investments in Associates and Joint Ventures - Sale or
Contribution of Assets between an Investor and its Associate or Joint Venture
These amendments address an acknowledged inconsistency between the requirements in PFRS 10 and those in PAS 28 (2011) in dealing with the
sale or contribution of assets between an investor and its associate or joint venture. The amendments require that a full gain or loss is recognized
when a transaction involves a business (whether it is housed in a subsidiary or not). A partial gain or loss is recognized when a transaction involves
assets that do not constitute a business, even if these assets are housed in a subsidiary. These amendments are effective from annual periods
beginning on or after January 1, 2016.
The amendments to PFRS 11 require that a joint operator accounting for the acquisition of an interest in a joint operation, in which the activity of
the joint operation constitutes a business must apply the relevant PFRS 3 principles for business combinations accounting. The amendments also
clarify that a previously held interest in a joint operation is not remeasured on the acquisition of an additional interest in the same joint operation
while joint control is retained. In addition, a scope exclusion has been added to PFRS 11 to specify that the amendments do not apply when the
parties sharing joint control, including the reporting entity, are under common control of the same ultimate controlling party.
The amendments apply to both the acquisition of the initial interest in a joint operation and the acquisition of any additional interests in the same
joint operation and are prospectively effective for annual periods beginning on or after January 1, 2016, with early adoption permitted. The Group
shall consider these amendments if it enters into this type of arrangement in the future.
• PAS 27, Separate Financial Statements - Equity Method in Separate Financial Statements (Amendments)
The amendments change the accounting requirements for biological assets that meet the definition of bearer plants. Under the amendments,
biological assets that meet the definition of bearer plants will no longer be within the scope of PAS 41. Instead, PAS 16 will apply. After initial
recognition, bearer plants will be measured under PAS 16 at accumulated cost (before maturity) and using either the cost model or revaluation
model (after maturity). The amendments also require that produce that grows on bearer plants will remain in the scope of PAS 41 measured at fair
value less costs to sell. For government grants related to bearer plants, PAS 20, Accounting for Government Grants and Disclosure of Government
Assistance, will apply. The amendments are retrospectively effective for annual periods beginning on or after January 1, 2016, with early adoption
permitted. These amendments are not expected to have any impact to the Group as it does not have any bearer plants.
The amendments will allow entities to use the equity method to account for investments in subsidiaries, joint ventures and associates in their
separate financial statements. Entities already applying PFRS and electing to change to the equity method in its separate financial statements will
have to apply that change retrospectively. For first-time adopters of PFRS electing to use the equity method in its separate financial statements,
they will be required to apply this method from the date of transition to PFRS. The amendments are effective for annual periods beginning on or
after January 1, 2016, with early adoption permitted. These amendments will not have any impact on the Group’s consolidated financial
statements.

• PFRS 9, Financial Instruments (2014 or final version)
• PFRS 15, Revenue from Contracts with Customers
In July 2014, the final version of PFRS 9 was issued. PFRS 9 reflects all phases of the financial instruments project and replaces PAS 39 and all
previous versions of PFRS 9. The standard introduces new requirements for classification and measurement, impairment, and hedge accounting.
PFRS 9 is effective for annual periods beginning on or after January 1, 2018, with early application permitted. Retrospective application is required,
but comparative information is not compulsory. Early application of previous versions of PFRS 9 is permitted if the date of initial application is
before February 1, 2015.
The adoption of PFRS 9 will have an effect on the classification and measurement of and impairment methodology for the Group’s financial assets,
and on its application of hedge accounting. However, it will have no impact on the classification and measurement of its financial liabilities.
After evaluating the impact of PFRS 9 and considering that it will not have any significant effect on the Group’s operating results or financial
condition, management has decided not to early adopt the said standard. It will be implemented only when it becomes effective on January 1,
2018. Thus, the consolidated financial statements do not reflect the impact of this standard.
The following new standard issued by the International Accounting Standards Board (IASB) has not yet been adopted by the Philippine Financial Reporting Standards
Council (FRSC):
PFRS 15 was issued in May 2014 and establishes a new five-step model that will apply to revenue arising from contracts with customers. Under IFRS
15 revenue is recognised at an amount that reflects the consideration to which an entity expects to be entitled in exchange for transferring goods or
services to a customer. The principles in IFRS 15 provide a more structured approach to measuring and recognizing revenue. The new revenue
standard is applicable to all entities and will supersede all current revenue recognition requirements under IFRS. Either a full or modified
retrospective application is required for annual periods beginning on or after January 1, 2017 with early adoption permitted. The Group is currently
assessing the impact of IFRS 15 and plans to adopt the new standard on the required effective date once adopted locally.
• PAS 34, Interim Financial Reporting - Disclosure of Information “Elsewhere in the Interim Financial Report”
This amendment is applied prospectively and clarifies that market depth of high quality corporate bonds is assessed based on the currency in which
the obligation is denominated, rather than the country where the obligation is located. When there is no deep market for high quality corporate
bonds in that currency, government bond rates must be used.
The amendment is applied retrospectively and clarifies that the required interim disclosures must either be in the interim financial statements or
incorporated by cross-reference between the interim financial statements and wherever they are included within the greater interim financial
report (e.g., in the management commentary or risk report).
• PFRS 9, Financial Instruments - Hedge Accounting and Amendments to PFRS 9, PFRS 7 and PAS 39 (2013
version)
PFRS 9 (2013 version) already includes the third phase of the project to replace PAS 39 which pertains to hedge accounting. This version of PFRS 9
replaces the rules-based hedge accounting model of PAS 39 with a more principles-based approach. Changes include replacing the rules-based
hedge effectiveness test with an objectives-based test that focuses on the economic relationship between the hedged item and the hedging
instrument, and the effect of credit risk on that economic relationship; allowing risk components to be designated as the hedged item, not only for
financial items but also for non-financial items, provided that the risk component is separately identifiable and reliably measurable; and allowing the
time value of an option, the forward element of a forward contract and any foreign currency basis spread to be excluded from the designation of a
derivative instrument as the hedging instrument and accounted for as costs of hedging. PFRS 9 also requires more extensive disclosures for hedge
accounting.
PFRS 9 (2013 version) has no mandatory effective date. The mandatory effective date of January 1, 2018 was eventually set when the final version
of PFRS 9 was adopted by the FRSC. The adoption of the final version of PFRS 9, however, is still for approval by the BOA.
• PAS 19, Employee Benefits - Regional Market Issue Regarding Discount Rate
This amendment is applied retrospectively and clarifies that the disclosures on offsetting of financial assets and financial liabilities are not required
in the condensed interim financial report unless they provide a significant update to the information reported in the most recent annual report.
• PFRS 7, Financial Instruments: Disclosures - Applicability of the Amendments to PFRS 7 to Condensed Interim
Financial Statements

Basis of Consolidation
Nature of Business Direct Indirect Direct IndirectAboitiz Power Corporation (AP) and Subsidiaries Power 76.88 – 76.88 –
Aboitiz Energy Solutions, Inc. (AESI) Power – 100.00 – 100.00 Balamban Enerzone Corporation (BEZ) Power – 100.00 – 100.00 Lima Enerzone Corporation (LEZ) Power – 100.00 – 100.00 Mactan Enerzone Corporation (MEZ) Power – 100.00 – 100.00 Subic Enerzone Corporation (SEZ) Power – 100.00 – 100.00 Cotabato Light & Power Co., Inc. (CLP) Power – 99.94 – 99.94 Cotabato Ice Plant, Inc. Manufacturing – 100.00 – 100.00 Davao Light & Power Co., Inc. (DLP) Power – 99.93 – 99.93 Visayan Electric Company (VECO) Power – 55.26 – 55.26 Aboitiz Renewables Inc. (ARI) and Subsidiaries Power – 100.00 – 100.00
AP Renewables, Inc. (APRI) Power – 100.00 – 100.00 Hedcor, Inc. (HI) Power – 100.00 – 100.00 Hedcor Mt. Province, Inc. * Power – 100.00 – 100.00 Hedcor Benguet, Inc. (BHI) * Power – 100.00 – 100.00 Hedcor Bukidnon, Inc. * Power – 100.00 – 100.00 Hedcor Cordillera, Inc. * Power – 100.00 – 100.00 Hedcor Ifugao, Inc. * Power – 100.00 – 100.00 Hedcor Mabinay, Inc. * Power – 100.00 – 100.00 Hedcor Manolo Fortich, Inc. * Power – 100.00 – 100.00 Hedcor Sabangan, Inc. * Power – 100.00 – 100.00 Hedcor Sibulan, Inc. (HSI) Power – 100.00 – 100.00 Hedcor Tamugan, Inc. (HTI) * Power – 100.00 – 100.00 Hedcor Tudaya, Inc. (Hedcor Tudaya) Power – 100.00 – 100.00 Kookaburra Equity Ventures, Inc. Holding company – 100.00 – 100.00 Mount Apo Geopower, Inc. * Power – 100.00 – 100.00 Cleanergy, Inc. (CI) * Power – 100.00 – 100.00 Hydro Electric Development Corporation Power – 99.97 – 99.97 Luzon Hydro Corporation (LHC) Power – 100.00 – 100.00 Bakun Power Line Corporation * Power – 100.00 – 100.00 AP Solar Tiwi, Inc. * Power – 100.00 – 100.00 Cordillera Hydro Corporation (CHC) * Power – 100.00 – 100.00 Negron Cuadrado Geopower, Inc. (NCGI) * Power – 100.00 – 100.00 Tagoloan Hydro Corporation * Power – 100.00 – 100.00
Therma Power, Inc. (TPI) and Subsidiaries Power – 100.00 – 100.00 Abovant Holdings, Inc. (AHI) Power – 60.00 – 60.00 Therma Power Visayas, Inc. (TPVI) * Power – 100.00 – 100.00 Therma Luzon, Inc. (TLI) Power – 100.00 – 100.00 Therma Marine, Inc. (Therma Marine) Power – 100.00 – 100.00 Therma Mobile, Inc.(Therma Mobile) Power – 100.00 – 100.00 Therma South, Inc. (TSI) * Power – 100.00 – 100.00 Therma Central Visayas, Inc. (TCVI) * Power – 100.00 – 100.00 Therma Southern Mindanao, Inc .(TSMI) * Power – 100.00 – 100.00 Therma Subic, Inc. (Therma Subic) * Power – 100.00 – 100.00 Therma Visayas, Inc. (TVI) * Power – 80.00 – 80.00
Adventenergy, Inc. (AI) Power – 100.00 – 100.00 Cebu Private Power Corporation (CPPC) Power – 60.00 – 60.00 Prism Energy, Inc. (PEI) * Power – 60.00 – 60.00 Pilmico Foods Corporation (PILMICO) and Subsidiaries Food manufacturing 100.00 – 100.00 –
Fil-Agri Holdings, Inc. Holding company – 100.00 – 100.00 Pilmico Animal Nutrition Corporation (PANC) Food manufacturing – 100.00 – 100.00 Fil-Agri, Inc. Real Estate – 100.00 – 100.00
AboitizLand, Inc. (AboitizLand) and Subsidiaries Real estate 100.00 – 100.00 –Cebu Industrial Park Developers, Inc. (CIPDI) Real estate – 60.00 – 60.00 Misamis Oriental Land Development, Inc. (MOLDC) Real estate – 60.00 – 60.00 Propriedad del Norte, Inc. (PDNI) Real estate – 100.00 – 100.00 Lima Land, Inc (LLI) and Subsidiaries Real estate – 100.00 – 100.00 Lima Water Corporation (LWC) Water – 100.00 – 100.00
AEV International Pte. Ltd and Subsidiary (AEV International) Holding company 100.00 – 100.00 –Pilmico International Pte. Ltd and Subsidiary (Pilmico International) Holding company – 100.00 – 100.00 Pilmico VHF Joint Stock Company (formerly Vinh Hoan 1 Feed Food manufacturing – 100.00 – 100.00
Joint Stock Company)Archipelago Insurance Pte Ltd (AIPL) Insurance 100.00 – 100.00 –
Aseagas Corporation (Aseagas) * Biogas Manufacturing 100.00 – 100.00 –AEV Aviation, Inc. (AEV Aviation) Service 73.31 26.69 73.31 26.69AEV Properties, Inc. * Real estate 100.00 – 100.00 –Cebu Praedia Development Corporation (CPDC) Real estate 100.00 – 100.00 –Petnet, Inc. Financial services 51.00 – – –
Apo Agua Infrastructura, Inc. *
Services (supplier of
bulk water) 70.00 – – –
December 31, 2014 June 30, 2015
The consolidated financial statements include the financial statements of the Company and the subsidiaries listed in the following table.

*No commercial operations as of June 30, 2015 and December 31, 2014.

3. Seasonality of Interim Operations
4. Property, Plant and Equipment, Land and Improvements and Investment Properties
Estimated costs to
complete Project Company (in millions)
Therma Visayas 34,996 3%PEC 17,563 21%Hedcor Bukidnon 10,994 3%Therma South 3,591 89%
5. Material Events and Changes
a. Dividend Declaration
b. Bidding for LRT Line 2 System and the Masinag Extension System Project
c. Bidding for Laguna Lake Expressway-Dike Project
d. Signing of Contractual Joint Venture and Bulk Water Purchase Agreements
e. BOD Approval for Issuance of Fixed-Rate Retail Bonds
On January 27, 2015, the Company submitted the pre-qualification documents to the Department of Transportation and Communication (DOTC) for
the bidding of the operation and maintenance of the existing LRT Line 2 (LRT2) system and the Masinag Extension system (the "Project"). The
Company is participating in the bidding through a consortium referred to as the Aboitiz-SMRT Transport Solutions Consortium, in partnership wth
SMRT International Pte. Ltd.
On February 27, 2015, AEV through Team Trident consortium, filed the pre-qualification documents with the Department of Public Work and
Highways (DPWH) for the bidding to finance, design, construct, operate and maintain the Laguna Lake Expressway-Dike Project under the Public
Private Partnership (PPP) Program of the government. Team Trident is a consortium among AEV, Ayala Land, Inc. (ALI), Megaworld Corporation
(MEG), SM Prime Holdings, Inc. (SMPH) and the lead member, Trident Infrastructure and Development Corporation (TIDC). TIDC is a joint venture
(JV) company among AEV, ALI, MEG and SMPH incorporated for purposes of pre-qualifying for the bidding and evaluating the feasibility of the
Project.
On March 17, 2015 , AEV was informed by Apo Agua Infrastructura, Inc. (Apo Agua) that it signed the contractual JV agreement and bulk water
purchase agreement (BWPA) with Davao City Water District (DCWD). Under the BWPA, Apo Agua committed to supply treated bulk water of up to
300 million liters per day to DCWD from a facility that will be powered by a hydroelectric power plant, a renewable energy facility. The agreements
are subject to conditions precedent that need to be satisfied.
Apo Agua is the JV company formed by AEV and J.V. Angeles Construction Corporation for the Tamugan Surface Water Development Project.
% of
completion
Operations of hydropower plants are generally affected by climatic seasonality. Seasonality and location have a direct effect on the level of precipitation.
In Luzon where rainy and summer seasons are more pronounced, higher rainfall is normally experienced in the months of June to September. As such, the
hydropower plants located in Luzon operate at their maximum capacity during this period. In contrast, the hydropower plants in Mindanao experience a
well-distributed rainfall throughout the year, with a slightly better precipitation during the months of December to April. This precipitation seasonality
greatly affects subsidiary companies HI, HSI, HTI and LHC, which operate ‘run-of-river’ hydropower plants since these plants do not have any means to
impound water.
Any unexpected change in the seasonal aspects will have no material effect on the Group's financial condition or results of operations.
During the first six months of 2015, additions to property, plant and equipment totalled P10.21 billion. While part of said increase is attributed to Power
Group's P942 million acquisition of distribution assets and CPDC's P655 million purchase of a piece of property, a significant portion of the remaining
balance relates to various projects under “Construction in progress” as of June 30, 2015, as shown below:
Power Group finished the construction of the Sabangan hydropower plant facility in the second quarter of 2015. For the current period, construction costs
for the various projects reached P8.08 billion, which includes capitalized borrowing costs amounting to P749 million.
Additions to land and improvements amounted to P481 million, representing AboitizLand's purchase of various lots for future development.
On March 10, 2015, the Board of Directors (BOD) of the Company approved the declaration of cash dividendS of P1.11 a share (P6.15 billion) to all
stockholders of record as of March 24, 2015, payable on April 20, 2015. Said dividend was declared out of AEV's unrestricted retained earnings as of
December 31, 2014.

f. Disruption in the commissioning schedule of Unit 2 of TSI's Davao coal power plant
g. Acquisition of 51% of PETNET, Inc.
h. Sale of AEV's Treasury Shares
Except for the above developments and as disclosed in some other portions of this report, no other significant events occurred that would have a
material impact on the registrant and its subsidiaries, and no other known trend, event or uncertainty came about that had or were reasonably
expected to have a material favorable or unfavorable impact on revenues or income from continuing operations, since the end of the most recently
completed fiscal year. There were also no significant elements of income or loss that did not arise from the continuing operations of the registrant
and its subsidiaries. Likewise, during and as of the end of the current interim period, there were no other unusual items (due to their nature, size or
incidents) that affected liabilities, assets, equity, net income, or cash flows.
Other than those disclosed above, no material off-balance sheet transactions, arrangements, obligations (including contingent obligations), and
other relationships with unconsolidated entities or other persons were created during the interim period. There were also no events that would
trigger substantial direct or contingent financial obligations or cause any default or acceleration of an existing obligation.
On March 26, 2015 , the BOD of the Company approved the issuance of fixed-rate retail bonds in the aggregate amount of up to P25 billion, inclusive
of over subscription (the “Bonds”), to be issued in one or more tranches depending on market conditions. The Bonds will be registered under the
Securities Regulation Code and is expected to be offered to the general public in the second half of 2015. AEV is also planning to list the Bonds with
the Philippine Dealing and Exchange Corporation.
The BOD delegated to Management the final determination of the offer price, tenors, and other terms and conditions of the Bonds. AEV will use the
proceeds of the Bonds to finance planned acquisitions, future investments and other general corporate requirements.
On May 22, 2015, the above proposed retail bond issuance of up to P25 billion received a “PRS Aaa” rating from the Philippine Rating Services
Corporation (PhilRatings), the highest possible rating assigned by PhilRatings. According to PhilRatings, obligations rated “PRS Aaa” are of the
highest quality with minimal credit risk, an indication of the obligor's extremely strong capacity to meet its financial commitment on the obligation.
For the period ended June 30, 2015, the Company sold a total of 15,685,500 treasury shares at an average price of P56.44 per share. Net proceeds
from the sale amounted to P885 million. Remaining balance of treasury shares authorized to be sold stand at 17,605,014 shares.
Lastly, there were no changes in estimates of amounts reported in prior interim period and financial year that would have a material effect in the
current interim period.
Likewise, there were no other material changes made in such items as: accounting principles and practices, estimates inherent in the preparation of
financial statements, status of long-term contracts, changes in the composition of the issuer, and reporting entity resulting from business
combinations or dispositions.
On April 14, 2015, AP publicly disclosed that it was advised by its wholly-owned subsidiary, TSI, of the effect of a disruption in the commissioning
schedule of Unit 2 of its Davao coal power plant.
The disruption occurred during the Mindanao-wide blackout last April 5, 2015 which caused damage to the auxiliary components and the pollution
control system of the plant. The damage will delay the commercial operations of Unit 2 by approximately 10 months.
On June 1, 2015, Aboitiz Equity Ventures, Inc. (AEV) acquired 51% stake in PETNET, Inc. (PETNET) for a total consideration of P1.004 billion. PETNET
is a Philippine money remittance business with a national footprint of around 2,500 locations through a mix of own units and business partner
agreements, and is the largest Western Union agent network of the Philippines. PETNET has a large growth and development potential with the
continued increase in remittances from OFWs (overseas Filipino workers) and with a large opportunity to distribute complementary products
through an extensive network of outlets.
Out of the 2,461,338 shares acquired by AEV, 1,235,186 shares (equivalent to 25.6%) were acquired from existing PETNET shareholders while the
remaining 1,226,152 shares (equivalent to 25.4%) were subscribed from the unissued capital stock of PETNET.

6. Events After the Reporting Period
a. Signing of Investment Agreements with CRH plc
b. SEC Approval on and Completion of Offer for AEV's P25B Fixed-Rate Retail Bonds
7. Material Adjustments
8. Contingencies
The Group is a party to certain proceedings and legal cases with other parties in the normal course of business. The ultimate outcome of these
proceedings and legal cases cannot be presently determined. Management, in consultation with its legal counsels, believes that it has substantial legal
and factual bases for its positions and is currently of the opinion that the likely outcome of these proceedings and legal cases will not have a material
adverse effect on the Group’s financial position and operating results. It is possible, however, that the future results of operations could be materially
affected by changes in estimates or in the effectiveness of the strategies relating to these proceedings and legal cases.
The Company obtained Standby Letters of Credit and is acting as surety for the benefit of certain associates and a subsidiary in connection with loans and
credit accommodations.
On July 22, 2015, AEV formalized its investment agreements with CRH plc (CRH), after initially entering into an exclusivity and non-binding
memorandum of understanding last May 15, 2015. The agreement will be by way of an agreed investment in holding companies for the purpose of
the acquisition of the various Philippine assets and businesses of Lafarge S.A., including the cement production and other cement related businesses
and services.
The estimated total investment of AEV is approximately P24 billion in the transaction.
Full implementation and completion of the transaction is expected to be completed within the second half of 2015, subject to the conditions under
the merger of Holcim and Lafarge and the approval of the global sale of Lafarge assets.
CRH, which has operations in 34 countries, is a manufacturer, supplier, and distributor of building materials with headquarters in Dublin, Ireland.
CRH shares are listed on the London and Dublin stock exchanges, and its American Depositary Shares are listed in the New York Stock Exchange.
On July 27, 2015, AEV received the Order of Registration and Certificate of Permit to Offer Securities for Sale from the SEC in relation to its
application for the issuance of fixed-rate retail bonds in the aggregate amount of up to P25 billion.
On July 31, 2015, AEV completed the offering of the first tranche of said bonds. The first tranche, equivalent to P24 billion, was issued in three series:
the Series A bonds due on 2020 with a fixed interest rate of 4.4722%, the Series B Bonds due on 2022 with a fixed interest rate of 5.0056%, and the
Series C bonds due on 2027 with a fixed interest rate of 6.0169% per annum.
The bonds were well received by both institutional and retail investors during the offer period which ran from July 28, 2015 to 12:00 noon, July 31,
2015, resulting in an order book that was 2.7x oversubscribed.
The Bonds will be listed on the Philippine Dealing & Exchange Corporation.
There were no material, non-recurring adjustments made during the period that would require appropriate disclosures. All other adjustments are of a
normal recurring nature.

M. SCHEDULE OF RELEVANT FINANCIAL RATIOS
FORMULA June 30, 2015 December 31, 2014
LIQUIDITY RATIOS
Current ratio Current assets 2.24 2.76
Current liabilities
Acid test ratio
Cash + Marketable Securities +
Accounts Receivable+ Other
Liquid Assets 1.90 2.35
Current liabilities
SOLVENCY RATIOS
Debt to equity ratio Total liabilities 1.16 1.08
Total equity
Asset to equity ratio Total assets 2.16 2.08
Total equity
Net debt to equity ratio Debt - cash & cash equivalents 0.53 0.50
Total equity
Gearing ratio Debt - cash & cash equivalents 34.80% 33.52%
Total equity + (Debt - cash & cash
equivalents)
Interest coverage ratio EBIT 5.38 5.44
Interest expense
PROFITABILITY RATIOS
Operating Margin Operating Profit 23.8% 22.3%
Total revenues
Return on Equity* Net income after tax n.a. 20.45%
Total equity
Ratio marked * is deemed not applicable (n.a.) for the interim reporting period since this will not be comparable to the ratio reported in the previous
period.

ABOITIZ EQUITY VENTURES, INC. & SUBSIDIARIES
AGING OF RECEIVABLES
AS OF : JUNE 30, 2015
(amts in P000's)
30 Days 60 Days 90 Days Over 90 Days Total
Trade Receivables
Power 6,629,951 650,360 378,920 2,790,075 10,449,306
Food Manufacturing 1,454,132 62,235 11,691 182,469 1,710,527
Realty 1,602,315 116,034 36,838 417,287 2,172,474
Holding and Others 790,451 94,807 33,039 246,312 1,164,609
10,476,849 923,436 460,488 3,636,143 15,496,916
Others 2,402,257 63,387 8,744 291,739 2,766,127
12,879,106 986,823 469,232 3,927,882 18,263,043
Less Allowance for Doubtful Accounts 1,882,170
16,380,873
AS OF : DECEMBER 31, 2014
30 Days 60 Days 90 Days Over 90 Days Total
Trade Receivables
Power 5,942,495 1,746,265 255,420 3,145,078 11,089,258
Food Manufacturing 1,753,741 97,174 26,277 162,753 2,039,945
Realty 1,530,195 38,696 28,349 302,185 1,899,425
Holding and Others 250,619 33,429 15,107 10,311 309,466
9,477,050 1,915,564 325,153 3,620,327 15,338,094
Others 2,926,050 5,644 9,593 310,820 3,252,107
12,403,100 1,921,208 334,746 3,931,147 18,590,201
Less Allowance for Doubtful Accounts 1,658,012
16,932,189
ACCOUNTS RECEIVABLE DESCRIPTION
Type of Receivable Collection
Trade uncollected billings to customers for sale of power, goods and services 30 - 60 days
Non-Trade claims, operating cash advances and advances to suppliers & employees 30 - 120 days
NORMAL OPERATING CYCLE
Power Subsidiaries
Distribution - 60 days
Generation - 65 days
Food Subsidiary - 90 days
Aviation Subsidiary - 60 days
Real Estate Subsidiary - 30 days
Nature / Description