quarterly disclosure report for the three months ended
TRANSCRIPT

Quarterly Disclosure ReportFor the Three Months Ended September 30, 2020
(Unaudited)
Contacts: Carrol E. Aulbaugh James E. Pool Angela M. HutsonInterim Chief Financial Officer
Senior Vice President - Financial Services
Senior Vice President - Chief Accounting Officer
Baylor Scott & White Health Baylor Scott & White Health Baylor Scott & White Health214-820-4342 214-820-2311 [email protected] [email protected] [email protected]
www.BSWHealth.com

NOTICE RELATING TO
TARRANT COUNTY CULTURAL EDUCATIONFACILITIES FINANCE CORPORATION
HOSPITAL REVENUE BONDS(BAYLOR HEALTH CARE SYSTEM PROJECT)
SERIES 2011A
TARRANT COUNTY CULTURAL EDUCATIONFACILITIES FINANCE CORPORATION
HOSPITAL REVENUE BONDS(BAYLOR HEALTH CARE SYSTEM PROJECT)
SERIES 2011B7 MONTH WINDOW VRDB
TARRANT COUNTY CULTURAL EDUCATIONFACILITIES FINANCE CORPORATION
HOSPITAL REVENUE BONDS(BAYLOR HEALTH CARE SYSTEM PROJECT)
SERIES 2011C
TARRANT COUNTY CULTURAL EDUCATIONFACILITIES FINANCE CORPORATION
HOSPITAL REVENUE BONDS(BAYLOR HEALTH CARE SYSTEM PROJECT)
SERIES 2013A
TARRANT COUNTY CULTURAL EDUCATIONFACILITIES FINANCE CORPORATION
HOSPITAL REVENUE BONDS(BAYLOR HEALTH CARE SYSTEM PROJECT)
SERIES 2013B7 MONTH WINDOW VRDB
TARRANT COUNTY CULTURAL EDUCATIONFACILITIES FINANCE CORPORATION
TAXABLE HOSPITAL REVENUE BONDS(BAYLOR HEALTH CARE SYSTEM PROJECT)
SERIES 2013C
TARRANT COUNTY CULTURAL EDUCATIONFACILITIES FINANCE CORPORATION
HOSPITAL REVENUE BONDS(SCOTT & WHITE HEALTHCARE PROJECT)
SERIES 2013A
BAYLOR SCOTT & WHITE HOLDINGSTAXABLE BONDS
SERIES 2015
BAYLOR SCOTT & WHITE HOLDINGSTAXABLE BONDS
SERIES 2016
TARRANT COUNTY CULTURAL EDUCATIONFACILITIES FINANCE CORPORATION
HOSPITAL REVENUE BONDS(BAYLOR SCOTT & WHITE HEALTHCARE PROJECT)
SERIES 2016A
TARRANT COUNTY CULTURAL EDUCATIONFACILITIES FINANCE CORPORATION
HOSPITAL REVENUE BONDS(BAYLOR SCOTT & WHITE HEALTH PROJECT)
SERIES 2019E
BAYLOR SCOTT & WHITE HOLDINGSTAXABLE COMMERCIAL PAPER NOTES
SERIES A
Quarterly Disclosure Report September 30, 2020

CUSIP No.’s
87638QFN4, 87638QFP9, 87638QFL8, 87638QFQ7, 87638QFM6, 87638QFX2, 87638QEW5,87638QGU7, 87638QGV5, 87638QGW3, 87638QHA0, 87638QGX1, 87638QGY9, 87638QGZ6,87638QGT0, 87638QHB8, 072863AA1, 072863AB9, 072863AC7, 072863AD5, 072863AE3,072863AF0, 87638QNW5, 87638QNX3, 87638QNY1, 87638QNZ8, 87638QPA1, 87638QPB9,87638QPC7, 87638QPD5, 87638QPE3, 87638QPF0, 87638QPG8, 87638QPH6, 87638QPJ2,87638QPK9, 87638QPL7, 87638QPM5, 87638QPN3, 87638QPQ6, 87638QPR4, 87638QPP8,87638QGE3, 87638QGF0, 87638QGG8, 87638QGH6, 87638QGJ2, 87638QGK9, 87638QGL7,87638QGM5, 87638QGN3, 87638QGQ6, 87638QGP8, 87638QGR4 87638QPT0, 87638QPV5
Commercial Paper Base CUSIP No.'s:
07287B 07287C 07287D
THE REMAINDER OF THIS PAGE WAS INTENTIONALLY LEFT BLANK
Quarterly Disclosure Report September 30, 2020

TABLE OF CONTENTS
ORGANIZATION Page 2
KEY OPERATING AND FINANCIAL INDICATORS Page 9
FINANCIAL OPERATIONS SUMMARY Page 9
MANAGEMENT DISCUSSION AND ANALYSIS:
Net Operating Income Page 11
Total Operating Revenue Page 11
Total Operating Expenses Page 11
Full-Time Equivalents Page 13
Nonoperating Gains (Losses) Page 13
Utilization Statistics Page 14
Liquidity Page 19
NET ASSETS OF THE FOUNDATIONS Page 21
COMBINED BALANCE SHEETS Page 22
COMBINED STATEMENTS OF OPERATIONS AND CHANGES IN NET ASSETS Page 24
COMBINED STATEMENTS OF CASH FLOWS Page 26
NOTES TO COMBINED FINANCIAL STATEMENTS Page 28
SUPPLEMENTARY COMBINING FINANCIAL INFORMATION OF THE OBLIGATED AFFILIATES AND BSWH
Combining Balance Sheets Page 48
Combining Statements of Operations and Changes in Net Assets Page 50
Obligated Affiliates – Combined Statement of Cash Flows Page 52
Quarterly Disclosure Report September 30, 2020
ATTENTION
This document is marked with a dated date of September 30, 2020 and reflects information only as of that dated date. Readers are cautioned not to assume that any information has been updated beyond the dated date except as to any portion of the document that expressly states that it constitutes an update concerning specific recent events occurring after the dated date of the document. The COVID-19 pandemic has adversely affected travel, commerce, and financial markets globally and the healthcare system in the United States. These effects may impact BSWH to an extent that cannot currently be predicted. Accordingly, the historical information set forth in this document is not indicative of future results or performance due to these and other factors. Any information contained in the portion of the document indicated to concern recent events speaks only as of its date. We expressly disclaim any duty to provide an update of any information contained in this document.
The information contained in this document may include “forward-looking statements” by using forward-looking words such as “may,” “will,” “should,” “expects,” “believes,” “anticipates,” “estimates,” or others. You are cautioned that forward-looking statements are subject to a variety of uncertainties that could cause actual results to differ from the projected results. Those risks and uncertainties include general economic and business conditions, receipt of funding grants, and various other factors which are beyond our control.
Because we cannot predict all factors that may affect future decisions, actions, events, or financial circumstances, what actually happens may be different from what we include in forward-looking statements.
THE REMAINDER OF THIS PAGE WAS INTENTIONALLY LEFT BLANK
Quarterly Disclosure Report September 30, 2020

ORGANIZATION
BAYLOR SCOTT & WHITE HEALTH SYSTEM
Baylor Scott & White Holdings (BSW Holdings), a Texas nonprofit corporation, and its controlled affiliates (collectively, the “System” or “BSWH”) were created from the combination of two Texas health care systems, Baylor Health Care System (BHCS) and its controlled affiliates and Scott & White Healthcare (S&W) and its controlled affiliates. BSW Holdings and Baylor Scott & White Health (BSW Health), a Texas nonprofit corporation, were created by BHCS and S&W in connection with their combination. BSW Holdings is the sole member of BHCS, S&W, and BSW Health and has control and substantial reserved powers over all BHCS and S&W controlled affiliates.
The System includes two flagship hospitals, Baylor University Medical Center (BUMC) and Scott & White Memorial Hospital (SWMH), now doing business as Baylor Scott & White Medical Center - Temple, along with twenty-six other hospitals (see “BSWH Adult and Pediatric Licensed Beds” table) located in north and central Texas, excluding joint venture hospitals noted below.
The System includes five foundations and one research institute: Baylor Health Care System Foundation d/b/a Baylor Scott & White Dallas Foundation, Scott & White Healthcare Foundation d/b/a Baylor Scott & White Central Texas Foundation, Irving Healthcare Foundation d/b/a Baylor Scott & White Irving Foundation, All Saints Health Foundation d/b/a Baylor Scott & White All Saints Health Foundation, Scott & White Healthcare Foundation Brenham d/b/a Baylor Scott & White Central Texas Foundation-Brenham, and Baylor Research Institute d/b/a Baylor Scott & White Research Institute.
The System also includes Baylor Quality Health Care Alliance, LLC d/b/a Baylor Scott & White Quality Alliance (BSWQA). BSWQA, an accountable care organization, functions as a clinically integrated health network of employed physicians, independent physicians, hospitals, and other providers of care who are committed to delivering high quality, cost-effective, value-based care.
The System also includes Scott & White Clinic (the “Clinic”), HealthTexas Provider Network (HTPN), Hillcrest Family Health Center (HFHC), Hillcrest Physician Services (HPS), and Century Integrated Partners, Inc (Century). The Clinic, a Texas nonprofit corporation, operates clinics located throughout the central Texas area, in addition to the main campus in Temple, Texas. HTPN is a Texas nonprofit corporation that owns and operates primary care and specialty practices in the Dallas-Fort Worth metroplex and north Texas. HFHC and HPS operate clinics in the greater Waco area.
The System operates Scott and White Health Plan and its subsidiaries, Insurance Company of Scott and White, Scott and White Care Plans, and SHA, L.L.C. d/b/a
Quarterly Disclosure Report September 30, 2020
-2-

FirstCare Health Plans and its subsidiary, Southwest Life and Health Insurance Company (collectively referred to as the “Health Plan”), which provide health insurance benefits to approximately 332,000 members through a variety of commercial, Medicaid, Medicare, Part D, Pharmacy Benefits Management, and Administrative Services Only products and services.
The System’s combined financial statements also include partnerships through Texas Health Ventures Group, LLC (THVG JV) with ten short-stay surgery hospitals and twenty-six ambulatory surgery centers, BIR JV, LLP (BIR JV) with four rehabilitation hospitals, one hundred and one clinics, and one transitional care facility, EBD JV, LLP (EBD JV) with eight emergency medical centers, and BTDI JV, LLP (BTDI JV) with thirty-seven imaging centers.
The System is committed to medical education in support of its mission of exemplary care, education, and research. The Texas A&M College of Medicine and the System have established Clinical Training Programs, for which medical students complete clinical rotations at BUMC and SWMH. Central Texas Veterans Health Care System is a major clinical partner in Temple and helps train the System’s residents and medical students. Because of this affiliation, the System’s trainees are able to better identify the needs of veterans and their families. Nursing education is conducted through programs and affiliations with numerous schools of nursing including Baylor University School of Nursing, Dallas County Community College District, Texas A&M University-Corpus Christi, Texas Woman’s University, University of Mary Hardin-Baylor, and the University of Texas at Arlington. A number of these students remain with the System as employees following their training and education. In February 2020, Baylor Scott & White All Saints Medical Center – Fort Worth announced an affiliation with Texas Christian University and North Texas Health Sciences School of Medicine to offer accredited physician resident training positions. The program is set to launch in July 2021.
THE REMAINDER OF THIS PAGE WAS INTENTIONALLY LEFT BLANK
Quarterly Disclosure Report September 30, 2020
-3-

OUR CORE
THE REMAINDER OF THIS PAGE WAS INTENTIONALLY LEFT BLANK
Quarterly Disclosure Report September 30, 2020
-4-

OBLIGATED GROUP
BSW Holdings and certain of its affiliates issue and secure debt (“Master Debt”) under a Master Indenture of Trust and Security Agreement, dated as of February 1, 2014, as supplemented and amended (the “Master Indenture”), among BSW Holdings, the affiliates from time to time obligated thereunder (the “Obligated Affiliates”), and The Bank of New York Mellon Trust Company, National Association, as trustee. The following entities are currently Obligated Affiliates:
– BSW Holdings– BSW Health– BHCS, a Texas nonprofit corporation– S&W, a Texas nonprofit corporation– BUMC, a Texas nonprofit corporation– Baylor All Saints Medical Center (BASMC), a Texas nonprofit corporation, doing
business as Baylor Scott & White All Saints Medical Center – Fort Worth– Baylor Regional Medical Center at Grapevine, a Texas nonprofit corporation,
doing business as Baylor Scott & White Medical Center – Grapevine– Baylor Medical Center at Waxahachie, a Texas nonprofit corporation, doing
business as Baylor Scott & White Medical Center – Waxahachie– Baylor Regional Medical Center at Plano, a Texas nonprofit corporation, doing
business as Baylor Scott & White Medical Center – Plano– SWMH, a Texas nonprofit corporation, also doing business as Baylor Scott &
White McLane Children’s Medical Center– Clinic, a Texas nonprofit corporation– Scott & White Hospital – Round Rock, a Texas nonprofit corporation, doing
business as Baylor Scott & White Medical Center – Round Rock and Baylor Scott & White Medical Center – Lakeway
– Scott & White Continuing Care Hospital, a Texas nonprofit corporation, doing business as Baylor Scott & White Continuing Care Hospital
– Hillcrest Baptist Medical Center, a Texas nonprofit corporation, doing business as Baylor Scott & White Medical Center – Hillcrest
– Baylor Medical Centers at Garland and McKinney, a Texas nonprofit corporation, doing business as Baylor Scott & White Medical Center – McKinney
– Scott & White Hospital – College Station, a Texas nonprofit corporation, doing business as Baylor Scott & White Medical Center – College Station
BSW Holdings is currently the Combined Group Representative under the Master Indenture. There are currently no Designated Affiliates under the Master Indenture.
The combined System’s credit ratings are Aa3 (Stable Outlook) by Moody’s Investors Service and AA- (Stable Outlook) by S&P Global Ratings.
Quarterly Disclosure Report September 30, 2020
-5-

AWARDS AND DISTINCTIONS
BAYLOR SCOTT & WHITE HEALTHThe System is recognized as one of the leading healthcare delivery systems in the United States, having received the following recognitions, among others:
According to U.S. News & World Report’s “Best Hospitals” 2020-2021 ratings, Baylor Scott & White Health has more award-winning hospitals and more accolades than any other not-for-profit system in Texas. This year, sixteen facilities were recognized, which includes three national rankings and two hospitals in the Texas top ten.
According to Newsweek’s “World’s Best Hospitals 2020,” four Baylor Scott & White Health hospitals received recognition.
Listed among the Best Work Places in Health Care by Fortune and the Great Place to Work Institute for the third year in a row.
Nine hospitals earned the Press Ganey Guardian of Excellence Award, which recognizes top-performing healthcare facilities that have consistently rated in the 95th percentile or above for patient experience based on one year of data. Additionally, six hospitals earned the Pinnacle of Excellence Award, which recognizes facilities that have maintained consistently high levels of performance for multiple years.
BAYLOR UNIVERSITY MEDICAL CENTER
Ranked as the No. 2 hospital in the Dallas metro area, as well as No. 4 in Texas, and was nationally recognized for the 28th consecutive year.
Named as one of the top 50 hospitals nationally in two medical specialties: Gynecology and Gastroenterology & GI Surgery, and high performing in Cancer, Nephrology, Neurology & Neurosurgery, Orthopedics, Pulmonology and Urology.
Ranked as the No. 50 hospital in the U.S. and No. 3 in Texas.
Reaccredited with a Gold Seal of Approval™ by the Joint Commission for the Ventricular Assist Device Program, the nation’s first such accredited program.
Quarterly Disclosure Report September 30, 2020
-6-

Gold Level Award for Excellence in Life Support – BUMC is the first and only adult extracorporeal membrane oxygenation (ECMO) center in north Texas to earn this award.
BUMC earned a distinguished three-star rating, denoting the highest category of quality among general thoracic surgery programs in the U.S. and Canada.
BUMC has been accredited as a Level IV Epilepsy Center – the highest level of designation from the National Association of Epilepsy Centers.
SCOTT & WHITE MEMORIAL HOSPITAL
Ranked as the No. 6 hospital in Texas; high performing in three specialties - Gastroenterology & GI Surgery, Orthopedics, and Nephrology; high performing in seven common procedures or conditions – abdominal aortic aneurysm repair, congestive heart failure, colon cancer surgery, COPD (chronic obstructive pulmonary disease), lung cancer surgery, hip replacement and knee replacement.
100 Hospitals and Health Systems with Great Oncology Programs in U.S. for Glenda Tanner Vasicek Cancer Center.
American Heart Association/American Stroke Association – Get with the Guidelines®– Stroke GOLD PLUS Target; Stroke Elite Plus Quality Achievement Award. Mission: Lifeline® STEMI Receiving Center – GOLD Plus Achievement Award Hospital.Mission: Lifeline® NSTEMI – Bronze Achievement Award.
The Gold Seal of Approval; Accredited Programs in Hospital, Nursing Care Center, Home Care; Advanced Certification in Stroke (Primary Stroke Center) and Ventricular Assist Device by the Joint Commission.
Quarterly Disclosure Report September 30, 2020
-7-

BAYLOR SCOTT & WHITE QUALITY ALLIANCE
NCQA ACO Accreditation: Level 2 – Verifies BSWQA has the infrastructure to support value-based delivery and the accountability.
Named to Becker’s Top 110 ACOs to Know in 2019.
NCQA Case Management Accreditation – The National Committee for Quality Assurance (NCQA) awarded BSWQA 3-year Accreditation for its Case Management program, effective December 19, 2017 – December 19, 2020. This Accreditation verifies BSWQA's utilization of evidence-based best practices to ensure members have access to a qualified case management team that delivers personalized, patient-centered care plans and safe transitions of care.
SCOTT AND WHITE HEALTH PLAN
Every year, Medicare evaluates plans based on a 5-star rating system. SeniorCare Advantage HMO, which was first offered in 2018, is rated an overall 4.5 out of 5 stars. The PPO was recently rated for the 2020 plan year at an overall 3.5 out of 5 stars.
THE REMAINDER OF THIS PAGE WAS INTENTIONALLY LEFT BLANK
Quarterly Disclosure Report September 30, 2020
-8-

KEY OPERATING AND FINANCIAL INDICATORS
The information contained in this document represents the financial condition and results of operations of BSWH for fiscal years ending June 30, 2020 and 2019, and the three months ended September 30, 2020 and 2019.
BSWH KEY OPERATING AND FINANCIAL INDICATORS($ in millions)
Year EndedJune 30,
Three Months Ended September 30,
2019 2020 2019 2020
Total operating revenue $ 10,053 $ 10,529 $ 2,658 $ 2,845
Operating margin 7.2% 5.3% 7.4% 13.6%
Adjusted EBITDA (1) $ 1,404 $ 1,196 $ 371 $ 545
Cash and investments $ 6,136 $ 7,207 $ 6,108 $ 7,775
Days in patient accounts receivable (2) 36.6 34.3 37.6 33.8
(1) Adjusted Earnings Before Interest, Taxes, Depreciation and Amortization (EBITDA) is defined as revenue in excess of expenses plus depreciation, amortization, taxes, interest, excluding unrealized gains/losses on investments, unrealized gains/losses on interest rate swaps, and loss from extinguishment of debt.
(2) Days in Patient Accounts Receivable is defined as net patient receivables divided by average daily net patient care revenue. Average daily net patient revenue is defined as net patient care revenue divided by the number of days in the period.
FINANCIAL OPERATIONS SUMMARY
BSWH SUMMARY COMBINED BALANCE SHEETS ($ in millions)
June 30, September 30,
2019 2020 2019 2020
ASSETS
Current assets $ 2,793 $ 4,149 $ 2,872 $ 4,458
Long-term investments 4,719 4,591 4,642 4,750
Assets whose use is limited 267 295 273 305
Property and equipment, net 3,890 4,062 3,929 4,046
Right of use operating lease assets, net — 868 895 849
Other assets 1,166 1,127 1,164 1,129
Total assets $ 12,835 $ 15,092 $ 13,775 $ 15,537
LIABILITIES AND NET ASSETS
Current liabilities $ 1,904 $ 2,954 $ 1,981 $ 2,995
Long-term debt and finance lease obligations less current maturities 3,022 3,262 3,007 3,248
Other long-term liabilities 724 1,548 1,525 1,547
Total liabilities 5,650 7,764 6,513 7,790
Noncontrolling interests - redeemable 453 482 473 469
Net assets 6,732 6,846 6,789 7,278
Total liabilities and net assets $ 12,835 $ 15,092 $ 13,775 $ 15,537
Quarterly Disclosure Report September 30, 2020
-9-

BSWH SUMMARY COMBINED STATEMENTS OF OPERATIONS ($ in millions)
Year EndedJune 30,
Three Months Ended September 30,
2019 2020 2019 2020
Total operating revenue $ 10,053 $ 10,529 $ 2,658 $ 2,845
Total operating expenses 9,328 9,970 2,460 2,457
Income from operations 725 559 198 388 Nonoperating gains (losses) and income tax expense 124 (106) (45) 164
Excess of revenues over expenses $ 849 $ 453 $ 153 $ 552
BSWH SUMMARY FINANCIAL INFORMATION ($ in millions)
Year EndedJune 30,
Three Months Ended September 30,
2019 2020 2019 2020
CASH FLOW
Cash flow from operating activities $ 1,168 $ 1,999 $ 310 $ 616
Adjusted operating cash flow (1) $ 1,265 $ 1,102 $ 332 $ 521
Adjusted EBITDA (2) $ 1,404 $ 1,196 $ 371 $ 545
Capital expenditures for property and equipment $ 590 $ 597 $ 138 $ 91
Total capitalization (3) $ 9,330 $ 9,731 $ 9,373 $ 10,136
FINANCIAL RATIOS
Operating margin 7.2% 5.3% 7.4% 13.6% Adjusted operating cash flow as a percentage of total revenue (1) 12.6% 10.5% 12.5% 18.3%
Adjusted EBITDA margin (4) 14.0% 11.4% 14.0% 19.2%
Debt to capitalization (5) 35.6% 36.6% 35.3% 35.0%
Debt to cash flow (6) 2.7x 3.4x 2.5x 1.8x
(1) Adjusted operating cash flow is defined as income from operations plus depreciation and amortization plus interest expense. Adjusted operating cash flow as a percentage of total revenue is calculated by dividing the adjusted operating cash flow by total operating revenue.
(2) Adjusted EBITDA is defined as revenue in excess of expenses plus depreciation, amortization, taxes, interest, excluding unrealized gains/losses on investments, unrealized gains/losses on interest rate swaps, and loss on extinguishment of debt.
(3) Total capitalization is defined as long-term debt (including long-term debt subject to remarketing arrangements and commercial paper, net of current maturities) plus unrestricted net assets.
(4) Adjusted EBITDA margin is defined as Adjusted EBITDA divided by total operating revenue.(5) Debt to capitalization is defined as long-term debt (including long-term debt subject to remarketing arrangements and commercial paper, net of current maturities) divided by
total capitalization.(6) Debt to cash flow is defined as long-term debt (including long-term debt subject to remarketing arrangements and commercial paper, plus current maturities) divided by
(excess of revenues over expenses, plus depreciation and amortization, excluding unrealized gains/losses on investments, and unrealized gains/losses on interest rate swaps divided by number of days in the period times number of days in respective year).
Quarterly Disclosure Report September 30, 2020
-10-

MANAGEMENT DISCUSSION AND ANALYSIS
Net Operating IncomeThe System’s operating income for the first three months of fiscal year 2021 was $388 million or 13.6% of total operating revenue, compared to $198 million or 7.4% for the first three months of fiscal year 2020. Adjusted EBITDA was $545 million or 19.2% of total operating revenue for the first three months of fiscal year 2021 compared to $371 million or 14.0% for the first three months of fiscal year 2020.
Total Operating RevenueThe combined total operating revenue increased $187 million or 7.0% to $2,845 million for the first three months of fiscal year 2021 compared to $2,658 million for the first three months of fiscal year 2020.
Net patient care revenue increased $36 million or 1.7% to $2,206 million for the first three months of fiscal year 2021 compared to $2,170 million for the first three months of fiscal year 2020. The increase in net patient care revenue is primarily related to higher acuity and favorable payor mix.
Premium revenue increased $66 million or 17.9% to $435 million for the first three months of fiscal year 2021 compared to $369 million for the first three months of fiscal year 2020. This increase is primarily due to the settlement of an Affordable Care Act Risk Corridor lawsuit for funding owed to the Health Plan related to losses incurred in the Individual Public Exchange market from 2014 through 2016.
Net assets released from restrictions for operations increased $3 million or 18.8% to $19 million for the first three months of fiscal year 2021 compared to $16 million for the first three months of fiscal year 2020.
Total Operating ExpensesCombined total operating expenses for the first three months of fiscal year 2021 were $2,457 million, a decrease of $3 million or -0.1% compared to $2,460 million for the first three months of fiscal year 2020.
Salaries, wages, and employee benefits expense increased $33 million or 2.8% to $1,220 million for the first three months of fiscal year 2021 compared to $1,187 million for the first three months of fiscal year 2020, representing approximately 42.9% and 44.7% of total operating revenue for the first three months of fiscal years 2021 and 2020, respectively. Salaries, wages, and employee benefits expense represented approximately 49.7% and 48.3% of total operating expenses for the first three months of fiscal years 2021 and 2020, respectively.
Quarterly Disclosure Report September 30, 2020
-11-

Supplies and other operating expenses decreased $27 million or -2.9% for the first three months of fiscal year 2021 to $908 million compared to $935 million for the first three months of fiscal year 2020, and represented approximately 31.9% and 35.2% of total operating revenue for fiscal years 2021 and 2020, respectively. Supplies and other operating expenses represented approximately 37.0% and 38.0% of total operating expenses for the first three months of fiscal years 2021 and 2020, respectively.
Medical claims decreased $8 million or -3.9% for the first three months of fiscal year 2021 to $196 million compared to $204 million for the first three months of fiscal year 2020. This decrease is primarily due to increased medical utilization management efforts, and improved network contracting for the FirstCare health plan entities acquired in January 2019.
Depreciation and amortization increased $4 million or 3.9% to $107 million for the first three months of fiscal year 2021 compared to $103 million for the first three months of fiscal year 2020.
Interest expense decreased $5 million or -16.1% to $26 million for the first three months of fiscal year 2021 compared to $31 million for the first three months of fiscal year 2020.
BSWH OPERATING EXPENSES ($ in millions)
Year EndedJune 30,
Three Months Ended September 30,
2019 2020 2019 2020
Salaries, wages, and employee benefits $ 4,561 $ 4,923 $ 1,187 $ 1,220
Supplies 1,661 1,701 431 448
Other operating expenses 2,006 2,069 504 460
Medical claims 556 735 204 196
Losses (gains) on fixed asset sales and disposals, net 4 (1) — —
Depreciation and amortization 415 429 103 107
Interest expense 125 114 31 26
Total operating expenses $ 9,328 $ 9,970 $ 2,460 $ 2,457
THE REMAINDER OF THIS PAGE WAS INTENTIONALLY LEFT BLANK
Quarterly Disclosure Report September 30, 2020
-12-

Full-Time EquivalentsFull-time equivalents (FTEs) are the number of total hours worked in a given period divided by the maximum number of compensable hours in a period as defined by law. The following table displays FTEs for employees of BSWH, which include physicians, advanced practice providers, and other employees.
BSWH EMPLOYEES
ObligatedAffiliates Health Plan
OtherEntities
September 30, 2020 Total
Physician FTEs 1,187 — 976 2,163 Advanced practice provider FTEs 491 — 383 874 Joint venture FTEs(1) — — 5,608 5,608 Other employee FTEs 26,369 800 9,103 36,272 Total FTEs 28,047 800 16,070 44,917
(1) Joint venture FTEs above include THVG JV, BIR JV, BTDI JV, and EBD JV.
Nonoperating Gains (Losses)The System recorded unrestricted unrealized gains on investments of $118 million for the first three months of fiscal year 2021 compared to unrestricted unrealized losses on investments of $32 million for the first three months of fiscal year 2020. Unrestricted investment income and realized gains on investments were $25 million for the first three months of fiscal year 2021 compared to unrestricted investment income and realized gains on investments of $42 million for the first three months of fiscal year 2020, representing a decrease of $17 million or -40.5%. The System recorded unrealized gains in its interest rate swap portfolio of $26 million for the first three months of fiscal year 2021 compared to unrealized losses of $48 million for the first three months of fiscal year 2020 due to interest rate fluctuations.
THE REMAINDER OF THIS PAGE WAS INTENTIONALLY LEFT BLANK
Quarterly Disclosure Report September 30, 2020
-13-

Utilization StatisticsBSWH derives its patient revenue from managed care companies, Medicare, Medicaid, commercial insurers, self paying patients, and other sources.
The following graph approximates the percentages of gross patient revenue by payor which includes intercompany activity related to the insured patients of the Health Plan.
Gross Revenue by Payor SourceFor the Fiscal Years Ended June 30, 2019 and 2020 and FY 21 YTD Through
September
0.0%
5.0%
10.0%
15.0%
20.0%
25.0%
30.0%
35.0%
40.0%
45.0%
Medicare Medicaid Managed Care
Health Insurance
Exchange - Marketplace
Health Plan* Self-pay/Other
nFY 19 42.8% 6.9% 36.9% 1.3% 3.7% 8.4%nFY 20 43.2% 6.8% 36.3% 1.8% 3.7% 8.2%nFYTD 21 42.9% 6.5% 36.6% 2.1% 3.7% 8.2%
*Health Plan excludes SeniorCare, RightCare, and HIE products offered by the Health Plan which are in their natural classification.
THE REMAINDER OF THIS PAGE WAS INTENTIONALLY LEFT BLANK
Quarterly Disclosure Report September 30, 2020
-14-

Gross Revenue by Payor SourceFor Fiscal Year to Date September 30
0.0%
5.0%
10.0%
15.0%
20.0%
25.0%
30.0%
35.0%
40.0%
45.0%
Medicare Medicaid Managed Care
Health Insurance
Exchange - Marketplace
Health Plan* Self-pay/Other
nFYTD 20 43.2% 6.7% 36.4% 1.7% 3.5% 8.5%nFYTD 21 42.9% 6.5% 36.6% 2.1% 3.7% 8.2%
*Health Plan excludes SeniorCare, RightCare, and HIE products offered by the Health Plan which are in their natural classification.
THE REMAINDER OF THIS PAGE WAS INTENTIONALLY LEFT BLANK
Quarterly Disclosure Report September 30, 2020
-15-

OPERATING DATA - BSWH TOTAL
Year EndedJune 30,
Three Months Ended September 30,
2019 2020 2019 2020Licensed Beds 5,212 5,063 5,233 5,063 Inpatient Admissions (1) 222,131 211,587 55,950 52,478 Patient Days 1,052,336 1,027,942 263,895 263,741 Occupancy 64.3% 62.1% 63.6% 63.6% Average Length of Stay (Days) 4.7 4.9 4.7 5.0 Average Daily Census 2,883 2,809 2,868 2,867 Discharges 222,291 211,182 55,987 52,444 Emergency Room Visits 827,931 799,698 216,229 170,078 Inpatient Surgical Cases 64,892 60,538 16,432 14,795 Outpatient Surgical Cases 234,811 224,420 60,497 59,439 Other Outpatient Registrations 4,311,775 4,408,344 1,149,226 1,212,801 Clinic Visits (IP & OP) (2) 3,481,935 3,601,988 909,672 928,531 Patient Encounters (3) 3,966,655 3,899,953 979,781 992,137 Relative Value Units (4) 17,195,943 17,107,072 4,449,026 4,395,551 Deliveries 29,952 30,440 8,026 7,981 Gross Outpatient Revenue as a Percent of Total Gross Patient
Revenues 63.1% 63.2% 64.1% 63.6% (1) Admissions include adult, pediatric, and special care nursery.(2) Clinic visits include all visits at the Clinic, HFHC, and HPS.(3) Patient encounters are for HTPN and Century.(4) Relative value units represent amounts for BSWH.As statistical definitions are redefined and aligned related to the merger, prior quarter statistics may be updated accordingly for comparative purposes.
OPERATING DATA - OBLIGATED AFFILIATES SUBTOTAL
Year EndedJune 30,
Three Months Ended September 30,
2019 2020 2019 2020Licensed Beds 3,436 3,459 3,436 3,459 Inpatient Admissions (1) 159,219 152,861 40,444 38,371 Patient Days 775,587 767,296 197,095 198,810 Occupancy 70.0% 67.7% 70.5% 70.2% Average Length of Stay (Days) 4.9 5.0 4.9 5.2 Average Daily Census 2,125 2,096 2,142 2,161 Discharges 159,101 152,692 40,564 38,214 Emergency Room Visits 482,767 463,240 127,954 100,366 Inpatient Surgical Cases 41,229 38,739 10,492 9,541 Outpatient Surgical Cases 67,142 65,238 17,484 17,508 Other Outpatient Registrations 3,194,211 3,308,641 846,293 919,119 Clinic Visits (IP & OP) (2) 3,151,402 3,255,355 821,644 841,147 Relative Value Units (4) 7,773,263 7,925,768 2,026,541 2,120,833 Deliveries 22,668 23,504 6,189 6,238 Gross Outpatient Revenue as a Percent of Total Gross Patient
Revenues 55.6% 55.4% 56.4% 55.9%
(1) Admissions include adult, pediatric, and special care nursery.(2) Clinic visits include all visits at the Clinic.(4) Relative value units represent amounts for BSWH.As statistical definitions are redefined and aligned related to the merger, prior quarter statistics may be updated accordingly for comparative purposes.
Quarterly Disclosure Report September 30, 2020
-16-
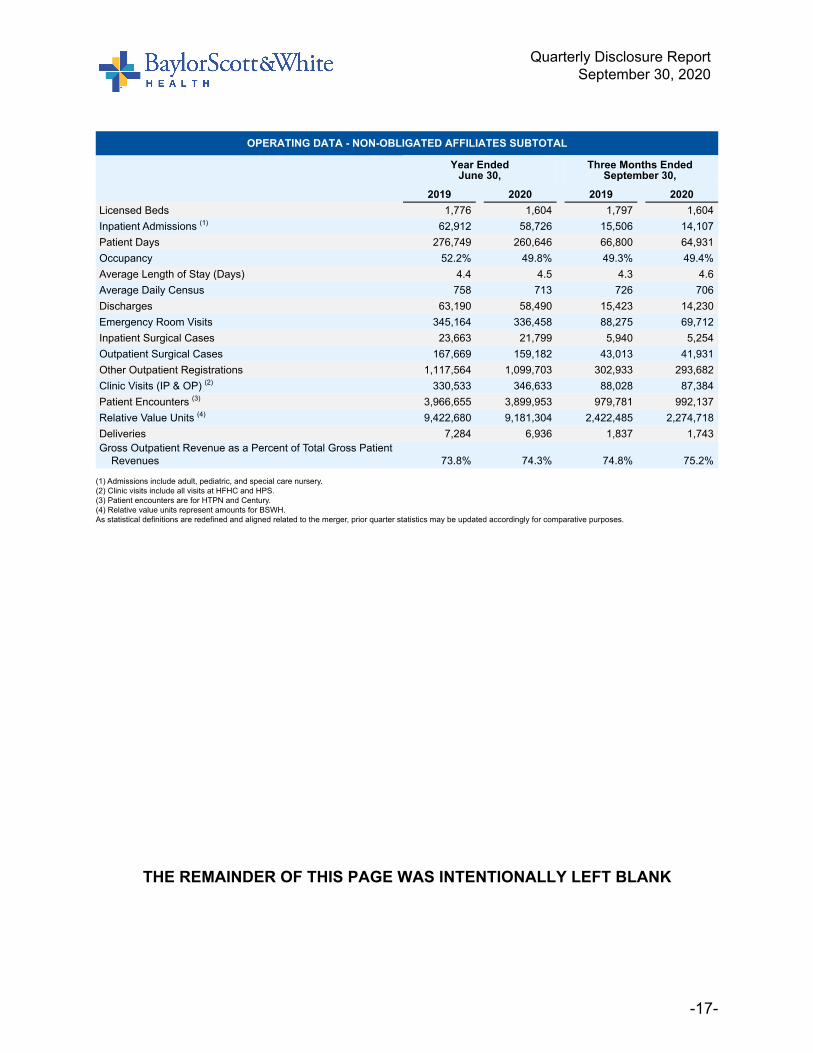
OPERATING DATA - NON-OBLIGATED AFFILIATES SUBTOTAL
Year EndedJune 30,
Three Months Ended September 30,
2019 2020 2019 2020Licensed Beds 1,776 1,604 1,797 1,604 Inpatient Admissions (1) 62,912 58,726 15,506 14,107 Patient Days 276,749 260,646 66,800 64,931 Occupancy 52.2% 49.8% 49.3% 49.4% Average Length of Stay (Days) 4.4 4.5 4.3 4.6 Average Daily Census 758 713 726 706 Discharges 63,190 58,490 15,423 14,230 Emergency Room Visits 345,164 336,458 88,275 69,712 Inpatient Surgical Cases 23,663 21,799 5,940 5,254 Outpatient Surgical Cases 167,669 159,182 43,013 41,931 Other Outpatient Registrations 1,117,564 1,099,703 302,933 293,682 Clinic Visits (IP & OP) (2) 330,533 346,633 88,028 87,384 Patient Encounters (3) 3,966,655 3,899,953 979,781 992,137 Relative Value Units (4) 9,422,680 9,181,304 2,422,485 2,274,718 Deliveries 7,284 6,936 1,837 1,743 Gross Outpatient Revenue as a Percent of Total Gross Patient
Revenues 73.8% 74.3% 74.8% 75.2%
(1) Admissions include adult, pediatric, and special care nursery.(2) Clinic visits include all visits at HFHC and HPS.(3) Patient encounters are for HTPN and Century.(4) Relative value units represent amounts for BSWH.As statistical definitions are redefined and aligned related to the merger, prior quarter statistics may be updated accordingly for comparative purposes.
THE REMAINDER OF THIS PAGE WAS INTENTIONALLY LEFT BLANK
Quarterly Disclosure Report September 30, 2020
-17-

BSWH ADULT AND PEDIATRIC LICENSED BEDSSeptember 30, 2020
LicensedBeds
Baylor University Medical Center 914 Baylor Scott & White Medical Center - Temple 576 Baylor Scott & White All Saints Medical Center - Fort Worth 538 Baylor Scott & White Medical Center - Grapevine 302 Baylor Scott & White Medical Center - Hillcrest 236 Baylor Scott & White Medical Center - Plano 160 Baylor Scott & White Medical Center - McKinney 143 Baylor Scott & White Medical Center - College Station 142 Baylor Scott & White Medical Center - Waxahachie 129 Baylor Scott & White Medical Center - Lakeway (1)
106 Baylor Scott & White Medical Center - Round Rock 101 Baylor Scott & White McLane Children's Medical Center (2)
64 Baylor Scott & White Continuing Care Hospital 48
Obligated Affiliates Subtotal 3,459
Texas Health Ventures Group (10 hospitals) 309 Baylor Scott & White Medical Center - Irving 293 BIR JV, LLP (4 hospitals) (3)
223 Baylor Scott & White Medical Center - Lake Pointe 176 Baylor Scott & White Medical Center - Centennial 118 Baylor Scott & White The Heart Hospital - Plano 105 EBD JV, LLP (8 emergency medical centers) 64 Baylor Scott & White Medical Center - Brenham 60 Baylor Scott & White Heart and Vascular Hospital - Dallas 59 Baylor Scott & White Medical Center - Marble Falls 46 Baylor Scott & White Medical Center - Llano 27 Baylor Scott & White Medical Center - Pflugerville 25 Baylor Scott & White Medical Center - Taylor 25 Baylor Scott & White Medical Center - Austin 25 Baylor Scott & White The Heart Hospital - Denton 22 Baylor Scott & White Medical Center - Buda 15 Baylor Scott & White Medical Center - Cedar Park (4)
8 Baylor Scott & White The Heart Hospital - McKinney 4
Non-Obligated Alliliates Subtotal 1,604
Total 5,063
(1) Baylor Scott & White Medical Center - Lakeway is operated as part of Baylor Scott & White Medical Center - Round Rock.(2) Baylor Scott & White McLane Children's Medical Center is operated as part of Baylor Scott & White Medical Center - Temple.(3) BIR JV, LLP includes 9 beds for a transitional living facility.(4) ESWCT, LLC operations were sold to Baylor Scott & White Medical Center - Round Rock effective July 1, 2019.
Source: Texas Department of Health, July 28, 2020.
Quarterly Disclosure Report September 30, 2020
-18-

LiquidityUnrestricted cash and investments of $6,979 million at September 30, 2020 increased $564 million as compared to unrestricted cash and investments of $6,415 million at June 30, 2020 after capital expenditures of $91 million and net gains on trading investments of $143 million. Unrestricted days cash on hand increased to 273.7 days at September 30, 2020 from 245.8 days at June 30, 2020. Including restricted funds, days cash on hand totaled 304.9 days at September 30, 2020 compared to 276.1 days at June 30, 2020. The debt to capitalization ratio decreased to 35.0% at September 30, 2020 from 36.6% at June 30, 2020 and total assets increased 2.9% to $15,537 million at September 30, 2020 from $15,092 million at June 30, 2020.
BSWH CASH AND INVESTMENTS($ in millions)
June 30, September 30,
2019 2020 2019 2020
Cash and cash equivalents (1) $ 813 $ 1,965 $ 877 $ 2,356
Short-term investments (2) 337 356 316 364
Long-term investments (3) 4,986 4,886 4,915 5,055
Total cash and investments 6,136 7,207 6,108 7,775
Less: restricted cash and investments (4) 785 792 790 796
Total unrestricted cash and investments $ 5,351 $ 6,415 $ 5,318 $ 6,979
Average daily operating expenses (less depreciation) $ 24.4 $ 26.1 $ 25.6 $ 25.5
Unrestricted days cash on hand (5) 219.3 245.8 207.7 273.7
Days cash on hand (6) 251.5 276.1 238.6 304.9
(1) Cash equivalents are composed of investments which have original maturities of three months or less.(2) Short-term investments are assets that are convertible to cash in one year or less.(3) Long-term investments are comprised of U.S. small, mid and large capitalization stocks, international stocks, intermediate term fixed income securities, hedge funds, real estate, and private equity.(4) Restricted cash and investments is the sum of the restricted long-term investments, assets restricted by donors, assets held by bond trustees, and assets required to meet self-insurance obligations.(5) Unrestricted days cash on hand is calculated as unrestricted cash and investments divided by average daily operating expenses (less depreciation).(6) Days cash on hand includes restricted funds.
THE REMAINDER OF THIS PAGE WAS INTENTIONALLY LEFT BLANK
Quarterly Disclosure Report September 30, 2020
-19-

BSWH SELF LIQUIDITY REPORT($ in millions)
September 30, 2020
DAILY LIQUIDITY
Checking and deposit accounts at P-1 rated bank $ 1,512
Short-term investment funds at P-1 rated bank 14
Subtotal Daily Liquidity (Cash & Securities) 1,526
$400 Million General Purpose LOC (undrawn amount) (1) —
Subtotal Daily Liquidity 1.526
WEEKLY LIQUIDITY
Fixed Income: Publicly Traded Fixed Income Securities rated at least Aa3 619
Fixed Income: Publicly Traded Fixed Income Securities rated below Aa3 837
Equities: Exchange Traded Equity (ownership of shares of stock) 224
Equities: Equity Funds 783
Subtotal Weekly Liquidity 2.463
Total Daily and Weekly Liquidity $ 3.989
LONGER TERM LIQUIDITYFunds, vehicles, investments that allow withdrawals with one month notice or longer $ 1,346
(1) Baylor Scott & White Holdings $400 MM line of credit expires January 9, 2023.The table above sets forth those assets that would reasonably be available to BSWH to satisfy a liquidity event. The table does not include assets held by affiliates of BSWH that would not be reasonably available to BSWH to satisfy a liquidity event, including assets held by the five foundations as described further in this report, THVG JV, Texas Heart Hospital of the Southwest, LLP and Baylor Heart and Vascular Center, LLP, among others.
THE REMAINDER OF THIS PAGE WAS INTENTIONALLY LEFT BLANK
Quarterly Disclosure Report September 30, 2020
-20-

NET ASSETS OF THE FOUNDATIONS
The System operates five philanthropic foundations which include Baylor Health Care System Foundation, Scott & White Healthcare Foundation, All Saints Health Foundation, Irving Healthcare Foundation, and Scott & White Healthcare Foundation Brenham. The cumulative net assets of these five entities are as follows:
NET ASSETS OF THE FOUNDATIONS ($ in millions)
June 30, September 30,
2019 2020 2019 2020
Net assets without donor restrictions $ 118 $ 54 $ 112 $ 59
Net assets with donor restrictions 589 561 589 576
Total $ 707 $ 615 $ 701 $ 635
THE REMAINDER OF THIS PAGE WAS INTENTIONALLY LEFT BLANK
Quarterly Disclosure Report September 30, 2020
-21-

COMBINED BALANCE SHEETS
BAYLOR SCOTT & WHITE HEALTHCOMBINED BALANCE SHEETS
($ in millions)
June 30, September 30, 2019 2020 2019 2020
ASSETSCURRENT ASSETS:
Cash and cash equivalents $ 813 $ 1,965 $ 877 $ 2,356 Short-term investments 337 356 316 364 THVG funds due from United Surgical Partners, Inc. 104 280 106 222 Accounts receivable:
Patient 845 781 887 810 Premiums 111 118 109 100 Other 228 273 224 254
Other current assets 355 376 353 352 Total current assets 2,793 4,149 2,872 4,458
LONG-TERM INVESTMENTS:Unrestricted 4,201 4,094 4,125 4,259 Restricted 518 497 517 491
Total long-term investments 4,719 4,591 4,642 4,750
ASSETS WHOSE USE IS LIMITED:Other designated assets 151 175 155 184 Self insurance reserves 116 120 118 121
Total assets whose use is limited 267 295 273 305
PROPERTY AND EQUIPMENT, net 3,890 4,062 3,929 4,046
RIGHT OF USE OPERATING LEASE ASSETS, net — 868 895 849
CONTRIBUTIONS RECEIVABLE, net 203 169 200 168
OTHER LONG-TERM ASSETS:Equity investment in unconsolidated entities 64 63 64 68 Goodwill and intangible assets, net 878 873 877 872 Interest in net assets of related foundation 4 4 4 4 Other 17 18 19 17
Total other long-term assets 963 958 964 961
Total assets $ 12,835 $ 15,092 $ 13,775 $ 15,537
Quarterly Disclosure Report September 30, 2020
-22-
BAYLOR SCOTT & WHITE HEALTHCOMBINED BALANCE SHEETS - CONTINUED
($ in millions)
June 30, September 30, 2019 2020 2019 2020
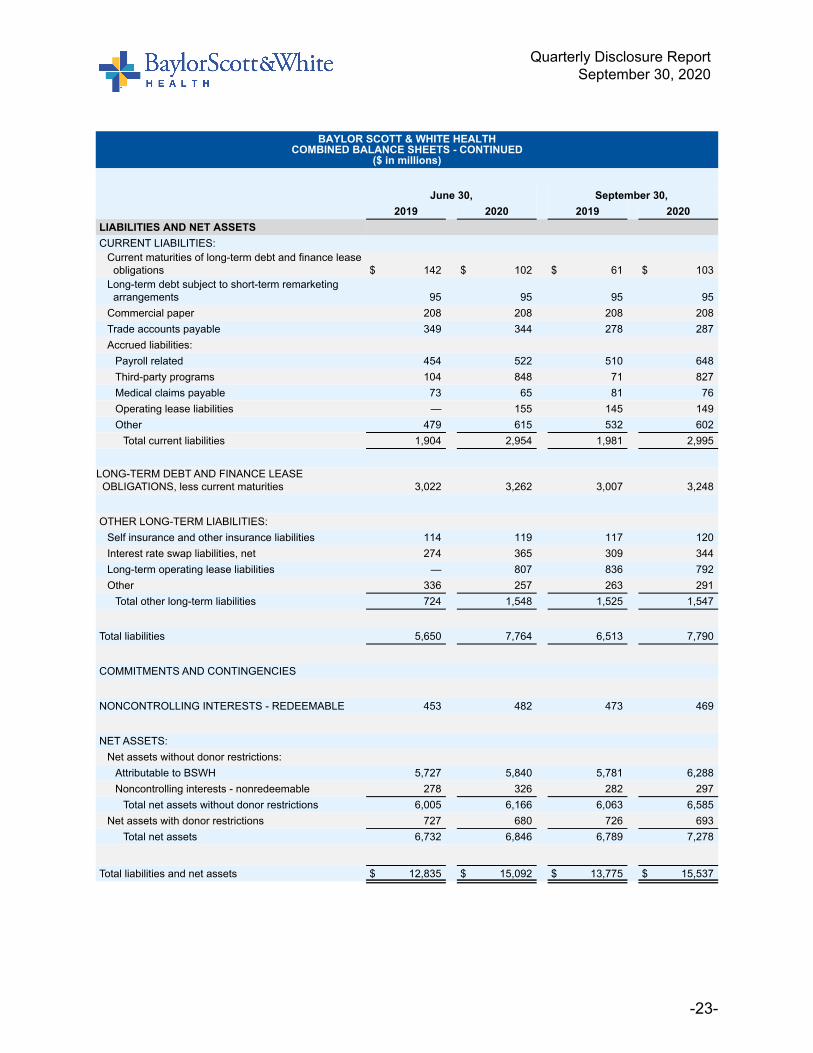
LIABILITIES AND NET ASSETSCURRENT LIABILITIES:
Current maturities of long-term debt and finance lease obligations $ 142 $ 102 $ 61 $ 103
Long-term debt subject to short-term remarketing arrangements 95 95 95 95
Commercial paper 208 208 208 208 Trade accounts payable 349 344 278 287 Accrued liabilities:
Payroll related 454 522 510 648 Third-party programs 104 848 71 827 Medical claims payable 73 65 81 76 Operating lease liabilities — 155 145 149 Other 479 615 532 602
Total current liabilities 1,904 2,954 1,981 2,995
LONG-TERM DEBT AND FINANCE LEASE OBLIGATIONS, less current maturities 3,022 3,262 3,007 3,248
OTHER LONG-TERM LIABILITIES:Self insurance and other insurance liabilities 114 119 117 120 Interest rate swap liabilities, net 274 365 309 344 Long-term operating lease liabilities — 807 836 792 Other 336 257 263 291
Total other long-term liabilities 724 1,548 1,525 1,547
Total liabilities 5,650 7,764 6,513 7,790
COMMITMENTS AND CONTINGENCIES
NONCONTROLLING INTERESTS - REDEEMABLE 453 482 473 469
NET ASSETS:Net assets without donor restrictions:
Attributable to BSWH 5,727 5,840 5,781 6,288 Noncontrolling interests - nonredeemable 278 326 282 297
Total net assets without donor restrictions 6,005 6,166 6,063 6,585 Net assets with donor restrictions 727 680 726 693
Total net assets 6,732 6,846 6,789 7,278
Total liabilities and net assets $ 12,835 $ 15,092 $ 13,775 $ 15,537
Quarterly Disclosure Report September 30, 2020
-23-

COMBINED STATEMENTS OF OPERATIONS AND CHANGES IN NET ASSETS
BAYLOR SCOTT & WHITE HEALTHCOMBINED STATEMENTS OF OPERATIONS AND CHANGES IN NET ASSETS
($ in millions)
Year EndedJune 30,
Three Months Ended September 30,
2019 2020 2019 2020OPERATING REVENUE:
Net patient care revenue $ 8,447 $ 8,334 $ 2,170 $ 2,206 Premium revenue 1,153 1,483 369 435 Other operating revenue 386 635 103 185 Net assets released from restrictions for operations 67 77 16 19
Total operating revenue 10,053 10,529 2,658 2,845
OPERATING EXPENSES:Salaries, wages, and employee benefits 4,561 4,923 1,187 1,220 Supplies 1,661 1,701 431 448 Other operating expenses 2,006 2,069 504 460 Medical claims 556 735 204 196 Losses (gains) on fixed asset sales and disposals, net 4 (1) — — Depreciation and amortization 415 429 103 107 Interest 125 114 31 26
Total operating expenses 9,328 9,970 2,460 2,457
INCOME FROM OPERATIONS 725 559 198 388
NONOPERATING GAINS (LOSSES):Gains on investments, net 224 58 10 143 Interest rate swap activity (88) (151) (52) 19 Equity in earnings of unconsolidated entities 3 — 1 6 Loss from extinguishment of debt — (3) — —
Total nonoperating gains (losses) 139 (96) (41) 168
REVENUE AND GAINS IN EXCESS OF EXPENSES AND LOSSES BEFORE TAXES 864 463 157 556
LESS INCOME TAX EXPENSE 15 10 4 4
REVENUE AND GAINS IN EXCESS OF EXPENSES AND LOSSES 849 453 153 552
Quarterly Disclosure Report September 30, 2020
-24-

BAYLOR SCOTT & WHITE HEALTHCOMBINED STATEMENTS OF OPERATIONS AND CHANGES IN NET ASSETS - CONTINUED
($ in millions)
Year EndedJune 30,
Three Months Ended September 30,
2019 2020 2019 2020OTHER CHANGES IN NET ASSETS WITHOUT DONOR
RESTRICTIONS:Net assets released from restrictions for capital expenditures $ 31 $ 45 $ 1 $ — Other changes in net assets attributable to noncontrolling interests - nonredeemable (92) (45) (18) (53) Revenue and gains in excess of expenses and losses attributable to noncontrolling interests - redeemable (274) (290) (75) (81) Net assets acquired 7 — — — Cumulative change in accounting principle — (2) (6) — Other (10) — 3 1
INCREASE IN NET ASSETS WITHOUT DONOR RESTRICTIONS 511 161 58 419
CHANGES IN NET ASSETS WITH DONOR RESTRICTIONS:Contributions 98 56 16 13 Realized gains on investments, net 28 20 6 4 Unrealized (losses) gains on investments, net (1) (9) (6) 17 Change in value of split-interest agreements 2 4 — 1 Net assets released from restrictions for operations (67) (77) (16) (19) Net assets released from restrictions for capital
expenditures (31) (45) (1) — Other (2) 4 — (3)
INCREASE (DECREASE) IN NET ASSETS WITH DONOR RESTRICTIONS 27 (47) (1) 13
INCREASE IN NET ASSETS 538 114 57 432
NET ASSETS, beginning of period 6,194 6,732 6,732 6,846
NET ASSETS, end of period $ 6,732 $ 6,846 $ 6,789 $ 7,278
THE REMAINDER OF THIS PAGE WAS INTENTIONALLY LEFT BLANK
Quarterly Disclosure Report September 30, 2020
-25-

COMBINED STATEMENTS OF CASH FLOWS
BAYLOR SCOTT & WHITE HEALTHCOMBINED STATEMENTS OF CASH FLOWS
($ in millions)
Year EndedJune 30,
Three Months Ended September 30,
2019 2020 2019 2020CASH FLOWS FROM OPERATING ACTIVITIES:
Increase in net assets $ 538 $ 114 $ 57 $ 432 Adjustments to reconcile increase in net assets to net
cash provided by operating activities:Loss from extinguishment of debt — 1 — — Unrealized (gains) losses on investments, net (69) 67 38 (135) Realized gains on investments, net (100) (54) (27) (14) Unrealized losses (gains) on interest rate swap, net 70 129 48 (26) Contributions restricted for long-term purposes (15) (1) — — Depreciation and amortization 415 429 103 107 Losses (gains) on fixed asset sales and disposals, net 4 (1) — — Equity in earnings of unconsolidated entities (3) — (1) (6) Change in value of split-interest agreements (2) (4) — (1) Deferred rent and other (2) 9 1 (2) Other changes attributable to noncontrolling interests 360 328 88 134 Cumulative change in accounting principle — 2 6 — Net assets acquired (7) — — — Changes in operating assets and liabilities (net of
acquisitions):(Increase) decrease in patient accounts receivable (40) 64 (42) (29) (Increase) decrease in other accounts receivable (19) (52) 6 37 (Increase) decrease in other assets (23) (13) 5 28 Increase in trade accounts payable and accrued
liabilities 4 949 13 46 Increase in other long-term liabilities 57 32 15 45
Net cash provided by operating activities 1,168 1,999 310 616
CASH FLOWS FROM INVESTING ACTIVITIES:Purchases of property and equipment (590) (597) (138) (91) Cash proceeds from sales of assets 6 4 (1) — Cash paid for acquisitions, net of cash received (31) — — — Decrease (increase) in THVG funds due from United
Surgical Partners, Inc. 14 (176) (2) 58 (Increase) decrease in trading investments (656) 101 88 (18) Net payments on interest rate swaps (34) (60) (19) (4) Increase in other than trading investments — — (2) — Increase in assets whose use is limited (16) (28) (6) (10)
Net cash used in investing activities (1,307) (756) (80) (65)
Quarterly Disclosure Report September 30, 2020
-26-

BAYLOR SCOTT & WHITE HEALTHCOMBINED STATEMENTS OF CASH FLOWS - CONTINUED
($ in millions)
Year EndedJune 30,
Three Months Ended September 30,
2019 2020 2019 2020CASH FLOWS FROM FINANCING ACTIVITIES:
Principal payments on long-term debt $ (178) $ (855) $ (99) $ (13) Proceeds from issuance of long-term debt 140 1,067 — — Distributions to noncontrolling interests (320) (283) (67) (141) Purchases of noncontrolling interests (24) (24) — (7) Sales of noncontrolling interests 9 8 (1) 1 Cash receipts restricted for long-term purposes 3 1 — — Annuity payments to beneficiaries (1) (1) — —
Net cash used in financing activities (371) (87) (167) (160)
NET (DECREASE) INCREASE IN CASH AND CASH EQUIVALENTS AND RESTRICTED CASH (510) 1,156 63 391
CASH AND CASH EQUIVALENTS AND RESTRICTED CASH, beginning of period 1,329 819 819 1,975
CASH AND CASH EQUIVALENTS AND RESTRICTED CASH, end of period $ 819 $ 1,975 $ 882 $ 2,366
RECONCILIATION OF CASH AND CASH EQUIVALENTS AND RESTRICTED CASH:
Cash and cash equivalents at beginning of year $ 1,264 $ 813 $ 813 $ 1,965 Cash in unrestricted long-term investments at beginning of year 3 1 1 1 Cash in restricted long-term investments at beginning of year 8 4 4 8
Cash in assets whose use is limited at beginning of year 54 1 1 1 Cash and cash equivalents and restricted cash at beginning of year $ 1,329 $ 819 $ 819 $ 1,975
Cash and cash equivalents at end of year $ 813 $ 1,965 $ 877 $ 2,356
Cash in unrestricted long-term investments at end of year 1 1 1 1
Cash in restricted long-term investments at end of year 4 8 3 8
Cash in assets whose use is limited at end of year 1 1 1 1 Cash and cash equivalents and restricted cash at end of year $ 819 $ 1,975 $ 882 $ 2,366
THE REMAINDER OF THIS PAGE WAS INTENTIONALLY LEFT BLANK
Quarterly Disclosure Report September 30, 2020
-27-

1. ORGANIZATION
Baylor Scott & White Holdings (BSW Holdings), a Texas nonprofit corporation exempt from federal income taxation under Section 501(c)(3) of the Internal Revenue Code, and its controlled affiliates (collectively, the “System”) were created from the combination of two Texas healthcare systems, Baylor Health Care System (BHCS) and its affiliates, and Scott & White Healthcare (SWH) and its affiliates. BSW Holdings and Baylor Scott & White Health (BSW Health), a Texas nonprofit corporation, were created by BHCS and SWH in connection with their combination. BSW Holdings is the sole member of BHCS, SWH, and BSW Health and has control and substantial reserved powers over all BHCS and SWH material affiliates. BSW Holdings and its controlled affiliates are collectively referred to as the “System” or “BSWH”.
The combined financial statements include the accounts of BSW Holdings, BSW Health, BHCS, SWH, Baylor University Medical Center (BUMC), Scott & White Memorial Hospital (SWMH), five health plan entities (collectively referred to as the “Health Plan” or "Consolidated Health Plan"), five foundations, twenty-six community and specialty hospitals located throughout the Dallas and Fort Worth metroplex and the central Texas area, one wholly owned captive insurance subsidiary (Baylor Scott & White Assurance SPC (BSWA)), Baylor Quality Health Care Alliance, LLC, an accountable care organization, five physician practice organizations including HealthTexas Provider Network (HTPN), Scott & White Clinic, Hillcrest Family Health Center, Hillcrest Physician Services, and Century Integrated Partners, Inc., and other related entities. Investments in certain related entities with 50.0% or less ownership are accounted for using the equity method. The transactions and balances for investments in certain related entities with greater than 50.0% ownership, or where the System exercises board control, are included in the accompanying combined financial statements with related noncontrolling interests reported in the combined financial statements. These entities include four acute and specialty hospitals referenced above, along with partnerships in: Texas Health Ventures Group, LLC (THVG), providing short-stay hospital and outpatient surgery services, BIR JV, LLP, providing rehabilitation services, BTDI JV, LLP, providing imaging services, EBD JV, LLP, providing emergency medical services, and HTPN Gastroenterology Services, LLP, providing endoscopic services. All significant intercompany accounts and transactions among entities included in the combined financial statements have been eliminated.
The following summarizes significant changes in the System in fiscal years 2019 - 2021:
THVGBUMC has a majority ownership of 50.1% in THVG with USP North Texas, Inc. (USP), a Texas corporation and subsidiary of United Surgical Partners, Inc. (USPI) holding the remaining 49.9%. THVG had net patient care revenue included in the System’s
Quarterly Disclosure Report September 30, 2020
Notes to Combined Financial Statements
-28-

combined financial statements of approximately $319 million and $308 million in the first three months of fiscal years 2021 and 2020, respectively.
BT Garland JV, LLP On December 14, 2017, BSWH announced that a decision was made to close Baylor Scott & White Medical Center – Garland, a 113-bed hospital. The last day of operations was February 28, 2018. On April 1, 2020, BT Garland JV, LLP completed the donation of the Garland Hospital facilities to the U.S. Department of Veteran Affairs.
Baylor Scott & White Medical Center - PflugervilleIn December 2018, the System opened Baylor Scott & White Medical Center – Pflugerville, a 25-bed multi-specialty hospital.
FirstCare Health PlansOn January 1, 2019, the Health Plan acquired SHA, L.L.C. d/b/a FirstCare Health Plans and its subsidiary, Southwest Life & Health Insurance Company, from Covenant Health System in Lubbock, Texas and Hendrick Health System in Abilene, Texas. The Health Plan recorded goodwill and intangible assets, net of approximately $7 million, fixed assets of approximately $18 million and other net liabilities of approximately $25 million in 2019.
Baylor Scott & White The Heart Hospital - McKinneyIn July 2019, the System opened Baylor Scott & White The Heart Hospital – McKinney, a 4-bed hospital on the McKinney campus. The hospital will provide heart and vascular care to patients in McKinney, Texas.
Baylor Scott & White Medical Center - BudaIn September 2019, the System opened Baylor Scott & White Medical Center – Buda, a 15-bed multispecialty hospital.
Baylor Scott & White Medical Center - CarrolltonIn November 2019, BSWH signed a definitive agreement for the transfer of operations of Baylor Medical Center at Carrollton (Carrollton) d/b/a Baylor Scott & White Medical Center - Carrollton to Sana Healthcare Carrollton, LLC, d/b/a Carrollton Regional Medical Center. The transaction was completed on March 1, 2020.
Debt Portfolio RefinancingIn December 2019, BSW Holdings issued the $41 million Series 2019A, $97 million Series 2019B, $180 million Series 2019C, $45 million Series D, and $96 million Series E Revenue Bonds through the Tarrant County Cultural Education Facilities Corporation conduit issuer, with various banks. Proceeds from this issuance were used to defease
Quarterly Disclosure ReportSeptember 30, 2020
Notes to Combined Financial Statements - continued
-29-

$38 million of the Baylor Health Care System Series 2011A Revenue Bonds and redeem the Scott & White Healthcare Series 2013C Revenue Bonds, the Baylor Scott & White Holdings Series 2015B and C Revenue Bonds, and the Baylor Scott & White Holdings Series 2017A, B, and C Revenue Bonds.
On January 9, 2020, BSWH terminated the $400 million revolving line of credit, and entered into a new $400 million revolving line of credit with an expiration date of January 2023. On April 9, 2020, BSWH drew $400 milllion from the revolving line of credit. On April 9, 2020, BSWH drew $400 million from the revolving line of credit.
Additionally, on January 22, 2020, BSWH amended the credit agreement related to the Lake Pointe Construction Loan to add BHCS as a guarantor.
Baylor Scott & White Medical Center – AustinIn January 2020, the System opened Baylor Scott & White Medical Center – Austin, a 25-bed hospital. This is the System’s first full-service hospital within the Austin city limits.
MEDCO ConstructionOn February 29, 2020, BSWH and MEDCO Construction, LLC (MEDCO) completed the sale of substantially all of the assets of MEDCO to The Christman Company, a national construction management and real estate development firm.
CARES ActIn March 2020, the global COVID-19 pandemic began to impact the operations of the System. In response to the COVID-19 pandemic, the United States government passed the Coronavirus, Aid, Relief, and Economic Security Act (CARES Act). Under programs included in the CARES Act, the System received and recognized approximately $187 million and $53 million of emergency relief funds in other operating revenue in fiscal year 2020 and the first three months of fiscal year 2021, respectively. The System also recorded approximately $23 million of employee retention tax credit in salaries, wages, and employee benefits in fiscal year 2020. The System also received approximately $765 million in Medicare advance payments in April 2020 and recorded a contract liability in accordance with ASC 606, “Revenue Recognition”, which is included in third-party program liabilities. Repayment of the advance payments begin one year after payment was issued to the System. The System deferred approximately $47 million and $35 million of the employer portion of FICA taxes, in fiscal year 2020 and the first three months of fiscal year 2021, respectively, which will be paid over a two year period with one half due in December 2021 and the other half due in December 2022.
Quarterly Disclosure ReportSeptember 30, 2020
Notes to Combined Financial Statements - continued
-30-

Risk Corridor ProgramThe Risk Corridor program was created as part of the Affordable Care Act to stabilize the individual product market for pricing volatility during the early years of the public health insurance exchanges from 2014 through 2016. After the program was in operation, CMS took the position that the Risk Corridor program was budget neutral, and would only pay Risk Corridor funding out to insurers that had losses based on collections from insurers that had excess profitability within the program, creating a shortfall for Scott and White Health Plan (SWHP) and Insurance Company of Scott and White (ICSW). SWHP and ICSW sued the United States to obtain recovery of funds believed to be owed through this program. The Supreme Court held oral arguments and ruled in favor of the insurers. In August 2020, SWHP and ICSW collected the full amount owed from this program, which resulted in an increase in net assets of approximately $64 million.
2. SIGNIFICANT ACCOUNTING POLICIES
The accompanying combined financial statements of the System have been prepared in conformity with accounting principles generally accepted in the United States. The following is a summary of the significant accounting and reporting policies used in preparing the financial statements.
Application of New Accounting PronouncementsIn May 2014, August 2015, April 2016, May 2016, December 2016, and February 2017, Financial Accounting Standards Board (FASB) issued Accounting Standards Update (ASU) 2014-09, “Revenue from Contracts with Customers (Topic 606)”; ASU 2015-14, “Revenue from Contracts with Customers”; ASU 2016-10, “Identifying Performance Obligations and Licensing”; ASU 2016-12, “Revenue from Contracts with Customers: Narrow-Scope Improvements and Practical Expedients”; ASU 2016-20, “Technical Corrections and Improvements to Topic 606, Revenue from Contracts with Customers”; and ASU 2017-05, “Clarifying the Scope of Asset Derecognition Guidance and Accounting for Partial Sales of Nonfinancial Assets”, respectively, which supersedes the revenue recognition requirements in Accounting Standards Codification (ASC) 605, “Revenue Recognition.” These ASU’s address when an entity should recognize revenue to depict the transfer of promised goods or services to customers in an amount that reflects the consideration to which the entity expects to be entitled in exchange for those goods or services. The System adopted the guidance under these ASU’s, effective July 1, 2018 using the modified retrospective approach at the date of initial application. As a result of the adoption, amounts previously classified as provision for bad debts in the statements of operations are now reflected as implicit price concessions, and therefore, included as a reduction of net patient care revenue. The patient accounts receivable allowance for uncollectible accounts was treated similarly. Other than these presentation
Quarterly Disclosure ReportSeptember 30, 2020
Notes to Combined Financial Statements - continued
-31-
changes, the adoption of ASC 606 did not have a material impact on the combined financial statements.
In November 2015, FASB issued ASU 2015-17, “Balance Sheet Classification of Deferred Taxes.” This ASU requires that deferred tax liabilities and assets be classified as noncurrent in a classified statement of financial position. The System applied the provisions of ASU 2015-17 in fiscal year 2019, which did not have a material impact on the combined financial statements.
In January 2016, FASB issued ASU 2016-01, “Recognition and Measurement of Financial Assets and Financial Liabilities.” This ASU primarily affects the accounting for equity investments, financial liabilities under the fair value options and the presentation and disclosure requirements for financial instruments. The System applied the provisions of ASU 2016-01 in fiscal year 2020, which did not have a material impact on the combined statements of operations.
In February 2016, January 2018, July 2018, December 2018, and March 2019, FASB issued ASU 2016-02, “Leases”; ASU 2018-01, “Land Easement Practical Expedient”; ASU 2018-10, “Codification Improvements to Topic 842, Leases” and ASU 2018-11, “Leases (Topic 842): Targeted Improvements”; ASU 2018-20, “Leases (Topic 842): Narrow-Scope Improvements for Lessors”, and ASU 2019-01, “Leases (Topic 842): Codification Improvements”, respectively. These ASU’s require lessees to record a lease liability that represents the lessee’s future lease obligation payments and a right-of-use asset that represents the lessee’s right to use or control of a specified asset for the lease term. The main difference with previous practice being that lessees are now required to record an asset and liability for what was considered an operating lease under ASC 840, “Leases”. The System adopted the guidance under these ASU’s, effective July 1, 2019 using the effective date method, a practical expedient allowing application of the guidance for the adoption date forward without adjusting comparative periods. The System also elected to apply the practical expedient to not use hindsight to determine the lease term and assess impairment of right of use assets. As a result of the adoption, the System recognized right of use assets of approximately $943 million and operating lease liabilities of approximately $1,028 million. The System also elected not to assess whether land easements entered into prior to the adoption date that were not previously accounted for as a lease should be reported as such under ASC 842. The adoption of this standard did not have a corresponding material impact on the combined statements of operations. The System elected the three packaged transitional practical expedients under ASC 842-10-65-1(f), to not reassess at adoption (i) expired or existing contracts for whether they are or contain a lease, (ii) the lease classification of any existing leases or (iii) initial indirect costs for existing leases. The System also elected the practical expedient that allows lessees to choose to not separate lease and non-lease components for all classes of underlying assets.
Quarterly Disclosure ReportSeptember 30, 2020
Notes to Combined Financial Statements - continued
-32-

In March 2016, FASB issued ASU 2016-05, “Effect of Derivative Contract Novations on Existing Hedge Accounting Relationships.” This ASU clarifies that a change in the counterparty to a derivative instrument that has been designated as the hedging instrument does not, in and of itself, require dedesignation of that hedging relationship provided that all other hedge accounting criteria remain intact. The System applied the provisions of ASU 2016-05 in fiscal year 2019, which did not have a material impact on the combined financial statements.
In March 2016, FASB issued ASU 2016-06, “Contingent Put and Call Options in Debt Instruments.” This ASU clarifies what steps are required when assessing whether the economic characteristics and risks of call (put) options are clearly and closely related to the economic characteristics and risks of their debt hosts, which is one of the criteria for bifurcating an embedded derivative. Consequently, when a call (put) option is contingently exercisable, an entity does not have to assess whether the event that triggers the ability to exercise a call (put) option is related to interest rates or credit risks. The System applied the provisions of ASU 2016-06 in fiscal year 2019, which did not have a material impact on the combined financial statements.
In August 2016, FASB issued ASU 2016-14, “Presentation of Financial Statements of Not-for-Profit Entities.” This ASU requires not-for-profit entities to report two classes of net assets, as well as enhances disclosures on board designated funds, liquidity, and functional expenses. The System applied the provisions of ASU 2016-14 in fiscal year 2019, which did not have a material impact on the combined financial statements.
In August 2016, FASB issued ASU 2016-15, “Classification of Certain Cash Receipts and Cash Payments.” This ASU provides cash flow statement classification guidance related to debt extinguishment costs, contingent consideration payments made after a business combination, proceeds from the settlement of insurance claims, distributions made from equity method investees, separately identifiable cash flows, and application of the predominance principle. The System applied the provisions of ASU 2016-15 in fiscal year 2020, which did not have a material impact on the combined financial statements.
In October 2016, FASB issued ASU 2016-16, “Intra-Entity Transfers of Assets Other Than Inventory.” This ASU requires an entity to recognize the income tax consequences of an intra-entity transfer of an asset other than inventory when the transfer occurs. The System applied the provisions of ASU 2016-16 in fiscal year 2020, which did not have a material impact on the combined financial statements.
In November 2016, FASB issued ASU 2016-18, “Restricted Cash: A Consensus of the FASB Emerging Issues Task Force.” This ASU requires a statement of cash flows to explain the change during the period in the total of cash, cash equivalents, and amounts generally described as restricted cash or restricted cash equivalents. The System applied the provisions of ASU 2016-18 in fiscal year 2020, which had an immaterial
Quarterly Disclosure ReportSeptember 30, 2020
Notes to Combined Financial Statements - continued
-33-

impact on the cash used in investing activities in the combined statements of cash flows.
In January 2017, FASB issued ASU 2017-01, “Clarifying the Definition of a Business.” By clarifying the definition of a business, the amendments of this ASU affect all companies and other reporting organizations that must determine whether they have acquired or sold a business. The System applied the provisions of ASU 2017-01 in fiscal year 2020, which did not have a material impact on the combined financial statements.
In March 2017, FASB issued ASU 2017-07, “Improving the Presentation of Net Periodic Pension Cost and Net Periodic Postretirement Benefit Cost.” This ASU requires that an employer report the service cost component in the same line item as other compensation costs arising from services rendered by the pertinent employees during the period. The other components of net benefit cost are required to be presented in the income statement separately from the service cost component and outside a subtotal of income from operations, if one is presented. The System applied the provisions of ASU 2017-07 in fiscal year 2020, which did not have a material impact on the combined financial statements.
In June 2018, FASB issued ASU 2018-08, “Not-for-Profit Entities (Topic 958): Clarifying the Scope and the Accounting Guidance for Contributions Received and Contributions Made.” These amendments clarify the accounting guidance around contributions of cash and other assets made and received by not-for-profit organizations and business enterprises. The System applied the provisions of ASU 2018-08 in fiscal year 2019, which did not have a material impact on the combined financial statements.
In August 2018, FASB issued ASU 2018-13, “Fair Value Measurement (Topic 820): Disclosure Framework—Changes to the Disclosure Requirements for Fair Value Measurement.” The amendments in ASU 2018-13 remove certain disclosure requirements related to transfers between fair value levels, the valuation of Level 3 assets and liabilities, as well as the changes in unrealized gains and losses included in earnings for Level 3. Additionally, these amendments modify certain disclosure requirements related to transfers, purchases, and issuances in and out of Level 3 for nonpublic entities. The System applied the provisions of ASU 2018-13 in fiscal year 2021, which did not have a material impact on the combined financial statements.
Other Accounting PronouncementsIn June 2016, November 2018, April 2019, and May 2019, FASB issued ASU 2016-13, “Financial Instruments-Credit Losses (Topic 326)”; ASU 2018-19, “Codification Improvements to Topic 326, Financial Instruments - Credit Losses”; ASU 2019-04, “Codification Improvements to Topic 326, Financial Instruments-Credit Losses, Topic 815, Derivatives and Hedging, and Topic 825, Financial Instruments”; and ASU 2019-05, “Financial Instruments-Credit Losses (Topic 326)”, respectively. The current
Quarterly Disclosure ReportSeptember 30, 2020
Notes to Combined Financial Statements - continued
-34-

standard delays the recognition of a credit loss on a financial asset until the loss is probable of occurring. These ASU’s remove the requirement that a credit loss be probable of occurring for it to be recognized. Instead these ASU’s require entities to use historical experience, current conditions, and reasonable and supportable forecasts to estimate their future expected credit losses. The provisions of these ASU’s are effective for fiscal years beginning after December 15, 2020. The System is currently evaluating the impact of these ASU’s.
In January 2017, FASB issued ASU 2017-04, “Simplifying the Test for Goodwill Impairment.” This ASU eliminates Step 2 from the goodwill impairment test. Step 2 measures a goodwill impairment loss by comparing the implied fair value of a reporting unit’s goodwill with the carrying amount of that goodwill. The provisions of ASU 2017-04 are effective for fiscal years beginning after December 15, 2019, and interim periods within those years for public business entities, and December 15, 2021, and interim periods within those years for all other entities. The System is currently evaluating the impact of this ASU.
In March 2017, FASB issued ASU 2017-08, “Premium Amortization on Purchased Callable Debt Securities.” This ASU shortens the amortization period for certain callable debt securities held at a premium and requires the premium to be amortized to the earliest call date. However, the amendments do not require an accounting change for securities held at a discount; the discount continues to be amortized to maturity. The provisions of ASU 2017-08 are effective for fiscal years beginning after December 15, 2018, and interim periods within those years for public business entities, and December 15, 2019, and interim periods thereafter for all other entities. The System is currently evaluating the impact of this ASU.
In August 2018, FASB issued ASU 2018-14, “Compensation—Retirement Benefits—Defined Benefit Plans—General (Subtopic 715-20): Disclosure Framework—Changes to the Disclosure Requirements for Defined Benefit Plans.” The amendments in ASU 2018-14 remove certain requirements related to the amount and timing of plan assets expected to be returned to the employer, related party disclosures, and disclosures related to Level 3 fair value. Additionally, these amendments clarify and enhance the disclosures for projected benefit obligation and accumulated benefit obligation. The provisions of ASU 2018-14 are effective for fiscal years ending after December 15, 2020, for public business entities and December 15, 2021, for all other entities. The System is currently evaluating the impact of this ASU.
In August 2018, FASB issued ASU 2018-15, “Intangibles—Goodwill and Other—Internal-Use Software (Subtopic 350-40): Customer’s Accounting for Implementation Costs Incurred in a Cloud Computing Arrangement That Is a Service Contract.” The amendments in ASU 2018-15 determine which implementation costs to capitalize as an asset and which costs to expense. Additionally, these amendments clarify how the capitalized implementation costs should be presented within the financial statements.
Quarterly Disclosure ReportSeptember 30, 2020
Notes to Combined Financial Statements - continued
-35-

The provisions of ASU 2018-15 are effective for fiscal years beginning after December 15, 2019, for public business entities and December 15, 2020, for all other entities. The System is currently evaluating the impact of this ASU.
In September 2020, FASB issued ASU 2020-07, “Not-for-Profit Entities (Topic 958): Presentation and Disclosures by Not-for-Profit Entities for Contributed Nonfinancial Assets.” This ASU requires a not-for-profit entity to present contributed non-financial assets as a separate line item in the statement of activities apart from contributed cash and other financial assets, and disclose whether the assets were monetized or utilized during the reporting period. The provisions of ASU 2020-07 are effective for fiscal years beginning after June 15, 2021 and interim periods thereafter. The System is currently evaluating the impact of this ASU.
Cash and Cash Equivalents
Cash equivalents are defined as investments which have original maturities of three months or less. Cash equivalents consist primarily of securities issued by the United States government or its agencies, certificates of deposit, commercial paper, and dollar denominated foreign issued investments.
THVG Funds Due From United Surgical Partners, Inc.
THVG participates in a shared services accounts payable program with USPI, wherein USPI has custody of substantially all of THVG’s cash, paying THVG and its facilities interest income on the net balance at prevailing market rates. Amounts held by USPI on behalf of THVG totaled approximately $222 million and $280 million at September 30, 2020 and June 30, 2020, respectively. The funds due from USPI are available on demand.
Investments
For all investments, interest and dividends, realized gains, and unrealized gains (losses) are included in gains on investments, net, in the accompanying combined statements of operations and changes in net assets, unless restricted by donor.
THE REMAINDER OF THIS PAGE WAS INTENTIONALLY LEFT BLANK
Quarterly Disclosure ReportSeptember 30, 2020
Notes to Combined Financial Statements - continued
-36-
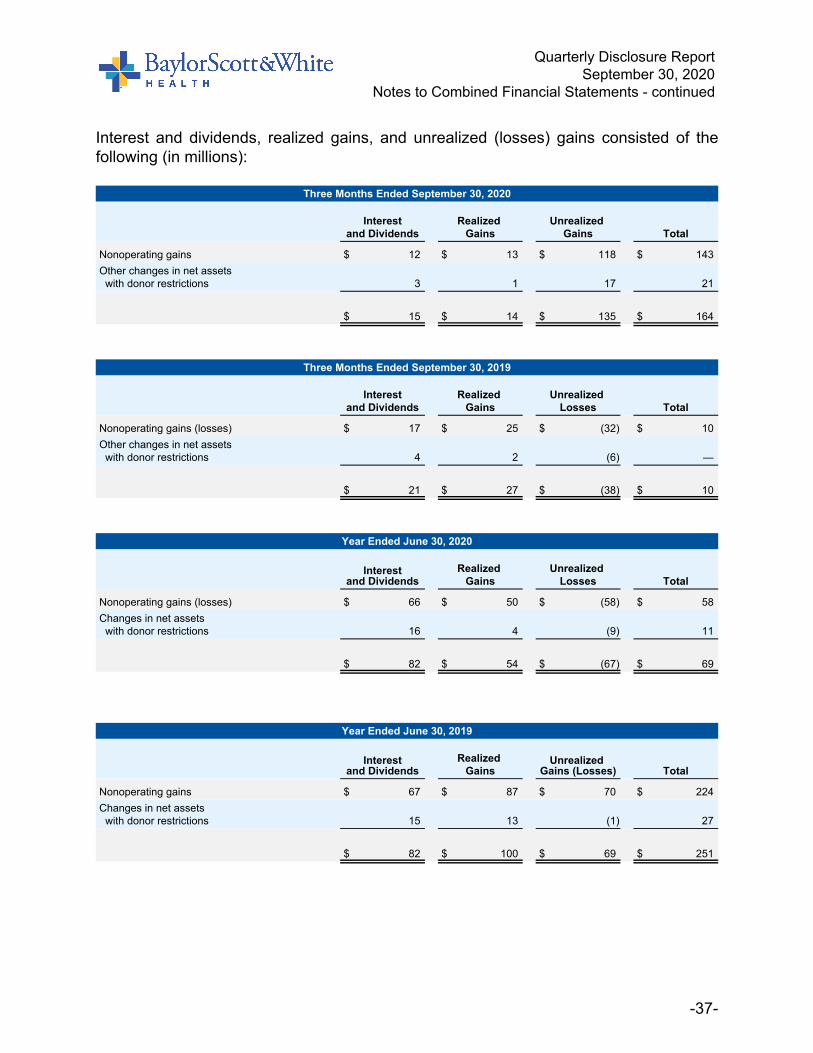
Interest and dividends, realized gains, and unrealized (losses) gains consisted of the following (in millions):
Three Months Ended September 30, 2020
Interestand Dividends
Realized Gains
Unrealized Gains Total
Nonoperating gains $ 12 $ 13 $ 118 $ 143 Other changes in net assets
with donor restrictions 3 1 17 21
$ 15 $ 14 $ 135 $ 164
Three Months Ended September 30, 2019
Interestand Dividends
Realized Gains
Unrealized Losses Total
Nonoperating gains (losses) $ 17 $ 25 $ (32) $ 10 Other changes in net assets
with donor restrictions 4 2 (6) —
$ 21 $ 27 $ (38) $ 10
Year Ended June 30, 2020
Interestand Dividends
Realized Gains
Unrealized Losses Total
Nonoperating gains (losses) $ 66 $ 50 $ (58) $ 58 Changes in net assets
with donor restrictions 16 4 (9) 11
$ 82 $ 54 $ (67) $ 69
Year Ended June 30, 2019
Interestand Dividends
Realized Gains
Unrealized Gains (Losses) Total
Nonoperating gains $ 67 $ 87 $ 70 $ 224 Changes in net assets
with donor restrictions 15 13 (1) 27
$ 82 $ 100 $ 69 $ 251
Quarterly Disclosure ReportSeptember 30, 2020
Notes to Combined Financial Statements - continued
-37-

3. FAIR VALUE OF FINANCIAL INSTRUMENTS
Fair Value MeasurementsAs defined in ASC 820, “Fair Value Measurements”, fair value is based on the prices that would be received to sell an asset or paid to transfer a liability in an orderly transaction between market participants at the measurement date. In order to increase consistency and comparability in fair value measurements, ASC 820 establishes a three-tier fair value hierarchy for disclosure of fair value measurements.
The valuation hierarchy is based upon the transparency of inputs to the valuation of an asset or liability as of the measurement date. The three levels are defined as follows:
• Level 1 - Inputs to the valuation methodology are quoted prices (unadjusted) for identical assets or liabilities in active markets.
• Level 2 - Inputs to the valuation methodology include quoted prices for similar assets or liabilities in active markets, and inputs that are observable by market participants for the asset or liability, either directly or indirectly, for substantially the full term of the financial instrument.
• Level 3 - Inputs that reflect the reporting entity’s own assumptions about the assumptions market participants would use in pricing the asset or liability that are unobservable and developed based on the best information available in the circumstances.
A financial instrument’s categorization within the valuation hierarchy is based upon the lowest level of input that is significant to the fair value measurement.
The carrying values of cash and cash equivalents, THVG funds due from USPI, patient accounts receivable, other receivables, trade accounts payable, accrued liabilities, and third-party programs payable are reasonable estimates of their fair value due to the short-term nature of these financial instruments.
Fair values of short-term investments and long-term investments are generally based on quoted prices for similar instruments in active markets, quoted prices for identical or similar instruments in markets that are not active, and model-based valuation techniques for which all significant assumptions are observable in the market or can be corroborated by observable market data for substantially the full term of the assets. Inputs are obtained from various sources including market participants, dealers, and brokers. This applies to investments such as domestic equities, U.S. treasuries, exchange-traded mutual funds, and agency securities.
Quarterly Disclosure ReportSeptember 30, 2020
Notes to Combined Financial Statements - continued
-38-

Alternative InvestmentsInvestments held consist of marketable securities as well as securities that do not have readily determinable fair values. Private equity investments, real estate investments, and hedge funds are collectively referred to as “alternative investments.” These are included in unrestricted and restricted long-term investments in the accompanying combined balance sheets. The investments in alternative investments are valued by management at fair value utilizing the net asset value (NAV) provided by the underlying investment companies unless management determines some other valuation is more appropriate. Such fair value estimates do not reflect early redemption penalties as the System does not intend to sell such investments before the expiration of the early redemption periods. The fair values of the securities held by limited partnerships that do not have readily determinable fair values are determined by the general partner and are based on historical cost, appraisals, or other estimates that require varying degrees of judgment. If no public market exists for the investment securities, the fair value is determined by the general partner taking into consideration, among other things, the cost of securities, prices of recent significant placements of securities of the same issuer, and subsequent developments concerning the companies to which the securities relate. Investments valued at NAV are not leveled within the fair value hierarchy. BHCS Foundation also has other real estate and oil and gas interests which are carried at the lower of cost or market and represent Level 3 assets.
Beneficial InterestThe System records charitable remainder trusts, where it is not the trustee, at the discounted present value of the estimated future cash flows. These trusts are reported in contributions receivable, net, in the accompanying combined balance sheets. When a third-party serves as trustee, the beneficial interests are required to be measured at fair value on a recurring basis. As beneficial interests utilize multiple unobservable inputs, including no active markets, and are measured using management’s assumption about risk inherent in the valuation technique, beneficial interests in split-interest agreements represent Level 3 assets.
The methods described above may produce a fair value calculation that may not be indicative of net realizable value or reflective of future fair values. Furthermore, while the System believes its valuation methods are appropriate and consistent with other market participants, the use of different methodologies or assumptions to determine the fair value of certain financial instruments could result in a different estimate of fair value at the reporting date.
THE REMAINDER OF THIS PAGE WAS INTENTIONALLY LEFT BLANK
Quarterly Disclosure ReportSeptember 30, 2020
Notes to Combined Financial Statements - continued
-39-

The following table below sets forth, by level, the financial assets and liabilities measured at fair value on a recurring basis as of September 30, 2020 (in millions):
September 30, 2020
Assets: Total Level 1 Level 2 Level 3
Cash and cash equivalents
Cash $ 2,315 $ 2,315 $ — $ —
Money market funds 41 41 — —
Total cash and cash equivalents 2,356 2,356 — —
Short-term investments
Mutual funds 359 359 — —
Fixed income securities 2 — 2 —
U.S. government securities 1 — 1 —
Other 2 2 — —
Total short-term investments 364 361 3 —
Unrestricted long-term investments
Cash 1 1 — —
Certificates of deposit 1 1 — —
Mutual funds 549 549 — —
Equity securities 1,193 276 917 —
Fixed income securities 681 — 681 —
U.S. government securities 523 — 523 —
Mortgage-backed securities 155 — 155 —
Split-interest agreements 1 — 1 —
Cash surrender value of life insurance 1 — — 1
Common funds
Group investment fund 1 — 1 —
Assets held at NAV practical expedient (1)
Hedge funds/diversifiers alternative investments 613
Private equity/debt alternative investments 277
Real estate alternative investments 133
Total unrestricted long-term investments 4,129 827 2,278 1
In the accompanying combined balance sheets, unrestricted long-term investments at September 30, 2020 includes investments of approximately $130 million accounted for under the measurement alternative.
Quarterly Disclosure ReportSeptember 30, 2020
Notes to Combined Financial Statements - continued
-40-

September 30, 2020
Assets (continued): Total Level 1 Level 2 Level 3
Restricted long-term investments
Cash $ 8 $ 8 $ — $ —
Mutual funds 86 86 — —
Equity securities 163 37 126 —
Fixed income securities 33 — 33 —
U.S. government securities 24 — 24 —
Mortgage-backed securities 8 — 8 —
Split-interest agreements 5 — 5 —
Cash surrender value of life insurance 1 — — 1
Common funds
Group investment fund 51 — 51 —
Group bond fund 2 — 2 —
Group equity fund 5 — 5 —
Other funds 2 2 — —
Assets held at NAV practical expedient (1)
Hedge funds/diversifiers alternative investments 64
Private equity/debt alternative investments 31
Real estate alternative investments 8
Total restricted long-term investments 491 133 254 1
Assets Whose Use is Limited
Cash 1 1 — —
Money market funds 6 6 — —
Mutual funds 244 244 — —
Equity securities 2 2 — —
Fixed income securities 19 — 19 —
U.S. government securities 25 — 25 —
Mortgage-backed securities 8 — 8 —
Total assets whose use is limited 305 253 52 —
Contributions receivable, net
Total beneficial interests in split-interest agreements 33 — — 33
Total assets at fair value $ 7,678 $ 3,930 $ 2,587 $ 35
Liabilities:
Interest rate swap agreements, net of collateral $ 344 $ — $ 344 $ —
Total liabilities at fair value $ 344 $ — $ 344 $ —
(1) Hedge funds/diversifiers alternative investments, private equity/debt alternative investments, real estate alternative investments, and other investments for which fair value is measured using the NAV per share as a practical expedient are not leveled within the fair value hierarchy and are included as a reconciling item to total investments.
Quarterly Disclosure ReportSeptember 30, 2020
Notes to Combined Financial Statements - continued
-41-

At September 30, 2020, alternative investments recorded at NAV consisted of the following (in millions):
September 30, 2020
Fair ValueUnfunded
Commitments
RedemptionFrequency if
Currently Eligible
RedemptionNoticePeriod
Equity-linked investments a $ 56 $ — quarterly, annually 60-90 days
Event-driven investments b 81 — quarterly, annually 30-90 days
Credit-linked investments c 92 —
Multi-strategy investments d 1 — monthly, quarterly 30-90 days
Tactical trading investments e 103 — daily, monthly 2-90 days
Risk parity and global asset allocation fund f 344 — monthly 5-30 days
Real estate funds - open ended g 55 — quarterly 90 days
Real estate funds - closed ended h 86 16
Private equity funds i 237 111
Private debt funds j 71 30
Total $ 1,126 $ 157
a) Equity-linked fund managers buy equities that are expected to increase in value and sell short equities that are expected to decrease in value. Portfolios range from net short to net long, depending on market conditions. Aggressive funds may capture returns by exceeding 100% exposure while conservative funds mitigate market risk by maintaining net exposures of between 0-50%. Typically, equity-linked strategies are based on "bottom up" fundamental analysis of the individual companies, in which investments are made. There may also be "top down" analysis of the risks and opportunities offered by industries, sectors, countries, and the macroeconomic situation. Equity-linked managers may be generalists or focus on certain industries, sectors, regions, or equity category (i.e. small or large cap and value or growth). There are many trading styles, with frequent or dynamic traders and some longer-term investors. Returns are generally more correlated with the direction of the equity markets, although reduction in market risk exposure through shorting is expected to enhance the absolute and risk-adjusted returns relative to the overall performance of the asset class. The fair values of the investments in this class have been estimated using the net asset value per share of the funds.
b) Event-driven fund managers seek to exploit pricing inefficiencies that may occur before or after corporate events such as an earnings announcement, bankruptcy, merger, acquisition, or spinoff. Returns are less correlated with the general direction of market movements primarily due to the idiosyncratic nature of individual events. Several investment managers include quarterly percentage
Quarterly Disclosure ReportSeptember 30, 2020
Notes to Combined Financial Statements - continued
-42-

redemption limits. The fair values of the investments in this class have been estimated using the net asset value per share of the funds.
c) Credit-linked fund managers seek to profit from the mispricing of related securities. These strategies utilize quantitative and qualitative analysis to identify securities or spreads between securities that deviate from their fair value and/or historical norms. Examples include convertible arbitrage, fixed arbitrage, statistical arbitrage, and select global macro strategies. Fund returns are generally not dependent on the direction of market movements. The fair values of the investments in this class have been estimated using the net asset value per share of the funds.
d) Multi-strategy fund managers focus on large, long-term mispricing in the global fixed-income, equity and credit markets, capturing relative-value anomalies via multi-product trades. Returns are relatively uncorrelated with the general direction of market movements since they avoid taking a directional bias with regards to the price movement of a specific stock or market. Several investment managers include quarterly percentage redemption limits and/or early redemption penalties. The fair values of the investments in this class have been estimated using the net asset value per share of the funds.
e) Tactical trading fund managers generally invest on a large scale around the world using economic theory to justify the decision making process on either a discretionary or systematic basis. Strategies are typically based on forecasts and analysis about interest rate trends, the general flow of funds, political changes, government policies, inter-government relations, and other broad systemic and technical factors. Returns are relatively uncorrelated with the general direction of market movements. Several investment managers include quarterly percentage redemption limits. The fair values of the investments in this class have been estimated using the net asset value per share of the funds.
f) Risk parity and global asset allocation fund managers invest across global markets including equities, nominal government bonds, inflation linked bonds, commodities, and emerging markets on a risk balanced framework. Typically, these strategies incorporate leverage to increase the risk contribution from low volatility asset classes (e.g., inflation-linked bonds and nominal government bonds). The fair values of the investments in this class have been estimated using the net asset value per share of the funds.
g) Real estate – open end fund managers invest in U.S. commercial real estate. Redemptions are available on a quarterly basis, subject to the discretion of the General Partners. The General Partners may elect to establish a redemption queue should the level of redemptions for a given quarter be detrimental to the fund’s overall performance. The fair values of the investments in this class have
Quarterly Disclosure ReportSeptember 30, 2020
Notes to Combined Financial Statements - continued
-43-

been estimated using the net asset value, which is based on the ownership interest of partners' capital.
h) Real estate – closed end fund managers invest primarily in U.S. commercial real estate and industries related to real estate, with some having minimal exposure outside of the U.S. These partnerships are illiquid, and therefore do not have a redemption feature. Distributions from each fund will be received as the underlying investments of the funds are liquidated. It is estimated that the underlying assets of these funds will be liquidated over the next six years with the value of those underlying assets being replaced by investments in new real estate funds. The fair values of the investments in this class have been estimated using the net asset value, which is based on the ownership interest of partners' capital.
i) Forty-five private equity fund managers invest in a variety of mostly private companies. These investments have a drawdown structure where a portion of commitments (which are made upon entering the partnership) are called gradually over the first 3-6 years of the partnership’s life. It is expected that most of the unfunded commitments should be called within the next 6 years. These partnerships are illiquid, and therefore do not have a redemption feature. Instead, the nature of the investments, in this class, is that distributions are received as the investment in the underlying companies are sold. It is estimated that the current underlying assets of these partnerships should be liquidated within the next 10 years. The investments are valued based on each partnership’s valuation policy which is then subject to annual third-party financial audits. Financial audits are available approximately 90 days following year end. Therefore, the valuation at year end reflects the latest reported manager valuation with adjustments for new capital calls and distributions.
j) Fourteen private debt fund managers invest in a variety of mostly private companies. These investments have a drawdown structure where a portion of commitments (which are made upon entering the partnership) are called gradually over the first 1-3 years of the partnership’s life. It is expected that most of the unfunded commitments should be called within the next 4 years. These partnerships are illiquid, and therefore do not have a redemption feature. Instead, distributions are received as income from the debt and as the investment in the underlying companies are sold or the debt principal is repaid. It is estimated that the current underlying assets of these partnerships should be liquidated within the next 6 years. The investments are valued based on each partnership’s valuation policy which is then subject to annual third party financial audits. Financial audits are available approximately 90 days following year end. Therefore, the valuation at year end reflects the latest reported manager valuation with adjustments for new capital calls and distributions.
Quarterly Disclosure ReportSeptember 30, 2020
Notes to Combined Financial Statements - continued
-44-

4. RETIREMENT BENEFITS
The System provides 401(k) defined contribution plans for eligible employees. Employees are eligible to contribute to the plans immediately with no minimum service or age requirement.
The System has two frozen defined benefit plans. One of the plans is subject to ERISA and is being funded in accordance with regulatory requirements.
5. ENDOWMENTS
The System’s endowments consist of donor-restricted and board-designated endowment funds for a variety of purposes. The net assets associated with endowment funds are classified and reported based on the existence or absence of donor imposed restrictions. The System has interpreted the State of Texas Uniform Prudent Management of Institutional Funds Act (UPMIFA) as requiring the preservation of the original gift as of the gift date of the donor-restricted endowment funds, absent explicit donor stipulation to the contrary. As a result of this interpretation, the System classifies as donor-restricted endowments, (a) the original value of gifts donated to the donor-restricted endowment, (b) the original value of subsequent gifts to the donor-restricted endowment, and (c) accumulations to the donor-restricted endowment made in accordance with the direction of the applicable donor gift instrument at the time the accumulation is added to the fund. The remaining portion of the donor-restricted endowment fund that is not subject to explicit donor stipulations, is classified as net assets with donor restrictions until those amounts are appropriated for expenditure by the System in a manner consistent with the standard of prudence prescribed by UPMIFA. In accordance with UPMIFA, the System considers the following factors in making a determination to appropriate or accumulate endowment funds:
1) The duration and preservation of the fund2) The purposes of the System and the donor restricted endowment fund3) General economic conditions4) The possible effect of inflation and deflation5) The expected total return from income and the appreciation of investments6) Other resources of the System and7) The investment policies of the System
Endowment Return Objectives and Risk ParametersThe System follows an investment policy that attempts to provide a predictable stream of funding to programs supported by its endowment while seeking to maintain the purchasing power of endowment assets. Under this policy, the return objective for the endowment assets, measured over a full market cycle, shall be to maximize the return against various indices, based on the endowment’s target allocation applied to the
Quarterly Disclosure ReportSeptember 30, 2020
Notes to Combined Financial Statements - continued
-45-

appropriate individual benchmarks. To achieve its long-term rate of return objectives, the System relies on a total return strategy in which investment returns are achieved through both capital appreciation (realized and unrealized gains) and current yield (interest and dividends). The System targets a diversified asset allocation that places greater emphasis on equity-based investments to achieve its long-term objectives within prudent risk constraints.
Relationship of Endowment Spending Practices to Investment ObjectivesThe System determines the appropriation of endowment funds for expenditure reimbursement through the budgeting process. Distribution policies for the System’s endowments govern the amount of endowment funds that may be appropriated during this process. In establishing its policies, the System considered the long-term expected return on its endowments. Accordingly, over the long-term, the System expects the current distribution policies to allow its endowments to grow at an average of the long-term rate of inflation and maintain its purchasing power. In order to maintain the purchasing power of endowment assets, expenditures are based on investment performance and spending is curbed in response to deficit situations. Over the long-term, the System expects its endowments to grow consistent with its intention to maintain the purchasing power of the endowment assets as well as to provide additional real growth through new gifts.
6. CONTINGENCIES
The healthcare industry is subject to numerous laws and regulations of federal, state, and local governments. These laws and regulations include, but are not necessarily limited to, matters such as licensure, accreditation, government healthcare program participation requirements, reimbursement for patient services, physician ownership and self-referral, and Medicare and Medicaid fraud and abuse. The System has government activity and litigation with respect to investigations and allegations concerning possible violations of fraud and abuse statutes and regulations by healthcare providers. Violations of these laws and regulations could result in expulsion from government healthcare programs together with the imposition of significant fines and penalties, as well as significant repayments for patient services previously billed. Management believes that the System is in compliance with applicable fraud and abuse laws and regulations as well as other applicable federal and state laws and regulations.
THE REMAINDER OF THIS PAGE WAS INTENTIONALLY LEFT BLANK
Quarterly Disclosure ReportSeptember 30, 2020
Notes to Combined Financial Statements - continued
-46-
7. SUBSEQUENT EVENTS
Provider Relief Funds Reporting RequirementsDuring September and October 2020, the Department of Health and Human Services (HHS) issued updated reporting requirements significantly changing the previous guidance regarding utilization of the funds granted from the Provider Relief Funds under the CARES Act and other legislation. As a result of the updated guidance from HHS, BSWH could be required to derecognize and return a portion of the original grant income recorded, which is not expected to be material. BSWH is continuing to monitor the reporting requirements as they evolve.
The System has performed an evaluation of material subsequent events and transactions from September 30, 2020 through November 12, 2020.
THE REMAINDER OF THIS PAGE WAS INTENTIONALLY LEFT BLANK
Quarterly Disclosure ReportSeptember 30, 2020
Notes to Combined Financial Statements - continued
-47-

BAYLOR SCOTT & WHITE HEALTHSUPPLEMENTARY COMBINING FINANCIAL INFORMATION OF THE OBLIGATED AFFILIATES AND BSWH
COMBINING BALANCE SHEETSSEPTEMBER 30, 2020
($ in millions)
ObligatedAffiliates *
Consolidated Health Plan†
Other SystemEntities
Reclassificationsand Eliminations Total
ASSETSCURRENT ASSETS:
Cash and cash equivalents $ 1,592 $ 322 $ 442 $ — $ 2,356 Short-term investments 159 41 164 — 364 THVG funds due from United Surgical Partners, Inc. — — 222 — 222 Accounts receivable:
Patient 511 — 350 (51) 810 Premiums — 100 — — 100 Affiliates, net 126 — — (126) — Other 105 53 100 (4) 254
Other current assets 237 16 99 — 352 Total current assets 2,730 532 1,377 (181) 4,458
LONG-TERM INVESTMENTS:Unrestricted 3,617 176 466 — 4,259 Restricted 2 — 489 — 491
Total long-term investments 3,619 176 955 — 4,750
ASSETS WHOSE USE IS LIMITED:Other designated assets 173 2 9 — 184 Self insurance reserves — — 121 — 121
Total assets whose use is limited 173 2 130 — 305
PROPERTY AND EQUIPMENT, net 2,930 27 1,103 (14) 4,046
RIGHT OF USE OPERATING LEASE ASSETS, net (1) 351 — 736 (238) 849
CONTRIBUTIONS RECEIVABLE, net 1 — 167 — 168
DUE FROM AFFILIATES 198 — 64 (262) —
INVESTMENTS IN SUBSIDIARIES AND AFFILIATES 2,198 — — (2,198) —
OTHER LONG-TERM ASSETS:Equity investment in unconsolidated entities 47 — 21 — 68 Goodwill and intangible assets, net 86 5 783 (2) 872 Interest in net assets of related foundations 427 — 107 (530) 4 Other 11 2 6 (2) 17
Total other long-term assets 571 7 917 (534) 961
Total assets $ 12,771 $ 744 $ 5,449 $ (3,427) $ 15,537
*Obligated Affiliates combines Baylor Health Care System; Baylor University Medical Center; Baylor All Saints Medical Center; Baylor Medical Center at Waxahachie; Baylor Regional Medical Center at Grapevine; Baylor Medical Center at Plano; Scott & White Healthcare; Scott & White Memorial Hospital (inclusive of McLane Children's Hospital Scott & White); Scott & White Clinic; Scott & White Hospital - Round Rock; Scott & White Continuing Care Hospital; Hillcrest Baptist Medical Center; Baylor Scott & White Holdings; Baylor Scott & White Health; Baylor Medical Centers at Garland and McKinney; and Scott & White Hospital - College Station.† Consolidated Health Plan includes Scott and White Health Plan, Insurance Company of Scott and White, Scott and White Care Plans, SHA L.L.C., and Southwest Life & Health Insurance Company.(1) Combining balance sheets exclude intercompany operating leases which eliminate at the System level.
Quarterly Disclosure ReportSeptember 30, 2020
-48-

BAYLOR SCOTT & WHITE HEALTHSUPPLEMENTARY COMBINING FINANCIAL INFORMATION OF THE OBLIGATED AFFILIATES AND BSWH
COMBINING BALANCE SHEETS - CONTINUEDSEPTEMBER 30, 2020
($ in millions)
ObligatedAffiliates *
ConsolidatedHealth Plan†
Other SystemEntities
Reclassificationsand Eliminations Total
LIABILITIES AND NET ASSETSCURRENT LIABILITIES:
Current maturities of long-term debt and finance lease obligations $ 66 $ — $ 37 $ — $ 103
Long-term debt subject to short-term remarketing arrangements 95 — — — 95
Commercial paper 208 — — — 208 Accounts payable:
Trade accounts payable 191 8 88 — 287 Affiliates, net — 38 88 (126) —
Accrued liabilities:Payroll related 525 2 121 — 648 Third-party programs 486 4 309 28 827 Medical claims payable — 155 — (79) 76 Operating lease liabilities (1) 60 — 105 (16) 149 Other 311 89 218 (16) 602
Total current liabilities 1,942 296 966 (209) 2,995
LONG-TERM DEBT AND FINANCE LEASE OBLIGATIONS, less current maturities 2,902 — 346 — 3,248
OTHER LONG-TERM LIABILITIES:Self insurance and other insurance liabilities (1) — 121 — 120 Interest rate swap liabilities, net 344 — — — 344 Long-term operating lease liabilities (1) 328 — 689 (225) 792 Other 191 38 63 (1) 291
Total other long-term liabilities 862 38 873 (226) 1,547
DUE TO AFFILIATES — — 260 (260) —
Total liabilities 5,706 334 2,445 (695) 7,790
COMMITMENTS AND CONTINGENCIES
NONCONTROLLING INTERESTS - REDEEMABLE — — 333 136 469
NET ASSETS:Net assets without donor restrictions:
Attributable to BSWH 6,601 410 1,839 (2,562) 6,288 Noncontrolling interests - nonredeemable 29 — 44 224 297
Total net assets without donor restrictions 6,630 410 1,883 (2,338) 6,585 Net assets with donor restrictions 435 — 788 (530) 693
Total net assets 7,065 410 2,671 (2,868) 7,278
Total liabilities and net assets $ 12,771 $ 744 $ 5,449 $ (3,427) $ 15,537
*Obligated Affiliates combines Baylor Health Care System; Baylor University Medical Center; Baylor All Saints Medical Center; Baylor Medical Center at Waxahachie; Baylor Regional Medical Center at Grapevine; Baylor Medical Center at Plano; Scott & White Healthcare; Scott & White Memorial Hospital (inclusive of McLane Children's Hospital Scott & White); Scott & White Clinic; Scott & White Hospital - Round Rock; Scott & White Continuing Care Hospital; Hillcrest Baptist Medical Center; Baylor Scott & White Holdings; Baylor Scott & White Health; Baylor Medical Centers at Garland and McKinney; and Scott & White Hospital - College Station.† Consolidated Health Plan includes Scott and White Health Plan, Insurance Company of Scott and White, Scott and White Care Plans, SHA L.L.C., and Southwest Life & Health Insurance Company.(1) Combining balance sheets exclude intercompany operating leases which eliminate at the System level.
Quarterly Disclosure ReportSeptember 30, 2020
-49-

BAYLOR SCOTT & WHITE HEALTHSUPPLEMENTARY COMBINING FINANCIAL INFORMATION OF THE OBLIGATED AFFILIATES AND BSWH
COMBINING STATEMENTS OF OPERATIONS AND CHANGES IN NET ASSETSFOR THE THREE MONTHS ENDED SEPTEMBER 30, 2020
($ in millions)
ObligatedAffiliates *
ConsolidatedHealth Plan†
Other SystemEntities
Reclassificationsand Eliminations Total
OPERATING REVENUE:Net patient care revenue $ 1,324 $ — $ 1,004 $ (122) $ 2,206 Premium revenue — 435 — — 435 Other operating revenue 177 6 172 (170) 185 Net assets released from restrictions for operations 1 — 19 (1) 19
Total operating revenue 1,502 441 1,195 (293) 2,845
OPERATING EXPENSES:Salaries, wages, and employee benefits 745 18 464 (7) 1,220 Supplies 230 — 218 — 448 Other operating expenses 299 19 302 (160) 460 Medical claims — 327 — (131) 196 Depreciation and amortization 70 1 36 — 107 Interest 20 — 9 (3) 26
Total operating expenses 1,364 365 1,029 (301) 2,457
INCOME FROM OPERATIONS 138 76 166 8 388
NONOPERATING GAINS (LOSSES):Gains (losses) on investments, net 106 6 34 (3) 143 Interest rate swap activity 19 — — — 19 Contributions 4 — — (4) — Equity in earnings of unconsolidated entities 6 — — — 6 Other 57 — 3 (60) —
Total nonoperating gains (losses) 192 6 37 (67) 168
REVENUE AND GAINS IN EXCESS (DEFICIT) OF EXPENSES AND LOSSES BEFORE TAXES 330 82 203 (59) 556
LESS INCOME TAX EXPENSE — — 4 — 4
REVENUE AND GAINS IN EXCESS (DEFICIT) OF EXPENSES AND LOSSES 330 82 199 (59) 552
*Obligated Affiliates combines Baylor Health Care System; Baylor University Medical Center; Baylor All Saints Medical Center; Baylor Medical Center at Waxahachie; Baylor Regional Medical Center at Grapevine; Baylor Medical Center at Plano; Scott & White Healthcare; Scott & White Memorial Hospital (inclusive of McLane Children's Hospital Scott & White); Scott & White Clinic; Scott & White Hospital - Round Rock; Scott & White Continuing Care Hospital; Hillcrest Baptist Medical Center; Baylor Scott & White Holdings; Baylor Scott & White Health; Baylor Medical Centers at Garland and McKinney; and Scott & White Hospital - College Station.† Consolidated Health Plan includes Scott and White Health Plan, Insurance Company of Scott and White, Scott and White Care Plans, SHA L.L.C., and Southwest Life and Health Insurance Company.
Quarterly Disclosure ReportSeptember 30, 2020
-50-

BAYLOR SCOTT & WHITE HEALTHSUPPLEMENTARY COMBINING FINANCIAL INFORMATION OF THE OBLIGATED AFFILIATES AND BSWH
COMBINING STATEMENTS OF OPERATIONS AND CHANGES IN NET ASSETS - CONTINUEDFOR THE THREE MONTHS ENDED SEPTEMBER 30, 2020
($ in millions)
ObligatedAffiliates *
ConsolidatedHealth Plan†
Other SystemEntities
Reclassificationsand Eliminations Total
OTHER CHANGES IN NET ASSETS WITHOUT DONOR RESTRICTIONS:
Other changes in net assets attributable to noncontrolling interests - nonredeemable $ — $ — $ (147) $ 94 $ (53)
Revenue and gains in deficit of expenses and losses attributable to noncontrolling interests - redeemable — — (59) (22) (81)
Transfers between entities under common control 30 1 (36) 5 — Other — — (3) 4 1
INCREASE (DECREASE) IN NET ASSETS WITHOUT DONOR RESTRICTIONS 360 83 (46) 22 419
CHANGES IN NET ASSETS WITH DONOR RESTRICTIONS:Contributions 2 — 12 (1) 13 Realized gains on investments, net — — 4 — 4 Unrealized gains on investments, net — — 17 — 17 Change in value of split-interest agreements — — 1 — 1 Net assets released from restrictions for operations (1) — (19) 1 (19) Other — — (3) — (3)
INCREASE IN NET ASSETS WITH DONOR RESTRICTIONS 1 — 12 — 13
INCREASE (DECREASE) IN NET ASSETS 361 83 (34) 22 432
NET ASSETS, beginning of period 6,704 327 2,705 (2,890) 6,846
NET ASSETS, end of period $ 7,065 $ 410 $ 2,671 $ (2,868) $ 7,278
*Obligated Affiliates combines Baylor Health Care System; Baylor University Medical Center; Baylor All Saints Medical Center; Baylor Medical Center at Waxahachie; Baylor Regional Medical Center at Grapevine; Baylor Medical Center at Plano; Scott & White Healthcare; Scott & White Memorial Hospital (inclusive of McLane Children's Hospital Scott & White); Scott & White Clinic; Scott & White Hospital - Round Rock; Scott & White Continuing Care Hospital; Hillcrest Baptist Medical Center; Baylor Scott & White Holdings; Baylor Scott & White Health; Baylor Medical Centers at Garland and McKinney; and Scott & White Hospital - College Station.† Consolidated Health Plan includes Scott and White Health Plan, Insurance Company of Scott and White, Scott and White Care Plans, SHA L.L.C., and Southwest Life and Health Insurance Company.
Quarterly Disclosure ReportSeptember 30, 2020
-51-

BAYLOR SCOTT & WHITE HEALTHOBLIGATED AFFILIATES - COMBINED STATEMENT OF CASH FLOWS
FOR THE THREE MONTHS ENDED SEPTEMBER 30, 2020($ in millions)
Cash Flows from Operating Activities:Increase in net assets $ 361 Adjustments to reconcile increase in net assets to net cash provided by operating activities:
Unrealized gains on investments, net (84) Realized gains on investments, net (10) Unrealized gains on interest rate swap, net (26) Depreciation and amortization 70 Transfers between entities under common control (30) Changes in operating assets and liabilities (net of acquisitions):
Increase in patient accounts receivable (20) Decrease in other accounts receivable 20 Decrease in other assets 10 Decrease in affiliates receivable, net and due from affiliates, net 6 Increase in trade accounts payable and accrued liabilities 34 Increase in other liabilities 18
Net cash provided by operating activities 349
Cash Flows from Investing Activities:Purchases of property and equipment (78) Cash proceeds from sales of assets 1 Increase in trading investments (67) Net payments on interest rate swap (4) Decrease in investments of subsidiaries 30 Increase in assets whose use is limited (9)
Net cash used in investing activities (127)
Cash Flows from Financing Activities:Principal payments on long-term debt (4) Transfers between entities under common control 30
Net cash provided by financing activities 26
Net increase in cash and cash equivalents 248 Cash and Cash Equivalents, beginning of period 1,344 Cash and Cash Equivalents, end of period $ 1,592
Quarterly Disclosure ReportSeptember 30, 2020
-52-