quantitative silviculture - ncsu-feop.org · quantitative silviculture • quantify how stands ......
TRANSCRIPT
Quantitative Silviculture:Stocking Guides and Density Management
Diagrams
James B. McCarterAdjunct Associate Professor,
Forestry and Environmental Resources, NC State University
Outline
• Silviculture Review (Traditional)– Silviculture definition, Forest Stand Dynamics, Silviculture Methods, Application of Silviculture
• Quantitative Silviculture– Site Productivity, Stocking and Density, Growth and Yield, Stand Density Measures
• Stocking Guides• Density Management Theory• Density Management Diagrams
Quantitative Silviculture ‐ Outline
• Brief overview through examples• Site Productivity• Site Occupancy/Stocking• Normality / Normal Stands• Growth and Yield• Measures of Stand Density
Quantitative Silviculture
• Quantitative silviculture involves techniques and tools to quantify site productivity, site occupancy, stand and tree growth, stand and tree yield, and response to silvicultural treatments
• It is a combination of traditional silviculture, forest measurements, growth and yield, statistics, analysis, GIS, computer graphics, visualization, and software development
Quantitative Silviculture
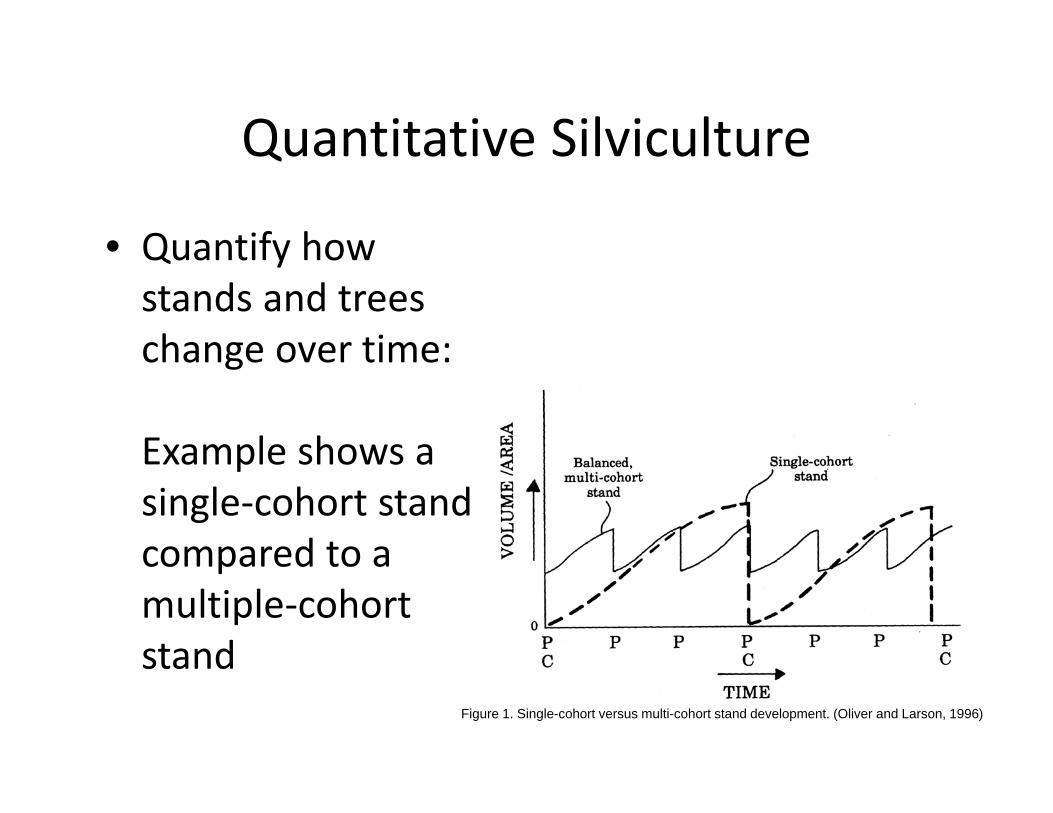
• Quantify how stands and trees change over time:
Example shows a single‐cohort stand compared to a multiple‐cohort stand
Figure 1. Single-cohort versus multi-cohort stand development. (Oliver and Larson, 1996)
Quantitative Silviculture
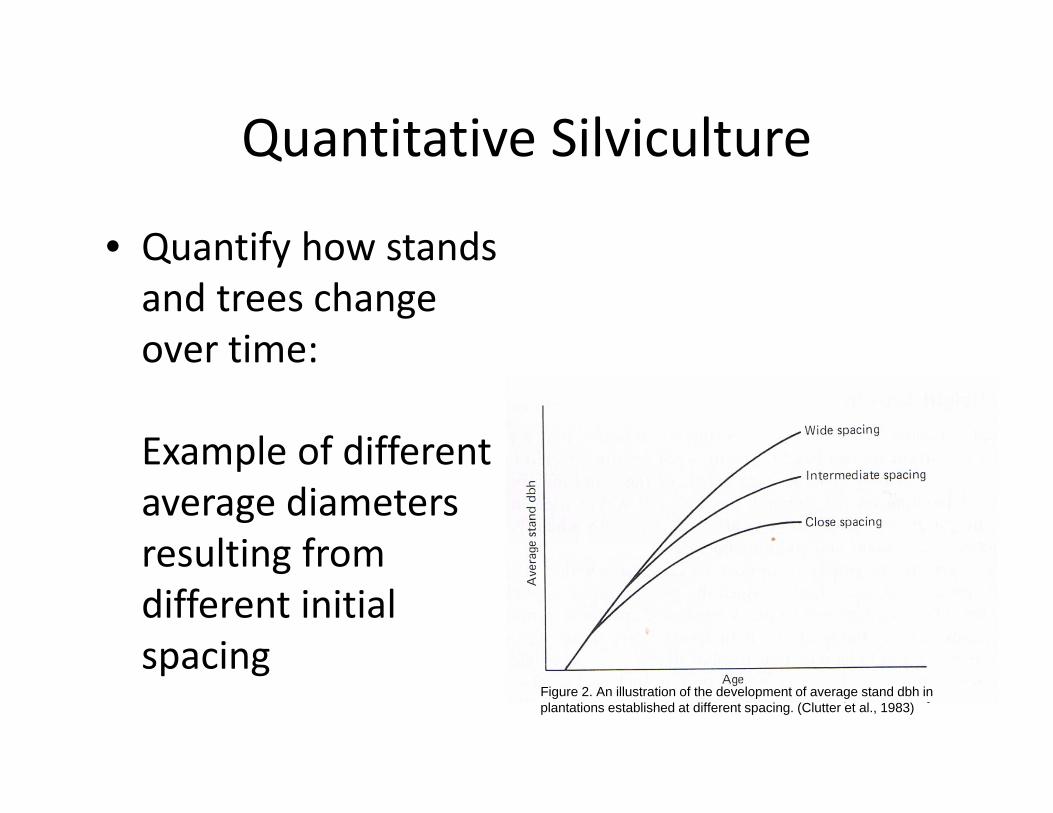
• Quantify how stands and trees change over time:
Example of different average diameters resulting from different initial spacing
Figure 2. An illustration of the development of average stand dbh in plantations established at different spacing. (Clutter et al., 1983)
Quantitative Silviculture
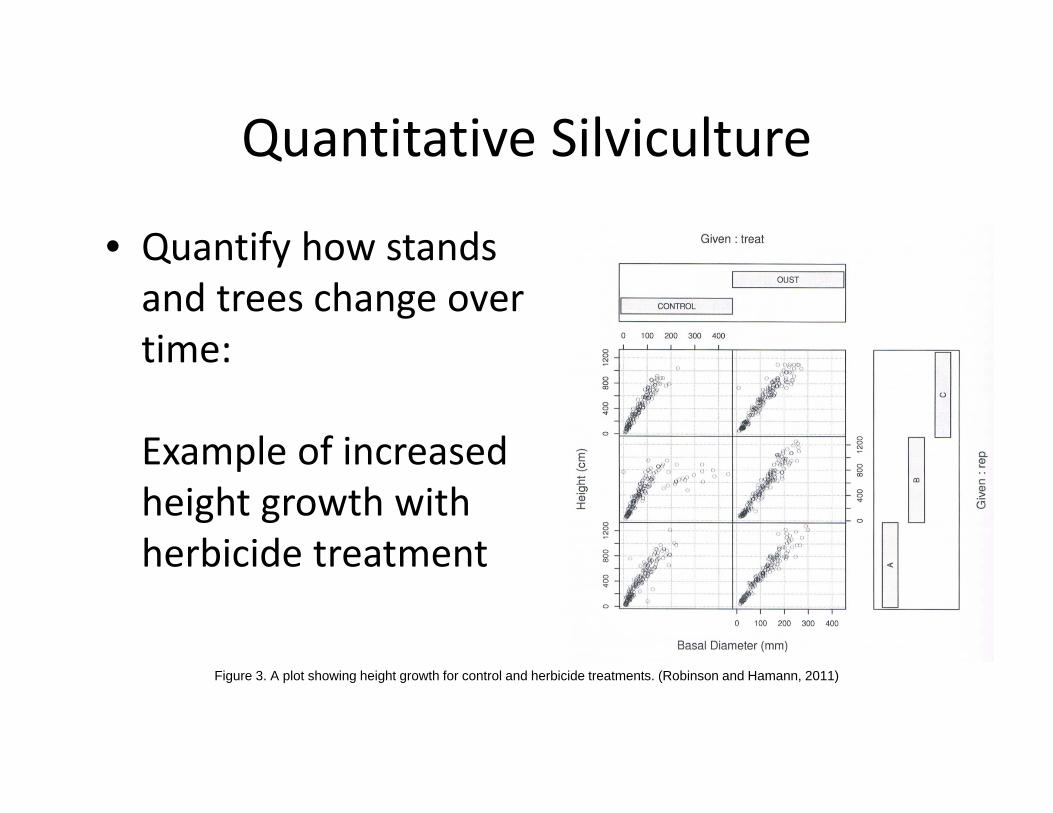
• Quantify how stands and trees change over time:
Example of increased height growth with herbicide treatment
Figure 3. A plot showing height growth for control and herbicide treatments. (Robinson and Hamann, 2011)
Quantitative Silviculture
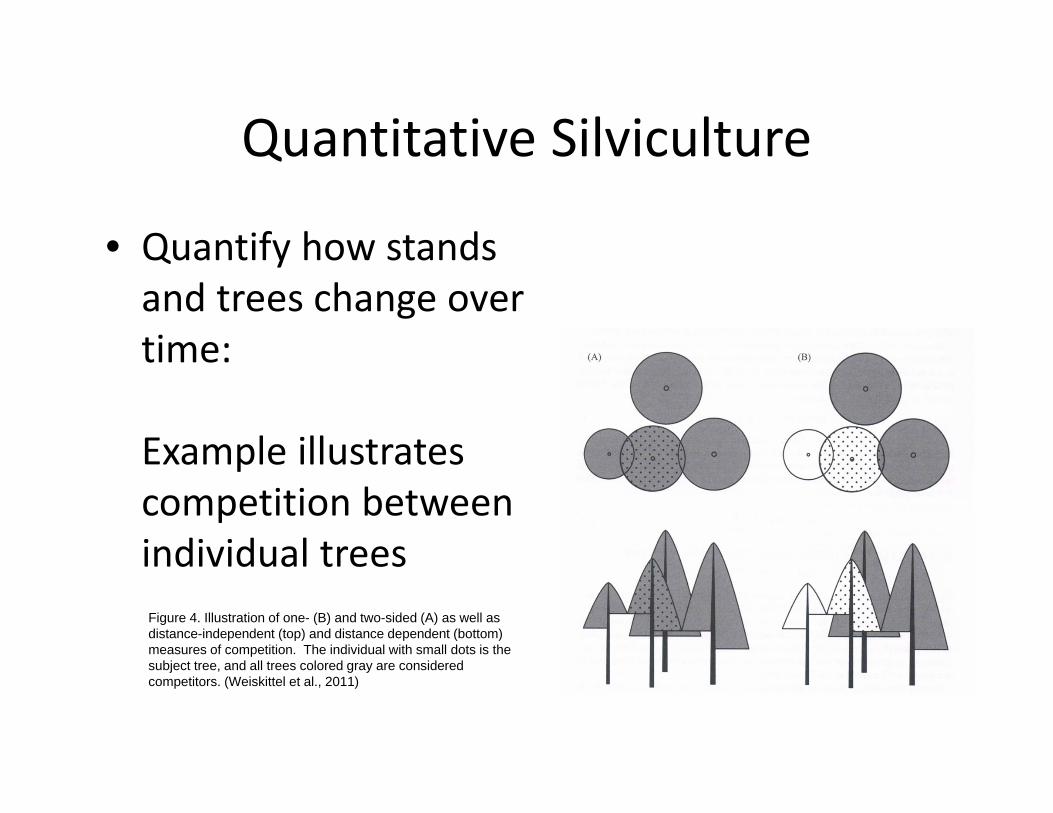
• Quantify how stands and trees change over time:
Example illustrates competition between individual treesFigure 4. Illustration of one- (B) and two-sided (A) as well as distance-independent (top) and distance dependent (bottom) measures of competition. The individual with small dots is the subject tree, and all trees colored gray are considered competitors. (Weiskittel et al., 2011)
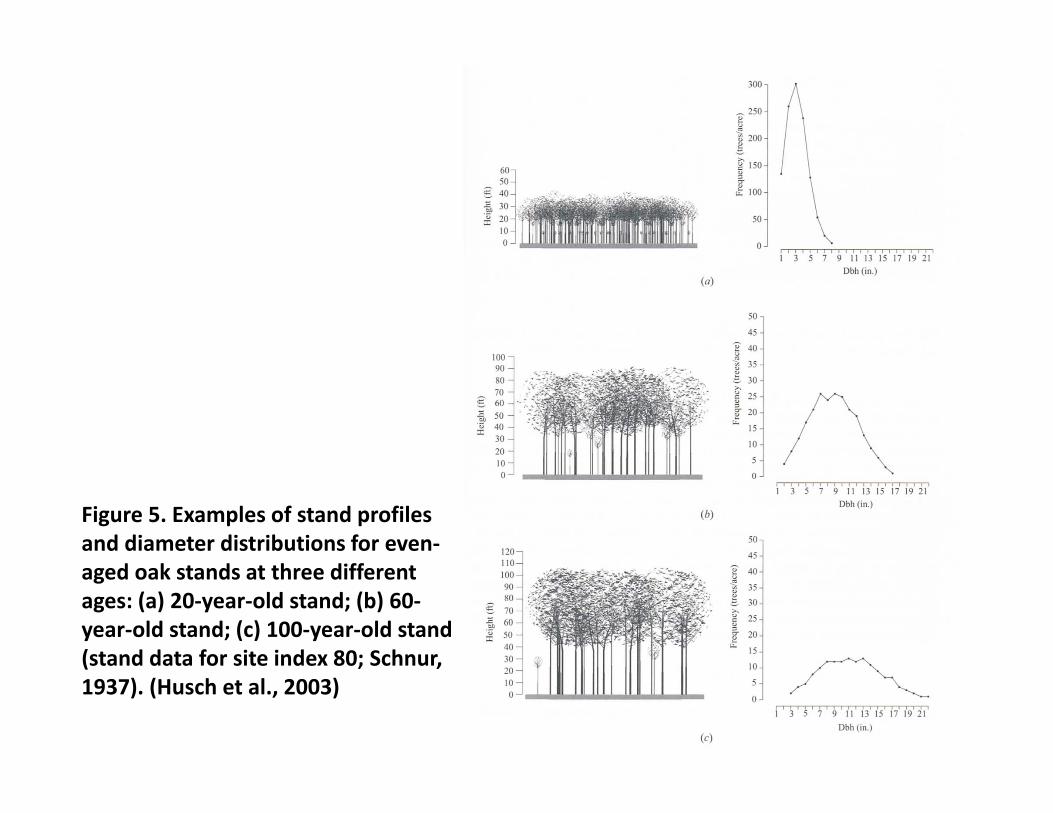
Figure 5. Examples of stand profiles and diameter distributions for even‐aged oak stands at three different ages: (a) 20‐year‐old stand; (b) 60‐year‐old stand; (c) 100‐year‐old stand (stand data for site index 80; Schnur, 1937). (Husch et al., 2003)
Site Productivity
• Site Productivity/Quality is the sum of many environmental factors: soil depth, soil texture, mineral composition, slope, aspect, microclimate, species, and others.
• Quantification gives an estimate of how much can be produced at a given location
• Evaluated by looking at:– Site/soil– Indicator plants– Tree characteristics (common in forestry)
Site Index
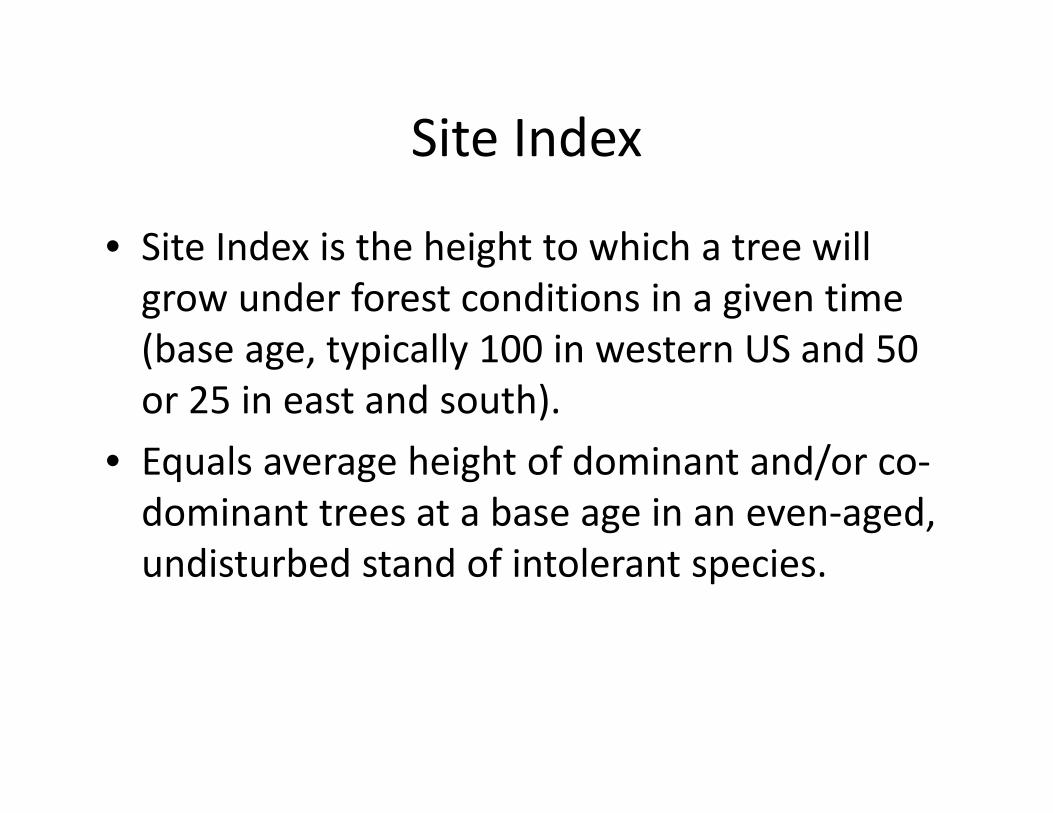
• Site Index is the height to which a tree will grow under forest conditions in a given time (base age, typically 100 in western US and 50 or 25 in east and south).
• Equals average height of dominant and/or co‐dominant trees at a base age in an even‐aged, undisturbed stand of intolerant species.
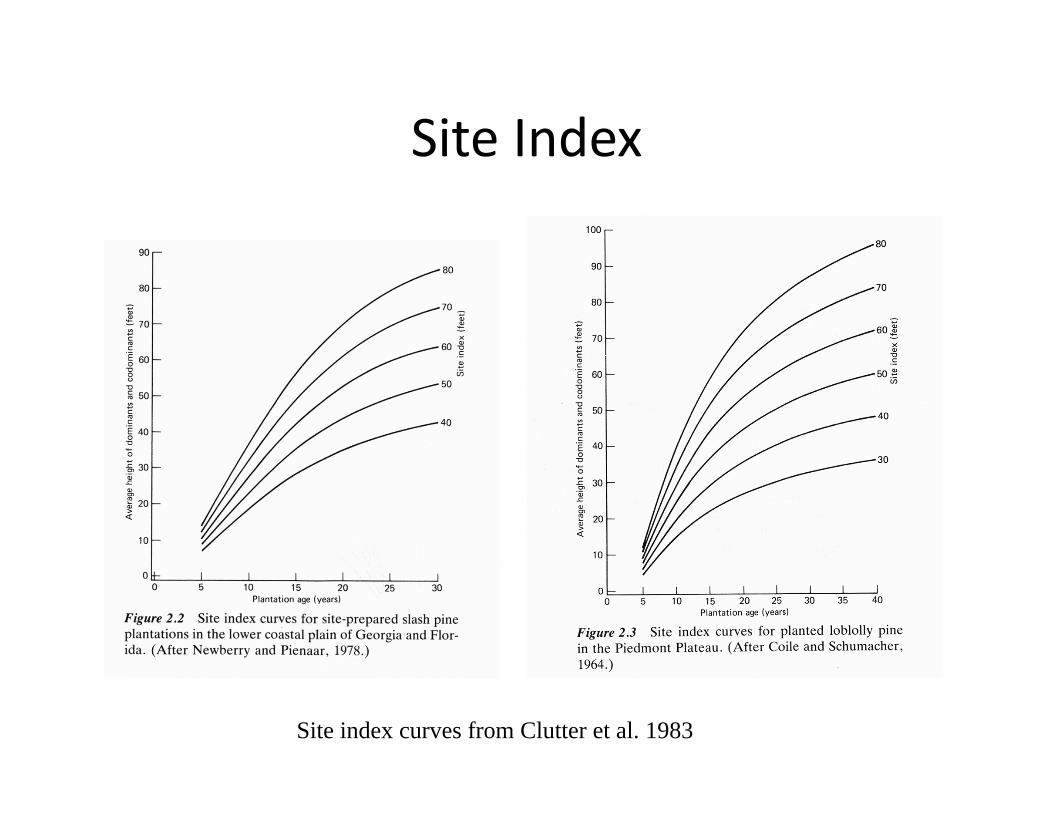
Site Index
Site index curves from Clutter et al. 1983
Site Index ‐ Problems
• Site Index does not work as well for un‐even aged stands
• What is the site index for a site for a given species if that species is not currently growing there?
Site Occupancy/Stocking
• Stocking is a relative term used to describe the adequacy of a stand to meet some management objective (Husch et al. 1972)
– Compares the existing number of trees in a stand to the number desired for some desired or optimal growth
– Adequacy is qualitative
Stocking and Stand Density
• Stand Density is a quantitative measure of the degree of crowding of stems within a stand (Husch et al. 1972)
– It is a measure of stand level competition– It is fundamental to thinning and spacing studies– Can be expressed using a number of variables (#, size, etc)
Normal Stocking or Normal Stands
• Normal stands are “fully stocked” as judged against some concept of desirable amount of above ground biomass for a stand
• Early normal yield tables were developed with stands that showed evidence of suppression mortality or self‐thinning
• Examples of normal yield tables: – Douglas‐fir yield tables for PNW, Bull 201 (McArdle at al. 1949)
– Southern Pines, Misc Pub No. 50 (USDA FS 1929)
Implications of Stocking• Full stocking – maximum or optimal volume/value production
• Understocking – less than optimal production– Wood quality may be reduced because more juvenile wood, larger crown, larger branches (knots), more taper, “rough” form…
• Overstocking – less than optimal– Reduced product size, quality affected (smaller stem diameter, shorter, less taper, better natural pruning), reduces vigor (stagnation?, insect and disease problems?), less growth to mortality (can’t harvest because too small), lower crown ratio (decrease potential response to thinning)
Growth and Yield
• Yield = how much you have, what is there
• Growth = change in yield, increase (or decrease) in some quantity over a period of time
• Any variable of interest can be a measurement of growth or yield: number, size (diameter, height), age, volume, biomass, carbon, cover, habitat, water, etc…
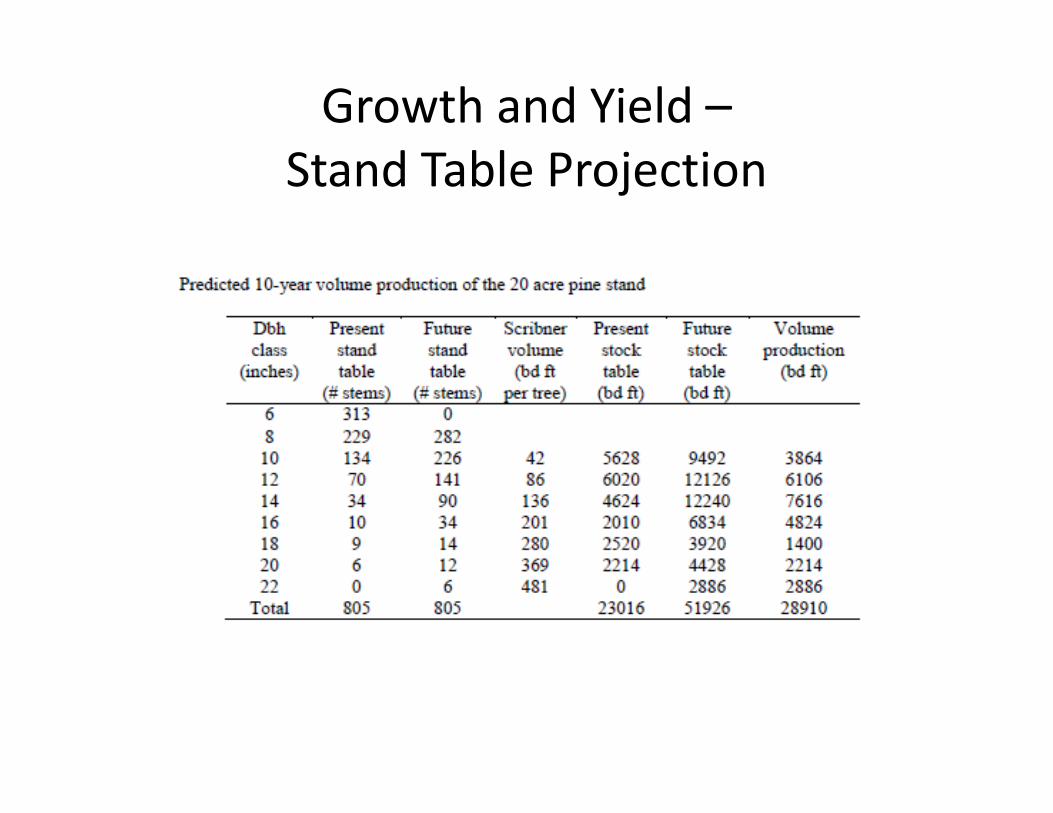
Growth and Yield –Stand Table Projection
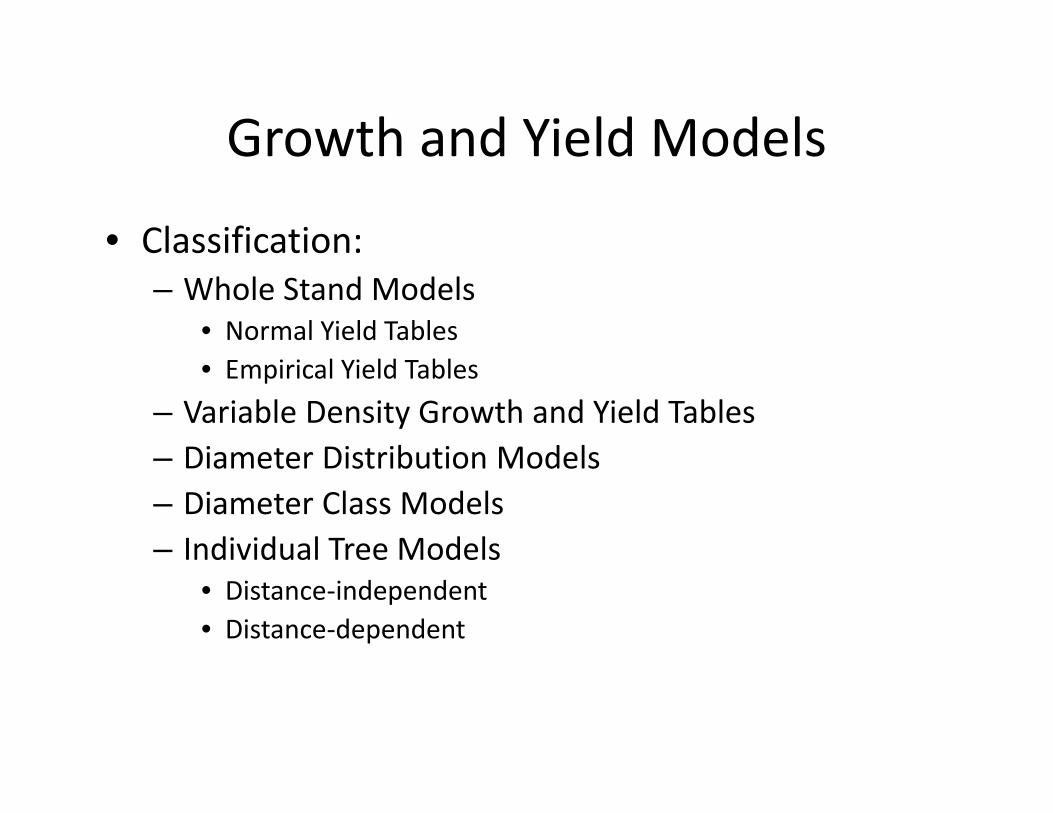
Growth and Yield Models
• Classification:– Whole Stand Models
• Normal Yield Tables• Empirical Yield Tables
– Variable Density Growth and Yield Tables– Diameter Distribution Models– Diameter Class Models– Individual Tree Models
• Distance‐independent• Distance‐dependent

Measures of Stand Density
• Frequently we are interested in how a stand is doing compared to a desired goal.
• Number of individuals (density) and size are useful measures
– Single dimension measures (single variable, absolute)
– Multiple dimension measures (relative) – provides more information
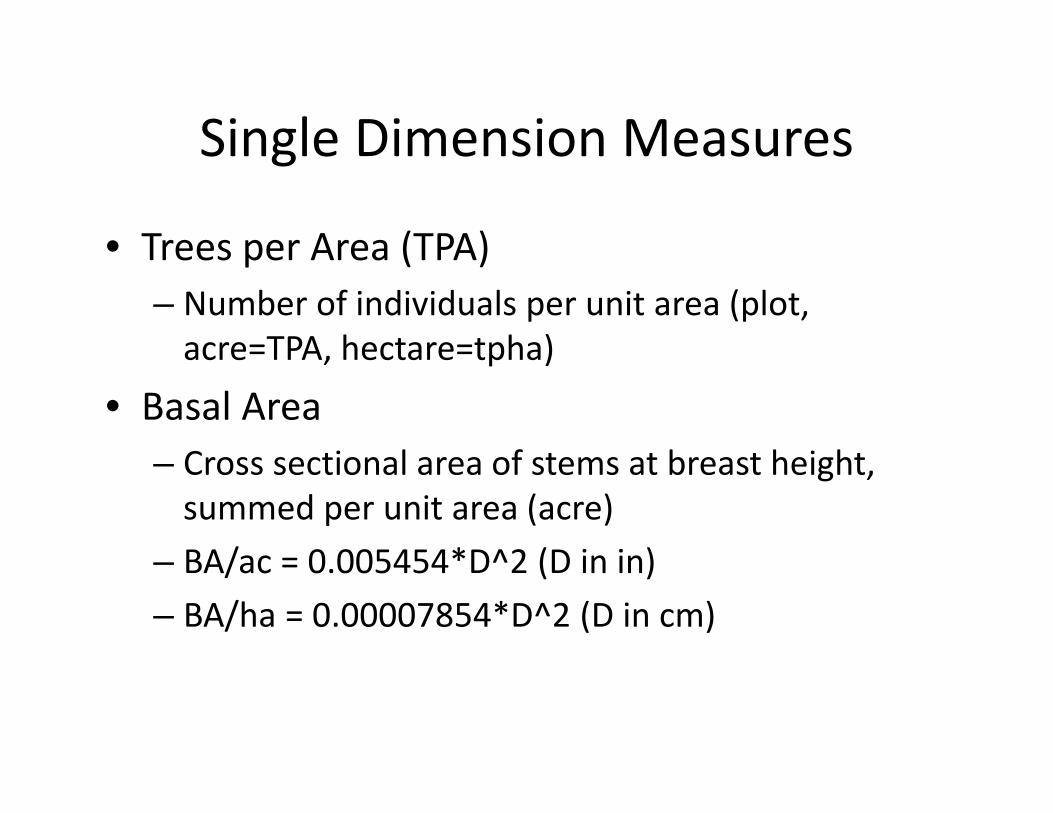
Single Dimension Measures
• Trees per Area (TPA)– Number of individuals per unit area (plot, acre=TPA, hectare=tpha)
• Basal Area– Cross sectional area of stems at breast height, summed per unit area (acre)
– BA/ac = 0.005454*D^2 (D in in)– BA/ha = 0.00007854*D^2 (D in cm)
Single Dimension Measures
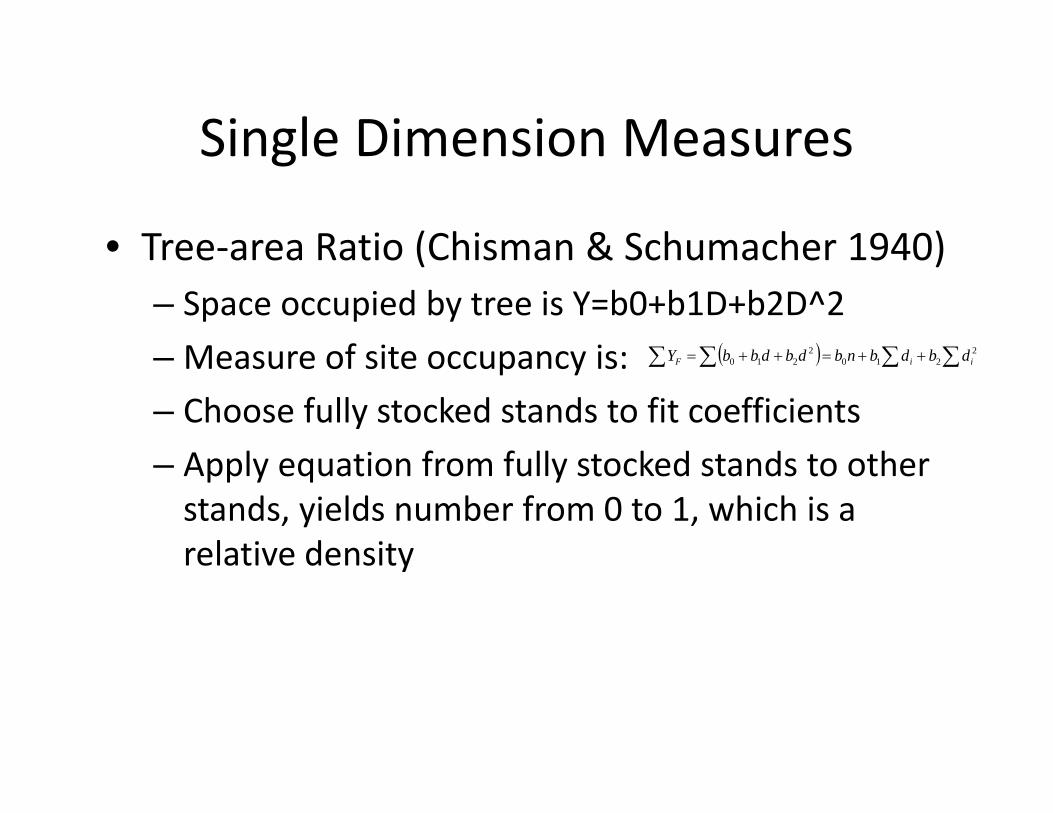
• Tree‐area Ratio (Chisman & Schumacher 1940)– Space occupied by tree is Y=b0+b1D+b2D^2– Measure of site occupancy is:– Choose fully stocked stands to fit coefficients– Apply equation from fully stocked stands to other stands, yields number from 0 to 1, which is a relative density
2210
2210 iiF dbdbnbdbdbbY
Single Dimension Measures
• Percent Normal Basal Area– Expansion of basal area concept– Fit normal basal area curves– Express actual basal area as a percentage of normal BA (PNBA = BA/NBA)
Multiple Dimension Measures
• Spacing index or relative spacing– Can be based on any dimension of tree– Diameter based: D+2, D^2, etc.
• Sometimes used and spacing rules for making thinnings
– Height Based: Wilson % Height (Wilson 1946)• # TPA after thinning = 43560/(hf)2
Multiple Dimension Measures
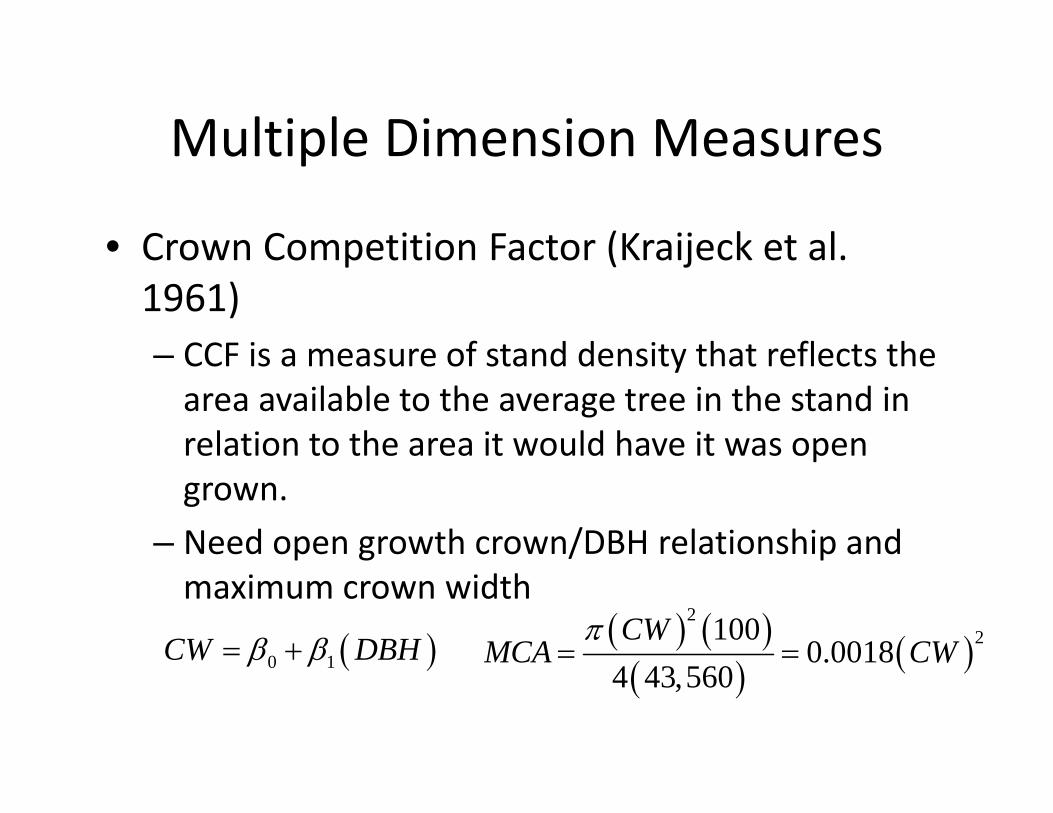
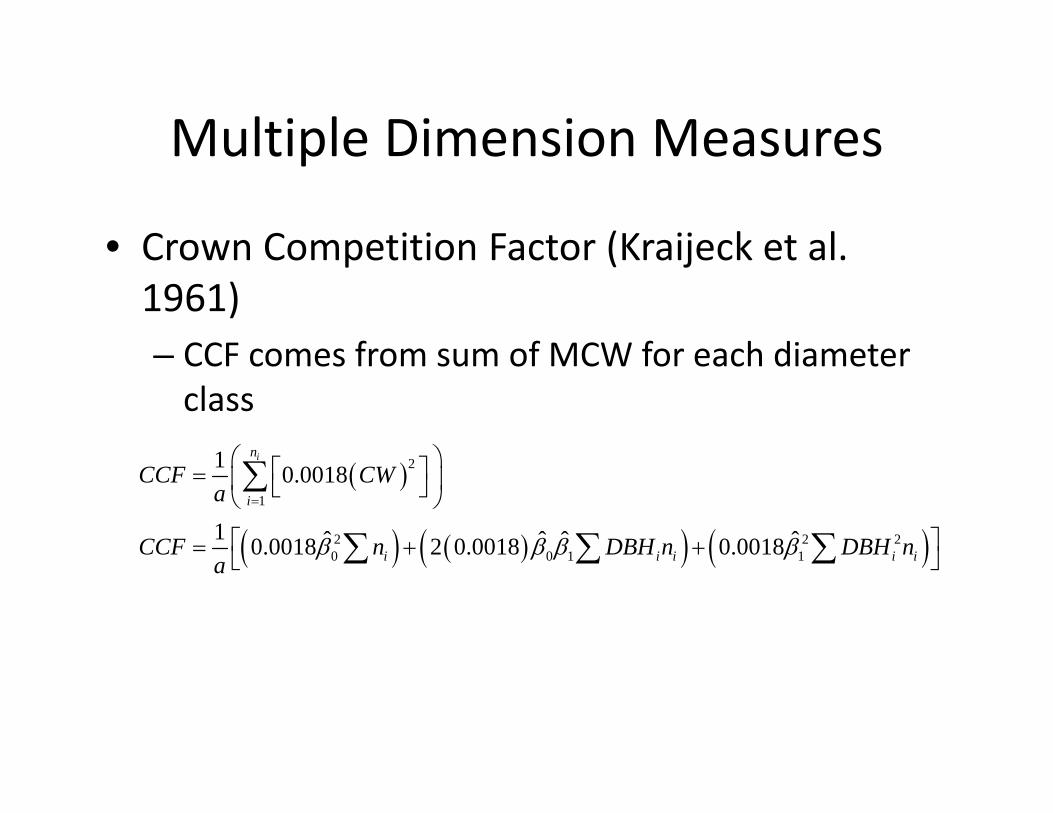
• Crown Competition Factor (Kraijeck et al. 1961)– CCF is a measure of stand density that reflects the area available to the average tree in the stand in relation to the area it would have it was open grown.
– Need open growth crown/DBH relationship and maximum crown width
0 1CW DBH
22100
0.00184 43,560CW
MCA CW
Multiple Dimension Measures
• Crown Competition Factor (Kraijeck et al. 1961)– CCF comes from sum of MCW for each diameter class
2
1
2 2 20 0 1 1
1 0.0018
1 ˆ ˆ ˆ ˆ0.0018 2 0.0018 0.0018
in
i
i i i i i
CCF CWa
CCF n DBH n DBH na
Multiple Dimension Measures
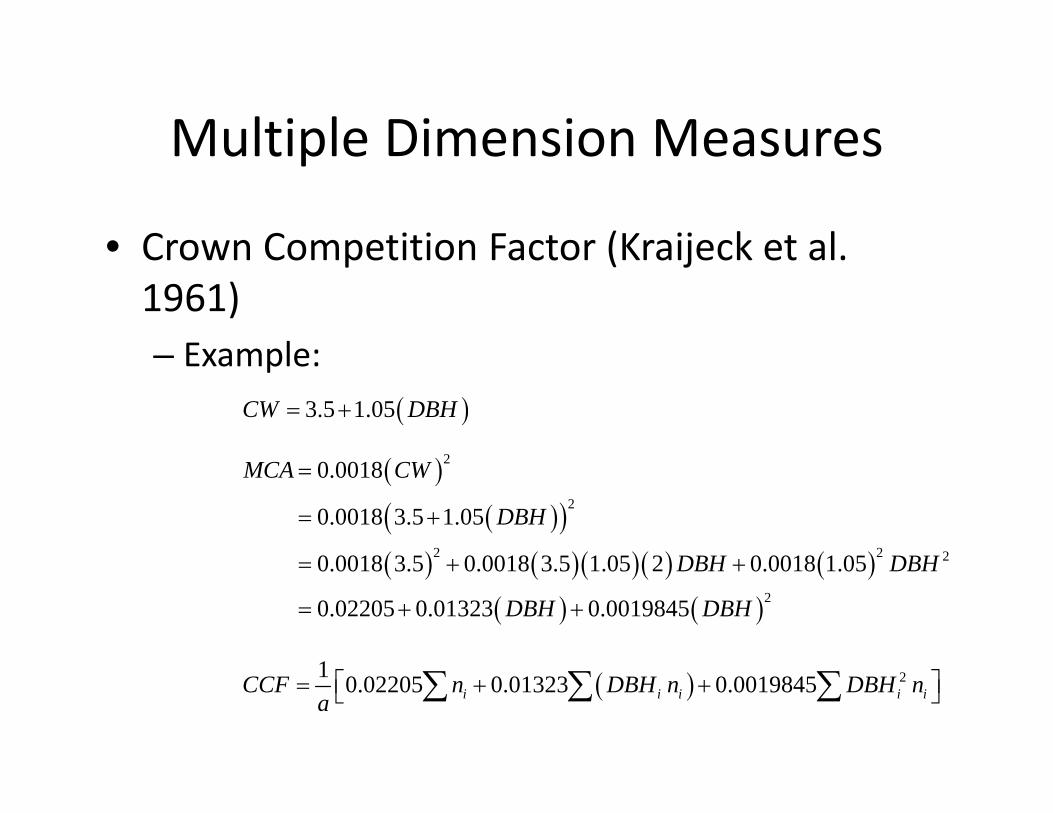
• Crown Competition Factor (Kraijeck et al. 1961)– Example:
3.5 1.05CW DBH
2
2
2 2 2
2
0.0018
0.0018 3.5 1.05
0.0018 3.5 0.0018 3.5 1.05 2 0.0018 1.05
0.02205 0.01323 0.0019845
MCA CW
DBH
DBH DBH
DBH DBH
21 0.02205 0.01323 0.0019845i i i i iCCF n DBH n DBH na
Multiple Dimension Measures
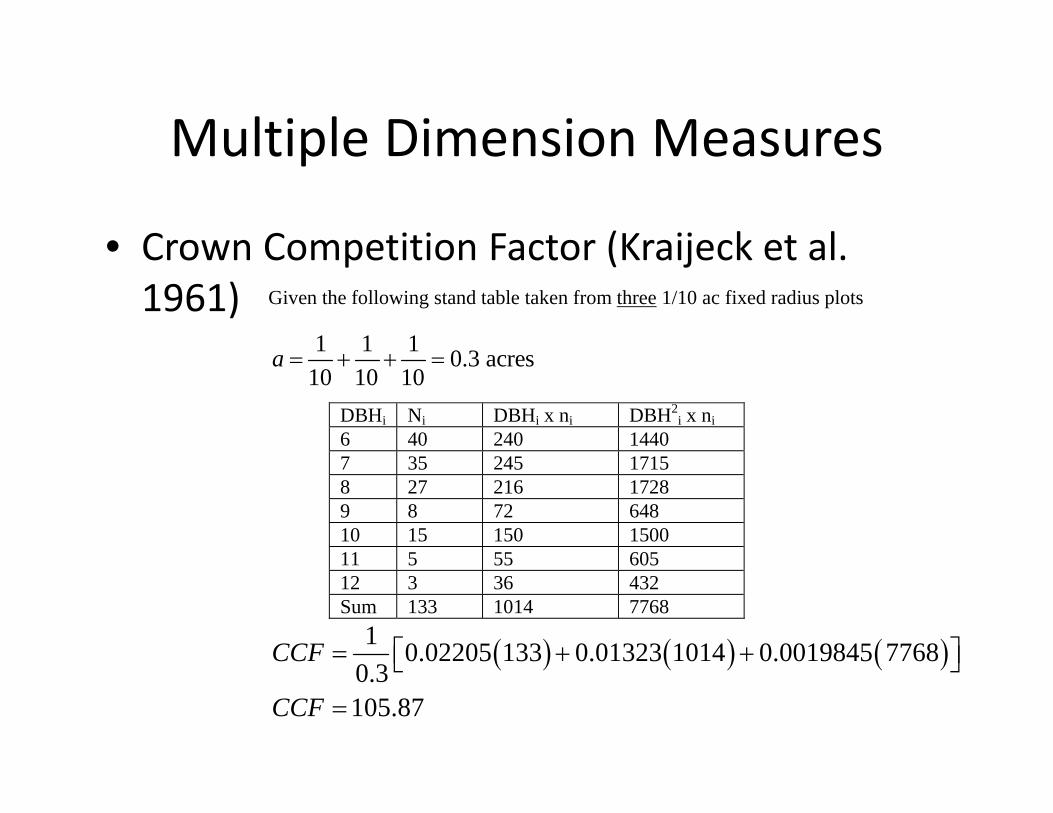
• Crown Competition Factor (Kraijeck et al. 1961) Given the following stand table taken from three 1/10 ac fixed radius plots
1 1 1 0.3 acres10 10 10
a
DBHi Ni DBHi x ni DBH2i x ni
6 40 240 1440 7 35 245 1715 8 27 216 1728 9 8 72 648 10 15 150 1500 11 5 55 605 12 3 36 432 Sum 133 1014 7768
1 0.02205 133 0.01323 1014 0.0019845 77680.3105.87
CCF
CCF
Multiple Dimension Measures
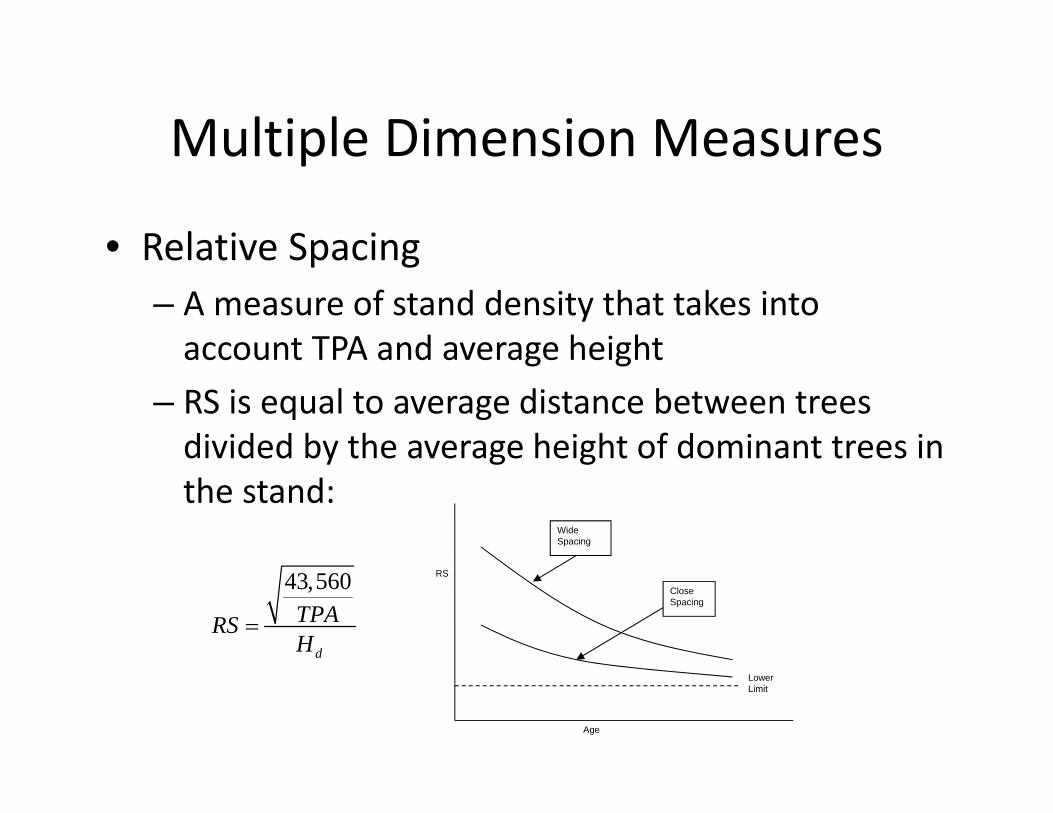
• Relative Spacing– A measure of stand density that takes into account TPA and average height
– RS is equal to average distance between trees divided by the average height of dominant trees in the stand:
43,560
d
TPARSH
Lower Limit
Wide Spacing
Close Spacing
Age
RS
Multiple Dimension Measures
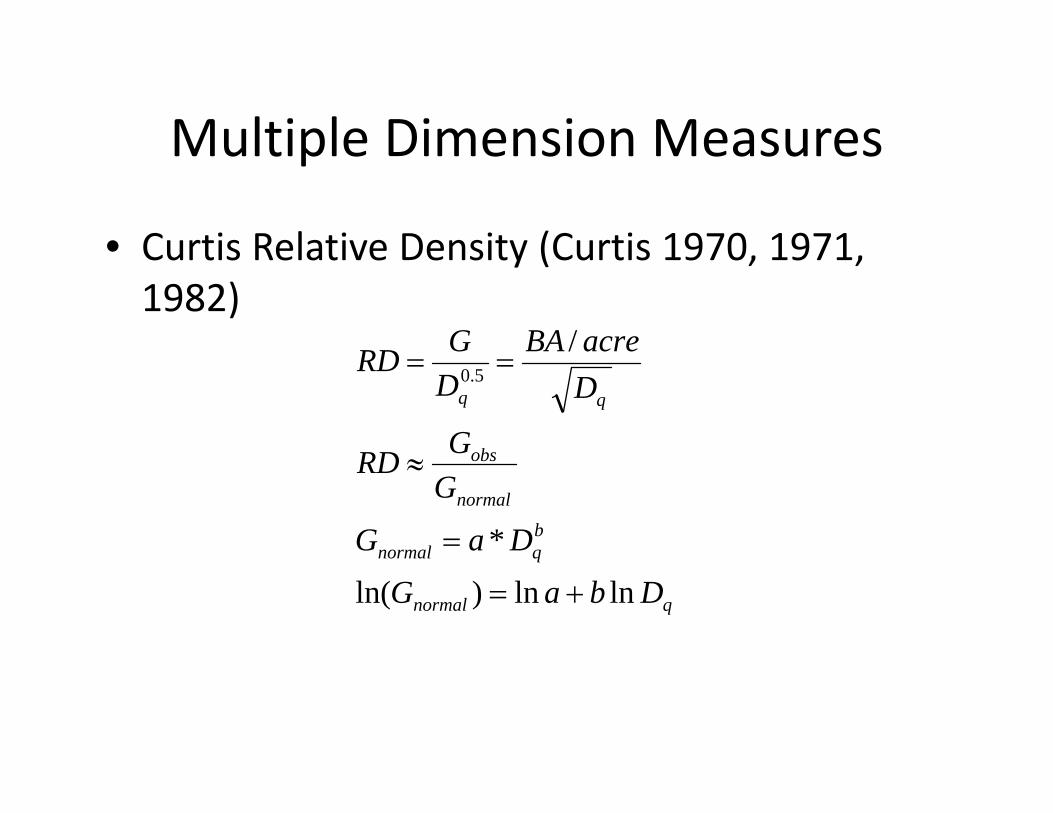
• Curtis Relative Density (Curtis 1970, 1971, 1982)
qnormal
bqnormal
normal
obs
DbaG
DaG
GGRD
DacreBA
DGRD
lnln)ln(
*
/5.0
Multiple Dimension Measures
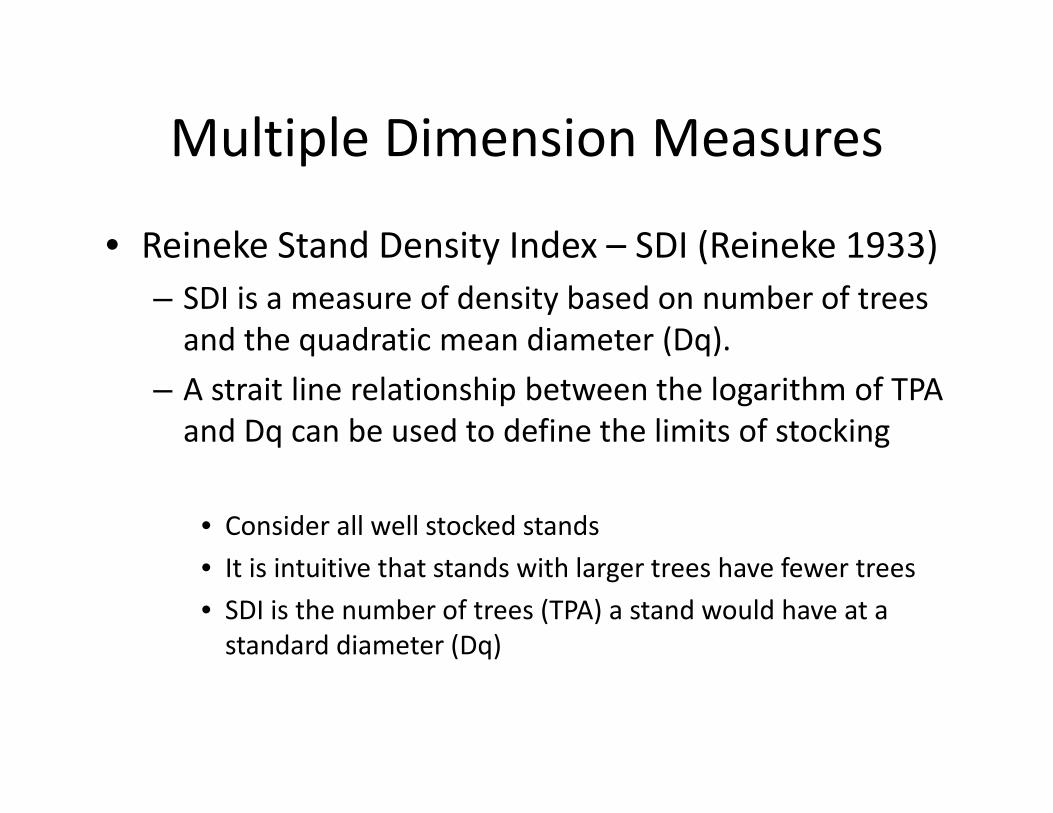
• Reineke Stand Density Index – SDI (Reineke 1933)– SDI is a measure of density based on number of trees and the quadratic mean diameter (Dq).
– A strait line relationship between the logarithm of TPA and Dq can be used to define the limits of stocking
• Consider all well stocked stands• It is intuitive that stands with larger trees have fewer trees• SDI is the number of trees (TPA) a stand would have at a standard diameter (Dq)
Reineke Stand Density Index
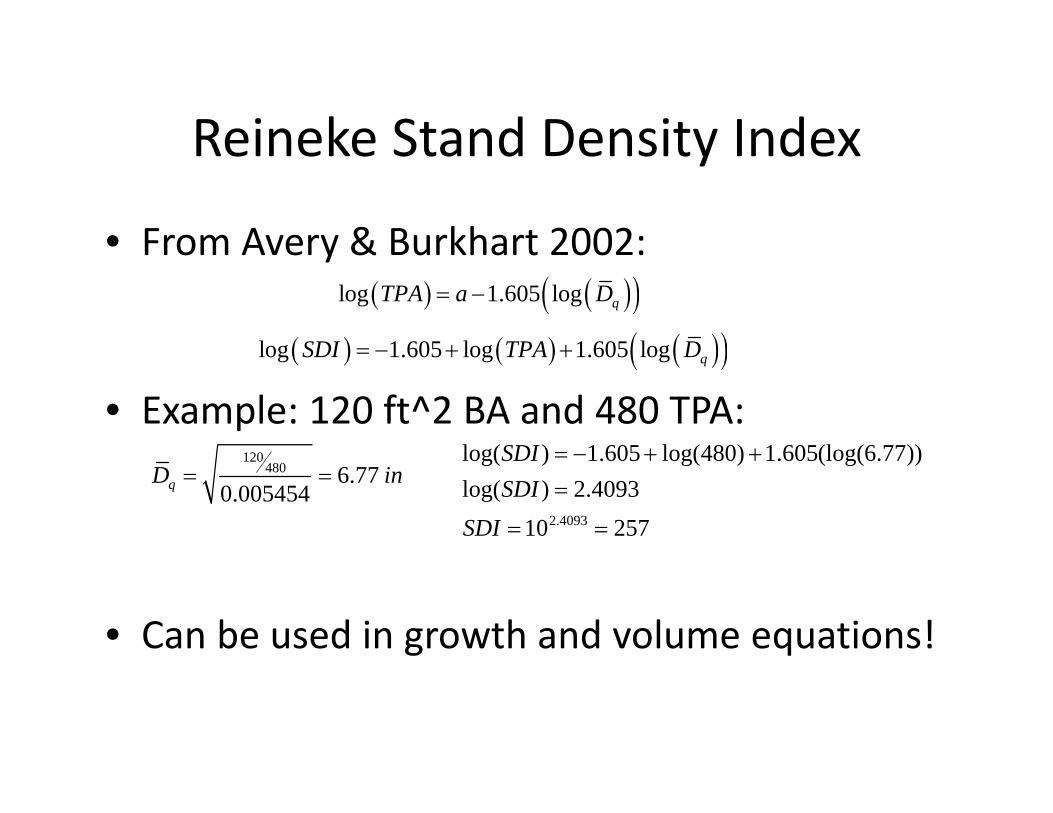
• From Avery & Burkhart 2002:
• Example: 120 ft^2 BA and 480 TPA:
• Can be used in growth and volume equations!
log 1.605 log qTPA a D
log 1.605 log 1.605 log qSDI TPA D
120480 6.77
0.005454qD in
257104093.2)log(
))77.6(log(605.1)480log(605.1)log(
4093.2
SDISDISDI
Alternative Presentation of SDI
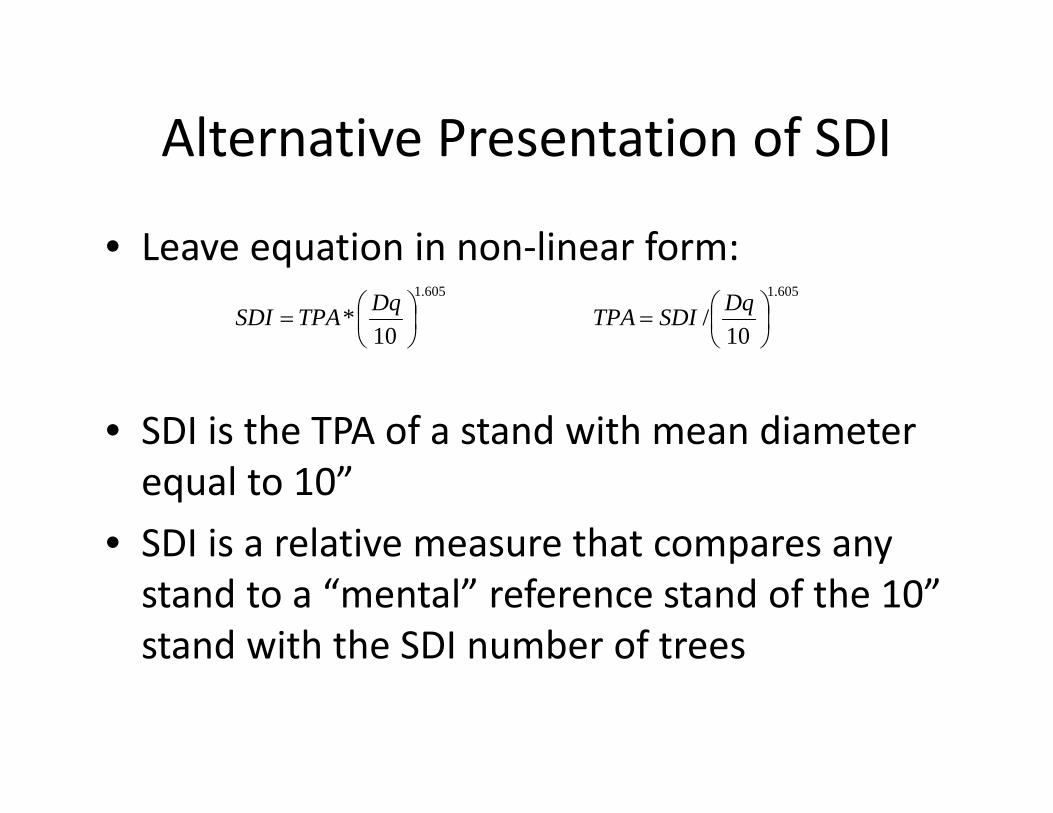
• Leave equation in non‐linear form:
• SDI is the TPA of a stand with mean diameter equal to 10”
• SDI is a relative measure that compares any stand to a “mental” reference stand of the 10” stand with the SDI number of trees
605.1
10*
DqTPASDI605.1
10/
DqSDITPA
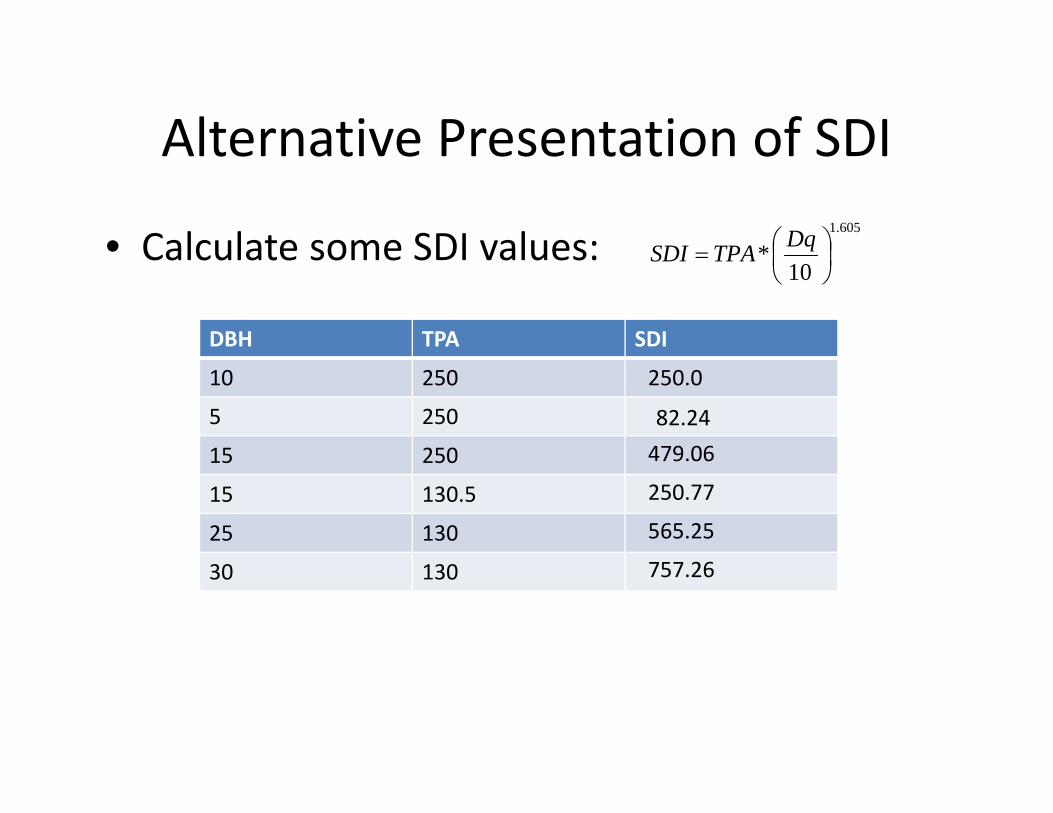
Alternative Presentation of SDI
• Calculate some SDI values:605.1
10*
DqTPASDI
DBH TPA SDI
10 250
5 250
15 250
15 130.5
25 130
30 130
250.0
82.24479.06
250.77
565.25
757.26
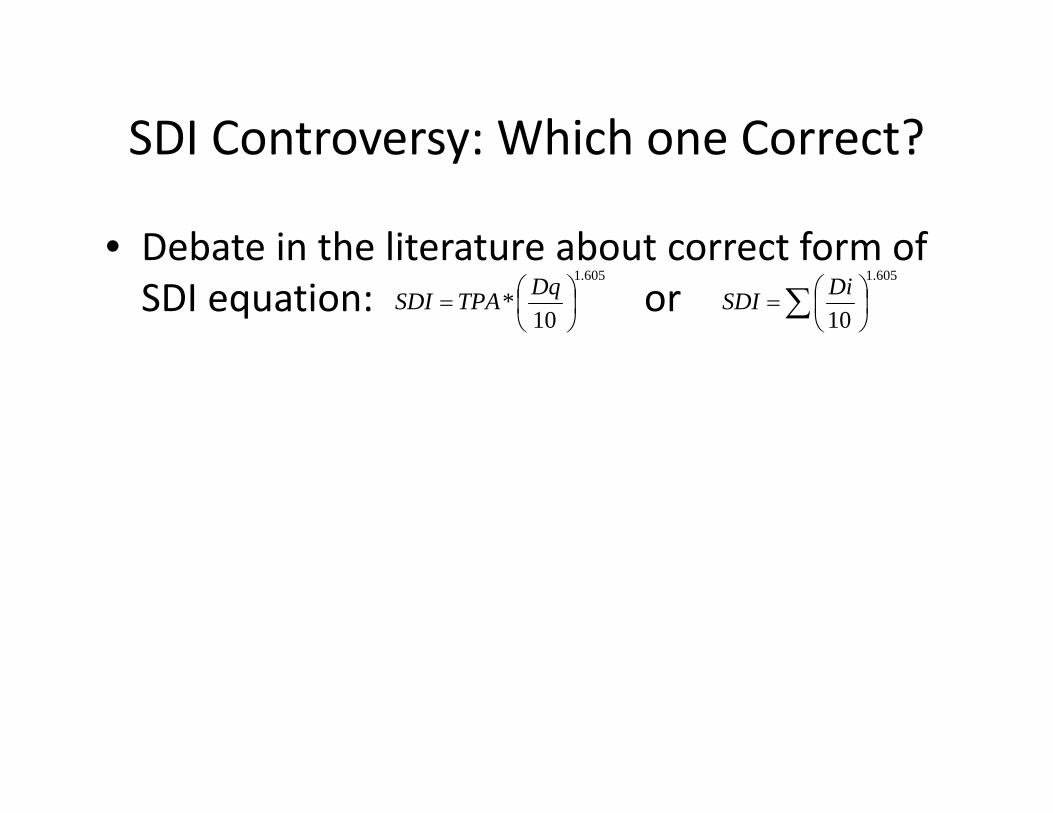
SDI Controversy: Which one Correct?
• Debate in the literature about correct form of SDI equation: or
605.1
10*
DqTPASDI
605.1
10DiSDI
SDI Controversy: Which one Correct?
• Debate in the literature about correct form of SDI equation: or
605.1
10*
DqTPASDI
605.1
10DiSDI
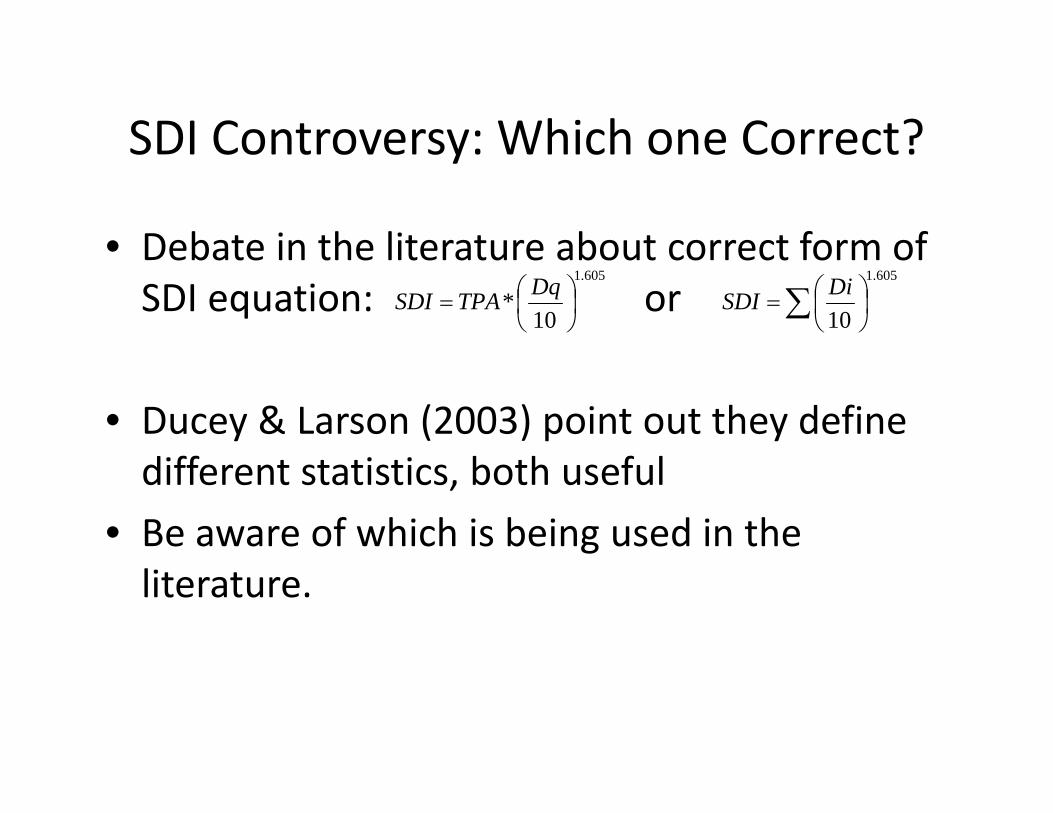
SDI Controversy: Which one Correct?
• Debate in the literature about correct form of SDI equation: or
• Ducey & Larson (2003) point out they define different statistics, both useful
• Be aware of which is being used in the literature.
605.1
10*
DqTPASDI
605.1
10DiSDI
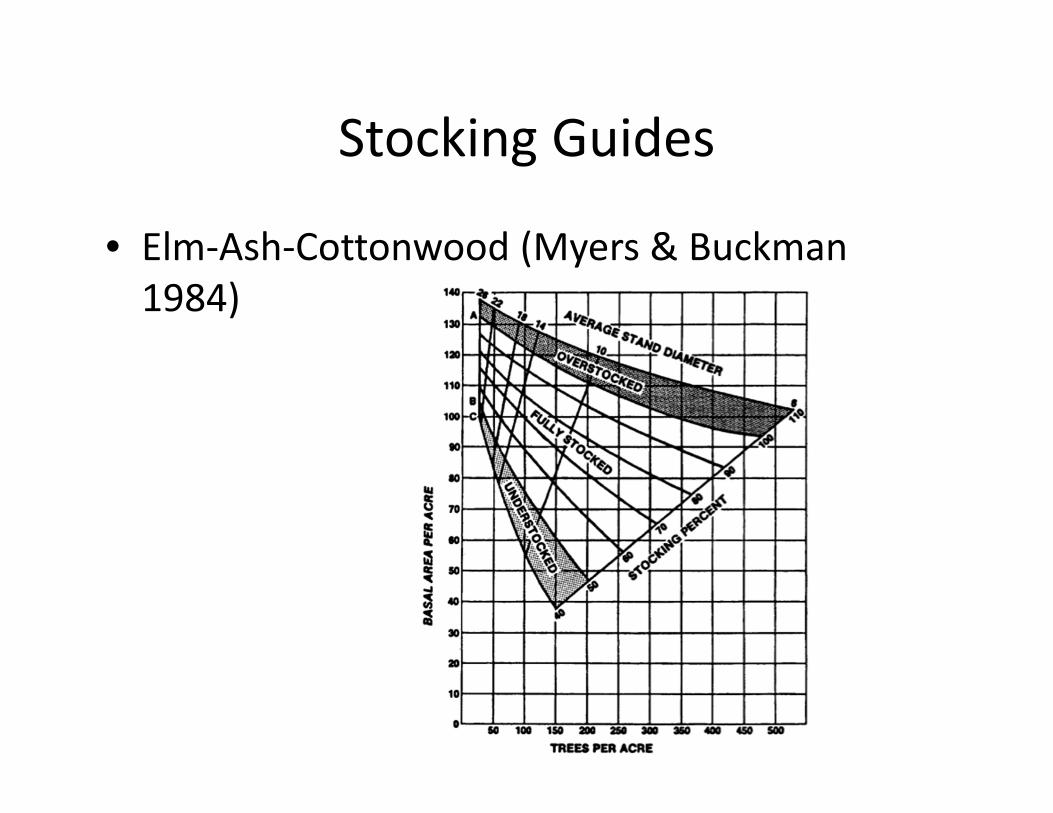
Stocking Guides
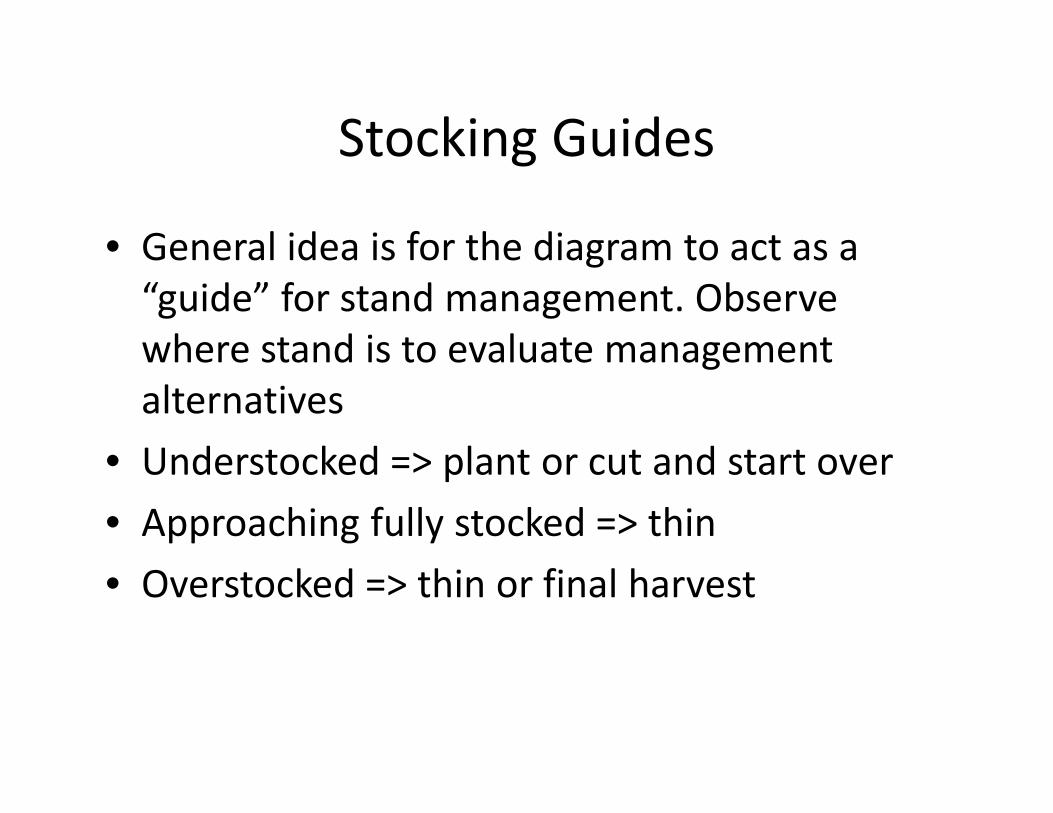
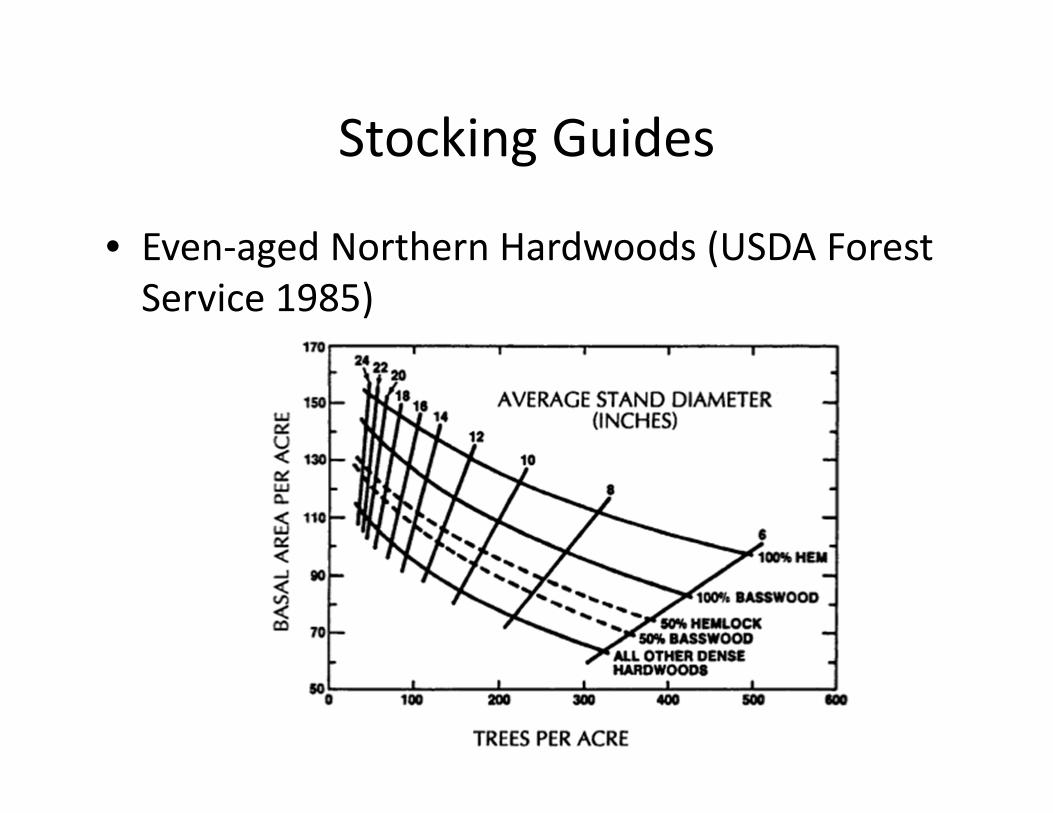
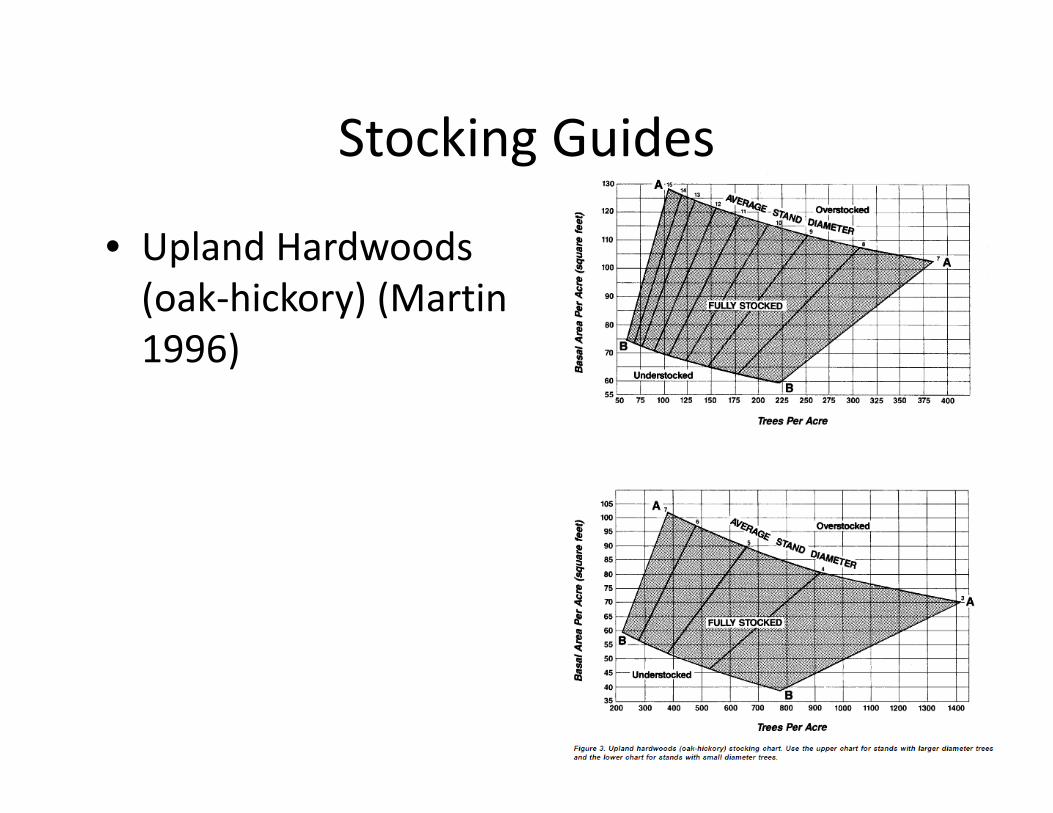
• General idea is for the diagram to act as a “guide” for stand management. Observe where stand is to evaluate management alternatives
• Understocked => plant or cut and start over• Approaching fully stocked => thin• Overstocked => thin or final harvest
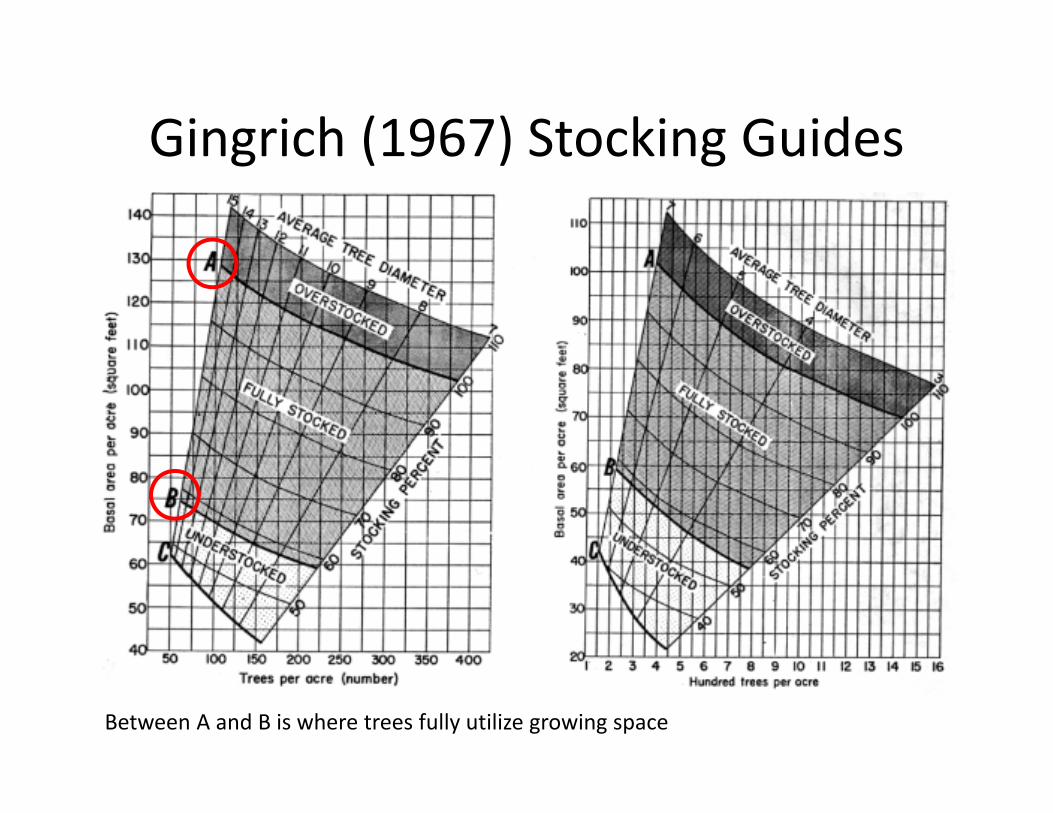
Gingrich (1967) Stocking Guides
Between A and B is where trees fully utilize growing space
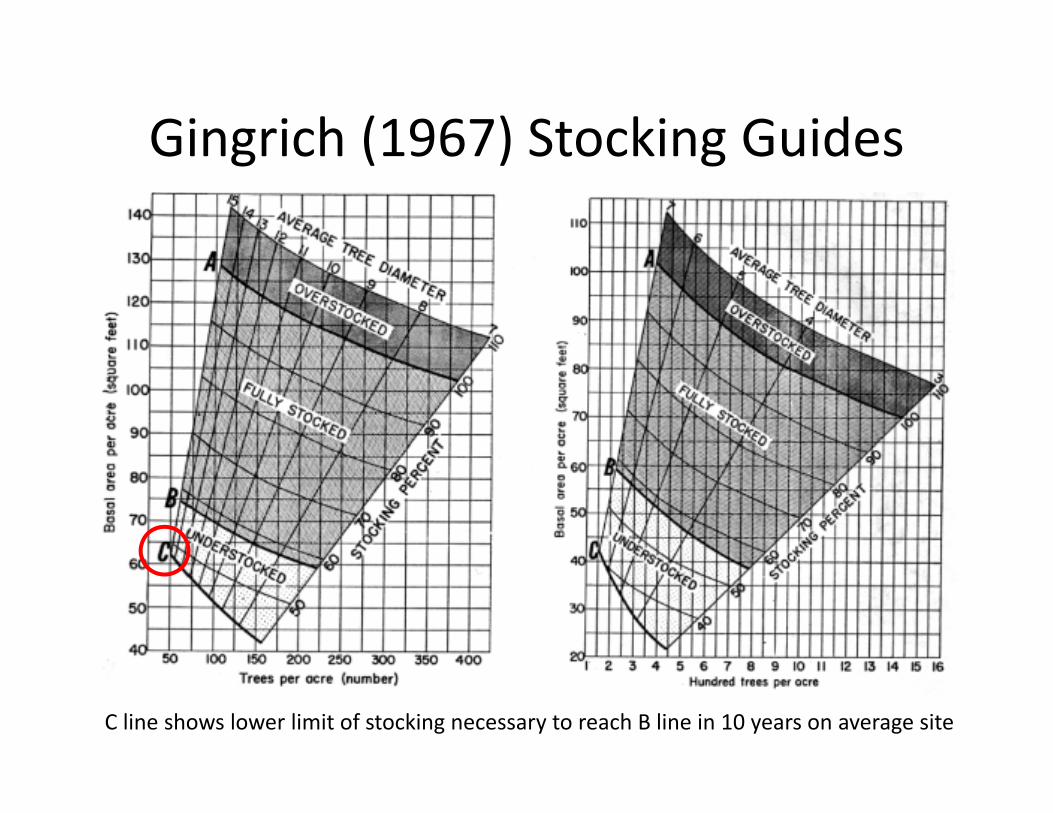
Gingrich (1967) Stocking Guides
C line shows lower limit of stocking necessary to reach B line in 10 years on average site
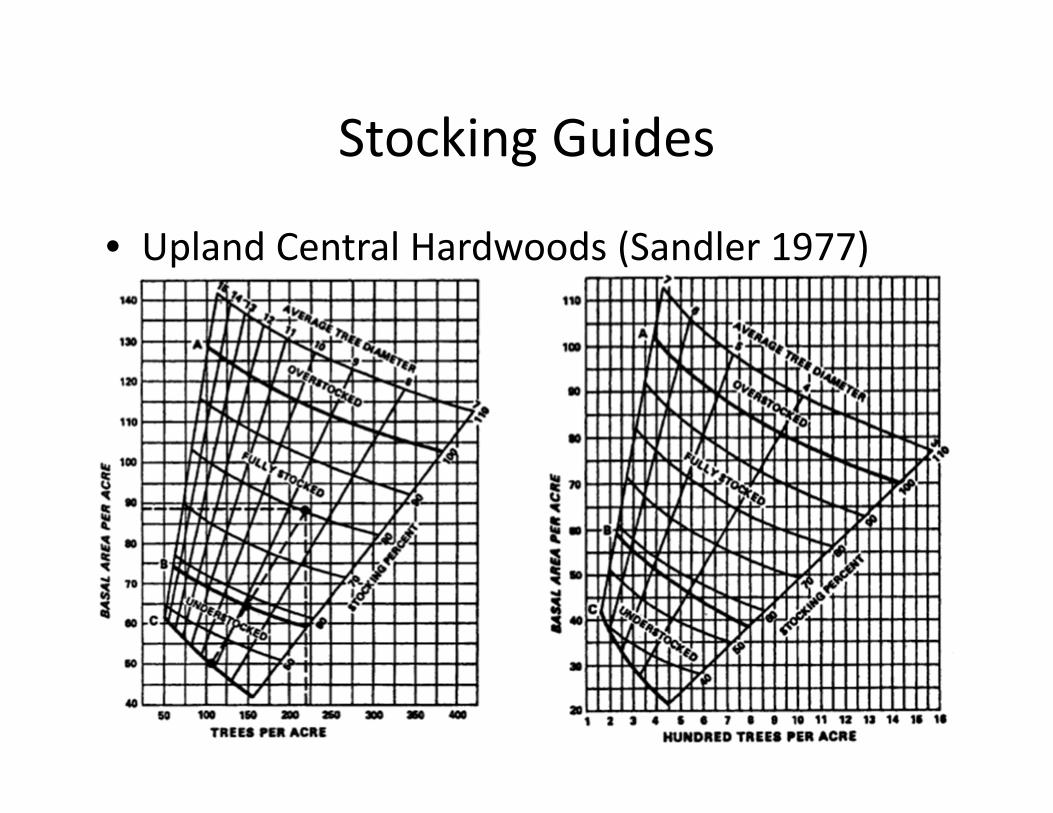
Stocking Guides
• Upland Central Hardwoods (Sandler 1977)
Stocking Guides
• Elm‐Ash‐Cottonwood (Myers & Buckman1984)
Stocking Guides
• Even‐aged Northern Hardwoods (USDA Forest Service 1985)
Stocking Guides
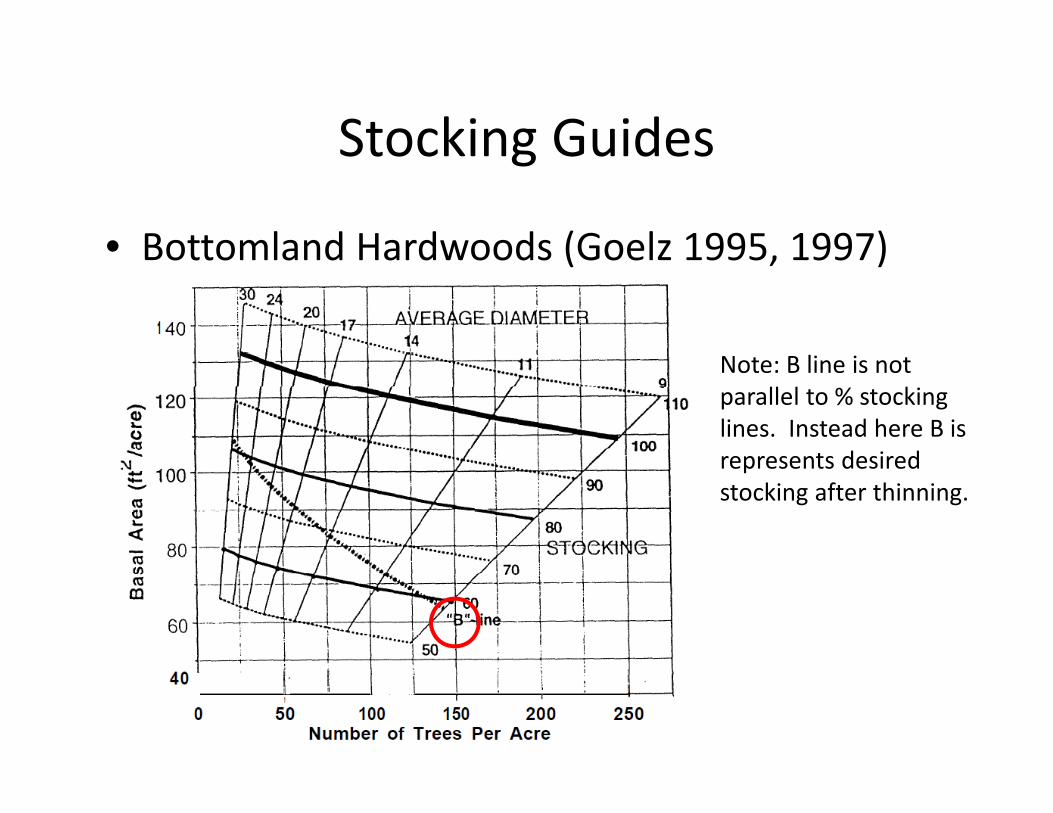
• Bottomland Hardwoods (Goelz 1995, 1997)
Note: B line is not parallel to % stocking lines. Instead here B is represents desired stocking after thinning.
Stocking Guides
• Upland Hardwoods (oak‐hickory) (Martin 1996)
Stocking Guides
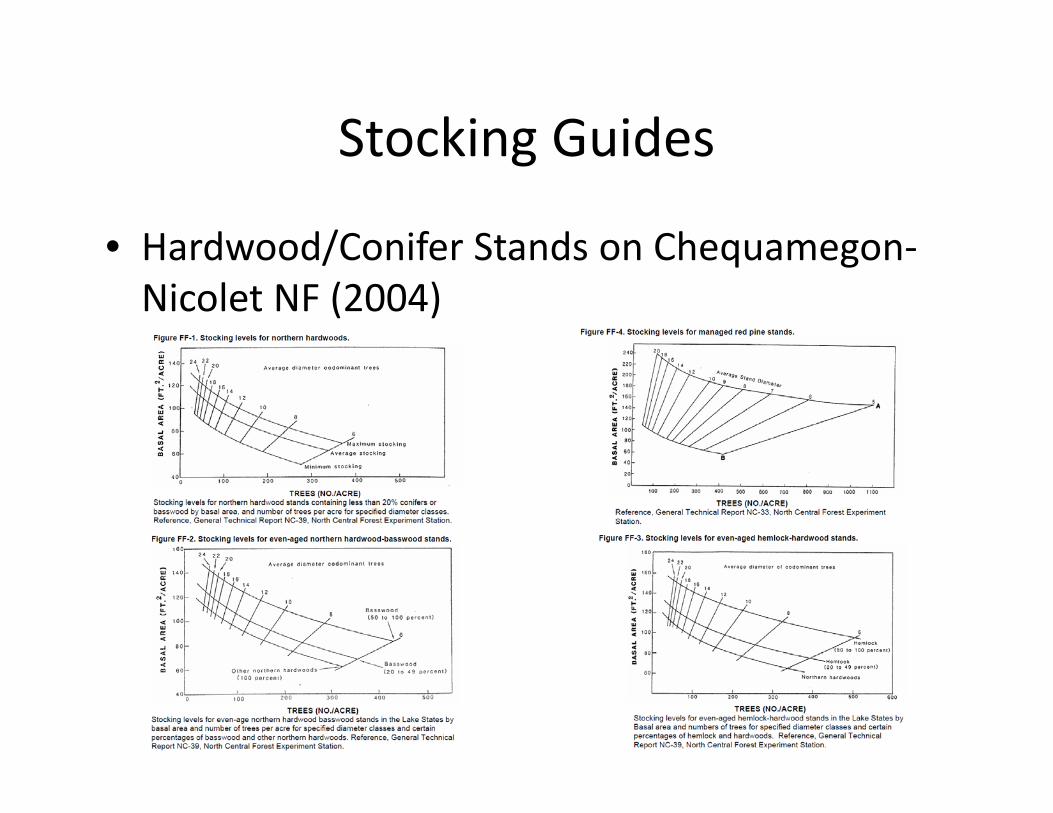
• Hardwood/Conifer Stands on Chequamegon‐Nicolet NF (2004)
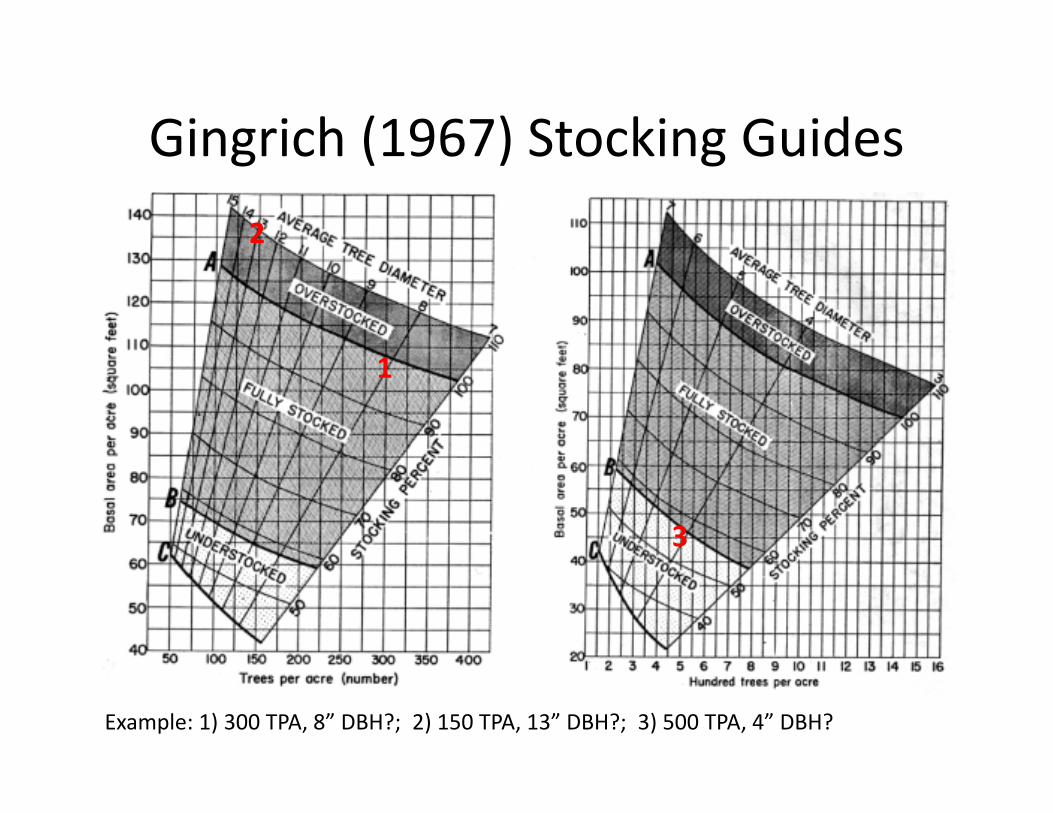
Gingrich (1967) Stocking Guides
Example: 1) 300 TPA, 8” DBH?; 2) 150 TPA, 13” DBH?; 3) 500 TPA, 4” DBH?
1
2
3
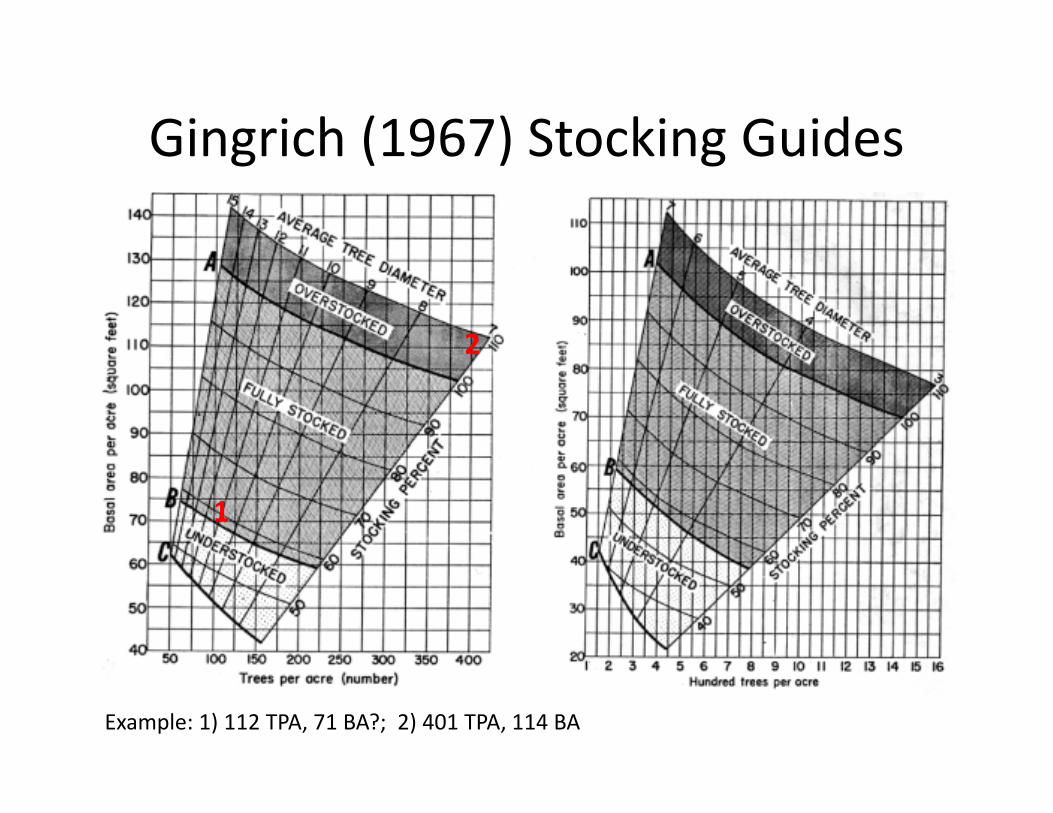
Gingrich (1967) Stocking Guides
Example: 1) 112 TPA, 71 BA?; 2) 401 TPA, 114 BA
1
2
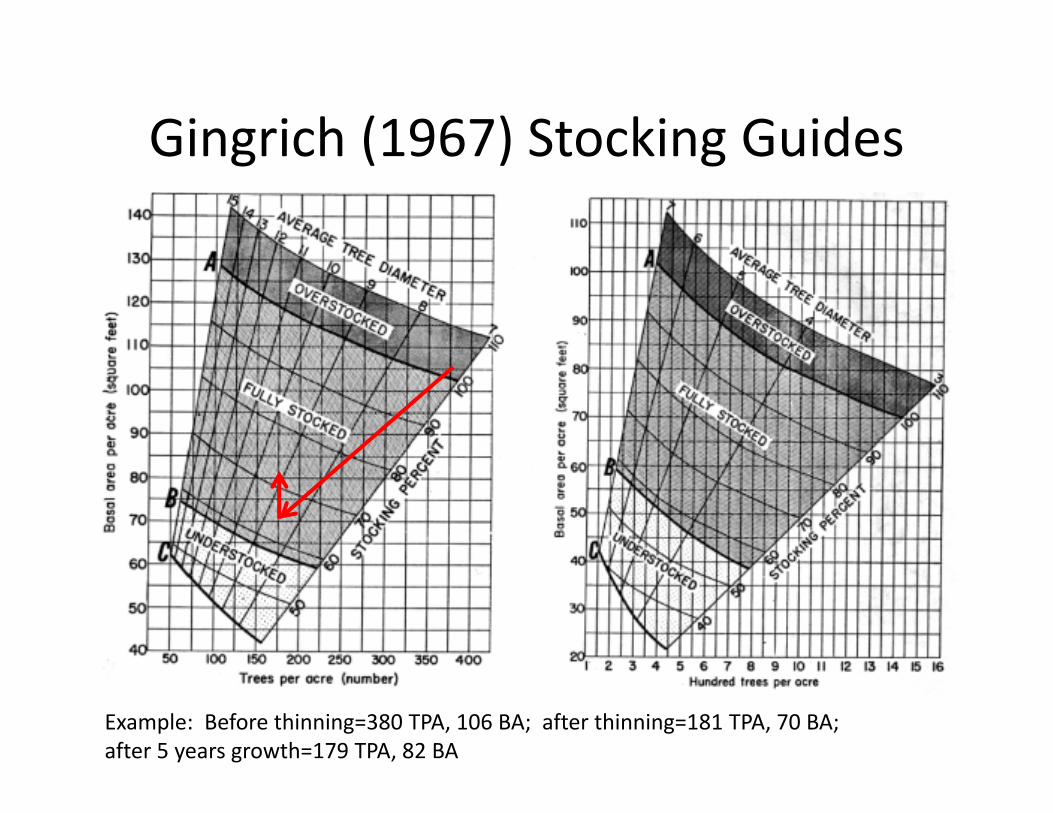
Gingrich (1967) Stocking Guides
Example: Before thinning=380 TPA, 106 BA; after thinning=181 TPA, 70 BA; after 5 years growth=179 TPA, 82 BA