quantitative content analysis of virginia doctoral
TRANSCRIPT

QUANTITATIVE CONTENT ANALYSIS OF VIRGINIA DOCTORAL DISSERTATIONS
2007-2017: TRENDS IN DEGREE TYPES AND METHODOLOGIES
Craig H. Krueger
Liberty University
A Dissertation Presented in Partial Fulfillment
Of the Requirements for the Degree
Doctor of Education
Liberty University, Lynchburg, VA
2018
2
QUANTITATIVE CONTENT ANALYSIS OF VIRGINIA DOCTORAL DISSERTATIONS
2007-2017: FREQUENCY OF DEGREE TYPES AND METHODOLOGIES
Craig H. Krueger
Liberty University
A Dissertation Presented in Partial Fulfillment
Of the Requirements for the Degree
Doctor of Education
Liberty University, Lynchburg, VA
2018
APPROVED BY:
Rebecca M. Lunde, EdD, Committee Chair
Damian P. Ahrens, EdD, Committee Member

3
ABSTRACT
This study was a trend analysis of the choices made by doctoral candidates in the state of
Virginia who sought degrees in the field of education. It analyzed frequencies of degree types
(EdD degree compared to the PhD) and research methodologies (quantitative, qualitative, and
mixed methods). This research is important because no such study has been done since 1994.
The information will be useful to both those who lead doctoral programs and to people who seek
to understand philosophical implications and practical applications of these degree and
methodology types. The purpose of the study is to bring up to date existing studies of doctoral
dissertations. Using the theoretical framework of requisite decision modeling, this quantitative
study of archived data determined that there are statistically significant trends in doctoral
candidates’ choices of degree and research methodology in the state of Virginia in the time span
of the study. One hundred thirty dissertations published in the state of Virginia were randomly
selected from the ProQuest Dissertations and Theses Global database for each of the years 2007,
2012, and 2017. This research employed content analysis and trend analysis methods.
Keywords: dissertation, Doctor of Education, EdD, Doctor of Philosophy, PhD,
quantitative research, qualitative research, mixed methods research

4
Copyright 2018
Craig H. Krueger
ALL RIGHTS RESERVED

5
Dedication
To the Lord Jesus Christ, with thanksgiving for His mercy and grace, love and truth.
“For of him, and through him, and to him, are all things: to whom be glory forever. Amen.”
(Romans 11:36, KJV).
6
Acknowledgments
Katie Ann Lambert Krueger, thank you for being an integral part of this journey. You
have been the faithful supporter, skilled editor, and detailed research assistant. More than that,
you have been my balance and inspiration through the greater journey of life, and I thank my
God on every remembrance of you.
My three adult children, Suzanne Lashley, Amy Krueger, and Jenn Wynn have
encouraged me throughout this process. The words “I’m proud of you, Daddy” are more
valuable to me than any title.
Dr. Kurt Michael rescued my doctoral work in a very practical way. When the college
where I worked closed and I lost the data source for a dissertation after the prospectus phase, it
was he who proposed this topic. I seized it at first, to paraphrase from Dr. Ellen Black, because I
was committed to graduating. As I saw how research methodology relates to Christian
apologetics and the battle for the soul of America, I became passionate about what I was
learning. (Dr. Michael, I never believed that you taught any widgets.)
Dr. Damian Ahrens has been a model of the principles of the Word of God in action as a
man, a husband, a father, a pastor, a school leader, and a friend. His indefatigable enthusiasm for
Christian education and his trust in God have inspired many people. In the good times, he has
glorified God; in the hard times, he has trusted in Him. I am thankful for his willingness to be a
member of this doctoral advising committee.
Dr. Rebecca Lunde has been a model of diligence and encouragement. Her work as
committee chair and as research consultant has been amazing. The turn-around time for
comments and corrections was incredible, and I know that she is concerned that her students save
time and tuition. She not only suggested areas for improvement, but she also gave specific

7
direction on how to accomplish those improvements. Additionally, her weekly postings and
discussion board interactions offered both practical guidance and spiritual encouragement.

8
Table of Contents
ABSTRACT .....................................................................................................................................3
Dedication ........................................................................................................................................5
Acknowledgments............................................................................................................................6
List of Tables .................................................................................................................................11
List of Figures ................................................................................................................................12
List of Abbreviations .....................................................................................................................13
CHAPTER ONE: INTRODUCTION ............................................................................................14
Overview ............................................................................................................................14
Background ........................................................................................................................14
Problem Statement .............................................................................................................18
Purpose Statement ..............................................................................................................18
Significance of the Study ...................................................................................................20
Research Questions ............................................................................................................21
Definitions..........................................................................................................................22
CHAPTER TWO: LITERATURE REVIEW ................................................................................25
Overview ............................................................................................................................25
Theoretical Framework ......................................................................................................25
Phillips and the Origin of Requisite Decision Modeling .......................................25
Clemen and the Advance of Requisite Decision Modeling ...................................28
Related Literature...............................................................................................................30
Research Methodology ..........................................................................................30
Doctoral Degrees and Dissertations .......................................................................35

9
Dissertation Research Methodologies....................................................................45
Summary ............................................................................................................................64
CHAPTER THREE: METHODS ..................................................................................................66
Overview ............................................................................................................................66
Design ................................................................................................................................66
Research Questions ............................................................................................................68
Null Hypotheses .................................................................................................................68
Participants and Setting......................................................................................................68
Procedures ..........................................................................................................................71
Data Analysis .....................................................................................................................76
Data Screening .......................................................................................................76
Variables ................................................................................................................76
Assumption Testing ...............................................................................................77
Analysis and Reporting ..........................................................................................78
Summary ............................................................................................................................80
CHAPTER FOUR: FINDINGS .....................................................................................................82
Overview ............................................................................................................................82
Research Questions ............................................................................................................82
Null Hypotheses .................................................................................................................82
Descriptive Statistics ..........................................................................................................83
Results ................................................................................................................................84
Data Screening .......................................................................................................84
Assumptions ...........................................................................................................85

10
Results for Null Hypothesis One ...........................................................................85
Results for Null Hypothesis Two ...........................................................................88
Summary ............................................................................................................................92
CHAPTER FIVE: CONCLUSIONS .............................................................................................94
Overview ............................................................................................................................94
Discussion ..........................................................................................................................94
Year of Publication and Degree Choice.................................................................95
Year of Publication and Methodology Choice.......................................................97
Limitations .........................................................................................................................99
Implications......................................................................................................................100
Empirical Implications .........................................................................................100
Theoretical Implications ......................................................................................100
Practical Implications...........................................................................................102
Recommendations for Future Research ...........................................................................103
Summary ..........................................................................................................................104
REFERENCES ............................................................................................................................105
APPENDICES .............................................................................................................................114

11
List of Tables
Table 1: Nelson and Coorough’s Percentages of EdD Degrees Compared to PhD Degrees ........43
Table 2: Kantorski and Stegman’s Percentages of EdD, PhD, and DME Degrees .......................44
Table 3: Alasuutari’s Percentages of Quantitative Articles in British Journals.............................63
Table 4: Kantorski and Stegman’s Percentages of Qualitative Dissertations in Music .................63
Table 5: Frequencies of Degree Types in All Years of the Study .................................................71
Table 6: Frequencies of Methodology Types in All Years of the Study .......................................71
Table 7: Frequencies of Degree Types in All Years of the Study, Ordered for SPSS...................83
Table 8: Frequencies of Methodology Types in All Years of the Study, Ordered for SPSS .........84
Table 9: Crosstabulation for Degree Types in All Years of the Study ..........................................86
Table 10: Chi-square Tests for Degree Types in All Years of the Study ......................................87
Table 11: Symmetric Measures for Degree Types in All Years of the Study ...............................88
Table 12: Crosstabulation for Methodology Choices in All Years of the Study ...........................89
Table 13: Chi-square Tests for Methodology Choices in All Years of the Study .........................90
Table 14: Symmetric Measures for Methodology Choices in All Years of the Study ..................90
Table 15: Chi-square Tests for Pairwise Comparison of Methodology Types, 2007 and 2012 ....91
Table 16: Symmetric Measures for Pairwise Comparison of Methodology Types, 2007
and 2012 .......................................................................................................................91
Table 17: Chi-square Tests for Pairwise Comparison of Methodology Types, 2012 and 2017 ....92
Table 18: Symmetric Measures for Pairwise Comparison of Methodology Types, 2012
and 2017 ........................................................................................................................92
Table 19: SPSS Variable Codes ...................................................................................................115

12
List of Figures
Figure 1: Doctoral Degrees Granted in the Virginia Sample Population by Year and
Degree Type ..................................................................................................................96
Figure 2: Doctoral Degrees Granted in the Virginia Sample Population by Year and
Degree-granting Institution ...........................................................................................97
Figure 3: Dissertation Methodology in Virginia Sample Population by Year, All Institutions ...98

13
List of Abbreviations
Carnegie Project on the Education Doctorate (CPED)
Doctor of Education (EdD)
Doctor of Philosophy (PhD)
Institutional Review Board (IRB)
Investigator Triangulation (IT)
Mixed-Methods Research (MMR)
Return on Investment (ROI)
Straight-Edge (sXe)

14
CHAPTER ONE: INTRODUCTION
Overview
This chapter explores the context for an inquiry about trends in doctoral dissertations in
the state of Virginia from 2007 to 2017. It considers the frequency of the Doctor of Education
Degree (EdD) compared to the Doctor of Philosophy Degree (PhD) and the frequency of study
methodologies, including quantitative, qualitative, and mixed-methods studies. The chapter
includes the historical, social, and theoretical backgrounds of the study. The problem statement,
the purpose and significance of the study, and research questions are introduced. Finally, a list
of definitions of key terms is presented.
Background
The doctoral dissertation, a long-standing fixture in higher education, is in flux.
Considering doctoral dissertations in the field of education in particular, the percentages of
doctoral dissertations written in EdD programs, compared to those written in PhD programs, has
fluctuated through the years (Nelson & Coorough, 1994; Walker & Haley-Mize, 2012).
Similarly, the major categories of research methodology—quantitative, qualitative, and mixed
methods—have also shifted in frequency of use (Walker & Haley-Mize, 2012). These choices
matter because they affect issues of power and prestige (Devos & Somerville, 2012; Stock &
Siegfried, 2017; Walsham, 2015), direction of public policy (Hochbein & Perry, 2013), and
comprehension of the nature of truth and reality (Alasuutari, 2010; Sale, Lohfeld, & Brazil,
2002; Schaeffer, 1972). Although past research documented changes in degree choices and
methodologies, there is little research focusing on the most recent ten years, and none that deals
specifically with the colleges of the state of Virginia.

15
The historical background of the EdD and PhD divide dates back only to the 1920s, when
the first Doctor of Education Degree was conferred at Harvard University (Walker & Haley-
Mize, 2012). Nelson and Coorough (1994) documented shifts in the numbers of doctoral
candidates following the EdD route compared to the PhD, noting the fluctuating percentages
from 1950 through 1990. Not only did the relative frequency of degree types lack a pattern, but
the distinctions between the two degrees have not been uniformly acknowledged. The nature of
the two degrees, their content, and their purposes have been argued over the years (Boyce, 2002;
Nelson & Coorough, 1994; Perry, 2015).
The theoretical frameworks of quantitative research and qualitative research are strikingly
different. Quantitative research is commonly associated with the theory of positivism and its
emphasis on unbiased observation of objective reality, reported as statistics (Creswell, 2013; Sale
et al., 2002). Qualitative research is linked with the theory of constructivism and relies upon
researchers’ and participants’ subjective understandings of situations reported in verbal
descriptions (Creswell, 2013). Despite these contrasts, there is a growing trend toward using
both quantitative research, with its positivist paradigm, and qualitative research, with its
constructivist system, together as mixed methods research (Archibald, 2016; Creswell, 2015).
Although quantitative research has clear history dating back to the seventeenth-century
birth of modern science (Whitehead, 1953, 1967) and the eighteenth-century Enlightenment
(Alasuutari, 2010), qualitative research is a relatively new phenomenon in the sense that a variety
of existing techniques were collected under the title qualitative (Alasuutari, 2010). After
identifying the origin of qualitative research, in this sense, as the 1960s, Alasuutari (2010) cited
several studies which dated the rise of qualitative research studies over quantitative in various
countries, starting with Britain in the 1960s and concluding with the United States of America as
16
the last, experiencing this transition in the 1980s. Three methods (quantitative, qualitative, and
mixed methods) have been used in differing ratios over the years. Unlike the PhD/EdD divide,
however, there is a clear pattern, with qualitative research on the rise (Alasuutari, 2010; Sale et
al., 2002). Like the distinctions between EdD programs and PhD programs, the qualitative
versus quantitative distinction is less clear than initial observations might suggest. In its simplest
form, the quantitative dissertation focuses on external, objective phenomena and gathers
numerical data; and the qualitative dissertation focuses on internal understandings and gathers
descriptive verbal data (Creswell, 2007). However, Sale et al. (2002) discussed at length the
blurring of those boundaries with the rise of mixed-methods research, combining elements of the
quantitative and qualitative research processes.
The social contexts of these types of degrees and the contrasting methodologies are
apparent in the literature. The EdD and PhD are often seen as serving two different functions.
Since the introduction of the EdD, the theoretical distinction between that and the PhD has been
clear (Perry, 2015; Wilson, Cooper, Johnson, & Wright, 2014). The PhD degree is often viewed
as preparation of the researcher-theorist, the one more concerned with adding to the existing
knowledge base, exploring new theoretical territory, or critiquing existing theory (Park, 2005).
The EdD degree is commonly seen as preparation of the researcher-practitioner, the one more
concerned with applying existing theory to solve practical, local problems (Amrein-Beardsley et
al., 2012). However, some authors have debated that those two degrees are not always distinct in
practice (Amrein-Beardsley et al., 2012; Perry, 2015; Walker & Haley-Mize, 2012). New
programs making the EdD distinct from the PhD and promising innovation with practical
applications are still originating (Amrein-Beardsley et al., 2012; Perry, 2015; Wilson et al.,
2013).

17
Different theoretical bases underlie the different methodologies. Quantitative research
methods are usually seen as rooted in positivism (Sale et al., 2002). Creswell (2009) even
suggests “positivist research” as an alternative title for quantitative research (p. 650). A
positivist worldview assumes “objective reality that exists independent of human perception”
(Sale et al., 2002, p. 44). Positivism seeks to reduce all its inquiries to a system of cause-and-
effect reactions and to analyze systems in such a way as to eliminate any bias of the researcher
(Walsham, 2015). Qualitative research methods not only are distinct from quantitative, but they
arose, in part, as a reaction against the assumptions of positivism (Alasuutari, 2010). Alasuutari
(2010) related the rise of qualitative research in the 1960s to a skepticism by some researchers
about the validity of expressing complex social situations as a series of empirically observable
cause-effect events. Similarly, Walsham (2015) pictured the debate regarding qualitative
research, which he termed “interpretive research” (p. 376), as contrasting with quantitative
research, which he called “positivist research” (p. 376). Like Alasuutarig (2010) and Walsham
(2015) stated that the foundational difference is the debate about whether objective knowledge is
possible (quantitative research) or whether the humanity of the researcher and the interactions
with the people who are the participants, or subjects, of research will always bias the collection
of data (qualitative research).
In summary, the EdD and the PhD were envisioned as two distinct degrees, with different
requirements and purposes. Quantitative and qualitative research are often presented as
contrasting each other at foundational levels. Yet some authors have argued that the two degrees
are not so very different and that the research methodologies are not only contrasting, but also
complementary.

18
Problem Statement
No systematic comparison of the numbers of EdD dissertations compared to PhD
dissertations in the field of education has been published since the landmark 1994 study by
Nelson and Coorough (1994). Walker and Haley-Mize (2012) did a similar study of EdD and
PhD dissertations from 1997 to 2010, but that was limited to the field of special education.
Similarly, much has been published in professional journals regarding the nature of
quantitative and qualitative methods of research, sometimes including mixed methods
(Alasuutari, 2010; Sale et al., 2017; Walsham, 2015; Weber, 2014). However, only Stock and
Siegfried (2017) presented a systematic comparison of the frequencies of dissertation types over
time. That study covered a sampling of dissertations written every 10th year from 1970 through
2010. However, these dealt with the field of economics only, and they focused on the rise of the
essay-type of dissertation in that field, not the quantitative/qualitative/mixed methods
comparison. The problem is that there are no studies in recent years which analyze the
frequency of the choices doctoral candidates in the field of education have made between the
EdD and the PhD degree or their dissertation methodology types.
Purpose Statement
The purpose of this quantitative, archival, content analysis study of dissertations written
in the field of education was to provide a current view of trends in doctoral treatises in the state
of Virginia on two variables: the type of degree being pursued, EdD or PhD, and the kind of
methodology being used, quantitative, qualitative, or mixed methods. The Doctor of Education
Degree, the EdD, is defined as the degree given in a program focused upon educational practice,
and the Doctor of Philosophy Degree, the PhD, is defined as the degree given in a program
focused upon theory (Nelson & Coorough, 1994; Walker & Haley-Mize, 2012). In contrast to
19
these broad distinctions, however, there is much discussion on the lack of clear differentiation
between these two degrees (Buss, Zambo, Zambo, Perry, & Williams, 2017; Shulman, Golde,
Bueschel, & Garabedian, 2006; Walker & Haley-Mize, 2012). Quantitative methodology is
defined as a research design that assumes that human interactions are based on objectively
observable phenomena and are somewhat stable across the range of social groups or times. It
records data which can be expressed in numbers and then analyzes those numbers by statistics
(Creswell, 20). Qualitative methodology is defined as a research design that is based on the
belief that people develop their own, unique ideas of reality, and that these conceptions of reality
vary among social groups and across the range of times. It employs extensive observation of
individuals or groups, or reviews artifacts, seeking to understand the “lived experiences”
(Creswell, 2013, p. 76) of an individual or group. Qualitative research explores the complexity
of relationships among people, seeking the integration of many interactions as it “analyzes
words, reports detailed views of participants, and conducts the study in a natural setting”
(Creswell, 2013, p. 300). It does not seek to provide findings that are generalizable beyond the
individual or group being studied (Creswell, 2013). Mixed-methods methodology is defined as a
research design that employs both quantitative and qualitative techniques in the same study or
group of studies focused upon the same question (Creswell, 2013). More than a simple
amalgamation, “with emerging procedures, a notation system, and specific designs, the
discussion has turned to viewing mixed methods as a separate and distinct design” (Creswell
2015, p. 540).
The dissertations that were analyzed were randomly selected from all dissertations
dealing with the field of education published in the state of Virginia and held in the ProQuest
Dissertations and Theses Global database for the years 2007, 2012, and 2017.

20
Significance of the Study
This study offers significant insights into the current state of doctoral programs. Previous
studies have laid foundations for this one. For instance, Nelson and Coorough (1994) did a study
of all EdD and PhD dissertations written in the last year of each decade from 1950 to 1990,
looking especially at methodological trends within each kind of dissertation. Their work focused
on seven specific education fields, such as educational administration and physical education.
Walker and Haley-Mize (2012) did a study of the research designs and statistical analysis types
used in EdD and PhD dissertations from 1997 to 2010, but their study was limited to the field of
special education. There is no study tracing the balance of EdD degrees compared to PhD
degrees in the field of education that brings this research up to the present.
Study of the qualitative/quantitative/mixed methods divide is similarly outdated. Sale et
al. (2002) provided significant insights on methodologies used within the specific field of
nursing, but these were about any kind of published study, not just dissertations. Historical
reviews of the methodology debates were provided by Alasuutari et al. (2010) and Walsham
(2015), but they did not analyze trends, that is, whether certain methods were becoming more or
less frequent. Stock and Siegfried (2017) provided a detailed study of the relative numbers of
dissertation types from 1970 to 2010, but they dealt only with the area of economics. This study
will bring up to the present time the analysis of degree types and methodologies chosen by
doctoral students studying the field of education.
This study offers significant insights for those who design and lead doctoral programs in
higher education. There is reason for college administrators to consider whether or how they
need to refine the curricula that lead to the EdD and PhD degrees. Degree types matter because
the PhD degree is sometimes perceived as being more prestigious (Wilson et al., 2014). Yet the

21
two degrees have sometimes been criticized as being essentially the same in content (Nelson &
Coorough, 1994). Currently, the Carnegie Project on the Education Doctorate is working with
24 doctoral-degree-granting institutions to develop a set of distinctives to differentiate the EdD
from the PhD (Boyce, 2012; Perry, 2015). Knowing whether or not there is a trend in doctoral
candidates’ choices between the two major degree types will suggest whether further
consideration is needed about (1) whether a doctoral-degree-granting institution’s programs
warrant the distinction in degrees and (2) whether students are choosing the degree that will best
advance their educational goals.
Any possible trends in methodological choices matter not only to those who lead doctoral
programs, but also to the general public. The two major methodologies are based on two very
different worldviews. Quantitative research is based on positivism (Walsham, 2015) and is
intended to provide generalizable results (Boyce, 2012). Qualitative research is based on
constructivism (Sale et al., 2002) or interpretivism (Walsham, 2015), and is not intended to
provide generalizable results (Boyce, 2012; Creswell, 2013). Trends in methodology may reflect
trends in the worldviews of doctoral students. The general public needs to be aware that not all
scientific research is useful for establishing generalized statements of fact. This is a serious
matter when research studies are presented as reasons for establishing public policy (Perry,
2015).
Research Questions
RQ1: Is there a trend in the frequency of EdD dissertations compared to PhD
dissertations published in the field of education in the state of Virginia, comparing the years
2007, 2012, and 2017?

22
RQ2: Is there a trend in the frequency of research methodology choices (quantitative,
qualitative, and mixed methods) for dissertations written in the field of education in the state of
Virginia, comparing the years 2007, 2012, and 2017?
Definitions
1. Constructivist methodology – Constructivist methodology is an alternative term for
qualitative methodology (Creswell, 2013).
2. Dissertation – A dissertation is a written research study, often guided by a hypothesis,
and involving both evidence and logic (Stock & Siegfried, 2017).
3. Doctor of Education Degree (EdD) – The Doctor of Education Degree is awarded in a
program designed to develop “scholar practitioners” (Boyce 2012, p. 24) who will focus
on applying research to effect change in society (Amrein-Beardsley et al., 2012; Boyce
2012).
4. Doctor of Philosophy Degree (PhD) – The Doctor of Philosophy Degree is awarded in a
program designed to develop scholar-researchers who will focus on developing and
assessing theory in various fields of study (Amrein-Beardsley et al., 2012; Boyce, 2012).
5. Doctoral program – A doctoral program is all the “formal coursework, the assessments
and milestones (such as qualifying exams), seminars, field experiences, publications and
presentations students are expected to make” (Golde, 2015, p. 210) in the course of
earning a doctoral degree.
6. Methodological drag – Methodological drag is an approach in which “qualitative
methodologists convincingly masquerade as situated within epistemological, theoretical,
and methodological frameworks, even those that they may not situate themselves in
personally or professionally” (Nordstrom & Happel-Parkins, 2016, p. 149).

23
7. Mixed-methods methodology – The term mixed methods characterizes a research design
that employs both quantitative and qualitative techniques in the same study (Creswell,
2013). This combination is manifested in new patterns distinct from both quantitative
and qualitative research in their methods, their research designs, and in their ways of
coding and processing data (Creswell, 2015) and incorporates multiple perspectives
simultaneously to enhance understanding of complex phenomena (Sale, Lohfeld, &
Brazil, 2002).
8. Positivist methodology – Positivist methodology is an alternative term for quantitative
methodology (Creswell, 2013; Weber, 2004).
9. Qualitative methodology – Qualitative methodology is a research design that is based on
the belief that people develop their own, unique ideas of reality, and that these
conceptions of reality vary among social groups and across the range of times. It
employs extensive observation of individuals or groups, or reviews artifacts, seeking to
understand the “lived experiences” (Creswell, 2013, p. 76) of an individual or group. It
does not seek to provide findings that are generalizable beyond the individual or group
being studied (Boyce, 2012; Creswell, 2013).
10. Quantitative methodology – Quantitative methodology represents research designs that
assume that human interactions are based on objectively observable phenomena and that
these phenomena are relatively stable across a range of social groups or times. It
employs methods such as surveys, field studies, and experimental or quasi-experimental
designs, providing data which can be expressed in numbers and analyzed by statistics
(Creswell, 2013; Weber, 2004).
24
11. Requisite decision model – “A requisite decision model is defined as a model whose form
and content are sufficient to solve a particular problem” (Phillips, 1984).
12. Trend study – Trend studies are “longitudinal survey designs that involve identifying a
population and analyzing changes within that population over time” (Neuendorf , 2017,
p. 382).
13. Worldview – “Worldviews are the broad philosophical assumptions that researchers use
when they conduct their studies” (Creswell, 2015, p. 539).

25
CHAPTER TWO: LITERATURE REVIEW
Overview
Chapter two presents the historical background of the different doctoral degrees, from
Medieval times to the present, including the development of the most-often chosen degree types
in the field of education, the Doctor of Education Degree (EdD) and the Doctor of Philosophy
Degree (PhD). It also traces the origin and development of the dissertation process. The
theoretical frameworks of two major methodology types, quantitative research and qualitative
research, are presented. The literature review explores the current status of these elements—
EdD and PhD; quantitative research, qualitative research, and mixed-methods research—and
identifies the need for further research in the trends relating to the choices doctoral candidates
make among them.
Theoretical Framework
The theoretical framework for this study is requisite decision modeling. The choices
individuals make about which form of doctorate to pursue and what types of research
methodology to employ are significant choices. Although people may arrive at those decisions
in various ways, the process of requisite decision modeling can apply to many people’s
decisions. Building on the seminal work of Phillips (1984), Clemen and others (Clemen, 2001;
Clemen, & Reilly, 2013; Clemen & Ulu, 2008) have brought the theoretical framework of
requisite decision modeling into the twenty-first century.
Phillips and the Origin of Requisite Decision Modeling
Phillips (1984) defined a requisite decision model as “a model whose form and content
are sufficient to solve a particular problem” (p. 29). In introducing the process of decision
modeling, he proposed the case of a manufacturing company that was considering a new product,

26
something that would move the existing company into an entirely new market of competition.
The management team charged with this decision spent two days intensely working through this
problem. Several possible products were proposed, and each product was analyzed in regard to a
list of various “attributes” (p. 30), each of which could be applied to all products. These
attributes were not existing data, but descriptors which were developed as part of the ad hoc
decision-making process. These attributes were the distinctive qualities that made each product
different from the others. Then, for each potential product, each attribute was assigned a positive
or negative number. A positive value reflected the degree in which that attribute was a benefit to
the company, and a negative reflected the degree in which that attribute was a cost. These values
were subjectively assigned numbers. With the help of an “online computer” (p. 30), a scatter
plot made the combined positive and negative values to be visual. The two axes of the graph
were “benefit” and “cost” (p. 31). The axes of the graph were both labeled from low to high.
The ideal product would be located at the point representing the intersection of the high point of
benefit and the low point of cost. The surprise in the case study was a product possibility which
was suggested, almost discarded, but then kept in the study. It was kept because it would be a
reference point, showing where a very unlikely idea would fall on the graph. In the outcome,
this product idea was the one closest to that ideal high-benefit, low-cost point. As the team
reexamined the balance of already-determined cost-benefit analyses for that product, they began
to see more clearly why that one choice was better than the others. This systematic, analytical
decision-making helped people to see more clearly what was in front of them all the time.
Another element of Phillips’s requisite decision modeling was the role of intuition and
creativity. The new-product case study involved attributes which did not have purely numeric
data that could be ascertained by observation and experimentation because these products did not

27
yet exist. Similarly, the decisions that people make about doctoral degrees or research
methodologies involve elements that cannot be measured objectively in numbers. The case study
presented by Phillips (1984) was an ongoing, evolving process, influenced by intuitions that
arose from careful consideration of the costs and benefits of the options. “Through successive
refinements of the model, new intuitions invariably emerge about the problem, and often an
implementable solution is reached” (Phillips, 1984, p. 30). The theory of requisite decision
modeling does not merely facilitate analysis of the decision. There is an “essentially creative
role of models in problem solving” (Phillips, 1984, p. 34), which can lead to new insights and
options.
Through sensitivity analysis, requisite decision modeling analyzes not only the product to
be manufactured (as in the case study) or other goals of any decision process but also the mindset
of the stakeholders. Sensitivity analysis allows the inclusion of people’s varying tolerance for, or
motivation by, factors such as risk or short-term gains (Clemen & Reilly, 2013). Phillips (1984)
stated, “Sensitivity analysis plays a crucial role in developing requisite models” (p. 36). Phillips
(1984) also stated that the process of sensitivity analysis promotes the development of new
intuitions, which are then built into the on-going analysis of the attributes of the possible choices.
Phillips (1984) explained both the use of the word requisite and his justification for
calling it a model. He wrote, “We choose the term ‘requisite’ to distinguish this type of model
from descriptive, normative, optimal, satisficing [British] or any other kind of model commonly
encountered in the decision literature” (Phillips, 1984, p. 35). The term requisite indicates that
everything needed to complete the decision process has been included. Stating that the word
model is derived from a Latin word meaning “small measure” (p. 33), he asserted that requisite
decision modeling is a small representation of the greater reality which it is used to explore. The

28
requisite decision process is a model, Phillips stated, because it (1) omits elements which the
decision makers expect to be inconsequential to the results, (2) includes complex interactions of
real-world elements of the reality that are “approximated in the model” (p. 35), and (3)
acknowledges that some elements of the “social reality [of the real-world application of the
decision] may be blurred” (p.35). That last statement means that some elements may be
important, but the manner in which they are classified in the decision-making process is not
important, such as the difference between the immediate and the long-term value of the product.
The decision-making theory described by Phillips may not have been new, but he
analyzed the process into its components and expressed it as had not been expressed before
(Clemen, 2001; Clemen & Reilly, 2013). In describing the process in detail, emphasizing the
interrelation of analysis, intuition, cost-benefit analysis, sensitivity analysis, and decision
making, Philips both named and garnered wide attention to a theory of decision making, requisite
decision modeling.
Clemen and the Advance of Requisite Decision Modeling
Clemen (2001) and others have advanced requisite decision modeling to the present time.
Very early, Frisch and Clemen (1991) reiterated Philip’s decision-making theory, summarizing it
this way: “Phillips (1984), for example, defined the notion of a requisite decision model, one that
contains everything that is essential to solving the problem but ignores nonessential issues”
(p. 47). In 2004 Clemen became the founding editor of the journal Decision Analysis. In 2013
Clemen and Reilly published Making Hard Decisions With Decision Tools, which one review
describes as “a must-read for students and practitioners” (Zilinskas, 2018, p. 127) and as a
textbook for graduate students and upper-level undergraduates. These references indicate that

29
Clemen has become a significant voice in the theory of decision making in the twenty-first
century.
The most recent publication available from Clemen (Clemen and Reilly, 2013), restated
and expanded the work of Phillips. This book reiterated Phillips’s ideas, such as the inclusion of
all factors which the decision makers consider to be important, the exclusion of those which they
do not consider to be important, sensitivity analysis, and the process of cycling through the
decision analysis multiple times to allow for modification as new intuitions and sensitivities are
discovered and added. Clemen and Reilly (2013) focused the process more sharply in some
details. They stated this form of decision analysis was “widely used in business and
government” (p. 11) and several other more specific applications, such as product development,
research, and negotiation. Although Phillips (1984) and even the current work by Clemen and
Reilly (2013) began with business-world examples, Clemen and Reilly (2013) stated that “in the
literature many of the reported applications relate to public-policy problems and relatively few to
commercial decisions” (p. 11). They went on to list many specific areas of application, stating
that their goal was not a complete listing of how requisite decision modeling is now used, but to
create an awareness that this decision theory has become very widely used.
Clemen and Reilly (2013) also wrote about advances in the particulars of the requisite
decision model process. While Phillips (1984) wrote of using a computer, accessible online, to
create a scatterplot diagram, Clemen and Reilly (2013) included with their book (also used as a
college textbook [Zilinskas, 2018]) the Palisade’s Decision Tools ® suite of six programs.
Clemen and Reilly (2013) explained some of the statistical functions which the newer tools can
do, far beyond the creation of a scatterplot. The role of sensitivity analysis was greatly expanded
in Clemen and Reilly’s (2013) book, largely because of two advances since 1984. First, the

30
software makes many more dynamically interactive calculations. Because of this capacity, as the
decision makers insert new values for the attributes of the different choices and their own
sensitivities, the interactions of those values can be immediately processed. Second, there is now
a broad body of “subject-matter experts’ probability distributions for each alternative” (p. 247).
Clemen and Reilly (2013) did not contradict the seminal work of Phillips (1984).
Instead, Clemen’s 848-page textbook reflected the advancement of requisite decision modeling
since Phillips’s (1984) 20-page journal article. The basic features of requisite decision modeling,
which can apply to the choices doctoral candidates make regarding degree and methodology
types, have remained the same.
Related Literature
Research Methodology
Although quantitative research and qualitative research are both methods by which
researchers gather information and draw conclusions, they are based upon two distinctly
different theoretical frameworks. These two major divisions of methodology are usually
presented as two very different processes with very different epistemological foundations.
Epistemology is the branch of philosophy, which addresses the question of how people come to
know anything and how people verify that knowledge (Gall, Gall, & Borg, 2007). The
epistemological bases of quantitative research and qualitative research are very different, with
quantitative being based on positivism (Creswell, 2013) and qualitative being based on
constructivism (Creswell, 2013) or interpretism (Walsham, 2015).
Quantitative research and positivism. According to Gall et al. (2007), quantitative
research seeks to gather numerical data that can be used to describe phenomena and then to
analyze and interpret that data by statistics. Even as Alasuutari (2010) began an exposition of

31
how and why qualitative research is becoming more prominent in the social sciences, the article
stated that “the default assumption about scientifically sound research is that [it is] based on
randomized controlled trials” (p. 140). According to Warner (2013) random controlled trials are
an element of quantitative research rather than qualitative research.
The interrelation of positivism and quantitative research is acknowledged in the research
literature as well as in textbook expositions of the nature of quantitative research (Alasuutari,
2010; Creswell, 2013; Sale, et al., 2002; Walsham, 2015; Weber, 2004). Quantitative research is
based on the principle that objective reality can be known and that the facts which are known are
fairly consistent through time and across cultural groups (Creswell, 2013). The roots of
quantitative research are deep within the epistemological system of positivism (Gall et al. 2007;
Sale, et al., 2002). According to Alasuutari (2010), positivism was a product of the eighteenth-
century Enlightenment. Just as the natural sciences, like chemistry and physics, focused upon
objectively observable phenomena, so some people believed, social systems should be analyzed
by the same principles of objective observation and recording of data in numerical form.
Alasuutari (2010) referred to the eighteenth century as the origin of positivism, but another
author set that date two centuries earlier. In Alfred North Whitehead’s work Science and the
Modern World (1953, 1967), the Harvard philosopher and mathematician cited the Protestant
Reformation as the origin of the emphasis on experientially based science, as different from
speculation-based philosophy of ancient Greece and much of the Middle Ages:
At the Reformation, the Church was torn asunder by dissention as to the individual
experiences of believers in respect to justification. . . . The emphasis lies upon the subject
of experience. This change of standpoint is the work of Christianity in its pastoral aspect
of shepherding the company of believers. (pp. 173-174)

32
In summary, Whitehead saw the emphasis upon individual observation of experience as the
source of empiricism in modern science, and the philosophy of positivism is similarly based on
the observation of phenomena.
Qualitative research and constructivism. In contrast to quantitative research methods,
which have a kinship to the natural sciences and have roots reaching into the Protestant
Reformation of the sixteenth century, qualitative research is new as a formal category. Still,
qualitative practices do have precedents in the history of research. In tracing the origins of
qualitative methodology, Alasuutari (2010) stated that the role of case studies and the recognition
of the need to incorporate the viewpoints of the participants have a long association with the
humanist outlook. Sociologists, according to Alasuutari (2010), have always published papers
that were called “theoretical” or “non-empirical” (p. 142). These techniques have largely
diminished in current research, being replaced by, or absorbed into, qualitative research.
Alasuutari identified qualitative methods as “empirical social research” (p. 141). The term
empirical is also applied to quantitative research (Park, 2005). However, in qualitative research
the observed data is not recorded as numbers, but as verbal descriptions, and there is an emphasis
on the role of human perception as influencing what is recorded. All of these emphases marking
qualitative methodology shift the mode of research away from the objective, numerical format of
quantitative research to the personal, verbally descriptive format characteristic of the qualitative
research. In its current form, according to Creswell (2013), qualitative research is “holistic”
(p. 300), with a broad field of vision, taking in many factors to acknowledge the complexity of a
social situation, with lengthy verbal descriptions and analysis of spoken and written words,
actions, and artifacts. It includes the “etic” (p. 292), or the researchers’ understandings, as well
as the “emic” (p. 292), or the participants’ viewpoints.

33
Qualitative research is closely related to the philosophy of constructivism (Creswell,
2013). Vygotsky is credited with initiating the curriculum theory, philosophy, and methods of
constructivism (Anderson-Levitt, 2008). Vygotsky (1978) emphasized the importance of social
environments in learning, the process of scaffolded learning, and the zone of proximal
development. Yet, constructivism has grown beyond the work of Vygotsky. Vygotsky’s works
have “been translated and applied very differently in Spain, Brazil, Ukraine, Mexico, and the
United States” (Anderson-Levitt, 2008, p. 361). One article spoke of the various
“constructivism(s)” and their relationship to identity in the European Union (Zeynep, 2014, p.
21).
The relationship between qualitative research and constructivism is clearly stated in
various sources (Creswell, 2013; Sale, et al., 2002), and the relationship is evident in the natures
of the two concepts. Beyond that, however, certain elements consistently appear in discussions of
constructivism, and these elements also indicate linkage between constructivism and qualitative
research. Just as qualitative research requires the researcher’s reflection on the observed data
(Creswell, 2013), so constructivism encourages reflection on one’s experiences as a part of
personal development (Conner, 2014). Just as qualitative research requires introspection,
looking within one’s self with emphasis on the emic and etic understandings of a situation, so
constructivism “involves a consideration of what the learner already knows about themselves
[sic]” (Conner, 2014, p. 275). Just as qualitative research focuses on the ontological question of
reality, stating that “something is real when it is constructed in the minds of the actors in the
situation” (Creswell, 2013, p. 299), so constructivism pictures students, for example,
constructing within their own minds their different understandings of the nature of the learning
situation and the objectives to be gained from that situation, while the teacher is just the

34
“facilitator or mediator of learning rather than someone who only takes on the role of imparting
knowledge” (Conner, 2014, p. 274).
The term interpretivism is sometimes used instead of constructivism when explaining the
philosophical basis of qualitative research (Sale et al., 2002; Walsham, 2015; Weber, 2004).
Walsham (2015) sums up interpretivism this way:
Interpretive methods of research adopt the position that our knowledge of reality is a
social construction by human actors. In this view, value-free data cannot be obtained,
since the enquirer uses his or her preconceptions in order to guide the process of enquiry
[British spellings]. (p. 376)
This definition of interpretivism is very similar to Vygotsky’s (1978) and Conner’s (2014)
descriptions of constructivism. Considering that all three of the authors who use the term
interpretivism are part of the British Commonwealth (Sale et al., Canada; Walsham, United
Kingdom; and Weber, Australia), it seems that interpretivism and constructivism are effectively
equivalent terms in different dialects.
In summary, just as quantitative research is associated with the philosophy of positivism,
so qualitative research is associated with constructivism. Qualitative research is a collection of
observation-based methods, as is quantitative research, but qualitative methods and the
philosophy of constructivism emphasize the personal insights of both the researcher and the
participant, rather than striving for the impersonal objectivity that is associated with quantitative
research and positivism.

35
Doctoral Degrees and Dissertations
Just as the different research methodologies—quantitative, qualitative, and mixed
methods—are, in theory at least, distinct in processes and purpose; so the educational PhD and
the educational EdD are usually presented as having clearly different functions.
Historical background of doctoral degrees and dissertations. The doctoral degree, as
a separate entity from the doctoral dissertation, originated in Medieval Europe and spread to
Britain, and from there to countries influenced by Britain, such as the United States of America
and Canada (Noble, 1994). However, as Park (2005) pointed out, the thirteenth-century doctoral
degree was really an approval to teach. It was not a higher degree: It was the only degree
granted in a program of study for preparing teachers.
The modern concept of the PhD degree came much later. The current idea of the Doctor
of Philosophy Degree originated with Wilhelm von Humboldt in Germany (Enders, 2016).
According to Park (2005), when Humboldt founded the University of Berlin in 1810, he
designed it as a research-based institution. It was here that the PhD became primarily a research-
related degree. To earn a PhD, students were required to complete a rigorous course of studies,
to write a thesis (the dissertation) that was approved by the faculty, and to make an oral defense
of the thesis. Britain and the United States of America did not have higher education institutions
with this degree of academic rigor, and students went from those countries to attend the
University of Berlin and other German schools that followed Humboldt’s model. These students
then returned to universities in their own countries and brought with them the new PhD
paradigm, including the dissertation. In the United States of America, the first dissertation
written for a PhD program was presented in America at Yale University in 1861. The PhD
degree was designed with a focus on the creation of new knowledge contributions (Park, 2005).

36
Presently, the PhD is commonly described as an academic credential based upon the creation or
testing of theory in a given field (Boyce, 2012; Park, 2005). This focus on research is the golden
key of universities: “These research universities …will shape and be shaped by the new
structure for the production of knowledge” (Geuna, 1998, pp. 265-266).
Park (2005) provided an in-depth analysis of the defining qualities of PhD dissertations,
past and present. In the past, the dissertation was considered to be the candidate’s “magnus [sic]
opus—a piece of research that could have a lasting impact on a discipline” (p. 198). With or
without the major-life-work perspective, the topic must be worthy of research. Malacci and
Kuhne (2014) emphasized the fact that the dissertation research should have social significance:
The candidate should “choose an issue that matters, i.e., the professional contribution” (p. 152).
In recent years, though, another set of values has come to the fore, shifting the focus to
competence and scale (Park, 2005). Regarding competence in research, the research should
show originality, and the dissertation should make a new contribution to the field being studied,
with advancement or critique of theory as a key element. Park discussed in depth the originality
element, calling that the difficult part of defining the PhD, because so many things can be
considered as original. Originality could be manifested by application of existing theories to
new situations or even the examination of new data pertaining to the same research situation as
tested before. Originality could involve taking existing theory and data and creating new theory,
modifying existing theory, or revising the way in which the data were statistically analyzed.
Regarding scale, this emphasis is a significant change in recent years. The fundamental, guiding
principle of scalability is the three-year time frame that is considered to be an acceptable
duration for the research-and-dissertation phase of doctoral work. Park (2005) described the
newer vision of the dissertation as “a more pragmatic notion of a manageable piece of work, of a

37
scope and size that a student could reasonably expect to complete within three years” (p. 198).
Scale relates to both length and quality. Park stated that most higher education institutions set a
100,000 word maximum for doctoral dissertations. The magnum opus view of the dissertation
demanded that it make a significant contribution to the given field and that it be likely to effect
some significant change. That also changed with the shift toward a product appropriate to a
three-year project. With a touch of humor, Park reminded the reader that the dissertation is
intended to result in a PhD Degree, not an international award for a lifetime of work, like a
Nobel Prize. Park’s (2005) summation of the key elements expected in a PhD dissertation
included these: original research, independence, and self-direction (with the guidance and help
of a committee), and contribution to the knowledge base of the related field. Stock and Siegfried
(2013) provided a similar analysis of the elements common to the PhD dissertation as
“systematic research using logical argument and, often, incorporating empirical evidence in
support of a hypothesis” (p. 2013).
The Doctor of Education Degree, with its distinct purposes, came along later than the
Doctor of Philosophy Degree. The first EdD degree in the world was granted at Harvard
University in 1920 (Nelson & Coorough, 1994) or 1922 (Walker & Haley-Mize, 2012). The
EdD is commonly explained as equal in academic rigor to the PhD but different in purpose
(Kantorski & Stegman, 2006). The focus of the EdD Degree was intended to be the application
of research to solve local problems (Hochbein & Perry, 2013; Perry, 2014), rather than the
development or refinement of theory to apply to universal categories (Park, 2005). The
Australian Maxwell (2003) analyzed a shift from “first-generation” to “second-generation”
professional doctorates (p. 279). The difference, as reported by Maxwell and others whom he
cites, is that the earlier model was based on academic studies and a dissertation, like the PhD.

38
The later model relies more on a varied network of learning activities and seminars with more
flexibility in the capstone project and its assessment. In the United States the major force
currently at work at defining and refining the EdD degree, and hence the dissertation which is
intended to prove a candidate’s qualification for that degree, is the Carnegie Project on the
Education Doctorate (CPED) (Boyce, 2010; Buss et al., 2017; Golde, 2015; Hochbein & Perry,
2013; Perry, 2014).
Doctoral degree choices. Since Yale University’s first doctoral dissertation in 1861, this
major composition has been a critical element in earning the doctoral degree in the United States.
Its role has been to allow candidates to prove their competence in research related to field-
specific theory (Park, 2005). The creation of the EdD at Harvard University, with its different
focus on using research applied to the education field (in contrast to the creation, extension, or
testing of existing theory), created a divide that continues to this day.
Debate regarding the EdD and the PhD. The theoretical distinction between the EdD
and the PhD was intended to be clear: The PhD was designed to develop researchers who create
new knowledge and theory, and the EdD was designed to develop researchers who use existing
knowledge and theory to meet local educational needs (Boyce, 2012; Park, 2005). However, the
distinctions are not always so clear. The coexistence of the two degrees within the education
departments of the same institutions has resulted in questions about the level of preparation that
either degree provides. Boyce (2012) stated that “we have done a very poor job of trying to
simultaneously create both scholars and practitioners” (p. 34). Shulman, Golde, Bueschel, and
Garabedian (2006) identified the same problem: trying to accomplish two very different purposes
without sufficiently different processes. They stated that “the problems of the education
doctorates are chronic and crippling. The purposes of preparing scholars and practitioners are

39
confused; as a result, neither is done well” (p. 25). Boyce (2016) and Shulman et al. (2006)
commented on the level of preparation, but Perry (2015), the executive director of the Carnegie
Project on the Education Doctorate, commented on the confusion at the level of the purpose of
the degrees: “Eighty years of scholarly inquiry into the differences between the Ed.D. and the
Ph.D. have resulted in little distinction or understanding” (p. 57). Shulman et al. (2006)
addressed this also. The current state of these two degrees is in question both in the purposes
they should accomplish and in the processes by which those purposes should be accomplished.
The Carnegie Project on the Education Doctorate (CPED) is now a major player in the
development of the EdD (Perry, 2014). Although CPED-related articles often mentioned the
distinction between the EdD and the PhD (Boyce, 2012; Shulman, et al. 2006; Perry, 2014;
Walker & Haley-Mize, 2012), the distinction of the degrees is not the major purpose of the
CPED. The prominent goal of this Carnegie Foundation-endowed work is the improvement of
the EdD itself (Perry, 2015).
One proposed solution to the EdD/PhD confusion was offered by Shulman et al. (2006).
They examined as a case study the restructuring of education doctoral programs at the University
of Southern California Rossier School of Education. The University of Southern California
solution followed the CPED model of involving the faculty in the project of analyzing and
revising the programs. The school previously had one PhD program in education and four EdD
programs. The resulting changes affected many levels of the programs. One resulting element
seems superficial: one PhD degree and one EdD degree, with the EdD having four different
“concentrations” (p. 25). Other changes suggest the true depth of change. The PhD requires
students to be full-time; whereas the EdD can be accomplished in three years by students who
are employed full time in their fields and are students part time. The greater research emphasis

40
of the PhD program is seen in the fact that those who sponsor PhD students must have published
three articles, of which they have been sole authors, within the last three years. These changes,
according to Shulman et al., have resulted in not only a better doctoral program in the school of
education, but also in significantly higher enrollment in both degree programs, the EdD and the
PhD. The solution suggested by Shulman et al. went a step further. Along with crafting
programs having different courses and different forms of assessment, designed for different
purposes, they suggested a different pairing of names, the PhD and the PPD, with the latter
representing the professional practice doctorate. (The “emergence” of the professional practice
doctorate in education is also mentioned by Buss et al., 2017, p. 1624). The new term
emphasizes the approach taken for the PPD (or EdD) degree, “an extremely demanding,
rigorous, respectable, high-level academic experience that prepares students for service as
leading practitioners in the field of education (Shulman et al., 2006, p. 29). On the PhD side of
the divide, the vision of Shulman et al. (2006) of the educational PhD included an emphasis on
research (common in descriptions of the PhD) and the linking of that research to application in
educational practice (not as often overtly stated in regard to the PhD). In contrast, the PPD
would emphasize the scholarly basis of knowledge which could be applied in the educational
world.
Social significance of doctoral degrees. It is not only the distinction of the degrees that
is in question: It is also their perceived social significance. Several authors mention questions
about the value of the doctoral degree and of dissertations in general (Amrein-Beardsly et al.,
2012; Hochbein & Perry, 2013; Park, 2005). Academic rigor is an expectation in a doctoral
program (Park, 2005), and that rigor lends credibility to the degree (Shulman et al., 2006). There
are inconsistent expectations in the doctoral programs of various institutions of higher education.

41
Wilson, Cooper, and Johnson (2014) commented, “Given the various paths and methods used to
instruct students in becoming research literate, it is little surprise dissertations vary in rigor and
perceived value” (p. 91). In proposing their reforms, Shulman et al. (2006) pictured the current
condition of the PhD as an “omnibus degree that signals all things to all educators” (p. 28). The
questions about the value of the PhD, according to Buss et al. (2017), have led to a proliferation
of alternate degrees in many fields, including the Doctor of Business Administration, the Doctor
of Information Technology, the Doctor of Project Management, and, of course, the Doctor of
Education, all of which Buss et al. put under the heading of professional practice doctorates. The
EdD does not escape unscathed. Buss et al. stated that the EdD has received “intense scrutiny
and crushing criticism” (p. 1625). In short, there are many criticisms of doctoral programs and
the resulting degrees, both the EdD and the PhD.
Although some have questioned, as above, the value of doctorates and dissertations, even
more people have commented on society’s perception of the EdD compared to the PhD, with the
PhD consistently garnering more respect. The EdD has been called a “PhD lite” (Perry, 2015,
p. 58; Shulman et al., 2006, p. 27) as pejorative of the perceived less-rigorous academic
requirements. However, worthy of note are mentions of the EdD, not the PhD, as the degree
promoting actual, applied change in the field of education (Boyce, 2012; Buss, et al., 2017;
Shulman et al., 2006; Walker & Haley-Mize, 2012). Shulman et al. (2006) stated that their
proposed reforms to the EdD—greater rigor than before, but shorter duration (three years part
time for the research and writing of the dissertation) than their envisioned PhD—would result in
greater respect for the PPD, their term for their re-engineered EdD program. All of the above
might be summed up this way: The PhD has the greater social prestige, and the EdD has the
greater power for immediate transformation of education.

42
There is more to the social significance of the EdD and PhD than how people evaluate
their comparative prestige. Golde (2015) focused upon the social responsibility of those who
earn doctoral degrees:
The problems facing us are larger and the stakes are higher than ever before. Climate
change, dwindling water supply, poverty, demands for clean energy … . And if we
cannot solve them, we bear a responsibility to equip the next generation to tackle these
challenges. (p. 209)
While other authors addressed the collaboration of administration and faculty in revising doctoral
programs and the related increase in enrollments (Shulman et al., 2006) or the response of
students who are taking the revised EdD courses (Amrein-Beardsly, et al., 2012), Golde
addressed the doctoral degree as something that brings responsibility. The EdD is commonly
acknowledged as the degree of the educational practitioner (Walker & Haley-Mize, 2012;
Wiggins, 2015), the person out working in the field, effecting change. Hochbein and Perry
(2015) went on to urge that those who study to earn an EdD must be trained to make a difference
in society. Citing the “increasing influence of research in educational policy” (p. 183), they
stated that those who earn the EdD should be able to make a difference not only in their schools,
but also in public policy. Devos and Somerville (2012) approached this from a different angle:
Since tax money is part of the investment in doctoral programs, then the programs should be
designed to offer something back to society. Devos and Sommerville stated that, with a well-
defined set of “doctoral knowledge” goals (p. 47), those who earn the EdD can change the world
of education. All of these writers carry one common theme: Those who earn doctoral degrees
have a responsibility to the greater society. The degree is not merely for the individual and his or
her personal goals. This accords with the biblical view of social responsibility: “For everyone to

43
whom much is given, from him much will be required; and to whom much has been committed,
of him they will ask the more” (Luke 12:48, NKJV).
Trends in Doctor of Philosophy and Doctor of Education Degree choices. When the
first doctoral dissertations were written, the only option was the PhD. About 1920, when the
EdD became an option, followed by a proliferation of other professional practice degrees (Buss
et al., 2017; Kantorski & Stegman, 2006; Nelson & Coorough, 1994), some authors have sought
trends in doctoral degree type choices. Nelson and Coorough (1994) studied a sampling of
doctoral dissertations from 1950 through 1990. They found no significant pattern of one degree
over the other (see Table 1).
Table 1
Nelson and Coorough’s Percentages of EdD Degrees Compared to PhD Degrees
1950 1960 1970 1980 1990
Degree Percentage
PhD 65 30 47 54 56
EdD 35 70 53 46 44
Notes. PhD = Doctor of Philosophy Degree, EdD = Doctor of Education Degree
Adapted from “Content Analysis of the PhD Versus the EdD Dissertation,” by J. K. Nelson and
C. Coorough, 1994, Journal of Experimental Education, 62, p. 163. Copyright 2015 by the
Association for Experimental Education.
Kantorski and Stegman (2006) were also interested in which doctoral degree candidates
chose to pursue, but their study differed from Nelson and Coorough’s (1994) study on three
significant points. Kantorski and Stegman (2006) studied only doctoral degrees in music
education; they included a third degree, the Doctor of Music Education (DME); and they
aggregated all 148 degrees that they studied for the years 1998 to 2002 into one summary
statistic for each quality that they examined—they did not attempt to show a trend. Still their
44
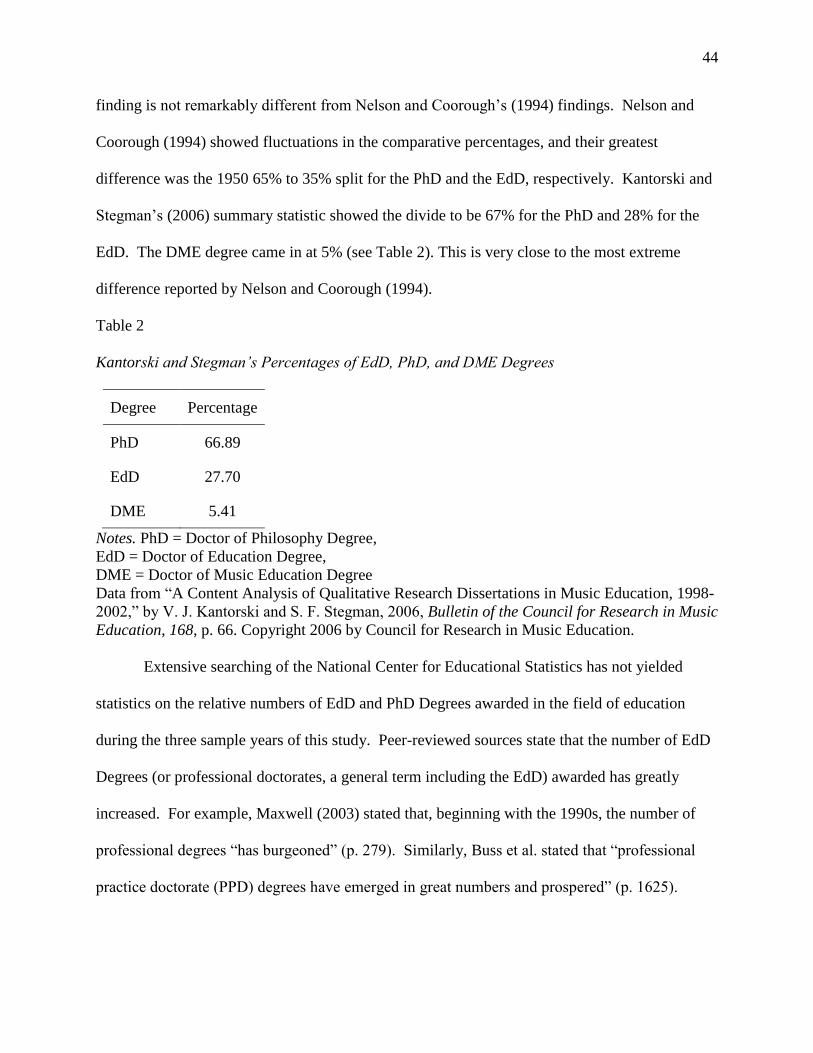
finding is not remarkably different from Nelson and Coorough’s (1994) findings. Nelson and
Coorough (1994) showed fluctuations in the comparative percentages, and their greatest
difference was the 1950 65% to 35% split for the PhD and the EdD, respectively. Kantorski and
Stegman’s (2006) summary statistic showed the divide to be 67% for the PhD and 28% for the
EdD. The DME degree came in at 5% (see Table 2). This is very close to the most extreme
difference reported by Nelson and Coorough (1994).
Table 2
Kantorski and Stegman’s Percentages of EdD, PhD, and DME Degrees
Degree Percentage
PhD 66.89
EdD 27.70
DME 5.41
Notes. PhD = Doctor of Philosophy Degree,
EdD = Doctor of Education Degree,
DME = Doctor of Music Education Degree
Data from “A Content Analysis of Qualitative Research Dissertations in Music Education, 1998-
2002,” by V. J. Kantorski and S. F. Stegman, 2006, Bulletin of the Council for Research in Music
Education, 168, p. 66. Copyright 2006 by Council for Research in Music Education.
Extensive searching of the National Center for Educational Statistics has not yielded
statistics on the relative numbers of EdD and PhD Degrees awarded in the field of education
during the three sample years of this study. Peer-reviewed sources state that the number of EdD
Degrees (or professional doctorates, a general term including the EdD) awarded has greatly
increased. For example, Maxwell (2003) stated that, beginning with the 1990s, the number of
professional degrees “has burgeoned” (p. 279). Similarly, Buss et al. stated that “professional
practice doctorate (PPD) degrees have emerged in great numbers and prospered” (p. 1625).
45
The EdD and the PhD are the two most-often-sought doctoral degrees in the field of
education, but the very nature of the degrees is still in question (Boyce, 2012; Shulman, Golde,
Bueschel, & Garabedian, 2006). They are considered to have social significance for institutions
of higher education, for the people who earn the degrees, and for social policies and practices.
The relative merit and the perceived value of these two degrees is debated. Yet, no trend
analysis of these degrees has been published since 1994. There is a need for an updated study of
the EdD/PhD degree choice.
Dissertation Research Methodologies
Much of the current literature on the EdD/PhD divide dealt with the lack of distinction
between the degrees. The two major methods of research, qualitative and quantitative, having
their roots in different philosophies and having different sets of practices, should be very distinct.
Still, the literature shows concern about the conflation of these two degrees (Perry, 2015).
Debate regarding quantitative and qualitative methodologies. Qualitative research
has an ontological basis differing significantly from the basis of quantitative research. Ontology
is the realm of philosophy that examines what is real (Creswell, 2013). Qualitative researchers
commonly use terms such as multiple truths (Nordstrom & Happel-Parkins, 2016; Sale et al.,
2002; Zamani-Gallaher, Turner, Brown-Tess, & Thrill, 2017) and multiple realities (Creswell,
2013; Nordstrom & Happel-Parkins, 2016). However, the research articles rarely explain what
terms like multiple realities allow. Researchers from both major methodology camps tend to
present their basic assumptions, if at all, without adequate explanation (Weber, 2004). One
exception is Weber (2004), a journal editor who described himself as a positivist (one holding a
frame of reference more associated with quantitative research) who had an interest in learning

46
about and using more interpretivist (qualitative) research. With a bit of humor and with an
attempt to frame this matter in the most positive sense, Weber stated,
First, surely some kind of reality exists beyond our perceptions of it! … I gave the
example of the "reality" that would occur if one were to step off the ledge outside the
window of my office (given that my office is on the third floor of my building). I've yet
to find a colleague who calls herself/himself an interpretivist willing to undertake the
experiment to show me that the outcome I'm confident would occur is a perception rather
than a reality! (p. v)
Weber was not creating a straw-man argument against qualitative research. In the same article he
wrote, “Clearly, both positivist and interpretivist approaches to research have substantial value”
(p. iv). Instead, he was contending that researchers on both sides of the methodological divide
need to clearly express their philosophical assumptions and to understand the assumptions of
those who work from different methodologies. Regarding his third-floor-ledge example, he
stated,
I suspect it is easier to obtain agreement about certain kinds of phenomena (e.g., what
happens if we step off the ledge on the third floor of a building) versus other kinds of
phenomena (e.g., what happens when several individuals interact with each other, or what
some person believes when she or he observes some event).” (p. v)
Sale et al. (2002) supported this conclusion: “Certain phenomena lend themselves to quantitative
as opposed to qualitative inquiry and vice versa in other instances” (p. 48).
Even though Weber posited a very reasonable reading of the multiple realities concept,
the results of any research, whether quantitative or qualitative, require careful analysis. This
consideration includes at least four questions. First, are the research results being used for their

47
intended purpose? Qualitative research is not intended to produce conclusions which may be
generalized to a larger population and, therefore, be used as a basis for educational or social
policy. Speaking of case studies in particular, Creswell (2013) wrote that “the researcher might
focus on a few key issues . . . not for generalizing beyond the case, but for understanding the
complexity of the case” (p. 101). In the same chapter, Creswell called generalizability “a term
that holds little meaning for most qualitative researchers” (pp. 101-102). Second, are the
research results presented with acknowledgement of the necessarily filtered perspective? “We
always bring certain beliefs and philosophical assumptions to our research” (Creswell, 2013,
p. 15). Creswell went on to say that qualitative research must include a discussion of the “beliefs
and assumptions which inform our research” (p. 15). He stated that “qualitative researchers are
embracing the idea of multiple realities. Different researchers embrace different realities, as do
the individuals being studied” (p. 20). He concluded this section with the caution that
researchers must report the personal nature of their own ideals and beliefs that shape their
research. Third, is the researcher skillful? Creswell (2013) warned that qualitative research,
properly done, is as demanding as quantitative research and should not be pursued as a method
less rigorous than mathematically based quantitative research. He discussed five forms of
qualitative research and concluded each section with an analysis of the difficulties inherent to
each form. For example, narrative research requires extensive knowledge not only of the person
participating in the study but also of the contexts in which the participant lives. In grounded
theory, the researcher must eliminate “as much as possible” his or her own “theoretical ideas or
notions” (Creswell, 2013, p. 89). Creswell continued his critique of the demanding nature of
qualitative research through each of the forms he described. Fourth, is the researcher honest?
Nordstrom and Happel-Parkens (2016) described their practice of presenting qualitative work in

48
the language of other theoretical frameworks, something they called “methodological drag”
(Nordstrom & Happel-Parkens, 2016, 149). The term drag refers to the practice of gay men
dressing as women (Moore, 2013). Nordstrom and Happel-Parkens (2016), who described their
theoretical system as both “poststructural and posthumanist” (p. 151), used other systems of
terminology as a “masquerade” (p. 149) to communicate their research and conclusions to people
who are not accustomed to their form of qualitative research. To communicate their ideas, they
“enact more conventional qualitative research methodological approaches in [their] work with
students and faculty members” (p. 151). Just how this “performance” (p. 150, 151) is done
depends on what “power/discourse network” is the context of the performance, but Nordstrom
and Happel-Parkens (2016) stated that the goal is always “subversive” (p. 149). The goal of the
subversion is always persuasion: “For us to convince others of a certain methodological
performance, we must use the discourses of the networks in which that methodology is situated”
(Nordstrom & Happel-Parkens, 2016, p. 150). This method intends to use stealth to break down
commonly accepted ideas: “We slip between networks, we disrupt and interrupt taken-for-
granted iterations of methodologist” (Nordstrom & Happel-Parkens, 2016, p. 150). (This usage
of methodologist does not seem to be an unintentional error. Nordstrom and Happel-Parkins
(2016) consistently used that word to refer to the broad ideas of a methodology, not just to refer
to the person who employs those ideas.) Nordstrom and Happel-Parkens (2016) mentioned other
systems of qualitative research as their target areas. The article never mentioned any form of the
word quantitative, but the authors did mention positivism as a target, and positivism is the
theoretical framework of quantitative research. Nordstrom and Happel-Parkens (2016) stated
that, by their verbiage, they create “dense networks, or multiplicities, that disrupt positivism’s
stable and coherent conceptualization of identity, and, in so doing, create a multiple, contingent

49
subject” (p. 150). Throughout Nordstrom and Happel-Parkens’s (2016) explanations of their
“methodological drag,” (p. 149) the words performance (used 49 times in the article), and enact
(used 6 times in the article) emphasized the nature of their work with students and colleagues as
presenting their work deceptively, as something different from what they really have done.
This sort of “subversive performance,” (Nordstrom & Happel-Parkens, 2015, p. 149)
hidden in terminology having different meanings to practitioners of other research
methodologies, fits well with the ideas that Alinsky (1971) propounded in Rules for Radicals: A
Pragmatic Primer for Realistic Radicals (1971). Alinsky (1971) reframed the question of
morality. Addressing the matter of whether the virtue of the ends can justify the corruption of
the means to those ends, he stated: “The perennial question, ‘Does the end justify the means’ is
meaningless as it stands; the real and only question regarding the ethics of means and ends is,
and has always been, ‘Does this particular end justify this particular means’” (Alinsky, 1971, p.
25). Alinsky (1971) admitted the word corruption into the debate, but he excused it: “Life is a
corrupting process from the time a child learns to play his mother off against his father in the
politics of when to go to bed; he who fears corruption fears life” (pp. 24-25).
Deception is not integral to all research; neither is it part of all qualitative research.
Creswell (2103), in presenting various forms of qualitative research, repeatedly presented
cautions against misuse, stressing the different function and nature of qualitative research (e.g.,
exploring an area, not propounding generalizable theory). He also stressed the practices that
facilitate honest research for each of the five formats that he presented. However, Creswell
(2013) also recognized that both researchers and those who peer-review the research may have
problems with fairness:

50
These assumptions are deeply rooted in our training and reinforced by the scholarly
community in which we work. … Unquestionably reviewers make philosophical
assumptions when they evaluate [research]. Knowing how reviewers stand on issues of
epistemology is helpful to author-researchers. When the assumptions between the author
and the reviewer (or other journal editor) diverge, the author’s work may not receive a
fair hearing. (p. 19)
Good research demands, if not the ideologically neutral ideal of positivism, at least the
clear indication of which ideology directs the researcher. Creswell (2013) stated that one of the
practices of qualitative research reporting should be a clear presentation of the researcher’s
worldview. This explanation would help readers understand the lens through which the
researcher interpreted subjective data and, therefore, gain more meaningful information from the
research. Still, Creswell (2015) also stated that “although some researchers may not realize it,
they make assumptions about knowledge … and how it may be obtained” (p. 539). As Creswell
(2013) overviewed nine worldviews interpretive frameworks, he stated concepts in some of those
worldviews that overlap with Nordstrom and Happel-Parkins’s (2016) desire to produce change
by “disrupt[ing] positivism’s stable and coherent conceptualization of identity” (p. 150) and
Alinsky’s (1971) intention to establish his concept of social justice, particularly regarding
distribution of wealth. Creswell (2013) quoted a source which called postmodernists “armchair
radicals” (p. 27). The term radical links Nordstrom and Happel’s (2016) ideas to the title of
Alinsky’s (1971) book, Rules for Radicals. Pragmatists focus on “what works. … Thus, instead
of a focus on methods, the important aspect of research is the problem being studied” (Creswell,
2013, p. 28). This statement is similar to Alinsky’s (1971) discussion of morality in regard to
ends and means.

51
The summation of this debate on qualitative methods of research is that qualitative
research is very good at analyzing the depth and detailed complexity of significant issues, but it
must be read with cautious consideration of how the conclusions are being derived and
presented. Is the study under consideration exploring the richness of a case, a story, or a culture;
or are the conclusions presented as generalizations that should be applied to other situations?
Even if a researcher presents the necessarily individualistic nature of his findings, not every
person who cites that research in summary form, whether in corporate board rooms, in
conferences on educational policy, or in courts of law, will effectively use and communicate to
others the limitations of the research findings.
Quantitative research. Quantitative research has its own problems in epistemology. In
a textbook presenting methods of statistical analysis, Warner (2013) presented many cautions
about errors and assumptions that can result in misleading conclusions. Warner referred to
statistical “sleight of hand” (p. 83) and stated that statisticians disagree about whether the use of
null hypothesis significance testing is valid. Warner’s (2013) cautions can be grouped into three
categories: errors of intent, errors of implementation, and errors of interpretation. Regarding
researchers’ intent, Warner (2013) wrote, “In everyday thinking, people have a strong preference
for stating hypotheses that they believe to be correct and then looking for evidence that is
consistent with their stated hypothesis” (p. 83). This “everyday thinking” is not different from
academic and scientific research, for Warner stated in the same paragraph, “Researchers often
(but not always) hope to find evidence that is inconsistent with the stated null hypothesis” (p.
83). The word hope speaks of bias. In the discussion of exploratory data analysis and
confirmatory data analysis, Warner (2013) stated that researchers can “hide the fact” (p. 181) that

52
they attempted several variations of the statistical analysis until they found the method that
confirmed their desired outcome.
Regarding errors of implementation, Warner (2013) made suggestions of ways to
improve research design, but the need for such improvements suggests that research can be
imperfect. For instance, after stating that the ideal method of sampling within a population
requires random sampling from a large population with carefully delimited qualities, Warner
(2013) said that “in many real-life situations, researchers use convenience samples” (p. 83).
Another potential error in implementation is the Type I statistical error. This is a commonly
acknowledged consideration in regard to null hypothesis testing (Warner, 2013). In null
hypothesis significance testing, the researcher first states the research question(s), what she or he
expects to find to be true of a situation. Then, the researcher states the opposite, the null
hypothesis. Finally, the experimental data are analyzed to determine whether they show that the
results are likely to have resulted from coincidentally selecting unusual data points. A
predetermined level, often less than 5% likelihood, is established to reject the null hypothesis.
The Type I error is the rejection of the null hypothesis, when it was indeed the more accurate
presentation of reality. In addition to critiques of the sampling procedures, Warner (2013)
warned about errors in data screening, stating that analyses of flawed data sets “can yield
misleading results” (p. 125). Warner (2013) explored various errors of sampling that ranged
from impossible data (such as an answer of three on a descriptive characteristic set with only two
categories) to dishonesty in the participants (citing the example of social desirability bias, giving
answers that deliberately align with or against what the participant believes that the researcher
considers to be good). Quite apart from errors in data screening, Simmons, Nelson, and
Smithsohn (2011) stated that “flexibility in data collection, analysis, and reporting dramatically

53
increases actual false-positive rates. In many cases a researcher is more likely to falsely find
evidence that an effect exists than to correctly find evidence that it does not” (p. 181). Warner
(2013) also cautioned against “excess flexibility” in data screening (p. 181). Skillfully
conducted quantitative research will lessen these errors of implementation, but no amount of skill
can eliminate errors of intent if those exist.
Finally, regarding errors of interpretation, Warner (2013) mentioned problems for the
researchers and for the consumers of research. For those consuming research, Warner (2013)
stated that “many other critics” (p. 83) point out that the null hypothesis approach does not tell
researchers what they really want to know. Such tests will not show that something is true or
effective, but that its antithesis is probably not true or effective. For readers of research, Warner
(2013) stated that the format of the null hypothesis is difficult: “Double negatives are confusing,
and the search for ‘disconfirmatory’ evidence in the NHST [null hypothesis significance testing]
is inconsistent with most people’s preference for ‘confirmatory’ evidence in everyday life” (p.
83).
Research can never be completely objective. Albert Einstein (1938), the consummate
physicist, stated this:
Out of the multitude of our sense experiences we take, mentally and arbitrarily, certain
repeatedly occurring complexes of sense impression (partly in conjunction with sense
impressions which are interpreted as signs for sense experiences of others), and we
attribute to them a meaning—the meaning of the bodily object. (p. 350)
That is, all people, including researchers, select data that has been received through the five
senses, ignoring other data, and assign meaning to that data in the construction of ideas, or
concepts, which are not found in the mere objective sensory input. Schaeffer (1972) added this

54
further concept: “The observer is always there and always makes the conclusion, and he is never
entirely neutral” (p. 198). Both of these thinkers, Einstein (1938) the physicist and Schaeffer
(1972) the Christian philosopher, make the same observation: purely objective research, reduced
to the certainty of mathematical calculations, cannot happen. The balance to this is that properly
done research seeks to overcome that limitation. Warner (2013), writing about quantitative
research, and Creswell (2013), writing about qualitative research, proposed many procedures to
help minimize researcher bias. Researchers who seek to avoid bias can take meaningful steps
toward that goal. Still, objectivity in research is a high goal that, according to some, will never
be fully achieved.
The criticism of quantitative research is abundant, yet such research can be useful.
Warner (2013) used words such as “a large number of critics” (p. 84), “confusing” and “unclear”
(p. 83), “misleading” (p. 125), and “hides the fact” (p. 181) in reporting criticism of certain
research practices. In spite of all the limitations of quantitative research, both in technical
processes and in researcher bias, quantitative research can be useful. Warner (2013) stated that
the distinctive strength of quantitative research is the simple “yes/no” (p. 84) outcome. Warner
proposed an example: If one must decide whether a drug will treat a certain disease, a
quantitative study is the best system available. However, in a contrasting example, Warner
considered research about something less objectively observable, such as development of theory.
In such a study, Warner said, the results of any one study should be considered in light of the
cumulative results of many studies. The key with quantitative research is, as it is with qualitative
research, understanding the inherent problems and valid uses of the research methodology and
then expressing conclusions with clear statements of the limitations of the study.

55
Mixed methods research. Mixed methods research (MMR) combines quantitative and
qualitative research procedures into one study or a series of studies (Archibald, 2016; Creswell,
2015). Creswell (2015) stated that this combination provides “better understanding of the
research problem and questions than either method by itself” (p. 537). Creswell’s (2015)
definition is notable in that it stated the improved understanding is not only about the
conclusions, but also about understanding the “problem”: the phenomenon, person, or group
being studied, and the “questions”: the starting point of the researcher’s inquiry. Alasuutari
(2010) added that the combination of methods increases the validity of the studies. (The
confidence in MMR for increasing validity is not unanimous. Sale et al. (2002) contradicted
Alasuutari [2010] on the matter of whether evidence from a quantitative paradigm can be used to
cross-validate evidence derived from a qualitative paradigm.) Gall et al. (2007) focused on yet
another set of benefits from this combination. They stated that MMR “can provide richer
insights and raise more interesting questions for future research” (Gall et al., 2007, p. 32). Here,
the benefits were proposed to be in the findings, the “insights,” of the current study and in the
identification of other areas for future research. Archibald (2016) emphasized the idea that a
combination of the two broad methodologies, quantitative and qualitative, into mixed-methods
research results in methods which will enable greater gains than could be accomplished by the
use of either alone. The combination, Archibald (2016) asserted, could also be better than the
independent application of each of the methods to the same problem. Archibald (2016) wrote,
“As MMR expands in popularity and complexity, meaningful collaboration may foster
opportunities to approach intricate research problems from new and synergistic angles” (p. 229).
These sources indicate high hopes that the combination of quantitative and qualitative methods
can enhance several basic components of research.

56
A key element of qualitative research is triangulation, defined by Creswell (2013) as the
“use of multiple and different sources, methods, investigators, and theories to provide
corroborating evidence for validating the accuracy” (p. 302). Triangulation is commonly
acknowledged as important in qualitative research (Creswell, 2013; Neuendorf, 2017; Sale et al.,
2002). Just as quantitative research bases its epistemological surety on impartial observation of
objective, stable reality (Creswell, 2013), qualitative research seeks multiple sources of
information that lead to the same conclusions as its means of affirming the reality of the
conclusion which the researcher draws. For instance, in “Rethinking Subcultural Resistance:
Core Values of the Straight Edge Movement,” Haenfler (2004) gathered insights about the
Straight Edge (sXe) culture as a participant-observer; through in-depth interviews with sXer’s in
his area, deliberately selecting individuals to represent different genders, ages, and degrees of
commitment to that culture; and by observing and interviewing sXers from various locations
outside of his immediate area. This type of triangulation relies on different sources of
information for surety. This triangulation, however, does not factor in the worldview lens of the
investigator: one investigator was doing all of the information gathering.
Investigator triangulation (IT) is proposed by Archibald (2016) as a factor that can make
MMR distinctively strong because IT acknowledges the worldview issue. IT represents an
attempt to balance the biasing power of reliance upon the perceptions of the investigators and
participants in qualitative research. IT deals with the use of multiple researchers in addition to
the multiple sources of data to establish credibility of the subjectively-derived conclusion. The
inclusion of researchers representing different mindsets and worldviews is implied in
Archibald’s (2016) statement that IT is useful for “promoting the spirit of diversity characteristic
of MMR” (p. 219). Clarity between the term investigator triangulation and the more general

57
term triangulation, which in Creswell’s (2013) definition, includes the possibility of multiple
investigators can be achieved by use of Neuendorf’s (2017) term “triangulation of methods”
(p. 23) as the category of triangulation that is different from “investigator triangulation.”
The rise of mixed methods, although promising a pathway for doing better research than
either quantitative or qualitative research could allow alone, still comes with inherent dangers.
Serious research flaws that can result from mixed methods are noted with terms like
“obfuscation” and “conflation” (Lydgate, 2016, p. 423). In context of a World Trade
Organization legal dispute, Lydgate (2016) stated that “in some disputes, qualitative findings
about the existence and nature of competitive relationships are presented using the language of
quantitative market analysis” (p. 424). This means that, whether by deliberate subterfuge or
careless logic, the use of both quantitative and qualitative evidence and methods together can
present another avenue for presenting qualitatively derived conclusions in the nomenclature of
empirical and quantitatively evidential research. These research conclusions can result in
erroneous or even detrimental choices as research is cited to influence policy and court decisions.
In spite of the optimism of some, the synthesis of quantitative and qualitative
methodologies does not necessarily make the research better. Sale et al. (2002) warned that
“mixed-methods research is now being adopted uncritically by a new generation of researchers
who have overlooked the underlying assumptions behind the qualitative-quantitative debate”
(p.44). They warned that the loss of understanding of the differences between the theoretical
frameworks underlying these different methodologies can lead to their being inappropriately
employed. They also asserted if people do not understand these different research frameworks,
that misunderstanding could cloud the findings of MMR. They stated, “The truth is we rarely
know the extent of disagreement between qualitative and quantitative results because that is

58
often not reported” (Sale et al., 2002, p. 47). They did not argue against the use of mixed
methods; instead, they argued for distinction in the purposes of MMR. They stated, “Because the
two paradigms do not study the same phenomena, quantitative and qualitative methods cannot be
combined for cross-validation or triangulation purposes. However, they can be combined for
complementary purposes” (Sale, et al., 2002, p. 43). Archibald (2016), a proponent of MMR,
still warned of potential sources of confusion: “Beyond the technical level, philosophical and
methodological considerations are often entangled with [collaborative strategies] at the more
procedural level” (Archibald, 2016, p. 229). Archibald (2016) then explained that, in the
blending of different modes of research, problems of ontology and epistemology “infiltrate” (p.
229) the technical issues. “Whether acknowledged or unrecognized, such preferences
[ontological and epistemological orientations] may manifest as affinities for particular MMR
designs or contribute to nonintegration of qualitative and quantitative data through
methodological favoritism …, thereby acting as a barrier to effective collaboration” (Archibald,
2016, p. 229). As with quantitative research and qualitative research, the value of mixed-
methods research is dependent upon the skill and honesty of the researcher.
Social significance of research methodology. From the Twitter-feed to the scientific
journal, people look to various sources for information on which to base decisions. These
decisions have significance, sometimes of personal and sometimes of national or international
importance. The issues of researcher skill and integrity, as discussed above, affect the quality of
information available.
Beyond the researchers, there is another level at which philosophical mindsets and levels
of skill affect what knowledge is considered worthy of bringing before the public. In the
publishing of peer-reviewed journals, the worldviews of the reviewers can also determine what is

59
published. Walsham (2015) described the power of the journal to homogenize available
research: “A journal can be viewed as a machine … which ties together a network of interested
parties and controls aspects of their behaviour, such as the definition of high quality research”
(p. 382). With similar observation of the power of the journal, he also said that “journals can be
considered as machines or stratagems for enrollment and control” (Walsham, 2016, p. 377). He
specifically cited academic journals as cultures which perpetuate restricted sets of beliefs and
standards to create a body of writers “who do not question existing paradigms and power
structures” (Walsham, 2016, p. 383).
“Knowledge is power” is not only a familiar maxim, but also the name of a charter school
program, the Knowledge is Power Program (KIPP), which has social and economic goals as well
as educational goals (Clarke, 2015; Maranto, 2014). Clark (2015) accused KIPP of reflecting
“neoliberalism’s obsession with knowledge as control and mastery” (p. 71). On the other side,
Maranto and Ritter (2014) defended KIPP, referring to “the now substantial empirical literature
on KIPP schools” (p. 237) and saying that “social justice based criticisms of KIPP betray a
limited understanding of how these schools operate” (p. 239). The availability of knowledge,
necessarily filtered through the theoretical frameworks of research methodologies and the
worldviews of both researchers and peer reviewers, is critical to this debate on educational policy
and methods, a debate which affects children and adolescents in 141 schools.
At another level, even deeper than the worldviews or prejudices of researchers and peer-
reviewers, is the assertion of Mantzoukas (2005) that bias is a necessary and positive element of
qualitative research. He stated that “the paradigmatic rules [of nonpositivist research] require that
these biases should be included rather than excluded from the study” (Mantzoukas, 2005, p.
279). Bias is generally presented as a bad thing (Archibald, 2016; Devos & Somerville;

60
Hochbein & Perry, 2013). However, Mantzoukas (2005) stated that those who reject positivism
believe the following:
Bias is understood as inseparable from the individual researcher, because phenomena are
always filtered through the subjective understandings of the individual conducting the
study. Therefore, the researcher can have neither a “God’s eye-view” of phenomena, nor
be an objective “eye-witness,” but can only be an “I-witness,” always filtering
phenomena through subjective understandings. (p. 283, with quotes from Wittgenstein,
1953)
This view, according to Mantzoukas (2005), “has been adopted by researchers conducting
primarily qualitative research studies” (p. 283). Mantzoukas (2005) does not reject the goal of
minimizing bias in quantitative research, but he asserted that qualitative research ought to be
biased.
Although quantitative research is focused on observation of “objective reality” (Gall et
al., 2007, p. 650), that focus is not an assurance of unbiased reporting either. Huff (1954, 1982),
with ironic humor, wrote a book about how to lie with statistics. More seriously, Boudana
(2011) stated that, for some writers, journalistic objectivity “is considered doomed to failure and
dismissed as an unattainable standard” (p. 385), adding that “some professors” (p. 385) assert
that objectivity in journals is not even a desirable goal. This echoes the statements of
Mantzoukas (2005). Boudana (2011) associated journalistic objectivity with empirical science,
as epitomized in the work of Sir Isaac Newton. Empiricism holds that sensory perception
provides the data with which the mind works (“Empiricism,” n.d.). This aligns the approach to
journalism as an empirical activity with the methods of quantitative research, which, according
to Gall et al. (2007) focuses upon “objective reality” (p. 650). Although Boudana’s (2011)

61
article argued in favor of unbiased journalism, stating that it is difficult but attainable, the article
also provided a catalogue of charges that others have made against the concept of, the possibility
of, and even the propriety of, objectivity in journalism. Criticisms included are that journalists
are unavoidably biased by their political frameworks, that the news organizations are the cause
of biases that will override the mindsets of individual journalists, that journalists “are prisoners
of their social environment” (p. 392), and that all language is necessarily biased by the way
cultures establish and change the meanings of words.
People look to others, often researchers and journalists, to gain knowledge beyond their
personal experience. Whether the source is peer-reviewed research and journalism in print, on
the air, or online, there is a possibility of bias. In fact, some of the arguments in the paragraph
above would argue for the certainty of bias. Even though Mantzoukas (2005) associated bias
particularly with qualitative research, the presence of bias in available knowledge is always a
possibility, whether in quantitative or qualitative research. Understanding the methods,
purposes, limitations, and dangers of research methods is important.
Trends in dissertation methodology choices. The origins of quantitative research have
been ascribed to the Reformation of the 1500s, which emphasized individual observation
(Whitehead, 1953, 1967), and the Enlightenment of the 1700s, which emphasized reason and
brought the development of quantitative methods (Alasuutari, 2010). Quantitative research in
the social sciences paralleled the rise of the data-driven approach to the physical sciences
(Alasuutari, 2010). As early as 1690, Sir William Petty of England clearly stated his approach to
research in Political Arithmetick, a book about economics:
Instead of using only comparative and superlative Words, and intellectual Arguments, I
have taken the course … to express my self in Terms of Number, Weight, or Measure; to

62
use only Arguments of Sense, and to consider only such Causes, as have visible
Foundations in Nature; leaving those that depend on the mutable Minds, Opinions,
Appetites and Passions of particular Men, to the Consideration of others. (n.p.)
As well as being seminal in its intent to apply statistics, which are characteristic of quantitative
methodology, to a social science, Petty’s statement also acknowledged a contrast to what is now
called qualitative methodology. Petty refers to “words” and “intellectual Arguments” (Petty,
1690, n.p.), terms which overlap with the rich verbal descriptions and the researcher’s
“abstracting … to the larger meaning of the data” (Creswell, 2013, p 298) which are
characteristic of qualitative research. In the 1930s, methods of sampling, gathering, and
analyzing survey data became more systematized (Alasuutari, 2010), marking a major shift in
application of the survey method. Alasuutari (2010) described the rise of quantitative studies in
the social sciences, assigning that rise to the 1970s, and stating that this was the “golden age of
evaluation” (p. 141). This was followed by a movement away from quantitative research
concurrent with the movement toward private control of social services. The quantitative trend
rose again in the 1990s and 2000s with an emphasis on data as being required to justify policies.
Citing British journals, Alasuutari (2010) noted a trend toward fewer quantitative research
articles compared to all other methodologies (see Table 3). Alasuutari (2010) stated that journals
in the United States of America show a similar pattern, with a decline in quantitative articles
beginning about 1980.

63
Table 3
Alasuutari’s Percentages of Quantitative Articles in British Journals
1960s 1970s 1992-
1994-
1999-
2000-
% Quant 44 36 31 5*
Note. % Quant = percentage of articles using quantitative
methods of data analysis.
* Alasuutari (2010) expressed this as “about one in 20.”
Data from “The Rise and Relevance of Qualitative Research,” by P. Alasuutari, 2010,
International Journal of Social Research Methodology, 13, pp. 140-141. Copyright 2010 by
Taylor & Francis.
Qualitative research, as an organized body of methods called by that name has a much
later origin, about the 1960s or 1970s (Alasuutari, 2010). Many sources speak broadly of the
increasing number of qualitative articles (Alasuutari, 2010; Canagarajah, 2016), but few cite
exact numbers or percentages. Kantorski and Stegman (2006) conducted a study of 148 doctoral
dissertations in the field of music from 1998 to 2002 and reported the percentages that were
qualitative (see Table 4).
Table 4
Kantorski and Stegman’s Percentages of Qualitative Dissertations in Music
1998 1999 2000 2001 2002
% Qual 23 22 19 23 24
Note. % Qual = percentage of articles using qualitative methods.
Adapted from “A Content Analysis of Qualitative Research Dissertations in Music Education,
1998-2002,” by V. J. Kantorski and S. F. Stegman, 2006, Bulletin of the Council for Research in
Music Education, 168, p. 67. Copyright 2006 by Council for Research in Music Education.
MMR is definitely on the rise, but its origin is indefinite. Creswell (2015) stated that
“since the 1930s” (p. 538) researchers in the social sciences, including education, have used
multiple “methods of data” (p. 538). Creswell (2015) attributed “multitrait, multimethod”
methodology to Campbell and Fiske in 1959 (p. 538). The earliest reference to the term
64
multimethod found in a search of a university online journal database was Brewer and Hunter’s
(1989) book Multimethod Research: A Synthesis of Styles. Since then, the increasing number of
references to mixed methods in peer-reviewed journals justifies Thaler’s (2017) speaking of the
rise of MMR “in recent decades” (p. 59). Alasuutari (2010) dated this rise from the late 1980s,
adding that the Journal of Mixed Methods Research began publication in 2007. Archibald
(2016) wrote of MMR as then “expand[ing] in popularity” (p. 229).
Research has power to change society, and the three major types of research—
quantitative, qualitative, and mixed methods—have very different philosophical bases, including
a debate about the propriety of deliberate bias. Yet, no study in the trends in researchers’ choices
among these methods has been done since Alasuutari’s study in 2010. This indicates a need for
this proposed study of the choices in methodology in doctoral dissertations.
Summary
This chapter examined the three major research methodology choices: quantitative,
qualitative, and the combination of these in mixed methods. Attention was given to the
theoretical frameworks behind the methods, the significance of the methods, and trends in
doctoral candidates’ choices among methodologies. The vastly different theoretical frameworks
of these methodologies, positivism and constructivism, have potential for promoting many
different directions in educational, governmental, and social policies. This chapter also
examined education doctoral degree types, the EdD and the PhD, in terms of their historical
backgrounds, their social significance, and trends in doctoral candidates’ choices between degree
types. The literature showed that these degrees have great significance not only for the
individuals earning them and the institutions granting them, but also for society. Researchers
and practitioners establish and execute theoretical and practical changes in education and in
65
many other areas of society. The historical background of the degree types, the EdD and the
PhD, and choices that doctoral candidates make between them reflect a slow but constant
condition of change. Also in a state of change are the percentages of research studies employing
the different methodologies, qualitative, quantitative, and mixed methods. Considering the
power and the importance of both the doctorate and the methods of research, and considering the
fact that no study exists that tracks the trends in degrees and methodologies since Nelson and
Coorough’s (1994) study of degree choices in 1994 and Alasuutari’s (2010) study of
methodology choices in 2010, there is a need to study the trends in doctoral candidates’ choices
of degree types and methodologies in recent years.

66
CHAPTER THREE: METHODS
Overview
The purpose of this content analysis and trend study of archived data was to examine
recent trends in the choices that doctoral candidates in the field of education have made
regarding the type of doctoral degree to seek, the Doctor of Education Degree (EdD) or the
Doctor of Philosophy Degree (PhD) and the type of methodology employed in the dissertation
research: quantitative, qualitative, or mixed methods. It used content analysis of samples of
dissertations randomly drawn from ProQuest Dissertations and Theses Global database (hereafter
ProQuest) representing doctoral work done in the state of Virginia in the years 2007, 2012, and
2017. Chapter Three presents the design of this study, the research questions, the null
hypotheses, the participants and setting, the variables, the procedures, and the data analysis
methods.
Design
Two quantitative research designs converged in this study. The data collection design
was a content analysis of archived data. The data analysis method was trend analysis. Gall et al.
(2007) identified content analysis as appropriate for documents, which are described as “written
materials” (p. 288). This description precisely fits the dissertations that were considered, as
distinct from audio and video recordings, also suitable for content analysis. Gall et al. (2007)
stated, “In quantitative research, the analysis of documents typically involves content analysis”
(p. 288). Content analysis involves the preselection of specific, identifiable, and classifiable
categories of data. The categories analyzed in this study were the year of dissertation
publication, the degree sought, and the methodology employed. Neuendorf (2017) identified
trend studies as “longitudinal survey designs that involve identifying a population and analyzing

67
changes within that population over time” (p. 382). This definition describes this study well. In
this study the survey was the content analysis of archived data, a pattern used in other published
articles (Buss et al., 2017; Kantorski & Stegman, 2006; Nelson & Coorough, 1994). Gall et al.
(2007) stated that if documents are used for content analysis, the selection and analysis of those
documents must be “systematic” (p. 288). The systematic procedures for sample selection and
content analysis are presented in the Procedures section of this chapter.
Other published articles have used content analysis for similar studies, notably Nelson
and Coorough’s 1994 study, “Content Analysis of the PhD Versus the EdD Dissertation.”
Similar to the current study, Nelson and Coorough (1994) analyzed a sampling of dissertations
for the last year of each decade, from 1950 to 1990. Their study first grouped the dissertations
by degree type, EdD and PhD, then examined each dissertation on the basis of seven
characteristics, e.g., gender of the author, research design employed, and statistical analyses that
were used. They used the chi-square test to determine whether the difference between expected
and actual comparative numbers of each type of dissertation was significant. Kantorski and
Stegman (2006) analyzed each dissertation for degree type (EdD, PhD, and DME [Doctor of
Music Education]). Although they did not clearly compare quantitative versus qualitative design
methods, they did compare qualitative as one group to every design that was not qualitative as
another group. This is not quite the same as a quantitative/qualitative comparison because there
are other research designs, such as historical study and program evaluation, mentioned by Nelson
and Coorough (1994). Kantorski and Stegman (2006) reported their results in tables showing the
numbers and percentages of dissertations through the years that reflected the various qualities
that they selected to study. Their tables and discussion dealt with trends, but no chi-square tests
or other tests of significance were used.

68
This design methodology is appropriate because content analysis and trend analysis are
standard methods of gathering and analyzing data from archived documents (Gall et al., 2007;
Neuendorf, 2017) and because it has been used in similar studies published in peer-reviewed
journals (Kantorski & Stegman, 2006; Nelson & Coorough, 1994).
Research Questions
The study used the following research questions:
RQ1: Is there a trend in the frequency of EdD dissertations compared to PhD
dissertations published in the field of education in the state of Virginia, comparing the years
2007, 2012, and 2017?
RQ2: Is there a trend in the frequency of research methodology choices (quantitative,
qualitative, and mixed methods) for dissertations published in the field of education in the state
of Virginia, comparing the years 2007, 2012, and 2017?
Null Hypotheses
H01: There is no statistically significant change in the frequency of EdD dissertations
compared to PhD dissertations published in the field of education in the state of Virginia,
comparing the years 2007, 2012, and 2017.
H02: There is no statistically significant change in the frequency of research methodology
choices (quantitative, qualitative, and mixed methods) for dissertations published in the field of
education in the state of Virginia, comparing the years 2007, 2012, and 2017.
Participants and Setting
The participants for this study of archived documents were a random sampling of
doctoral candidates from the years 2007, 2012, and 2017 whose dissertations were published in
the ProQuest online database of dissertations. All information on ProQuest is available as public

69
record. This database is available among the online research resources of the university hosting
this study. According to the description of ProQuest on the hosting university’s list of databases,
ProQuest is the “most comprehensive collection of dissertations and theses from around the
world, spanning from 1743 to the present day and offering full-text for graduate works added
since 1997 and selected full-text for works prior to 1997” (Liberty University, n.d., n.p.). The
ProQuest (n.d.) website stated the same ideas: its collection of theses and dissertations extends
back to 1743, with full texts of documents from 1997 to the present, and selected works
published prior to 1997 are also presented in full text. ProQuest Dissertations and Theses Global
is an omnibus database comprised of seven subject matter databases for dissertations and theses.
The social science database, including education, is one of the seven. The advanced search
functions, described in the Procedures section to follow, made this site suitable for selecting all
the doctoral dissertations published in the field of education, for the desired specific years, and
from the one desired state of focus, Virginia. An advanced search of the hosting university’s
online databases of peer-reviewed journal articles published from 2012 to 2017 (as of August
2017) showed 162 articles which used ProQuest to identify data for their research. This search
excluded doctoral dissertations. Among these articles were 41 articles in the discipline of
education (e.g., Allen & Weber, 2016; Funge, Sullivan, & Tarter, 2016; Sparks, 2017).
The years chosen for sampling, 2007, 2012, and 2017, reflected an assumption and a goal
of the researcher. The researcher assumed that if there was a trend in doctoral candidates’
choices of degree types and methodology types, the five-year intervals would be sufficient to
reveal the trend. Recently published works have expressed trends in the area of methodology
choice, e.g., Archibald (2016) and Creswell (2015). However, the most recent source which the
researcher found to compare doctoral degree choices, Nelson and Coorough’s (1994) study,

70
showed no clear trend as late as 1990. The researcher’s goal was to bring these studies up to the
present time. A study that extended to the end of 2017 would, by the time of publication, be the
most recent evaluation possible.
This sample represented the population of all doctoral candidates in the state of Virginia
who had dissertations published in the ProQuest Dissertations and Theses Global database in
those years. One hundred thirty dissertations were randomly selected as the samples to represent
the population of each year, 2007, 2012, and 2017. The population for each year was all the
dissertations published in Virginia institutions of higher education in the given year. The
number 130 was chosen because 124 is the minimum sample size required to attain a statistical
power of .70 and a medium effect size when using the chi-square test of association (Gall et al.,
2007; Warner, 2013). The setting for this study was doctoral-degree-granting universities in the
state of Virginia. Searches of the ProQuest Dissertations and Theses Global showed that there
were 234 dissertations dealing with education written in Virginia universities in 2007, 305 in
2012, and 285 in 2017.
Some dissertations employed methodologies that could not be classified as quantitative,
qualitative, or mixed methods. Although much less common, program evaluations and historical
reviews are sometimes used as methodologies (Nelson & Coorough, 1994). These dissertations
were passed over, and the next randomly chosen dissertation was evaluated. Similarly, if a
degree type was something other than the EdD or PhD, that dissertation was passed over.
Kantorski and Stegman (2006) included the Doctor of Music Education Degree as a topic
represented in doctoral dissertations in the field of music education, their particular focus.
Omitting those allowed this study to more closely follow the pattern of the Nelson and
Coorough’s (1994) study, and one purpose of this study was to bring two elements of the Nelson

71
and Coorough study—the EdD/PhD choice and the quantitative/qualitative choice—up to the
present time.
The sample size was 130 dissertations from each of the three years under consideration.
According to Gall et al. (2007), 124 is the number of data points required for a statistical power
of .70 at the .05 alpha level with a chi-square analysis in a 3 x 4 design (see Tables 5 and 6).
Table 5
Frequencies of Degree Types in All Years of the Study
2007 2012 2017
Degree Number of Cases
PhD 90 81 67
EdD 40 49 63
Notes. PhD = Doctor of Philosophy Degree,
EdD = Doctor of Education Degree.
Table 6
Frequencies of Methodology Types in All Years of the Study
2007 2012 2017
Method Number of Cases
Quant 57 60 59
Qual 44 43 60
Mixed 29 27 11
Notes. Quant = quantitative, Qual = qualitative,
Mixed = mixed methods.
Procedures
Initial steps involved obtaining a letter of approval (see Appendix A) from the host
university’s institutional review board (IRB) and selection of a random sample of dissertations.
72
After approval of the research plan, the researcher identified all doctoral dissertations written by
doctoral candidates in the years 2007, 2012, and 2017 for the discipline of education in the state
of Virginia. The unit of statistical analysis was the individual dissertation. The choice of years
is itself a sampling procedure. The choice reflected the intention to sample dissertations at five-
year intervals, allowing time for any trends to manifest themselves. It also reflected the intention
to bring the study up to the most current, completed year as of the publication of the research,
which was 2018. To identify the appropriate dissertations, the researcher accessed the ProQuest
database and used the advanced search function. The search terms and filters were as follows:
(1) In the first search term box, enter “Virginia,” and in the filter box to the right, where the word
“Anywhere” was the default, click for the drop-down menu and choose the filter
“University/Institution Location – ULO.” (2) In the second search term box, at the left where the
Boolean search function “AND” showed, click for the drop-down menu and choose “NOT” and
enter “West Virginia.” This limited the search to dissertations from institutions in Virginia. (3)
Below the search term boxes, the box was checked for “Limit to … Full text.” (3) At the
“Publication date” filter, the drop-down menu was clicked and the choice “Within this year” was
made and the desired year (e.g., 2007) was typed into the box below. (4) At the filter “Subject
heading (all),” “education” was typed. (5) At the filter “Manuscript type,” the box for “Doctoral
dissertations” was checked. (6) Then the “Search” button was clicked. For the year 2007, this
search reported that 234 dissertations were found.
After identifying the whole population of appropriate dissertations in each year, 130
samples were selected at random from among the year’s population. The researcher used an
online program to generate random numbers (Random.org, 2017). The researcher generated a
set of 150 random numbers from the range of numbers 1 through the total number of possible

73
dissertations for a given year. For 2007, when there were 234 dissertations appropriate for this
study, this random-number generation yielded a selection of 150 numbers from the range of 1
through 234. The random number generator returned the numbers ordered from low to high.
This order facilitated finding the randomly selected items in list of dissertations produced by the
search of the ProQuest database. One hundred fifty dissertations were sampled, even though the
target number of dissertations to analyze is 130. This allowed for the event that some could not
be used in the study because the degree or methodology type could not be clearly determined or
was outside the goals of this study. ProQuest returned documents in a numbered list. The
dissertations in the ProQuest list having numbers which matched the randomly chosen numbers
were copied into an Excel spreadsheet. These were the samples chosen for a given year. The
Excel spreadsheet program has a feature that highlights repeat values. This feature was enabled.
Occasionally a dissertation appeared more than once in the ProQuest database.
After the random selection process, the sampled dissertations were analyzed for degree
and methodology types. First, the researcher identified the degree type which was sought by the
writer of the dissertation. Systematic identification of the degree types was very clear. The title
pages of the dissertations contained the degree type in a phrase similar to in partial fulfillment of
the requirements for the degree of Doctor of Education/Doctor of Philosophy.
After that, the researcher identified the methodology employed. Systematic identification
of the methodology—quantitative, qualitative, or mixed methods—proved more demanding than
the identification of the degree type. Sometimes the methodology type was identified in the title,
such as Estimating Statewide Achievement Gap Effects Using Hierarchical Linear Models:
Applications for No Child Left Behind Data (Tuerk, 2007). Hierarchical linear modeling is
identified by Gall et al. (2007) as a statistical method. Sometimes the methodology was
74
identified by the author in the abstract. For instance, Lucas (2007) stated this in the abstract:
“The study used a qualitative method to accomplish this task” (p. 5). Regarding the use of
abstracts for content analysis, Nelson and Coorough (1994) stated that there is “near-perfect
agreement between content analysis of dissertation abstracts and analysis of the total studies” (p.
160). In all cases of this study, at least the title and the abstract were both analyzed for
methodology type. However, it sometimes was necessary to study the methodology section to
draw conclusions about the research design. For instance, in How Exemplary Teachers Educate
Children of Poverty, Having Low School Readiness Skills, Without Referrals to Special
Education (Howard, 2007), the title and the abstract were not sufficient to determine whether the
study was quantitative, qualitative, or mixed methods. The methodology section clarified the
matter by describing the data collection methods as the conducting of interviews, creation of
video and audio recordings, and the writing of memos. This dissertation was classified as
qualitative in methodology. In the title and in the abstract, the researcher looked for the words
quantitative, qualitative, or mixed methods. These locations sometimes included reference to
one or more specific types of methodologies within the quantitative or qualitative domain or both
domains. This research combined and followed the paradigms of Creswell (2015) and Gall et al.
(2007) for identifying methodologies by the mention of the research designs employed. Both
were needed because each mentioned something the other passed over. Quantitative
methodologies were considered to include experimental, quasi-experimental, correlational,
survey, descriptive, and causal-comparative research. Qualitative methodologies were
considered to include grounded theory, ethnography, narrative, case study, and historical
research. Although Creswell (2015) included action research in the qualitative area, Gall et al.
(2007) placed both action research and evaluative research in the category “applications of

75
research” (p. vi), as distinct from quantitative or qualitative “approaches to research” (pp. v-vi).
This study followed the evaluation of Gall et al. and omitted from the data any dissertations
labeled as action research or evaluative research. The term “applied research design” (Baird
2007, p. 7) was used in some studies, with further delimitation of the methodology as qualitative.
These studies were included in this research. Mixed methods research included types labeled
mixed methods research (or similar titles) and studies that identified specific research types from
each of the two broad domains as having been used in the same study. With or without such a
statement in the title, the researcher evaluated each dissertation’s abstract, looking for the same
terms. If a determination could not be made on the basis of the title and abstract, the researcher
examined the methodology chapter (or area) of the dissertation for those key words or
descriptions of research methods that identified the research type. If the design type was still not
clear, the researcher examined the Data Analysis section for indications. The naming of
statistical tests, like the t-test, ANOVA, or chi-square was taken to indicate quantitative
methodology. Mention of seeking themes among written or recorded words, formation of codes
and categories of data (not dummy coding, such as 0 = female and 1 = male) was taken to
indicate qualitative research (Creswell, 2013). A combination of terms from the two broad
domains was interpreted as indicating mixed methods.
Some dissertations selected by the random number process were not usable for this study
because they named a degree other than the EdD and PhD. Others were not usable because the
research methodology could not be clearly identified as quantitative, qualitative, or mixed
methods after examination of the title, abstract, and methods sections. Such dissertations were
omitted from the study and the dissertation identified by the next random number was examined.

76
Then, for each randomly selected sample dissertation, data was recorded in an Excel
spreadsheet. The headings on the spreadsheet included the following: year of publication, title,
author, ProQuest number, degree type (1 = EdD, 2 = PhD), and methodology (1 = quantitative, 2
= qualitative, 3 = mixed methods).
Data Analysis
Data Screening
IBM SPSS ® version 25 software was used to analyze the data. The independent variable
in this study was the year of dissertation publication. The dependent variables in this study were
(1) the type of degree sought (PhD, coded 1; and the EdD, coded 2) and (2) the research
methodology chosen (quantitative, coded 1; qualitative, coded 2; and mixed methods, coded 3).
Descriptive statistics for the research variables were generated in the form of frequency counts
for each of the three years of consideration. Warner (2013) stated that frequency counts are
useful for gathering data for statements of proportions and percentages. Data was screened for
impossible or extreme numbers by a visual analysis of the SPSS tables of individual entries (each
dissertation) and the totals for each category, each year.
Variables
The two statistical tests that were used, chi-square and Cramér’s V, allowed freedom in
the choice of which variable was considered the independent (predictor) variable and which was
the dependent (criterion) variable. According to Warner (2013) Cramér’s V is a symmetrical
comparison, that is, “it does not matter which is the independent variable” (p. 334). Warner
(2013) also stated that a large chi-square statistic could show merely a “relationship between
group membership on the two variables” (p. 1075) and indicate the “strength of association”
(p. 318) between the variables, but no mention of causality was made in either of these

77
discussions. Since Warner (2013) stated that the dependent variables in nonparametric tests may
be “either nominal or ordinal” (p. 22), the year of dissertation publication (2007, 2012, and 2017)
was assigned the title of independent variable. The two degree-type choices (EdD and PhD),
which are nominal variables, were designated as the dependent variables for the first research
question. The three choices for research methodology (qualitative, quantitative, and mixed
methods), which are also nominal variables, were the dependent variables for the second
research question.
Assumption Testing
According to Green and Salkind (2014), the chi-square is a nonparametric test.
Therefore, normal distribution of scores is not a requirement. Categorical or nominal data,
which do not have interval or ratio numeric expression, are acceptable. According to Green and
Salkind (2014), two assumptions are required. The first has two parts: randomness of sampling
and independence of observations. The random sampling was an important part of this research
design, accomplished by the generation of random numbers and the use of those numbers in the
choice of dissertations for the study from the list generated by the ProQuest search. The
requirement of independence of observations was also met. This is indicated by the fact that no
selected dissertation could affect the data yielded by another selected dissertation. The second
required assumption is a “relatively large” sample size (Green & Salkind, 2014, p. 321). Green
and Salkind (2014) suggested that not more than 20% of the cells should have frequencies of less
than five. Considering the 124 cases each year required to achieve a statistical power of .70 at the
= .05 level, this was not a problem. One hundred and thirty dissertations were selected for
each year, further assuring that the requirement of a large sampling of cases was met.

78
Analysis and Reporting
The frequency counts were converted into percentages in the SPSS analysis. This
eliminated the effect of the variability of the numeric totals from year to year and allowed the
analysis to be based on ratios, that is, on having the same comparison base of 100% each year.
The chi-square statistic was derived using SPSS software. The chi-square is a test for the
statistical significance of changes (Gall et al., 2007). That answered the question of whether the
changes in percentages of degree choices and methodology choices over the years of the study
were statistically significant. Each year studied (2007, 2012, and 2017) provided analysis of two
options for the degree choice (EdD or PhD) and three options for the methodology choice
(qualitative, quantitative, or mixed methods). The total counts were gathered into two data
tables, one for tracking changes in the degree choice and the other for tracking changes in the
methodology choice (see Table 5 and Table 6). This analysis and these tables reflect the two
research questions. For each research question, a chi-square analysis was used to test whether
changes in percentages were statistically significant. According to Neuendorf (2017), the chi-
square is “a statistic designed for assessing the interrelationship between … nominal variables”
(p. 255). The choices considered for each dissertation were nominal variables. Gall et al. (2007)
also showed the chi-square used with 2 x 4 and 3 x 4 tables, suggesting that the 2 x 3 and 3 x 3
tables were within the range of usage. Green and Salkind (2014) stated that “if the chi-square
test (Pearson or likelihood ratio) has more than one degree of freedom, it is an omnibus test,”
(p. 334) and the components can be individually tested for significance in the follow-up testing.
This was useful for testing whether there was significant change at one five-year stage, but not at
the other. For example, the change in percentage of EdD and PhD Degrees could have been
significant from 2007 to 2012, but not from 2012 to 2017.

79
According to Gall et al. (2007), the chi-square test is “a nonparametric test of statistical
significance that is used when the research data are in the form of frequency counts for two or
more categories” (p. 634). That description fits the data arrangement (see Tables 5 and 6).
Creswell (2015) stated that the chi-square test is useful for studies comparing categories within
groups. Hashemi and Babaii (2013) used the chi-square analysis in a trend study of mixed-
methods research in linguistics from 1995 to 2008, a study that is similar to this research
because, in this study, categories such as degree types or methodology types were grouped by the
years of dissertation publication. Creswell (2015) further stated that the chi-square requires one
independent and one dependent variable. For this study, either the year of publication or the
choice-type (degree or methodology) could be called the independent or dependent variable with
no difference (Warner, 2013). All that was sought was whether there was a trend that was
statistically significant at the alpha-level .05. The information sought was whether the change in
numbers of EdD degrees versus PhD degrees, for example, from one year to the next was enough
to be significant beyond the level of chance variations. The dependent/independent variable
designation was arbitrary because there was no intention to imply causation. This study had two
chi-square analyses, one with three years of dissertation data in two categories (the EdD or PhD
choice) and another with the same three years of data, analyzing the same dissertations in regard
to the other factor considered in each dissertation, the three categories of methodology
(quantitative, qualitative, or mixed methods). Creswell (2015) further stated that the chi-square
test is used for categorical data, such as the variables in this study. Finally, Creswell (2015)
stated the chi-square test could be used with non-normal distributions of data, a condition to be
expected when there are so few summarized data points, as indicated by the 3 x 2 and 3 x 3
tables.

80
The chi-square yields a p value, allowing a statement about statistical significance. Gall
et al. (2007) specified a minimum sample size of 124 to be likely to yield a statement of
statistical significance at the = .05 level, a medium effect size, and a statistical power of .70.
Higher statistical powers indicate a data set with a “better chance of obtaining a statistically
significant outcome” (Warner, 2013, p 23).
Data was analyzed for effect size by crosstabulation. Crosstabulation performed by SPSS
software on a two-way contingency table yields several measures of effect size, but Green and
Salkind (2014) focused on Pearson’s r and Cramér’s V. “For 2 x 2, 2 x 3, and 3 x 2 tables, phi
and Cramér’s V are identical” (p. 331). This condition described the 2 x 3 table tracking the
changes of EdD and PhD degrees through 2007, 2012, and 2017. However, the data for the
methodology choice was recorded in a 3 x 3 table. Green and Salkind (2014) stated that “if both
the row and the column variables have more than two levels, phi can exceed 1 and, therefore, be
hard to interpret” (p. 331). Since, according to Warner (2013), Cramér’s V is the “most widely
reported effect size for the chi-square test of association” (p. 334), Cramér’s V was used to report
effect size for both the degree-type choice and the methodology-type choice. Further, Warner
(2013) stated that Cramer’s V was a symmetrical measure of association: it does not matter
which nominal category is labeled as the independent variable and which is labeled as
dependent. Since no cause-effect relationship is intended, that flexibility fit this study. Finally,
the analyzed data was presented as frequency tables and graphs.
Summary
In Chapter Three the design of the study was discussed: content analysis seeking data,
followed by trend analysis of that data. The research questions and null hypotheses were
presented. The participants and setting providing the 130 dissertations per year were explained.

81
The instrumentation, ProQuest Dissertations and Theses Global, was described, and the methods
for sampling dissertations and recording data were presented. Finally, the data analysis
procedures, including the chi-square analysis of significance and Cramer’s V for effect size were
explained.

82
CHAPTER FOUR: FINDINGS
Overview
Chapter Four presents the descriptive statistics regarding the choices that doctoral
candidates have made between degree types (the Doctor of Education Degree, the EdD; and the
Doctor of Philosophy Degree, the PhD) and among research methodologies (quantitative,
qualitative, or mixed methods). It reviews the data screening procedures and the assumptions
required for chi-square analysis. The chapter also presents the statistical analyses of the data.
The results for the trend analyses, with their chi-square, Cramér’s V, and phi statistics, are
presented for the 11-year span of the study (2007, 2012, and 2017), treating the years of
dissertation publication as the independent variables and treating the choice of degree type and
methodology type as the dependent variables.
Research Questions
RQ1: Is there a trend in the frequency of EdD dissertations compared to PhD
dissertations published in the field of education in the state of Virginia, comparing the years
2007, 2012, and 2017?
RQ2: Is there a trend in the frequency of research methodology choices (quantitative,
qualitative, and mixed methods) for dissertations written in the field of education in the state of
Virginia, comparing the years 2007, 2012, and 2017?
Null Hypotheses
H01: There is no statistically significant change in the frequency of EdD dissertations
compared to PhD dissertations published in the field of education in the state of Virginia,
comparing the years 2007, 2012, and 2017.
H02: There is no statistically significant change in the frequency of research methodology

83
choices (quantitative, qualitative, and mixed methods) for dissertations published in the field of
education in the state of Virginia, comparing the years 2007, 2012, and 2017.
Descriptive Statistics
Data were grouped for analysis by the independent variables, the years of dissertation
publication. The results for the degree choice can be viewed in Table 5. Random sampling
among education doctorates earned in the state of Virginia yielded 152 EdD Degrees and 238
PhD Degrees for the three years of the study. In the sample taken for 2007, 40 EdD Degrees and
90 PhD Degrees were earned. In the sample taken for 2012, 49 EdD Degrees and 81 PhD
Degrees were earned. In the sample taken for 2017, 63 EdD Degrees and 67 PhD Degrees were
earned (see Table 7). The average length of the dissertations sampled from EdD degree
candidates for all three years was 168 pages, and the average length of dissertations sampled
from PhD candidates was 194 pages. Arranged by methodology for the three years of the study,
the average page counts were as follows: quantitative dissertations, 156 pages; qualitative
dissertations, 207 pages; and mixed-methods dissertations, 207 pages.
Table 7
Frequencies of Degree Types in All Years of the Study, Ordered for SPSS
Independent
Variable
PhD
(n = 238)
EdD
(n = 152)
2007 90 40
2012 81 49
2017 67 63
Notes. EdD = Doctor of Education Degree, PhD = Doctor
of Philosophy Degree.
Data were also analyzed for the choices of research methodology made by doctoral
candidates for the same years. The results for the research methodology are presented in Table 8.

84
Of the selected dissertations in 2007, 57 were written using quantitative methodology, 44 were
written using qualitative methodology, and 29 were written using mixed-methods methodology.
In 2012, 60 were written using quantitative methodology, 43 were written using qualitative
methodology, and 27 were written using mixed-methods methodology. In 2017, 59 were written
using quantitative methodology, 60 were written using qualitative methodology, and 11 were
written using mixed-methods methodology.
Table 8
Frequencies of Methodologies in All Years of the Study, Ordered for SPSS
Independent
Variable
Quant
(n = 176)
Qual
(n = 147)
Mixed Mthd
(n = 67)
2007 57 44 29
2012 60 43 27
2017 59 60 11
Notes. Quant = quantitative research, Qual = qualitative research, Mixed
Methd = mixed-methods research.
Results
Data Screening
The researcher conducted data screening by a visual scan in the SPSS data files, which
were sorted for each of the dependent variables (methodology type: quantitative, qualitative, or
mixed methods; and degree type: PhD or EdD). These variables were coded as follows: PhD =
1, EdD = 2; quantitative = 1, qualitative = 2, mixed methods = 3. No impossible or missing
values were found. Total numbers of dissertations were crosschecked between totals by year,
totals by degree, and totals by methodology. The same total number of dissertations was found
in each case, 390. Errors of incomplete data were precluded by the research design: If one of

85
the three variables for the study (year, degree, or methodology) was not discernable, that
dissertation was passed over, and the next randomly sampled dissertation was analyzed.
Assumptions
According to Green and Salkind (2014), two assumptions must be met for calculation of
a chi-square statistic. The first assumption is random sampling with independence of
observations. Randomness of sampling was assured by the use of computer-generated random
numbers to select dissertations from the list of dissertations that fit this study’s design, as
generated by ProQuest Dissertations & Theses Global database (ProQuest). The independence
of observation is assured by the unlikelihood that any one person’s decisions about graduate
degree and research methodology would influence the decision of anyone else in this study. The
second assumption is a “relatively large” number of cases in the study (Green & Salkind, 2014,
p. 321). That loosely defined goal is given some specific form with Green and Salkind’s (2014)
statement that none of the cells in the data table should have fewer than five cases. In this study,
the lowest number of cases in any one cell was 11. The goal of having a statistical power of .70
and a medium effect size dictated that at least 124 dissertations per year should be included (Gall
et al., 2007). This study sampled 130 dissertations per year. These numbers further assured
meeting the assumption of a large number of data points.
Results for Null Hypothesis One
A crosstabulation analysis was used to test the relationship between the independent
variables (years of dissertation publication) and the dependent variables (degree types) at a 95%
confidence level. The years of dissertation publication were entered as interval levels of
measurement: 2007, 2012, and 2017. The categorical variables were dummy-coded. Degree
type was coded “1” for PhD and “2” for EdD.

86
The crosstabulation showed the frequency and percentages of the different doctoral
degrees in the three years selected for the study (see Table 9).
Table 9
Crosstabulation for Degree Types in All Years of the Study
Degree
Total 1 2
Year 2007 Count 90 40 130
Expected
Count
79.3 50.7 130.0
% within Year 69.2% 30.8% 100.0%
2012 Count 81 49 130
Expected
Count
79.3 50.7 130.0
% within Year 62.3% 37.7% 100.0%
2017 Count 67 63 130
Expected
Count
79.3 50.7 130.0
% within Year 51.5% 48.5% 100.0%
Total Count 238 152 390
Expected
Count
238.0 152.0 390.0
% within Year 61.0% 39.0% 100.0%
Notes. 1 = Doctor of Philosophy Degree, 2 = Doctor of Education
Degree.
The results of the crosstabulation analysis that included all three selected years (2007, 2012, and
2017) were statistically significant at the = .05 level: 2(2) = 8.689, p = .013. According to
Warner (2013), “a large chi-square statistic [2] indicates that there is a relationship between
group membership of the two variables” (p. 1075). According to Warner (2013), the critical
value for the chi-square statistic with two degrees of freedom at the 95% confidence level is 5.99
(see Table 8). The chi-square 2(2) = 8.689 indicates that there is probably a relationship

87
between the year of dissertation publication and the choice of degree made by the doctoral
candidates of that year (see Table 10). Therefore, the researcher rejected Null Hypothesis One.
Table 10
Chi-square Tests for Degree Types in All Years of the Study
Value df
Asymptotic
Significance
(2-sided)
Pearson Chi-Square 8.689a 2 .013
Likelihood Ratio 8.696 2 .013
Linear-by-Linear
Association
8.532 1 .003
N of Valid Cases 390
a. 0 cells (0.0%) have expected count less than 5. The
minimum expected count is 50.67.
The effect size is “an index of the strength of association between two variables”
(Warner, 2013, p. 1084). Cramér’s V is “the most widely reported effect size for the chi-square
test of association” (Warner, 2013, p. 334). Cramér’s V for the trend study of degree choices for
the entire span of the three sampled years is .149 with a statistical significance of p = .013 (see
Table 11). This indicates that the trend is highly probable to be real, not a sampling error,
because p < .05. However, since the Cramér’s V = .149, the effect size is between “small” and
“medium” in a table for Cramér’s V with 2 degrees of freedom, where .07 is small and .21 is
medium (Zaiontz, n.d., n.p.). That is, the year of publication is likely to predict a difference in
the doctoral degree choice in the sampled population, but the year of publication is not a very
strong indicator of that “group membership” (Warner, 2013, p. 1075).

88
Table 11
Symmetric Measures for Degree Types in All Years of the Study
Value
Approximate
Significance
Nominal by Nominal Phi .149 .013
Cramer's V .149 .013
N of Valid Cases 390
Results for Null Hypothesis Two
The relationship between the years of dissertation publication (independent variable) and
the methodology choice made by doctoral candidates (dependent variable) was analyzed at the
95% confidence level by crosstabulation. The years of dissertation publication were 2007, 2012,
and 2017. These were entered as interval data. The methodology choices, which were
categorical variables, were dummy-coded. Quantitative research methodology was coded “1.”
Qualitative methodology was coded “2.” Mixed-methods methodology was coded “3.”
The crosstabulation showed the frequency and percentages of the methodology choices in
the three years selected for the study (see Table 12).

89
Table 12
Crosstabulation for Methodology Choices in All Years of the Study
Method
Total 1 2 3
Year 2007 Count 57 44 29 130
Expected
Count
58.7 49.0 22.3 130.0
% within Year 43.8% 33.8% 22.3% 100.0%
2012 Count 60 43 27 130
Expected
Count
58.7 49.0 22.3 130.0
% within Year 46.2% 33.1% 20.8% 100.0%
2017 Count 59 60 11 130
Expected
Count
58.7 49.0 22.3 130.0
% within Year 45.4% 46.2% 8.5% 100.0%
Total Count 176 147 67 390
Expected
Count
176.0 147.0 67.0 390.0
% within Year 45.1% 37.7% 17.2% 100.0%
Notes. For Method, 1 = Quantitative methodology, 2 = Qualitative methodology,
3 = Mixed-methods methodology.
The results of the crosstabulation chi-square analysis that included all three selected years
(2007, 2012, and 2017) were statistically significant at the = .05 level: 2(4) = 12.510, p = .014
(see Table 13). According to Warner (2013), the critical value for the chi-square statistic with
four degrees of freedom at the 95% confidence level is 9.49. The p-value was .014, below the
= .05 level. Similar to the analysis of degree-type trends, the analysis of methodology trends
yielded Cramér’s V value of .127, p = .014 (see Table 14). This is an effect size between “small”
and “medium” (Zaiontz, n.d., n.d.). Again, a significant trend is indicated, this time in the
methodology choices (quantitative, qualitative, or mixed methods) made by doctoral candidates

90
whose dissertations were published during the years 2007, 2012, and 2017. Therefore, the
researcher rejected Null Hypothesis Two.
Table 13
Chi-Square Tests for Methodology Choices in All Years of the Study
Value df
Asymptotic
Significance
(2-sided)
Pearson Chi-Square 12.510a 4 .014
Likelihood Ratio 13.495 4 .009
Linear-by-Linear
Association
2.816 1 .093
N of Valid Cases 390
a. 0 cells (0.0%) have expected count less than 5. The
minimum expected count is 22.33.
Table 14
Symmetric Measures for Methodology Choices in All Years of the Study
Value
Approximate
Significance
Nominal by Nominal Phi .179 .014
Cramer's V .127 .014
N of Valid Cases 390
Follow-up tests were conducted upon the year-methodology crosstabulation. The
researcher had seen references in the literature review to a trend toward mixed-methods research
(Alasuutari, 2010; Archibald, 2016; Thaler, 2017), although no statistical evidence was offered
in those sources. However, the researcher noticed in the crosstabulation table (Table 10), a
decreasing percentage of dissertations being written with mixed-methods methodology in the
years of this study: 2007, 22.3%; 2012, 20.8%; 2017, 8.5%. Therefore, the researcher conducted
pairwise comparisons of the three years of study.

91
The variations seen among the three methodology scores between 2007 and 2012 yielded
a chi-square statistic of 2(2) = .160 with a significance of p = .923. The chi-square is below the
critical value of 5.99 (Warner, 2013) and the p-value is above the p < .05 level. These data
indicate no significant difference in methodology choices between the years 2007 and 2012 (see
Tables 15 and 16).
Table 15
Chi-square Tests for Pairwise Comparison of Methodology Types, 2007 and 2012
Value df
Asymptotic
Significance
(2-sided)
Pearson Chi-Square .160a 2 .923
Likelihood Ratio .160 2 .923
Linear-by-Linear
Association
.157 1 .692
N of Valid Cases 260
a. 0 cells (0.0%) have expected count less than 5. The
minimum expected count is 28.00.
Table 16
Symmetric Measures for Pairwise Comparison of Methodology Types, 2007 and 2012
Value
Approximate
Significance
Nominal by Nominal Phi .025 .923
Cramer's V .025 .923
N of Valid Cases 260
The pairwise comparison of dissertation methodologies for 2012 and 2017 presented a
different pattern from the pairwise comparison of 2007 and 2012. The chi-square statistic was
2(2) = 9.551, where 5.99 is the critical value (Warner, 2013). The p-value is .008. These
statistics suggest that a significant relationship exists between a dissertation from this sample

92
population having been written in 2012 or 2017 and the methodology that the writer chose (see
Tables 17 and 18).
Table 17
Chi-square Tests for Pairwise Comparison of Methodology Types, 2012 and 2017
Value df
Asymptotic
Significance
(2-sided)
Pearson Chi-Square 9.551a 2 .008
Likelihood Ratio 9.779 2 .008
Linear-by-Linear
Association
1.701 1 .192
N of Valid Cases 260
a. 0 cells (0.0%) have expected count less than 5. The
minimum expected count is 19.00.
Table 18
Symmetric Measures for Pairwise Comparison of Methodology Types, 2012 and 2017
Value
Approximate
Significance
Nominal by Nominal Phi .192 .008
Cramer's V .192 .008
N of Valid Cases 260
Summary
Chapter Four summarized the data collected, the procedures followed in data screening,
the descriptive statistics, and the testing of assumptions required for chi-square analysis. The
independent variables were the years of dissertation publication, and the dependent variables
were the choices made by Virginia education doctoral candidates in two areas: degree type
sought and methodology type employed. The SPSS analysis revealed that there are statistically
significant relationships between year of publication and both the degree choice and the

93
methodology choice. The researcher rejected both null hypotheses. Chapter Five will discuss
these statistical findings in context of the literature review and the population sampled. It will
also discuss the implications of these findings.

94
CHAPTER FIVE: CONCLUSIONS
Overview
Chapter Five will discuss the results of the statistical analysis and the implications of
those results considering related research and considering the population that was studied. In
addition, limitations of the study will be examined and recommendations for future research will
be presented.
Discussion
The purpose of this quantitative, archival, content analysis study of dissertations written
in the field of education was to provide a current view of trends in doctoral dissertations in the
state of Virginia on two variables: the type of degree being pursued, the Doctor of Education
Degree (EdD) or the Doctor of Philosophy Degree (PhD), and the kind of methodology being
used, quantitative, qualitative, or mixed methods. The independent variable is year of
dissertation publication (2007, 2012, or 2017). The year of dissertation publication is defined as
the year under which a dissertation was listed in ProQuest Dissertations and Theses Global
database (ProQuest), using the search filter “Publication date” (ProQuest, n.d., n.p.). The
dependent variable for the first research question was the choice of degree-type, EdD or PhD.
The Doctor of Education Degree is defined as the degree awarded in a program designed to
develop “scholar practitioners” (Boyce 2012, p. 24) who will focus on applying research to effect
change in society (Amrein-Beardsley et al., 2012; Boyce, 2012). The Doctor of Philosophy
Degree is defined as the degree awarded in a program designed to develop scholar researchers
who will focus on developing and assessing theory in particular fields of study (Amrein-
Beardsley et al., 2012; Boyce, 2012). The dependent variable for the second research question
was the methodology choice (quantitative, qualitative, or mixed-methods). Quantitative

95
methodology is defined as a research design that assumes that human interactions are manifested
by objectively observable phenomena and that these phenomena are relatively stable across a
range of social groups or times. It records data that can be expressed in numbers and analyzes
that data by statistics (Creswell, 2013). Qualitative methodology is defined as a research design
that is based on the belief that people develop their own unique ideas of reality, and that these
conceptions of reality vary among social groups and across the range of times. It employs
extensive observation of individuals or groups, or reviews artifacts, seeking to understand the
“lived experiences” (Creswell, 2013, p. 76) of an individual or group. It does not seek to provide
findings that are generalizable beyond the individual or group being studied (Creswell, 2013).
Mixed-methods methodology is defined as a research design that employs both quantitative and
qualitative techniques in the same study (Creswell, 2013). This combination is manifested in
new patterns distinct from both quantitative and qualitative research in their methods, their
research designs, and their ways of coding and processing data (Creswell, 2015).
Year of Publication and Degree Choice
Although the doctoral degree has existed since the European medieval era (Noble, 1994)
with changing significance (Noble, 1994; Park, 2005), the EdD and the PhD have coexisted in
context of university programs requiring the modern version of the dissertation only since the
1920s (Nelson & Coorough, 1994). That fact makes the seminal study of degree trends by
Nelson and Coorough (1994) a timely work. Sampling from doctoral degrees written anywhere
in the United States in the years from 1950 to 1990 at 10-year intervals, they showed no trend
(see Table 1). None of the literature reviewed for this study mentioned a trend difference
between the EdD and the PhD. However, the results of this research showed a statistically
significant trend, with the EdD becoming more represented in the time span from 2007 to 2017

96
(see Table 8 and Figure 1). The explanation for the divergence of this study from the research
literature may be in two other factors which the researcher noticed while analyzing the randomly
selected dissertations. First, an increasing number of selected dissertations were from one
university, here called University A. Second, all the doctoral degrees in the field of education at
University A were EdDs. There were no PhDs in education from University A. Yet, University
A was producing a growing percentage of the doctoral degrees in Virginia in the field of
education during the years of the study (see Figure 2). The Nelson and Coorough (1994) study
was national, but the population for this study was just the state of Virginia. The fact that the
sample population for this study was the state of Virginia in a time span when University A was
rapidly growing in the number of doctoral degrees granted may have skewed this study.
Figure 1
Doctoral Degrees Granted in the Virginia Sample Population by Year and Degree Type
Notes. PhD = Doctor of Philosophy Degree, EdD = Doctor of Education Degree.
2007 2012 2017
PhD 90 81 67
EdD 40 49 63
0
10
20
30
40
50
60
70
80
90
100
Num
ber
of
Dis
erat
ions
Year
Degree Sought
PhD EdD

97
Figure 2
Doctoral Degrees Granted in the Virginia Sample Population by Year and Degree-granting
Institution
Notes. All Other = all doctoral-degree granting institutions in this study other than University A;
Univ A = University A (pseudonym).
Year of Publication and Methodology Choice
Research literature commonly mentioned the rise of both qualitative research (Alasuutari,
2010; Canagaraja, 2016) and mixed-methods research (Alasuutari, 2010; Thaler, 2017) since the
1980s. The data of this study provided quantitative evidence for the rise of qualitative research
during the period from 2007 through 2017 in the field of education, as reflected by doctoral
dissertations written in the state of Virginia (see Figure 3).
2007 2012 2017
All other 118 101 86
Univ A 12 29 44
0
20
40
60
80
100
120
140
Num
ber
of
Dis
sert
atio
ns
Year of Publication
Degrees Granted in Virginia per Institution
All other Univ A

98
Figure 3
Dissertation Methodology in Virginia Sample Population by Year, All Institutions
Note. Quant = quantitative research, Qual = qualitative research, Mixed
Methd = mixed-methods research.
However, the downward trend in mixed-methods research in this study contradicted the
literature. The explanation may again be in the increasing numbers of dissertations being written
under the guidance of University A (see Figure 2). Dissertations that were written for education
degrees at University A and that were randomly sampled for this study rarely employed mixed-
methods methodology. The researcher categorized the methodologies employed in the
dissertations that were sampled from the three years of the study for University A as follows: 55
quantitative, 12 qualitative, and 3 mixed methods. The downward trend in mixed-methods
research found in this study may reflect the limitations of the sample, both in location and in
time, not a global trend.
2007 2012 2017
Quant 57 60 59
Qual 44 43 60
Mixed 29 27 11
0
10
20
30
40
50
60
70
Num
ber
of
Dis
sert
atio
ns
Year
Dissertation Methodology, All Virginia Institutions
Quant Qual Mixed

99
Limitations
This research must be understood in terms of the research setting, both time and place.
This study measures trends in the frequencies of degree and methodology choices in one
population, education doctoral candidates; in one state, Virginia; and in one period of time,
2007-2017. Beyond those qualifiers, threats to external validity must be recognized. External
validity is the degree to which the conclusions of research may be generalized from the sample
population to a broader population (Trochim, 2006). Although the statistical findings for the
described population in the state of Virginia in the given time frame contradicted the null
hypotheses, these findings should not be construed as reflecting national or international trends.
The degree to which they may predict trends in the prescribed population (education doctoral
candidates in the state of Virginia) beyond the stated time frame depends on the persistence of
the factors which have influenced this study. Those factors and the possibility of their
persistence have not been part of this study.
Another threat to the validity of the study is that one researcher made all the
categorization decisions. Most of these decisions were very clear. The degree type, EdD or
PhD, was always stated in the dissertation title. The methodology choice was usually clear.
Even if was stated in the title, it was crosschecked in the abstract. If these locations did not
clearly identify the method, it was further checked by evaluation of the methods section. Still,
the researcher could miss details. For instance, one study dealing with attitudes and perceptions
and having a strong quantitative element in the methods section, referred to the candidate having
made a “preliminary qualitative study” (Zhang, 2007, p. 68). However, close reading confirmed
that the preliminary study was not part of the current doctoral dissertation. That dissertation was
categorized as quantitative.

100
Construct validity is also a consideration. Construct validity reflects the degree of
relationship between the phenomenon being studied and the theoretical framework to which the
researcher relates that phenomenon (Trochim, 2006). This study was conducted with reference
to requisite decision modeling (Phillips, 1984; Clemen, 2001). Although the chi-square statistics
expressed degrees of correlation between years of dissertation publishing and the choices that
doctoral candidates made about degree and methodology types, no causation was intended.
Implications
Empirical Implications
The empirical implications of this research relate to the population that was sampled.
Considering the divergence from other research studying national and international trends, the
results should be taken as reflecting a reality in education doctoral programs in the state of
Virginia in the years 2007, 2012, and 2017. However, the data did reveal findings within this
population that were new to the research literature. Whatever causation may exist, the facts are
that more qualitative and fewer mixed-methods dissertations were written in the time of the
study. This study also showed a statistically significant rise in EdD Degrees in this population, a
factor not presented by other studies.
Theoretical Implications
Requisite decision modeling. Two theoretical implications derive from this research.
The first relates to requisite decision modeling, the theoretical framework in which this study is
positioned. This decision-making model was propounded by Phillips (1984) and advanced by
the work of Clemen and others (Clemen, 2001; Clemen, & Reilly, 2013; Clemen & Ulu, 2008).
It informs decision making by reducing the many factors that could influence a decision to a
short list of the indispensable (requisite) factors and then assigning to each factor a pair of

101
quantitative values representing the perceived benefit and the perceived cost (not necessarily
financial) of each factor being considered (Phillips, 1984). This study indicated that there were
statistically significant relationships between a historical setting—the years of dissertation
publication and factors happening in the state of Virginia—and the decisions that doctoral
candidates made. This study, therefore, pointed to the importance of place and time as parts of
requisite decision modeling. This study can also remind students and their mentors of another
key element of requisition decision modeling and of biblical decision making: the importance of
a “multitude of counselors” (Proverbs 15:22, KJV). A basic feature of requisite decision
modeling is the interaction, discussion, and even the intuitions of people called alongside to
formulate a decision. This team of people interact with each other and refine, influence, and
shape each other’s thoughts as the pertinent values which lead to a decision become clear
(Phillips, 1984). Decisions as significant as those pertaining to the pursuit of a doctoral degree
should be made in interaction with others. Specifically, if the speculation that the prominence of
one college shaped the trends revealed by this research is correct, then the benefits and costs
(again, more than monetary) should be carefully analyzed in concert with competent counselors.
Positivism and constructivism. The second set of theoretical implications relate to the
philosophical frameworks on which quantitative and qualitative research are based. Quantitative
research, based on positivism (Creswell, 2013), assumes that one reality exists and that it may be
objectively measured (Sale et al., 2002). Qualitative research, based on constructivism
(Creswell, 2013), does not directly contradict that, but it sometimes uses terms like multiple
realities to shift the emphasis to people’s varying perceptions of reality (Creswell, 2013;
Zamani-Gallaher et al., 2017). Quantitative research strives for objectivity (Creswell, 2013) and
qualitative research thrives on subjectivity (Creswell, 2013). Quantitative research is intended to

102
produce generalizable conclusions (Boyce, 2012), but qualitative research is not intended to do
that (Boyce, 2012; Creswell, 2013). All of these differences can be useful and can work toward
balanced views of important social realities; however, if researchers are not clear in stating their
frames of reference and if readers are not informed of the differences, research can be used
fallaciously or deceptively. Some proponents of subjectively based research argue that
objectivity in research is not only impossible (Walsham, 2015) but also undesirable (Boudana,
2011; Nordstrom & Happel-Parkins, 2016). Boudana (2011) relates this scorn for objectivity to
postmodernism, citing writers who have “disdain for the ideas of truth and objectivity altogether,
preferring instead the notion of multiple discourses and reflection in terms of a power struggle”
(p. 387). Considering the rise of subjectively based qualitative research and the growing use of
research in court battles (Lydgate, 2016) and legislation (Hochbein & Perry, 2013), which affect
social policies, the understanding of research methodologies is vital.
Practical Implications
There are also practical implications of this study. Those who advise doctoral candidates
can understand their students better by knowing that there are trends and understanding that
those trends reflect philosophical and historical realities. With these perspectives, advisors can
better guide candidates. Although there are trends, both degrees mentioned in this study (and
many degrees that were omitted by the defined population of the study) and all three forms of
research evaluated in this study (and others) are still current choices. Those who direct graduate
programs of colleges and universities can benefit from this study also. Although the PhD Degree
has greater social capital (Devos & Somerville, 2012; Stock & Siegfried, 2017; Walsham, 2015),
the EdD was significantly on the rise in this study. That should prompt consideration of what is
motivating candidates to choose the EdD in the state of Virginia. The rise of qualitative research

103
should prompt preparation of graduate faculties to serve that growing student population. The
battle for the concept of fairly studying and reporting objective reality calls for a focus in
colleges and universities on the philosophical backgrounds of the various research methods and
on their different strengths and weaknesses. Finally, the leadership of any institution that is not
producing doctoral graduates across the range of degree and methodology types should evaluate
whether any change is desirable and yet within the scope of the institution’s mission statement.
Recommendations for Future Research
The choices doctoral candidates make about types of doctoral degree and types of
research methodology both reflect the cultures in which those people live and shape those
cultures. Those choices reflect the cultures by revealing things that the candidates consider to be
valuable. Those choices affect the cultures by enabling those who earn doctoral degrees to
further their values in the societies in which they live (Golde, 2015). This current study
endeavored only to demonstrate whether trends existed within a defined population in the years
from 2007 to 2017. Further research could focus on the beliefs and values that shape the choices
that doctoral candidates make. These could be qualitative studies investigating how a group of
doctoral candidates made the decisions whether they would pursue a doctorate and what kind of
degree to seek. A study might also be quantitative in form. It could work from instruments
measuring personal values that relate to the degree choice or it could create and test instruments
for such measurement. These studies could be useful to those who counsel graduate students and
to those who design and direct programs of graduate study. Similarly, either quantitative or
qualitative studies could be done investigating the values and beliefs which direct people in their
choices of research methodology. Further understanding of the process by which people make
this decision is potentially valuable.

104
Beyond how people make decisions, the results of those decisions are profound. First,
the results for individuals are important. Return on investment (ROI) has become an important
topic in higher education (Henager, 2017; Travaglianti, Babic, & Hansez, 2018). Which degree,
EdD or PhD, furthers what kinds of careers? How long does it take to earn back the amount of
money spent in gaining the doctoral degree? These are important questions for individuals who
pursue graduate degrees. The results of methodology decisions may impact not just the
individual doctoral candidate but also society. The two major research domains are associated
with very different worldviews. Quantitative research is rooted in positivism and has an
emphasis on objectivity (Creswell, 2013), and qualitative research is rooted in constructivism
and has an emphasis on subjective interpretation (Creswell, 2013). Both forms of research have
valuable roles to play, but those who create, report, and learn from research may be led to
erroneous conclusions if the different worldviews of positivism and constructivism are
overlooked (Warner, 2013; Lydgate, 2016). Further understanding of the relationship between
worldviews and research methodology is needed.
Summary
Chapter Five discussed the findings regarding the two research questions and the null
hypotheses. Both null hypotheses were rejected because data analysis showed statistically
significant trends in both doctoral degree decisions and research methodology decisions. These
findings were discussed with consideration of other research literature and in the context of the
population that was sampled. Limitations of the study were considered, including threats to
validity. Empirical, theoretical, and practical implications of the findings were discussed.
Finally, recommendations for further research were presented.

105
REFERENCES
Alasuutari, P. (2010). The rise and relevance of qualitative research. International Journal of
Social Research Methodology, 13, 139–155. doi:10.1080/13645570902966056
Alinsky, S. D. (1971). Rules for radicals: A pragmatic primer for realistic radicals. New York,
NY: Random House.
Allen, E. J., & Weber, R. K. (2016). Doctoral dissertation topics in education: Do they align with
critical issues? International Journal of Doctoral Studies, 11, 403-417. doi:
10.28945/3609
Amrein-Beardsley, A., Zambo, D., Moore, D. W., Buss, R. R., Perry, N. J., Painter, S. R.,
Carlson, D. L., Foulger, T. S., Olson, K., & Puckett, K. S. (2012). Graduates respond to
an innovative educational doctorate program. Journal of Research on Leadership
Education, 7, 98–122. doi:10.1177/1942775112440630
Anderson-Levitt, K. M. (2008). Globalization and curriculum. In F. M. Connelly, M. F. He, & J.
Phillion (Eds.), The Sage handbook of curriculum and instruction (pp. 349-368).
Thousand Oaks, CA: Sage.
Archibald, M. M. (2016). Investigator triangulation. Journal of Mixed Methods Research, 10,
228–250. doi: 10.1177/1558689815570092
Baird, A. S. (2007). Education and empowerment: Establishment of a vocational training
program in Nativity Village, Haiti (Doctoral dissertation). Available from ProQuest
Dissertations & Theses Global database. (UMI No. 3292117).
Boudana, S. (2011). A definition of journalistic objectivity as a performance. Media, Culture &
Society, 33, 385–398. doi: 10.1177/0163443710394899

106
Boyce, B. A. (2012). Redefining the EdD: Seeking a separate identity. Quest, 64, 24–33. doi:
10.1080/00336297.2012.653260
Buss, R. R., Zambo, R., Zambo, D., Perry, J. A., & Williams, T. R. (2017). Faculty members’
responses to implementing re-envisioned EdD programs. Studies in Higher Education, 42,
1624-1640. doi: 10.1080/03075079.2015.1113951
Canagarajah, S. (2016). TESOL as a professional community: A half century of pedagogy,
research, and theory. TESOL Quarterly, 50, 7-41. doi:10.1002/tesq.275
Clarke, M. (2015). “Knowledge is power”? A Lacanian entanglement with political ideology in
education. Critical Studies in Education, 56, 71–85.
doi.org: 10.1080/17508487.2015.977315
Clemen, R. T. & Reilly, T. (2013). Making hard decisions with decision tools [Google Scholar
digital version]. Retrieved from https://books.google.com
Clemen, R. T., & Ulu, C. (2008). Interior additivity and subjective probability assessment of
continuous variables. Management Science, 54, 835–851. doi.: 10.1287/mnsc.1070.0790
Creswell, J. W. (2013). Qualitative inquiry & research design: Choosing among five
approaches. Thousand Oaks, CA: Sage.
Creswell, J. W. (2015). Educational research: Planning, conducting, and evaluating quantitative
and qualitative research (5th ed.). Boston, MA: Pearson.
Conner, L. N. (2014). Student use of evaluative constructivism: Comparative degrees of
intentional learning. International Journal of Qualitative Studies in Education, 27, 472–
489. doi: 10.1080/09518398.2013.771228
107
Devos, A., & Somerville, M. (2012). What constitutes doctoral knowledge? Australian
Universities’ Review (AUR) Special Issue: Contemporary Issues in Doctoral Education,
54(1), 47–54. Retrieved from www.aur.org.au
Einstein, A. (1936). Physics and reality. Journal of the Franklin Institute, 221, 349–382.
doi :10.1016/S0016-0032(36)91047-5
Empiricism. (n.d.). In Blackburn, S. (Ed.), The Oxford dictionary of philosophy (3rd ed.).
doi: 10.1093/acref/9780198735304.001.0001
Frisch, D., & Clemen, R. T. (1994). Beyond expected utility: Rethinking behavioral decision
research. Psychological Bulletin, 116, 46–54. doi: 10.1037/0033-2909.116.1.46
Funge, S. P., Sullivan, D. J., & Tarter, K. (2017). Promoting positive family interactions:
Evaluating a free early childhood book distribution program. Early Childhood Education
Journal, 45, 603. doi:10.1007/s10643-016-0815-9
Gall, M. D., Gall, J. P., & Borg, W. R. (2007). Educational research: An introduction. Boston,
MA: Pearson.
Geuna, A. (1998). The internationalisation of European universities: A return to Medieval roots.
Minerva, 36, 253–270. doi: 10.1023/a:1004391922122
Golde, C. (2015). The formation of scholars: Insights of the Carnegie Initiative on the
Doctorate. GeoJournal, 80, 209–213. doi: 10.1007/s10708-014-9575-5
Green, S. B., & Salkind, N. J. (2014). Using SPSS for Windows and Macintosh: Analyzing and
understanding data (7th ed.). Boston, MA: Pearson.
Haenfler, R. (2004). Rethinking subcultural resistance: Core values of the Straight Edge
movement. Journal of Contemporary Ethnography, 33, 406-436.
doi:10.1177/0891241603259809

108
Hashemi, M. R., & Babaii, E. (2013). Mixed methods research: Toward new research designs in
applied linguistics. The Modern Language Journal, 97, 828–852. doi: 10.1111/j.1540-
4781.2013.12049.x
Henager, R. (2017). Heavy debt. Phi Kappa Phi Forum, 97(2), 15. Retrieved from
www.phikappaphi.org
Hochbein, C., & Perry, J. A. (2013). The role of research in the professional doctorate. Planning
& Changing, 44(3/4), 181–195. Retrieved from
https://education.illinoisstate.edu/planning/
Howard, L. Y. (2007) How exemplary teachers educate children of poverty, having low school
readiness skills, without referrals to special education (Doctoral dissertation). Available
from ProQuest Dissertations & Theses Global database. (UMI No. 3255795)
Huff, D. (1954, 1982). How to lie with statistics [Google Scholar digital version]. Retrieved
from https://books.google.com/books?isbn=0393070875
Kantorski, V. J., & Stegman, S. F. (2006). A content analysis of qualitative research dissertations
in music education, 1998-2002. Bulletin of the Council for Research in Music Education,
168, 63–74. doi: 10.2307/40319461
Liberty University (n.d.). ProQuest Dissertations and Theses Global (Database description).
Retrieved from http://www.liberty.edu/library/databases/?l=P
Lucas, M. (2007). What adapted physical education teachers should know about Islam (Doctoral
dissertation). Available from ProQuest Dissertations and Theses Global database. (UMI
No. 3282473).

109
Lydgate, E. (2016). Sorting out mixed messages under the WTO national treatment principle: A
proposed approach. World Trade Review, 15, 423-450.
doi: 10.1017/S1474745615000531
Mantzoukas, S. (2005). The inclusion of bias in reflective and reflexive research. Journal of
Research in Nursing, 10, 279–295. doi: 10.1177/174498710501000305
Maranto, R., & Ritter, G. (2014). Why KIPP is not corporate: KIPP and social justice. Journal of
School Choice, 8, 237–257. doi.org: 10.1080/15582159.2014.910052
Maxwell, T. (2003). From first to second generation professional doctorate. Studies in Higher
Education, 28, 279–291. doi: 10.1080/03075070309292
Milacci, F., & Kuhne, G. (2014). Right-sizing your research topic. In A. J. Rockinson & L. S.
Spaulding (Eds.), Navigating the Doctoral Journey (pp. 149-154). Lanahm, MD:
Rowman & Littlefield.
Moore, R. (2013). Everything else is drag: Linguistic drag and gender parody on RuPal’s Drag
Race. Journal of Research in Gender Studies, 3(2), 15-26. Retrieved from
https://addletonacademicpublishers.com/journal-of-research-in-gender-studies
Nelson, J. K. and Coorough, C. (1994). Content analysis of the PhD versus EdD dissertation. The
Journal of Experimental Education, 62(2), 158-168. Retrieved from
http://www.aee.org/jee
Neuendorf, K. A. (2017). The content analysis guidebook. Thousand Oaks, CA: Sage.
Noble, K. A. (1994). Changing doctoral degrees: An international perspective. Abstract
retrieved from ERIC database. (ED370486)
Nordstrom, S. N., & Happel-Parkins, A. (2016). Methodological drag. Qualitative Inquiry, 22,
149–153. doi: 10.1177/1077800415620221

110
Park, C. (2005). New variant PhD: The changing nature of the doctorate in the UK. Journal of
Higher Education Policy and Management, 27, 189–207.
doi: 10.1080/13600800500120068
Perry, J. A. (2014). Changing schools of education through grassroots faculty-led change.
Innovative Higher Education, 39, 155–168. doi: 10.1007/s10755-013-9267-y
Perry, J. A. (2015). The Carnegie Project on the education doctorate. Change: The Magazine of
Higher Learning, 47, 56–61. doi:10.1080/00091383.2015.1040712
Petty, W. (1690). Political arithmetick, or a discourse concerning the extent and value of lands,
people [and] buildings. Retrieved from
https://books.google.com/books?id=p9wzAQAAMAAJ
Phillips, L. D. (1984). A theory of requisite decision models. Acta Psychologica, 56, 29–48. doi:
10.1016/0001-6918(84)90005-2
ProQuest. (n.d.) ProQuest Dissertations & Theses Global (Database description). Retrieved
from https://search-proquest-com.ezproxy.liberty.edu/pqdtglobal?accountid=12085
Random.org. (n.d.). Random integer set generator. Retrieved from
https://www.random.org/integer-sets/
Sale, J. E. M., Lohfeld, L. H., & Brazil, K. (2002). Revisiting the quantitative-qualitative debate:
Implications for mixed-methods research. Quality and Quantity, 36, 43–53.
doi:10.1023/A:1014301607592
Schaeffer, F. A. (1972). He is there and He is not silent. Wheaton, IL: Tyndale.
Schaeffer, F. A. (1976, 2005). How should we then live: The rise and decline of western thought
and culture. Wheaton, IL: Good News.

111
Shulman, L. S., Golde, C. M., Bueschel, A. C., & Garabedian, J. (2006). Reclaiming education’s
doctorates: A critique and a proposal. Educational Researcher, 35, 25-32.
doi: 10.3102/0013189X035003025
Simmons, J. P., Nelson, L. D., & Simonsohn, U. (2011). False-positive psychology: Undisclosed
flexibility in data collection and analysis allows presenting anything as significant.
Psychological Science, 22, 1359-1366. doi:10.1177/0956797611417632
Sparks, D. M. (2017). Navigating STEM-worlds: Applying a lens of intersectionality to the
career identity development of underrepresented female students of color. Journal for
Multicultural Education, 11(3), 162. Retrieved from http://ijme-
journal.org/index.php/ijme
Stock, W., & Siegfried, J. (2013). One essay on dissertation formats in economics. The American
Economic Review, 103(3), 648-653. Retrieved from https://www.aeaweb.org/journals/aer
Thaler, K. M. (2017). Mixed methods research in the study of political and social violence and
conflict. Journal of Mixed Methods Research, 11, 59–76. doi: 0.1177/1558689815585196
Travaglianti, F., Babic, A., & Hansez, I. (2018). Relationships between employment quality and
intention to quit: Focus on PhD candidates as traditional workers. Studies in Continuing
Education, 40, 115. doi:10.1080/0158037X.2017.1396448
Trochim, W. M. K. (2006). Web center for social research methods. Retrieved from
http://www.socialresearchmethods.net/kb/index.php
Tuerk, P. W. (2007). Estimating statewide achievement gap effects using hierarchical linear
models: Applications for no child left behind data (Doctoral dissertation). Available from
ProQuest Dissertations & Theses Global database. (UMI No. Order No. 3300271).
Vygotsky, L. S. (1978). Mind in society. Cambridge, MA: Harvard University Press.

112
Walker, D. W., & Haley-Mize, S. (2012). Content analysis of PhD and EdD dissertations in
special education. Teacher Education and Special Education: The Journal of the Teacher
Education Division of the Council for Exceptional Children, 35, 202–211.
doi: 10.1177/0888406411431168
Walsham, G. (2015). The emergence of interpretivism in IS research. Information Systems
Research, 6(4), 376–394. Retrieved from
http://onlinelibrary.wiley.com/journal/10.1111/(ISSN)1365-2575
Warner, R. M. (2013). Applied statistics: From bivariate through multivariate techniques.
Thousand Oaks, CA: Sage.
Weber, R. (2004). The rhetoric of positivism versus interpretivism: A personal view. MIS
Quarterly, 28(1), iii–xii. Retrieved from www.misq.org
Whitehead, A. N. (1953, 1967). Science and the modern world. New York, NY: Free Press.
Wilson, C. M., Cooper, P. M., Johnson, K. A., & Wright, M. J. (2014). In search of research
literacy: Toward development and validation of an EdD dissertation rubric. International
Journal of University Teaching and Faculty Development, 5(2), 89-98. Retrieved from
https://www.novapublishers.com
Yokoyama, K. (2016). Reflections on the field of higher education: Time, space and sub-fields.
European Journal of Education, 51, 550–563. doi: 10.1111/ejed.12197
Zaiontz, C. (n.d.). Effect for chi-square test [Index]. Retrieved from www.real-statistics.com/
Zamani-Gallaher, E. M., Turner, F., Brown-Tess, K., & Thrill, C. (2017). Autobiographical
counternarratives from the community college to the PhD. Community College Journal of
Research and Practice, 41(4–5), 326–328. doi: 10.1080/10668926.2016.1251359

113
Zeynep, A. (2014). “Via Media” vs. the Critical Path: Constructivism(s) and the case of EU
identity. All Azimuth, 3(2), 21–36. Retrieved from http://www.foreignpolicyandpeace.org
Zhang, S. (2007). Preservice and K–12 inservice teachers' perceptions of appropriateness of
teacher self-disclosure and its teaching effectiveness (Doctoral dissertation). Available
from ProQuest Dissertations and Theses database. (UMI No. 3272620)
Zilinskas, A. (2018). Review of Making hard decisions with decision tools. Interfaces 31(6),
127-129. Retrieved from https://www.informs.org

114
APPENDICES
Appendix A: IRB Approval

115
Appendix B: Variable Codes
Table 19
SPSS Variable Codes
Variable Code
Degree
PhD
EdD
1
2
Methodology
Quantitative
Qualitative
Mixed methods
1
2
3