exhibit a virginia quantitative measures · exhibit a - 1 exhibit a virginia quantitative measures...
TRANSCRIPT

Exhibit A - 1
Exhibit A Virginia Quantitative Measures
Quantitative Measures Categories 1. Population Health 2. Access to Health Services 3. Economic 4. Patient Safety/Quality 5. Patient Satisfaction 6. Other Cognizable Benefits
Category Scoring
1. POPULATION HEALTH CATEGORY
Commitment/Outcome Percentage Weight Population Health Priority Measures Achieved
50
Population Health Monitoring Measures Reported
50
Total 100
2. ACCESS TO HEALTH SERVICES CATEGORY
Commitment/Outcome Percentage Weight Essential Services Achieved Access to Health Services Monitoring Measures Reported
50
50
Total 100

Exhibit A - 2
3. ECONOMIC CATEGORY
[PASS/FAIL]
4. PATIENT SAFETY/QUALITY CATEGORY
Commitment/Outcome Percentage Weight Patient Safety/Quality Target Measures Achieved Patient Safety/Quality Monitoring Measures Reported
50
50
Total 100
5. PATIENT SATISFACTION CATEGORY
Commitment/Outcome Percentage Weight Patient Satisfaction Monitoring Measures Reported Patient Satisfaction Report documenting plan to address opportunities for improvement
50
50
Total 100
6. OTHER COGNIZABLE BENEFITS CATEGORY
Commitment/Outcome Percentage Weight Commitments Achieved 100
Total 100

Exhibit A - 3
GRADING; FINAL SCORE
1. Determine grade (Pass or Fail) for Economic Category.
2. If applicable, determine impact of a failing grade on the Economic Category on the weighing of benefits against disadvantages of the Cooperative Agreement.1
3. If the result of Item 2 indicates that benefits continue, then determine numerical grade for each Category (excluding the Economic Category):
Grade Results of Commissioner’s Evaluation (“Achievement Percentage”) 91-100 >90% Targets Achieved 80-90 80-<90% Targets Achieved 70-79 70-<80% Targets Achieved 60-69 60-<70% Targets Achieved 0-59 Less than 60% Targets Achieved
4. Multiply the applicable Achievement Percentage in 3 above for each Sub-Category by its
assigned weighting:
Category
Year l Percentage Weight
Population Health 20 Access to Care Patient Safety/Quality Patient Satisfaction
20 20 20
Other 20 Total 100
5. Add results of Item 4 for Final Score.
6. Application of Final Score to Determine that Benefits Continue to Outweigh the Disadvantages Attributable to a Reduction in Competition:
Final Score
Benefits Outweigh Disadvantages Attributable to Reduction in Competition?
(>60) Yes
(<60) No; Cooperative Agreement is revoked absent compelling circumstances, including without limitation additional Cooperative Agreement modifications proposed by the Commissioner
1 12VAC5-221-110.F of Virginia’s Rules and Regulations Governing Cooperative Agreements states: The commissioner shall issue a written decision and the basis for the decision on an annual basis as to whether the benefits of the cooperative agreement continue to outweigh the disadvantages attributable to a reduction in competition that have resulted from the cooperative agreement.

Exhibit A - 4
SCORING PROCESS FOR EACH CATEGORY
1. Population Health Category
Definitions
"Baseline" means the value of each individual measure available as of the year the Cooperative Agreement was granted.
“Population Health Priority Measures” means the list of 10 measures defined in Table 1 below, as further defined in Table 2.
“Population Health Monitoring Measures” means measures defined by the Commissioner for monitoring and reporting only.
“Year 1” means the period of time that begins with the first full Fiscal Year after the Commissioner approves the plans of the New Health System pursuant to Commitment 27.
Data reported in the Population Health Report, as deemed appropriate by the Commissioner, will be used to calculate the Quantitative Measures Score. The overall Population Health Category will be comprised of the Population Health Priority Measures and the Population Health Monitoring Measures calculated and weighted annually as follows:
Population Health Priority Measures
The Population Health Priority Measures are closely related to Virginia Plan for Well-Being goals and are the measures on which the New Health System will be evaluated to show improvement in population health outcomes. Each measure will be evaluated on a specific population which include either the entire population of the Geographic Service area or the patients served by the New Health System.
Table 1: Population Health Priority Measures 1. Youth Tobacco Use 2. Physically Active Children 3. Adult Obesity Counseling & Education 4. Vaccinations - HPV Females 5. Vaccinations - HPV Males 6. Vaccinations - Flu Vaccine, Older Adults 7. Teen Pregnancy Rate 8. Third Grade Reading Level 9. Children Receiving Dental Sealants 10. Infant Mortality

Exhibit A - 5
Scores for the Population Health Priority Measures will be calculated by the Commissioner on an annual basis according to the following schedule:
Commitment/Outcome Year 1 Percentage Weight
Investment - Population Health 25 Approved population Health Plan
35
Achievement of Process Measures 40 Identified in Population Health Plan
Total 100 Process / Investment Phase - Years 2 and 3
For year 2 in the Process / Investment Phase, the Population Health Category will be calculated as follows:
Commitment/Outcome Years 2 and 3 Percentage Weight
Investment - Population Health 25 Achievement of Process Measures Identified in Population Health Plan and augmentation of Population Health Plan Total
75
100
Progress / Improvement Phase - Years 4 through 10
For each year in the Progress / Improvement Phase, the Population Health Category will be calculated as follows:
Commitment/Outcome Years 4 through 10 Percentage Weight
Achievement of Process Measures
Identified in the Population Health Plan for new
25
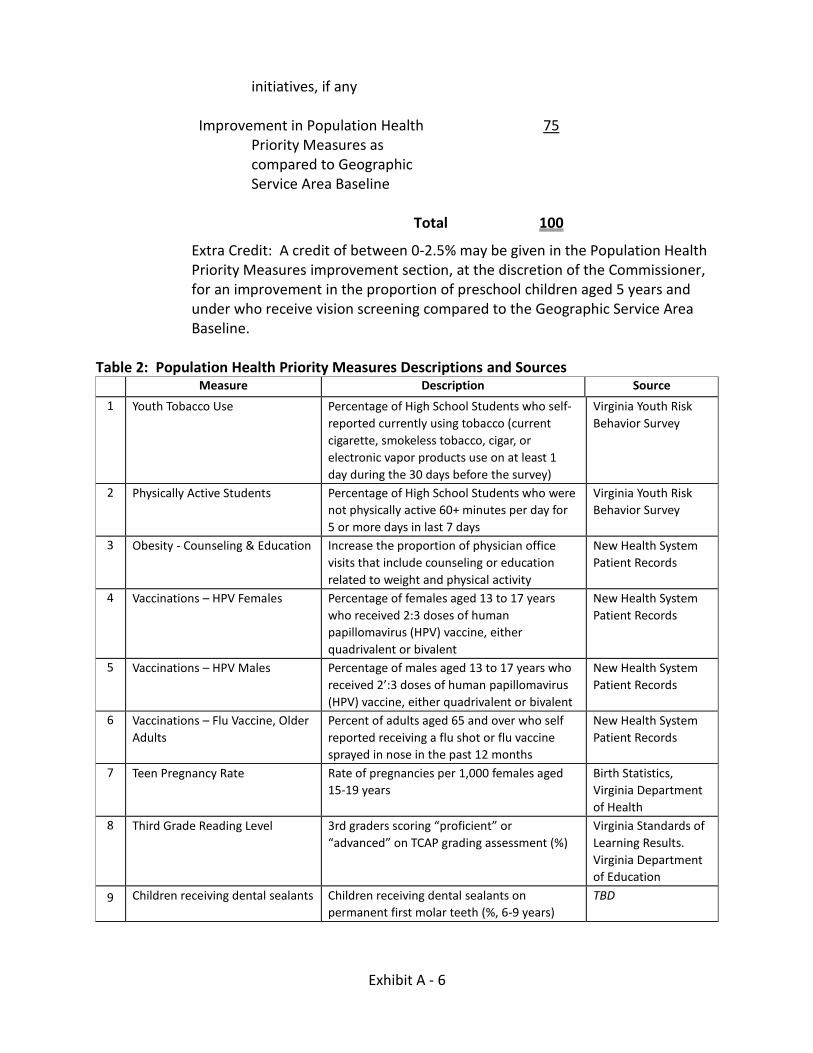
Exhibit A - 6
initiatives, if any Improvement in Population Health
Priority Measures as compared to Geographic Service Area Baseline
75
Total 100
Extra Credit: A credit of between 0-2.5% may be given in the Population Health Priority Measures improvement section, at the discretion of the Commissioner, for an improvement in the proportion of preschool children aged 5 years and under who receive vision screening compared to the Geographic Service Area Baseline.
Table 2: Population Health Priority Measures Descriptions and Sources Measure Description Source
1 Youth Tobacco Use Percentage of High School Students who self-
reported currently using tobacco (current
cigarette, smokeless tobacco, cigar, or
electronic vapor products use on at least 1
day during the 30 days before the survey)
Virginia Youth Risk
Behavior Survey
2 Physically Active Students Percentage of High School Students who were
not physically active 60+ minutes per day for
5 or more days in last 7 days
Virginia Youth Risk
Behavior Survey
3 Obesity - Counseling & Education Increase the proportion of physician office
visits that include counseling or education
related to weight and physical activity
New Health System
Patient Records
4 Vaccinations – HPV Females Percentage of females aged 13 to 17 years
who received 2:3 doses of human
papillomavirus (HPV) vaccine, either
quadrivalent or bivalent
New Health System
Patient Records
5 Vaccinations – HPV Males Percentage of males aged 13 to 17 years who
received 2’:3 doses of human papillomavirus
(HPV) vaccine, either quadrivalent or bivalent
New Health System
Patient Records
6 Vaccinations – Flu Vaccine, Older
Adults
Percent of adults aged 65 and over who self
reported receiving a flu shot or flu vaccine
sprayed in nose in the past 12 months
New Health System
Patient Records
7 Teen Pregnancy Rate Rate of pregnancies per 1,000 females aged
15-19 years
Birth Statistics,
Virginia Department
of Health
8 Third Grade Reading Level 3rd graders scoring “proficient” or
“advanced” on TCAP grading assessment (%)
Virginia Standards of
Learning Results.
Virginia Department
of Education
9 Children receiving dental sealants Children receiving dental sealants on
permanent first molar teeth (%, 6-9 years)
TBD

Exhibit A - 7
Measure Description Source
10 Infant Mortality Number of infant deaths (before age 1) per
l,000 live births
Birth Statistics,
Virginia Department
of Health
Population Health Monitoring Measures The Population Health Monitoring Measures will provide a broad overview of the population’s health. The goal of these measures is to continually monitor performance of the New Health System with regard to population health.
Population Health Monitoring Measures will be determined by the Commissioner and will reflect performance against identified Virginia’s Plan for Well-Being and the Southwest Virginia Health Authority goals not scored as Population Health Priority Measures.
Population Health Monitoring Measures will be reported for the specific populations specified for each measure. These will include either the entire population of the Virginia Geographic Service area, the patients served by the New Health System, or the patients served by the New Health Systems primary care physicians.

Exhibit A - 8
2. Access to Health Services Category
Essential Services Measures for New Health System
Essential Services Measures will be evaluated to ensure that the New Health System continues to provide access to health care services in the community. During the first Ten-Year Period, the New Health System will be required to maintain the following essential services in each specified county.
The Essential Services Measures are identified in Table 3. The counties in which the Essential Services must be maintained during the first Ten-Year Period and the weight to be applied for compliance are specified in Table 4.
Table 3: Essential Services Measures
Essential Service
1 Emergency room stabilization for patients
2 Emergent obstetrical care
3 Outpatient diagnostics needed to support emergency stabilization of patients
4 Rotating clinic or telemedicine access to specialty care consultants as needed in the
community and based on physician availability
5 Helicopter or high acuity transport to tertiary care centers
6 Mobile health services for preventive screenings, such as mammography,
cardiovascular and other screenings
7 Primary care services, including lab services
8 Physical therapy rehabilitation services
9 Care coordination service
10 Access to a behavioral health network of services through a coordinated system of
care
11
Community-based education, prevention and disease management services for
prioritized programs of emphasis based on goals established in collaboration with the
Commonwealth and the Authority
Table 4: Counties and Weights for Access Measures
County Weight
1 Wise County, Virginia 10%
2 Dickinson County, Virginia 10%
3 Washington, County, Virginia 10%
4 Russell County, Virginia 10%
5 Smyth County, Virginia 10%

Exhibit A - 9
Access to Health Services Monitoring Measures for New Health System
The Access Monitoring Measures provide a broad overview of access to care. The goal of these measures is to continually monitor performance of the New Health System with regard to access to services.
Access Monitoring Measures will be reported for the specific populations specified for each measure. These will include either the entire population of the Geographic Service area or the patients served by the New Health System. Access Monitoring Measures are identified below in Table 5.
Table 5: Access Monitoring Measures
1
Population within 15 miles
of an acute care hospital (%)
Population within 15 miles of any acute care hospital;
acute care hospital may be owned by the New Health
System or a competitor and may or may not be located in
the geographic service area
Virginia U.S. Census
Population Data
2010; Facility
Addresses
2
Population within 15 miles
of an emergency
department (%)
Population within 15 miles of any emergency room;
emergency rooms may be owned by the New Health
System or a competitor and may or may not be located in
the geographic service area
Virginia U.S. Census
Population Data
2010; Facility
Addresses
3
Personal Care Provider Percentage of adults who reported having one person
they think of as a personal doctor or health care provider
Virginia Behavioral
Risk Factor
Surveillance System
4 Preventable Hospitalizations
- Adults
Number of discharges for ambulatory care-sensitive
conditions per 1,000 adults aged 18 years and older
Virginia Health
Information
5
Screening - Colorectal
Cancer
Percentage of adults who meet U.S. Preventive Services
Task Force recommendations for colorectal cancer
screening
New Health System
Patient Records
6
Screening - Diabetes Percentage of diabetes screenings performed by the New
Health System for residents aged 40 to 70 who are
overweight or obese; Clinicians should offer or refer
patients with abnormal blood glucose to intensive
behavioral counseling interventions to promote a
healthful diet and physical activity.
New Health System
Patient Records
7 Screening – Hypertension Percentage of hypertension screenings performed by the
New Health System for residents aged 18 or older New Health System
Patient Records
8
Follow-Up After
Hospitalization for Mental
Illness
Percentage of adults and children aged 6 years and older
who are hospitalized for treatment of selected mental
health disorders and scheduled an outpatient visit, an
intensive outpatient encounter or a partial hospitalization
with a mental health practitioner within seven (7) days
post-discharge
New Health System
Patient Records
9
Antidepressant Medication
Management – Effective
Acute Phase Treatment
Percentage of adults aged 18 years and older with a
diagnosis of major depression, who were newly
treated with antidepressant medication and remained
on an antidepressant medication for at least 84 days
(12 weeks)
New Health System
Patient Records
Engagement of Alcohol or
Drug Treatment Adolescents and adults who initiated treatment and
who had two or more additional services with a
diagnosis of alcohol or other drug dependence within
30 days of the initiation visit.
New Health System
Patient Records

Exhibit A - 10
3. Economic Category
Pass/Fail Determination based on whether the New Health System has satisfied its rate cap commitments.

Exhibit A - 11
4. Patient Safety/Quality Category Target Patient Safety/Quality Measures for New Health System
The Target Patient Safety/Quality Measures identify areas in which the New Health System should show maintenance of or improvement in quality outcomes. The Clinical Council may suggest revisions to this list based on quality improvement priorities of the New Health System. Revisions may be made to this list of Target Quality Measures depending on baseline data, annual performance improvements, and other factors.
Target Quality Measures will be evaluated for the entire patient population and will not be restricted based on the patient’s payer status. Specifically, these measures will not be limited to the Medicare population.
For the first year of the Ten-Year Period, the New Health System will be required to maintain performance on the Target Quality Measures. For each subsequent year, the New Health System will be required to maintain or improve performance on Target Quality Measures.
Target Quality Measures
1. Pressure Rate 2. Iatrogenic Pneumothorax Rate 3. Central Venous Catheter-Related Blood Stream Infection Rate 4 Postoperative Hip Fracture Rate 5. PSI 09 Perioperative Hemorrhage or Hematoma Rate 6. PSI 10 Postoperative Physiologic and Metabolic Derangement Rate 7. PSI 11 Postoperative Respiratory Failure Rate 8. PSI 12 Perioperative Pulmonary Embolism or Deep Vein Thrombosis Rate 9 PSI 13 Postoperative Sepsis Rate · 10. PSI 14 Postoperative Wound Dehiscence Rate 11. PSI 15 Accidental Puncture or Laceration Rate 12. Central Line-Associated Bloodstream Infection (CLABSI) Rate 13. Catheter-Associated Urinary Tract Infection (CAUTI) Rate 14. Surgical Site Infection (SSI) Rate 15. Methicillin-Resistant Staphylococcus Aureus (MRSA) Rate 16. Clostridium Difficile Infection (CDI) Rate
Quality Monitoring Measures for New Health System The Quality Monitoring Measures provide a broad overview of system quality. The goal of these measures is to continually monitor performance of the New Health System with regard to quality.
For hospital quality performance, Quality Monitoring Measures will include CMS Hospital Compare measures. Hospital Compare measures that are identified as Target Quality Measures and measures of payment and value of care will be excluded from Quality Monitoring Measures. Quality Monitoring Measures will be evaluated for the entire patient population and will not be restricted based on the patient’s payer status. Specifically, these measures will not be limited to

Exhibit A - 12
the Medicare population. The New Health System will be evaluated on Quality Monitoring Measures for each applicable New Health System Entity.
Quality Monitoring Measures are identified in Table 6.
Table 6: Quality Monitoring Measures
Measure identifier Technical measure title Measure as posted on Hospital Compare
General information - Structural measures
1 SM-PART-NURSE Participation in a systematic database
for nursing sensitive care
Nursing Care Registry
2 Participation in a multispecialty
surgical registry
Multispecialty Surgical
Registry
3 ACS-REGISTRY Participation in general surgery
registry
General Surgery Registry
4 SM-PART-GEN-
SURG
The Ability for Providers with HIT to
Receive Laboratory Data Electronically
Directly into their ONC-Certified EHR
System as Discrete Searchable Data
Able to receive lab results
electronically
5 OP-12 Tracking Clinical Results between Visits Able to track patients’ lab
results, tests, and referrals
electronically between
visits
6 OP-17 Safe surgery checklist use (outpatient) Uses outpatient safe
surgery checklist
7 OP-25 Safe surgery checklist use (inpatient) Uses inpatient safe surgery
checklist
Timely & effective care-Cataract surgery outcome
8 OP-31 Improvement in Patient’s Visual
Function within 90 Days Following
Cataract Surgery
Percentage of patients
who had cataract
surgery and had
improvement in visual
function within 90 days
following the surgery
Timely & effective care-Colonoscopy follow-up
9 OP-29 Endoscopy/polyp surveillance:
appropriate follow-up interval for
normal colonoscopy in average risk
patients
Percentage of patients
receiving appropriate
recommendation for
follow-up screening
colonoscopy
10 OP-30 Endoscopy/polyp surveillance:
colonoscopy interval for patients
with a history of adenomatous
Percentage of patients
with history of polyps
receiving follow-up

Exhibit A - 13
polyps - avoidance of inappropriate
use
colonoscopy in the
appropriate timeframe
Timely & effective care-Heart attack
11 OP-3b Median time to transfer to another
facility for acute coronary intervention
Average (median) number
of minutes before
outpatients with chest pain
or possible heart attack
who needed specialized
care were transferred to
another hospital
12 OP-5 Median time to ECG Average (median) number
of minutes before
outpatients with chest pain
or possible heart attack got
an ECG
13 OP-2 Fibrinolytic therapy received within 30
minutes of emergency department
arrival
Outpatients with chest
pain or possible heart
attack who got drugs to
break up blood clots within
30 minutes of arrival
14 OP-4 Aspirin at arrival Outpatients with chest
pain or possible heart
attack who received aspirin
within 24 hours of arrival
or before transferring from
the emergency department
Timely & effective care-Emergency department (ED) throughput
15 EDV Emergency department volume Emergency department
volume
16 ED-lb Median time from emergency
department arrival to emergency
department departure for admitted
emergency department patients
Average (median) time
patients spent in the
emergency department,
before they were admitted
to the hospital as an
inpatient
17 ED-2b Admit decision time to emergency
department departure time for
admitted patient
Average (median) time
patients spent in the
emergency department,
after the doctor decided to
admit them as an inpatient
before leaving the
emergency department for
their inpatient room
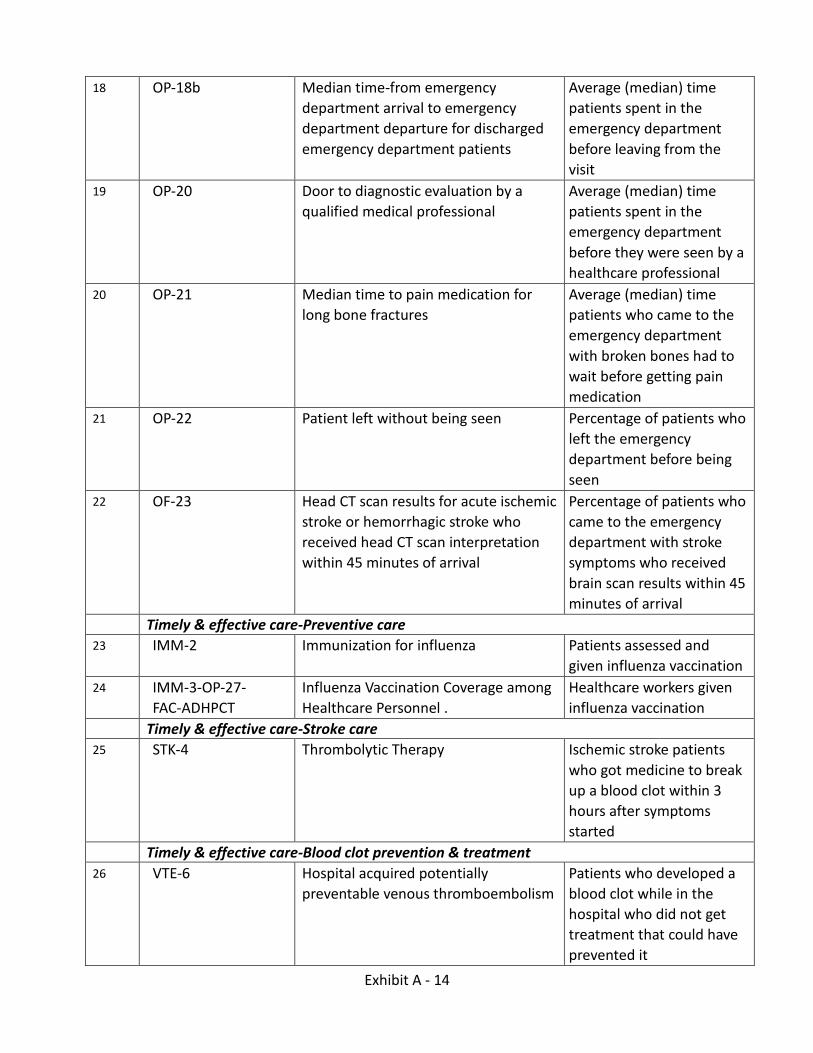
Exhibit A - 14
18 OP-18b Median time-from emergency
department arrival to emergency
department departure for discharged
emergency department patients
Average (median) time
patients spent in the
emergency department
before leaving from the
visit
19 OP-20 Door to diagnostic evaluation by a
qualified medical professional
Average (median) time
patients spent in the
emergency department
before they were seen by a
healthcare professional
20 OP-21 Median time to pain medication for
long bone fractures
Average (median) time
patients who came to the
emergency department
with broken bones had to
wait before getting pain
medication
21 OP-22 Patient left without being seen Percentage of patients who
left the emergency
department before being
seen
22 OF-23 Head CT scan results for acute ischemic
stroke or hemorrhagic stroke who
received head CT scan interpretation
within 45 minutes of arrival
Percentage of patients who
came to the emergency
department with stroke
symptoms who received
brain scan results within 45
minutes of arrival
Timely & effective care-Preventive care
23 IMM-2 Immunization for influenza Patients assessed and
given influenza vaccination
24 IMM-3-OP-27-
FAC-ADHPCT
Influenza Vaccination Coverage among
Healthcare Personnel .
Healthcare workers given
influenza vaccination
Timely & effective care-Stroke care
25 STK-4 Thrombolytic Therapy Ischemic stroke patients
who got medicine to break
up a blood clot within 3
hours after symptoms
started
Timely & effective care-Blood clot prevention & treatment
26 VTE-6 Hospital acquired potentially
preventable venous thromboembolism
Patients who developed a
blood clot while in the
hospital who did not get
treatment that could have
prevented it

Exhibit A - 15
27 VTE-5 Warfarin therapy discharge
instructions
Patients with blood clots
who were discharged on a
blood thinner medicine
and received written
instructions about that
medicine
Timely & effective care-Pregnancy & delivery care
28 PC-01 Elective delivery Percent of mothers whose
deliveries were scheduled
too early (1-2 weeks early),
when a scheduled delivery
was not medically
necessary
Complications-Surgical complications
29 COMP-RIP-KNEE Hospital level risk-standardized
complication rate (RSCR) following
elective primary total hip arthroplasty
(THA) and total knee arthroplasty
(TKA)
Rate of complications for
hip/knee replacement
patients
30 PSI-90-SAFETY Complication/patient safety for
selected indicators (composite)
Serious complications
31 PSI-4-SURG-
COMP
Death rate among surgical inpatients
with serious treatable complications
Deaths among patients
with serious treatable
complications after surgery
Complications-Healthcare-associated infections (HA)
Readmissions & deaths-30 day raid of readmission
32 READM-30-
COPD
Chronic obstructive pulmonary disease
(COPD) 30-day readmission rate
Rate of readmission for
chronic obstructive
pulmonary disease (COPD)
patients
33 READM-30- AMI Acute myocardial infarction (AMI) 30-
day readmission rate
Rate of readmission for
heart attack patients
34 READM-30-HF Heart failure (HF) 30-day readmission
rate
Rate of readmission for
heart failure patients
35 READM-30-PN Pneumonia (PN) 30-day readmission
rate
Rate of readmission for
pneumonia patients
36 READM-30- STK Stroke 30-day readmission rate Rate of readmission for
stroke patients
37 READM-30- CABG Coronary artery bypass graft (CABG)
surgery 30-day readmission rate
Rate of readmission for
coronary artery bypass
graft (CABG) surgery
patients
38 READM-30- HIP- 30-day readmission rate following Rate of readmission after
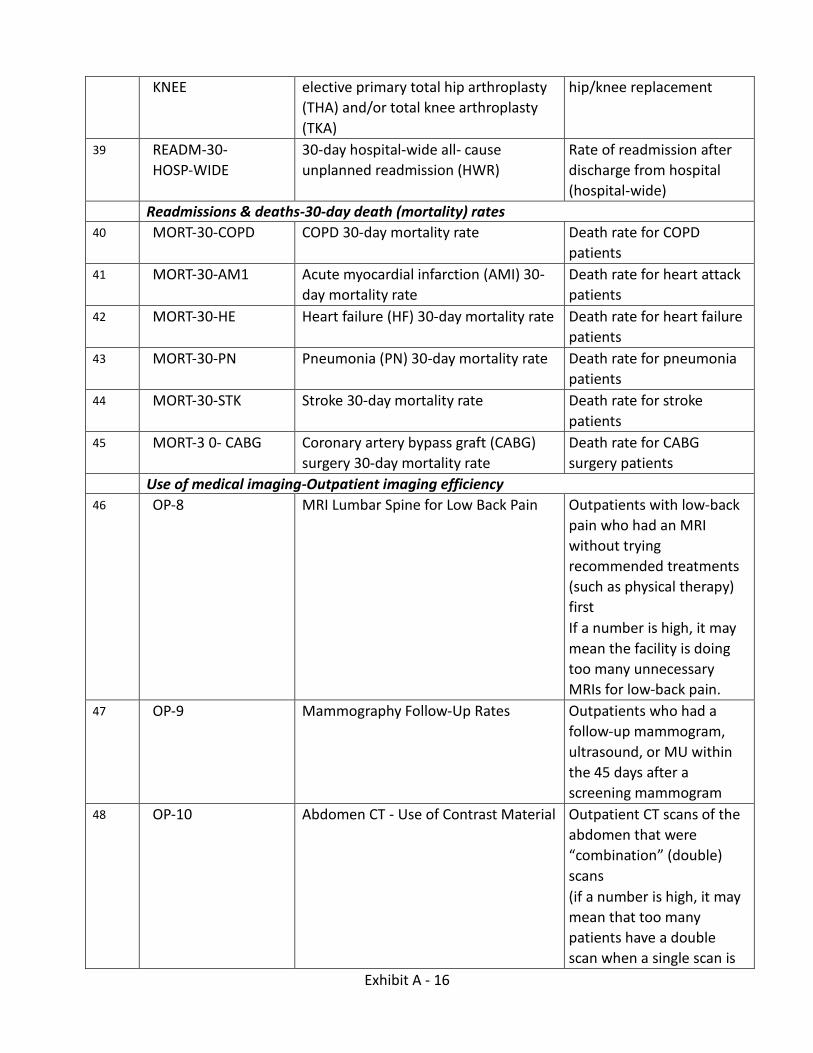
Exhibit A - 16
KNEE elective primary total hip arthroplasty
(THA) and/or total knee arthroplasty
(TKA)
hip/knee replacement
39 READM-30-
HOSP-WIDE
30-day hospital-wide all- cause
unplanned readmission (HWR)
Rate of readmission after
discharge from hospital
(hospital-wide)
Readmissions & deaths-30-day death (mortality) rates
40 MORT-30-COPD COPD 30-day mortality rate Death rate for COPD
patients
41 MORT-30-AM1 Acute myocardial infarction (AMI) 30-
day mortality rate
Death rate for heart attack
patients
42 MORT-30-HE Heart failure (HF) 30-day mortality rate Death rate for heart failure
patients
43 MORT-30-PN Pneumonia (PN) 30-day mortality rate Death rate for pneumonia
patients
44 MORT-30-STK Stroke 30-day mortality rate Death rate for stroke
patients
45 MORT-3 0- CABG Coronary artery bypass graft (CABG)
surgery 30-day mortality rate
Death rate for CABG
surgery patients
Use of medical imaging-Outpatient imaging efficiency
46 OP-8 MRI Lumbar Spine for Low Back Pain Outpatients with low-back
pain who had an MRI
without trying
recommended treatments
(such as physical therapy)
first
If a number is high, it may
mean the facility is doing
too many unnecessary
MRIs for low-back pain.
47 OP-9 Mammography Follow-Up Rates Outpatients who had a
follow-up mammogram,
ultrasound, or MU within
the 45 days after a
screening mammogram
48 OP-10 Abdomen CT - Use of Contrast Material Outpatient CT scans of the
abdomen that were
“combination” (double)
scans
(if a number is high, it may
mean that too many
patients have a double
scan when a single scan is

Exhibit A - 17
all they need).
49 OP-11 Thorax CT - Use of Contrast Material Outpatient CT scans of the
chest that were
“combination” (double)
scans
(if a number is high, it may
mean that too many
patients have a double
scan when a single scan is
all they need).
50 OP-13 Cardiac Imaging for Preoperative Risk
Assessment for Non-Cardiac Low-Risk
Surgery
Outpatients who got
cardiac imaging stress tests
before low-risk outpatient
surgery
(if a number is high, it may
mean that too many
cardiac scans were done
prior to low-risk surgeries).
51 OP-14 Simultaneous Use of Brain Computed
Tomography (CT) and Sinus CT
Outpatients with brain CT
scans who got a sinus CT
scan at the same time
(if a number is high, it may
mean that too many
patients have both a brain
and sinus scan, when a
single scan is all they need)

Exhibit A - 18
5. Patient Satisfaction Category
Patient Satisfaction Monitoring Measures for New Health System
The Patient Satisfaction Monitoring Measures provide a broad overview of patient satisfaction. The goal of these measures is to continually monitor performance of the New Health System with regard to patient satisfaction.
For patient satisfaction performance, the New Health System will use those metrics included in the Hospital Consumer Assessment of Healthcare Providers and Systems (HCAHPS) patient satisfaction survey required by CMS. The New Health System will be evaluated on Patient Satisfaction Monitoring Measures for each applicable New Health System Entity.
Patient Satisfaction Monitoring Measures are identified in Table 7.
Table 7: Patient Satisfaction Monitoring Measures
Survey of patient’s experiences Hospital Consumer Assessment of Healthcare Providers and Systems Survey (HCAHPS)
1 H-COMP-1-A-P Communication with nurses (composite
measure) Patients who reported that
their nurses “Always”
communicated well
2 H-COMP-1-U-P Communication with nurses (composite
measure)
Patients who reported that their
nurses “Usually” communicated
well
3 H-COMP-1-SN-P Communication with nurses (composite
measure)
Patients who reported that their
nurses “Sometimes” or “Never”
communicated well
4 H-COMP-2-A-P Communication with doctors (composite
measure)
Patients who reported that their
doctors “Always” communicated
well
5 H-COMP-2-U-P Communication with doctors (composite
measure) Patients who reported that
their doctors “Usually”
communicated well
6 H-COMP-2-SN-P Communication with doctors (composite
measure) Patients who reported that
their doctors “Sometimes” or
“Never” communicated well
7 H-COMP-3-A-P Responsiveness of hospital staff
(composite measure) Patients who reported that
they “Always” received help as
soon as they wanted
8 H-COMP-3-U-P Responsiveness of hospital staff
(composite measure) Patients who reported that
they “Usually” received help as
soon as they wanted
9 H-COMP-3- N-P Responsiveness of hospital staff
(composite measure) Patients who reported that
they “Sometimes” or “Never”
received help as soon as they
wanted
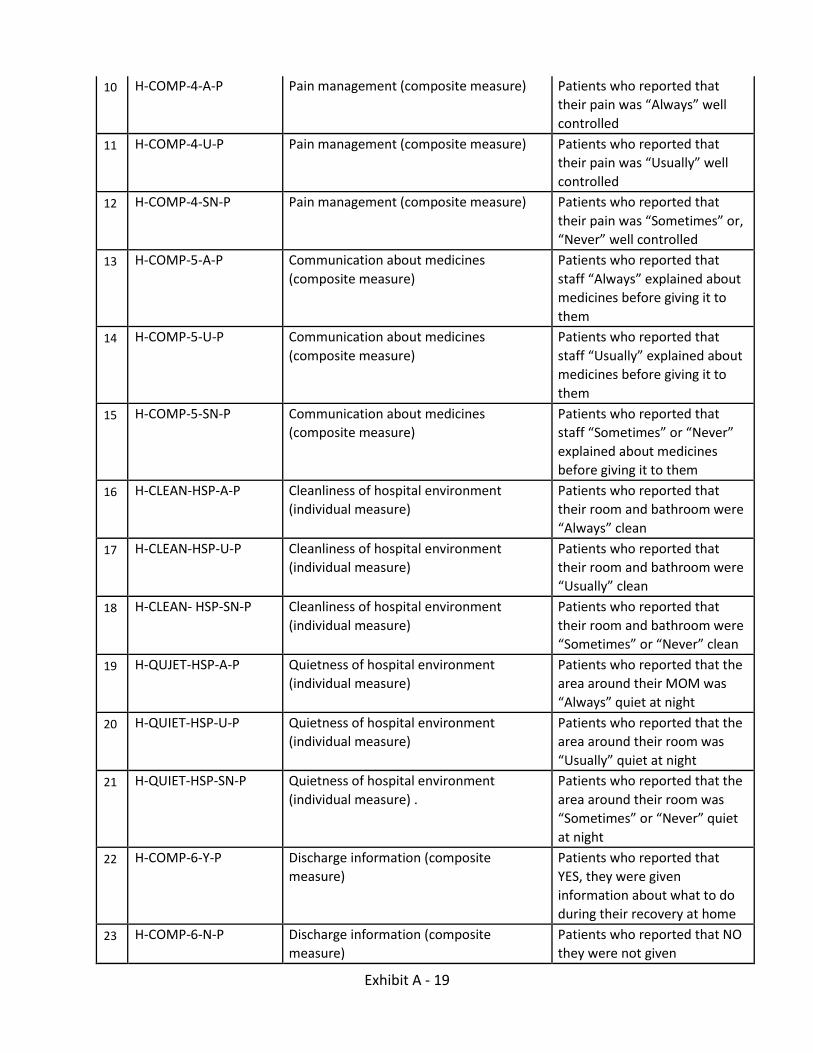
Exhibit A - 19
10 H-COMP-4-A-P Pain management (composite measure) Patients who reported that
their pain was “Always” well
controlled
11 H-COMP-4-U-P Pain management (composite measure) Patients who reported that
their pain was “Usually” well
controlled
12 H-COMP-4-SN-P Pain management (composite measure) Patients who reported that
their pain was “Sometimes” or,
“Never” well controlled
13 H-COMP-5-A-P Communication about medicines
(composite measure) Patients who reported that
staff “Always” explained about
medicines before giving it to
them
14 H-COMP-5-U-P Communication about medicines
(composite measure) Patients who reported that
staff “Usually” explained about
medicines before giving it to
them
15 H-COMP-5-SN-P Communication about medicines
(composite measure) Patients who reported that
staff “Sometimes” or “Never”
explained about medicines
before giving it to them
16 H-CLEAN-HSP-A-P Cleanliness of hospital environment
(individual measure) Patients who reported that
their room and bathroom were
“Always” clean
17 H-CLEAN-HSP-U-P Cleanliness of hospital environment
(individual measure) Patients who reported that
their room and bathroom were
“Usually” clean
18 H-CLEAN- HSP-SN-P Cleanliness of hospital environment
(individual measure) Patients who reported that
their room and bathroom were
“Sometimes” or “Never” clean
19 H-QUJET-HSP-A-P Quietness of hospital environment
(individual measure) Patients who reported that the
area around their MOM was
“Always” quiet at night
20 H-QUIET-HSP-U-P Quietness of hospital environment
(individual measure) Patients who reported that the
area around their room was
“Usually” quiet at night
21 H-QUIET-HSP-SN-P Quietness of hospital environment
(individual measure) . Patients who reported that the
area around their room was
“Sometimes” or “Never” quiet
at night
22 H-COMP-6-Y-P Discharge information (composite
measure) Patients who reported that
YES, they were given
information about what to do
during their recovery at home
23 H-COMP-6-N-P Discharge information (composite
measure) Patients who reported that NO
they were not given

Exhibit A - 20
information about what to do
during their recovery at home
24 H-COMP-7-SA Care Transition (composite measure) Patients who “Strongly Agree”
they understood their care
when they left the hospital
25 H-COMP-7-A Care Transition (composite measure) . Patients who “Agree” they
understood their care when
they left the hospital
26 H-COMP-7-D-SD Care Transition (composite measure) Patients who “Disagree” or
“Strongly Disagree” they
understood their care when
they left the hospital
27 H-HSP-RATING-9-10 Overall rating of hospital (global measure) Patients who gave their
hospital a rating of 9 or 10 on a
scale from 0 (lowest) to 10
(highest)
28 H-HSP-RATING-7-8 Overall rating of hospital (global measure) Patients who gave their
hospital a rating of 7 or 8 on a
scale from 0 (lowest) to 10
(highest)
29 H-HSP-RATING-0-6 Overall rating of hospital (global measure) Patients who gave their
hospital a rating of 6 or lower
on a scale from 0 (lowest) to 10
(highest)
30 H-RECMND-DY Willingness to recommend the hospital
(global measure) Patients who reported YES,
they would definitely
recommend the hospital
31 H-RECMND-PY Willingness to recommend the hospital
(global measure) Patients who reported YES,
they would probably
recommend the hospital
32 H-RECMND-DN Willingness to recommend the hospital
(global measure) Patients who reported NO,
they would probably not or
definitely not recommend the
hospital
Patient Satisfaction Report
The Report will document a satisfactory plan for the New Health System to address deficiencies and opportunities for improvement related to patient satisfaction with health care services and document satisfactory progress towards the plan.

Exhibit A - 21
6. Other Category New Health System Compliance with Cooperative Agreement Commitments
The New Health System shall receive credit under the Quantitative Measures for compliance with each of the commitments set forth in the Letter Authorizing a Cooperative Agreement.
The Cooperative Agreement commitments and each commitment’s weight are identified in Table 8.
Table 8: Cooperative Agreement Commitments
Commitment Weight
1.
2.
3.
4.
5.
6.
7.
NOTE: TABLE 8 TO BE FINALIZED ONCE COMMITMENTS ARE FULLY AGREED UPON. WE PROPOSE THAT EACH COMMITMENT BE GIVEN EQUAL WEIGHT FOR A TOTAL SCORE OF 100.