quantifying the effect of kerogen on electrical
TRANSCRIPT
QUANTIFYING THE EFFECT OF KEROGEN ON ELECTRICAL
RESISTIVITY MEASUREMENTS IN ORGANIC-RICH SOURCE ROCKS
A Thesis
by
NIKHIL REDDY KETHIREDDY
Submitted to the Office of Graduate and Professional Studies of Texas A&M University
in partial fulfillment of the requirements for the degree of
MASTER OF SCIENCE
Chair of Committee, Zoya Heidari Committee Members, Walter B. Ayers Yalchin Efendiev Head of Department, Dan Hill
December 2013
Major Subject: Petroleum Engineering
Copyright 2013 Nikhil Reddy Kethireddy
ii
ABSTRACT
Interpretation of electrical resistivity logs in organic-rich source rocks has been
challenging for petrophysicists. Conventional resistivity-porosity-saturation models
(e.g., Archie’s, Dual-Water, and Waxman-Smits equations) assume that saline water is
the only conductive part of the formation. However, this assumption is not reliable in
organic-rich source rocks in the presence of highly mature organic matter, clay, and
pyrite. Previous experimental studies indicate that aromaticity of kerogen increases with
an increase in thermal maturity, which might lead to conductive behavior of kerogen. In
this thesis, I investigated and quantified the effect of conductive kerogen on electrical
resistivity of organic-rich source rocks.
First, I investigated the reliability of conventional resistivity-porosity-saturation models
in the assessment of fluid saturations in organic-rich source rocks using well logs and
core measurements in the Haynesville shale-gas formation. Next, I numerically
simulated electric field, electric currents, and electrical resistivity of pore-scale images
of organic-rich source rocks. I quantified the effect of (a) volumetric concentration of
kerogen, (b) kerogen conductivity, and (c) spatial connectivity of kerogen-water network
on electrical resistivity of rocks using pore-scale numerical simulations.
Well-log interpretation of the Haynesville shale-gas formation showed conventional
resistivity-porosity-saturation models underestimate hydrocarbon saturation by 20% -
iii
40% in the zones with high volumetric concentration of kerogen. In this thesis, I showed
that the error in estimates of hydrocarbon saturation could be due to the impact of
kerogen on electrical resistivity measurements. Pore-scale numerical simulations
confirmed that conventional resistivity-porosity-saturation models could lead to 10% -
23% improvement in estimates of hydrocarbon saturation if the impact of conductive
kerogen is taken into account. Results of this thesis act as the first step towards
improving conventional resistivity-porosity-saturation models for estimation of fluid
saturations in organic-rich source rocks.

iv
DEDICATION
This thesis is dedicated to my parents for their unconditional love, endless support, and
encouragement.

v
ACKNOWLEDGEMENTS
This thesis would not have been possible without the help, support and patience of my
committee chair, Dr. Zoya Heidari, not to mention her advice and unsurpassed technical
knowledge. I also want to thank the other members of my committee, Dr. Walter B.
Ayers and Dr. Yalchin Efendiev as well as Dr. Michael C. Pope for their guidance and
their time reviewing my thesis.
The work reported in this thesis was funded by the Crisman Institute of Petroleum
Research at the Harold Vance Department of Petroleum Engineering and Texas A&M
Multi-Scale Formation Evaluation Joint Industry Research Program, jointly sponsored
by Anadarko, Baker Hughes, BG, BP, Chevron, ConocoPhillips, Devon Energy,
Drilinginfo, ENI, ExxonMobil, Halliburton, Hess, IHS, Marathon, M-I SWACO, NETL,
Nexen, Saudi Aramco, Schlumberger, Shell, SPE, TOTAL, and Woodside. My sincere
gratitude goes to Society of Petroleum Engineers (SPE) for supporting this project via
Junior Faculty Research Initiation Award. I thank the Texas A&M Supercomputing
Facility for providing computing resources used for the numerical simulations in this
thesis.
I would also like to thank my colleagues and friends in the Department of Petroleum
Engineering. Thanks go to Huangye Chen, Mehrnoosh Saneifar, Alvaro Aranibar, and
Lu Chi for their support throughout and in promoting a stimulating and welcoming

vi
academic environment. The most special thanks goes to my partner and friend, Poojitha
Valasareddy, for her love, kindness and support she has shown during the past two years.
Finally, I would like to thank my parents and sister for their encouragement and support.
Everything I am, I owe to them.

vii
NOMENCLATURE
a Archie’s factor, [ ]
Ck Volumetric concentration of kerogen, [%]
CPlagioclase Volumetric concentration of plagioclase, [%]
CQuartz Volumetric concentration of quartz, [%]
E Electric field, [V/m]
m Archie’s porosity exponent, [ ]
n Archie’s saturation exponent, [ ]
J Electric displacement field, [C/m2]
ReffK Resistivity of kerogen-gas system, [ohm-m]
Rk Resistivity of kerogen, [ohm-m]
Ro Vitrinite reflectance
Sg Total water saturation, [%]
Sw Total gas saturation, [%]
V Electric potential, [V]
Vg Volume of gas, [m3]
Vgk Total volume of gas-bearing kerogen, [m3]
Vk Volume of kerogen, [m3]
Vt Total volume of the domain, [m3]
Vw Volume of water, [m3]
WTOC Weight concentration of TOC, [%]
viii
Δt Compressional slowness, [µs/ft]
ϕk Kerogen porosity, [%]
ϕt Total porosity, [%]
ρgrain Core grain density
σ Electrical conductivity, [S/m]
2D Two-dimensional
3D Three-dimensional
CPU Central Processing Unit
ECS Elemental Capture Spectroscopy
FIB-SEM Focused Ion Beam-Scanning Electron Microscopy
FT-IR Fourier Transform-Infrared Spectroscopy
GR Gamma Ray
LOM Level Of Metamorphism
NMR Nuclear Magnetic Resonance
PDE Partial Differential Equation
PEF Photo Electric Factor
QMR Quasi-Minimal Residual
SEM Scanning Electron Microscopy
TOC Total Organic Carbon
XRD X-Ray Diffraction

ix
TABLE OF CONTENTS
Page
ABSTRACT ...................................................................................................................... ii
DEDICATION ................................................................................................................. iv
ACKNOWLEDGEMENTS .............................................................................................. v
NOMENCLATURE ........................................................................................................ vii
TABLE OF CONTENTS ................................................................................................. ix
LIST OF FIGURES .......................................................................................................... xi
LIST OF TABLES ......................................................................................................... xiv
CHAPTER I INTRODUCTION AND LITERATURE REVIEW ................................... 1
1.1 Background ........................................................................................................... 1 1.2 Statement of the problem ...................................................................................... 5 1.3 Research objectives ............................................................................................... 6 1.4 Outline of the thesis .............................................................................................. 6
CHAPTER II RELIABILITY OF CONVENTIONAL RESISTIVITY-POROSITY-
SATURATION MODELS ................................................................................................. 8
2.1 Introduction ........................................................................................................... 8 2.2 An introduction to geology of Haynesville formation .......................................... 9 2.3 Method ................................................................................................................ 10 2.4 Joint interpretation of well logs ........................................................................... 19
CHAPTER III METHOD ................................................................................................. 23

x
3.1 Introduction ......................................................................................................... 24 3.2 Finite difference method ..................................................................................... 25 3.3 The assumed petrophysical/compositional rock model ...................................... 34
CHAPTER IV PORE-SCALE NUMERICAL SIMULATIONS OF ELECTRICAL
RESISTIVITY IN ORGANIC-RICH SOURCE ROCKS ............................................... 37
4.1 Synthetic Case No. 1: Effect of kerogen conductivity and volumetric concentration of kerogen on electrical resistivity of organic-rich source rocks ......................................................................................................... 38 4.2 Synthetic Case No. 2: Impact of kerogen spatial distribution and connectivity of kerogen-water network on electrical resistivity of organic-rich source rocks .................................................................................... 42 4.3 Synthetic Case No. 3: Effective electrical resistivity of gas-saturated kerogen ................................................................................................................ 46 4.4 Synthetic Case No. 4: Organic-rich source rocks with gas-saturated kerogen ................................................................................................................ 48
CHAPTER V CONCLUSIONS ....................................................................................... 54
5.1 Summary ............................................................................................................. 54 5.2 Conclusions ......................................................................................................... 55 5.3 Recommendations ............................................................................................... 57
REFERENCES ................................................................................................................. 59

xi
LIST OF FIGURES
Page
Figure 1: Field Example: Conventional well logs in a well drilled in Haynesville shale-gas formation. Panels from left to right show depth, gamma ray, array induction resistivity, neutron porosity and bulk density, photoelectric factor, and compressional-wave slowness well logs. ................. 11
Figure 2: Assumed petrophysical/compositional rock model for organic-rich source rocks used for well-log interpretation. .................................................. 13
Figure 3: Correlation between volumetric concentration of plagioclase and quartz obtained from core measurements. ........................................................ 14
Figure 4: Correlation between weight concentration of TOC from core and inverse core grain density. ............................................................................................. 16
Figure 5: Overview of the ΔlogR method. Panels from left to right show compressional-wave slowness, array induction deep resistivity, and the separation between the two after defining the baseline. ................................... 18
Figure 6: Crossplot of volumetric concentration of kerogen and weight concentration of TOC from core measurements. .............................................. 19
Figure 7: Field Example: Comparison of the results obtained from well-log interpretation against core measurements for total porosity (ninth left-hand panel), total water saturation (tenth left-hand panel), volumetric concentrations of mineral constituents (seventh left-hand panel), and volumetric concentration of minerals obtained from core measurements (eighth left-hand panel). Panels from left to right show depth, gamma ray, array induction resistivity, neutron porosity and density, PEF, and compressional-wave slowness logs. .................................................. 21
Figure 8: Crossplot of relative error in estimates of water saturation and volumetric concentration of kerogen. ............................................................... 22
Figure 9: Seven-point finite difference stencil used for discretization of the Laplace conductivity equation in a 3D domain. ............................................... 26
Figure 10: (a) Sample 3D domain and (b) grid generated over a 2D section. Circles in green, red, and blue represent Dirichlet nodes, Neumann nodes, and ghost nodes, respectively. ................................................................................. 30

xii
Figure 11: Mesh generated over two subsequent 2D faces of the 6x6x6 3D domain. The nodes are referenced in a row, column, and face format. Circles in green and red represent Dirichlet nodes and Neumann nodes, respectively. ........................................................................................... 31
Figure 12: Seven-point finite difference stencil in 3D for a node referenced in row, column, and face matrix notation. ............................................................ 32
Figure 13: Assumed petrophysical/compositional rock model designed based on electrical properties of rock and fluid constituents adopted for pore-scale numerical simulations. ...................................................................................... 35
Figure 14: Synthetic Case No. 1: Two-dimensional pore-scale images of (a) dispersed and (b) layered spatial distributions of kerogen. Yellow, blue, and black areas represent grains, water, and kerogen, respectively. ....... 39
Figure 15: Synthetic Case No. 1 Comparison of the impact of kerogen conductivity on electrical resistivity of organic-rich source rocks. Blue and red lines show estimated effective rock electrical resistivity in the synthetic cases with dispersed and layered kerogen distributions, respectively. ...................... 40
Figure 16: Synthetic Case No. 1: Sensitivity analysis on the impact of volumetric concentration of kerogen on effective rock electrical resistivity of organic-rich source rock in (a) dispersed and (b) layered spatial distribution of kerogen. ..................................................................................... 41
Figure 17: Synthetic Case No. 2: Three-dimensional pore-scale image of organic-rich source rock. Yellow, blue, and black areas represent grains, water, and kerogen, respectively. ..................................................................... 43
Figure 18: Synthetic Case No. 2: Impact of kerogen conductivity on electrical resistivity of three-dimensional pore-scale image of organic-rich source rock. .................................................................................................................. 45
Figure 19: Synthetic Case No. 2: Three-dimensional pore-scale images of two organic-rich source rocks with (a) low connectivity and (b) high connectivity of kerogen-water network. Yellow, blue, and black areas in the 3D image represent grains, water, and kerogen, respectively. ............... 46
Figure 20: Synthetic Case No. 3: Correlation between the effective electrical resistivity of kerogen-gas system and gas-filled kerogen porosity. Blue, red, and green points show the effective electrical resistivity of kerogen-gas system when electrical resistivity of kerogen is assumed to be 1000 ohm-m, 500 ohm-m, and 100 ohm-m, respectively. ....................... 48

xiii
Figure 21: Synthetic Case No. 4: Impact of electrical resistivity of kerogen on relative error in estimates of water saturation if obtained using conventional resistivity-porosity-saturation models (i.e., Archie’s equation in this case). ....................................................................................... 50
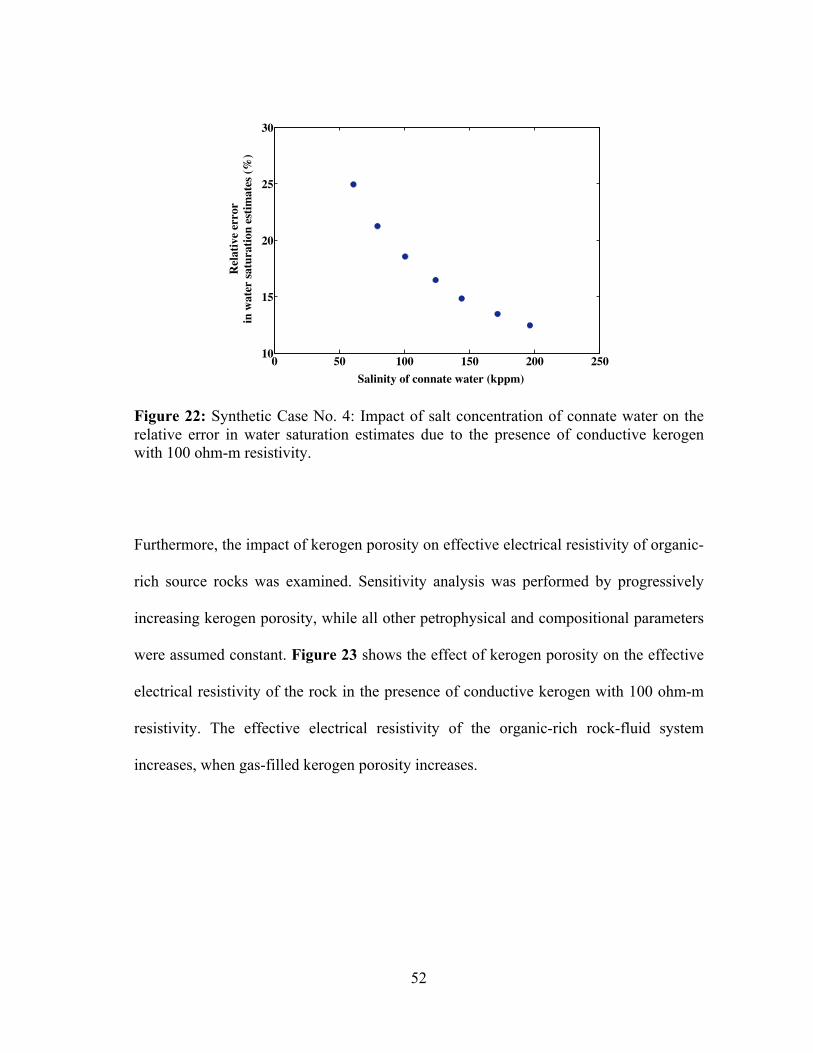
Figure 22: Synthetic Case No. 4: Impact of salt concentration of connate water on the relative error in water saturation estimates due to the presence of conductive kerogen with 100 ohm-m resistivity. ............................................. 52
Figure 23: Synthetic Case No. 4: Impact of kerogen porosity on effective electrical resistivity of organic-rich source rocks. ............................................................ 53
xiv
LIST OF TABLES
Page
Table 1: Synthetic Case No. 1: Summary of the petrophysical, electrical, and modeling parameters. ........................................................................................ 39
Table 2: Synthetic Case No. 2: Summary of the assumed petrophysical, electrical, and modeling parameters. ................................................................................. 44
Table 3: Synthetic Case No. 4: Summary of the assumed petrophysical, electrical, and modeling parameters. ................................................................................. 51

1
CHAPTER I
INTRODUCTION AND LITERATURE REVIEW
This thesis quantifies the impact of volumetric concentration of kerogen, electrical
resistivity of kerogen, kerogen porosity, salt concentration of connate water, and
connectivity of kerogen-water network on electrical resistivity measurements in organic-
rich source rocks. First, this thesis investigates the reliability of conventional resistivity-
porosity-saturation models in the assessment of fluid saturations in organic-rich source
rocks using well logs and core measurements from the Haynesville shale-gas formation.
Second, a numerical modeling method is introduced for simulating electric field
potential, electric currents, and electrical resistivity of pore-scale rock images in organic-
rich source rocks. Finally, pore-scale numerical simulations are used to quantify the
effect of (a) volumetric concentration of kerogen, (b) kerogen conductivity, and (c)
connectivity of kerogen-water network on electrical resistivity of organic-rich source
rocks.
1.1 Background
Petrophysical and compositional evaluation of organic-rich source rocks remains a major
technical challenge for the petroleum industry, because of complex pore structure and
lithology as well as the lack of protocols for core measurements in these unconventional
reservoirs (Ramirez et al., 2011). Conventional well-log interpretation techniques are
2
usually calibrated using core data and applied to unconventional reservoirs. Recent
studies (Passey et al., 2010; Sondergeld et al., 2010) describe significant variability in
commercial core measurements for petrophysical and compositional properties such as
porosity, water saturation and mineral concentrations. The deficiencies with the
calibration approach as well as the complex rock physics in these reservoirs result in
huge uncertainty in well-log-based petrophysical and compositional evaluation of
organic-rich source rocks.
New techniques were developed using non-linear inversion methods for joint
interpretation of well logs to estimate porosity, TOC (Total Organic Carbon),
hydrocarbon saturation, and volumetric concentrations of mineral constituents in the
presence of complex mineralogy and thin beds in organic-rich source rocks (Heidari et
al., 2012; Heidari et al., 2011). These techniques minimize the calibration effort against
core measurements. However, the complex rock physics of organic-rich source rock was
missing in many previously introduced well-log interpretation techniques. For instance,
assessment of fluid saturations using electrical resistivity logs in conventional reservoirs
is traditionally based on resistivity-porosity-saturation models such as Archie’s, Dual-
Water and Waxman-Smits equations. Conventional resistivity-porosity-saturation
models are still commonly used for assessment of fluid saturations using electrical
resistivity logs in organic-rich source rocks. All resistivity-porosity-saturation models
assume that electrical conductivity in rock fluid systems is only affected by saline water
and the presence of clay.

3
In the case of organic-rich source rocks, however, electrical resistivity of the formation
can be affected by conductive mineral such as pyrite and highly mature conductive
kerogen in addition to clay minerals and saline water. Therefore, a reliable model for
estimating fluid saturations should take into account the effect of all the conductive
components in the formation, including kerogen. In highly mature shale-gas reservoirs,
the overall electrical resistivity can be 1-2 orders of magnitude less than the measured
electrical resistivity in the same formation at relatively lower thermal maturities (Passey
et al., 2010). While the organic matter might not be recrystallizing to mineral graphite
(which is electrically conductive), there could be intermediary compounds forming.
These compounds could have a significant impact on the electrical conductivity in
addition to formation water, clay, and pyrite (Passey et al., 2010). The impact of kerogen
on electrical resistivity of organic-rich source rocks has not been quantified, yet.
The structural complexity and heterogeneity of kerogen is a hurdle for geochemists
aiming to characterize the structural changes in kerogen during thermal maturation.
Various analytical methods such as thermal analysis, elemental analysis, degradation
methods, fourier transform-infrared spectroscopy (FT-IR), and solid-state nuclear
magnetic resonance (NMR) spectroscopy were employed to elucidate some aspects of
the structure of kerogen. Among the various methods applied to characterize kerogen,
the recently developed advanced solid-state NMR spectroscopy techniques provide
much deeper insights into the structures of kerogen (Mao et al., 2010). The increase of
aromaticity of kerogen with increasing maturity was well established by numerous NMR
4
studies (Barwise et al., 1984; Dennis et al., 1982; Miknis et al., 1982, Miknis et al.,
1993; Patience et al., 1992; Requejo et al., 1992; Smernik et al., 2006; Solli et al., 1984;
Wei et al., 2005; Werner-Zwanziger et al., 2005; Witte et al., 1988). Advanced solid-
state NMR studies to characterize the kerogen structure have also provided a correlation
between thermal maturity and aromaticity (Mao et al., 2010). The vast delocalization of
electrons associated with increasing aromaticity helps in conducting electric current
leading to conductive behavior of kerogen. This is also the reason for the electrically
conductive nature of graphite that is formed due to recrystallization of carbon in the
organic matter. Analytical models (Li et al., 2007) describe the dependence of electrical
conductivity of organic semi-conductors on temperature and external electric field. Li et
al. (2007) reported electrical resistivity of 1 ohm-m at 170 °F for organic semi-
conductors. Electrical conductivity measurements (Rajeshwar et al., 1980) carried out on
oil shale samples from the Green River oil shales illustrate the correlation between
electrical behavior of organic matter and temperature. Researchers (Meng et al., 2012;
Rajeshwar et al., 1980) observed a pronounced effect of thermal maturity of organic
matter and temperature on magnitude of measured electrical conductivity of the oil shale
samples. The changes in kerogen network and structure, with increasing temperature and
maturity, is expected to enhance the electrical conductivity of organic-rich source rock
(Meng et al., 2012; Rajeshwar et al., 1980). There is, however, a need for fundamental
research to understand the exact mechanism of conduction in such aromatic compounds.
5
1.2 Statement of the problem
In conventional interpretation techniques, quantitative assessment of hydrocarbon
saturations is based on interpreting electrical resistivity logs using conventional
resistivity-porosity-saturation models such as Archie’s, Dual-Water, and Waxman-Smits
equations. However, in organic-rich source rocks, electrical resistivity measurements are
affected by presence of highly mature organic matter, pyrite, clays, and complex pore
structure in addition to saline connate water.
Characterizing the impact of these factors while interpreting electrical resistivity logs is
a major technical challenge. The abundance of highly mature kerogen and conductive
minerals such as pyrite in organic-rich source rocks could have a significant impact on
electrical resistivity measurements. First, this thesis tries to investigate the possibility of
measurable kerogen impact on borehole electrical resistivity measurements.
Another aspect of this thesis focuses on quantifying the impact of various petrophysical
and compositional properties of organic-rich source rocks on electrical resistivity and
estimates of fluid saturation using pore-scale numerical simulations. This thesis attempts
to quantify the effect of volumetric concentration of kerogen, electrical conductivity of
kerogen, salt concentration of connate water, kerogen porosity, and spatial connectivity
of kerogen-water network on electrical resistivity measurements and estimates of fluid
6
saturation in organic-rich source rocks. The following section summarizes the goals of
the thesis.
1.3 Research objectives
The objectives of this research are as follows:
i. To investigate the reliability of conventional resistivity-porosity-saturation
models in assessment of fluid saturations in organic-rich source rocks.
ii. To investigate the possibility of a measurable kerogen impact on electrical
resistivity measurements in organic-rich source rocks.
iii. To develop a pore-scale numerical simulation package to model effective
electrical resistivity of rock using finite difference methods.
iv. To quantify the impact of various petrophysical, compositional, and electrical
properties of organic-rich source rocks on electrical resistivity and estimates
of hydrocarbon saturation.
1.4 Outline of the thesis
This thesis consists of five chapters. Following the introductory chapter, Chapter II
examines the reliability of conventional resistivity-porosity-saturation models such as
Archie’s and Dual-Water equations in assessment of fluid saturations in organic-rich
source rocks. It provides a conventional workflow to perform joint interpretation of well
7
logs and core measurements from a well drilled in the Haynesville shale-gas formation.
It also investigates the possibility of a measurable impact of volumetric/weight
concentration of kerogen on estimation of water saturation from borehole electrical
resistivity measurements, based on core measurements and well-log interpretation
results.
Chapter III introduces a new petrophysical-compositional-electrical model for organic-
rich source rocks. It describes the development of a pore-scale numerical simulator using
finite difference methods to solve the steady state Laplace conductivity equation.
Chapter IV documents the application of the numerical simulation method to quantify
the effect of volumetric concentration of kerogen, electrical conductivity of kerogen,
spatial connectivity of kerogen-water network, salt concentration of connate water, and
gas-filled kerogen porosity on effective electrical resistivity of pore-scale representations
of organic-rich source rocks. It also describes correlations between gas-filled kerogen
porosity and effective electrical conductivity of kerogen.
Finally, Chapter V summarizes the contribution of the research stemming from this
thesis, draws conclusions based on the results reported, and provides recommendations
for future research.
8
CHAPTER II
RELIABILITY OF CONVENTIONAL RESISTIVITY-POROSITY-
SATURATION MODELS
This chapter describes the approach used to perform joint interpretation of well logs
from a field example in the Haynesville shale-gas formation. It discusses the workflow
used to estimate depth-by-depth petrophysical and compositional properties such as
volumetric/weight concentrations of minerals, TOC, porosity, and water saturation.
Finally, this chapter examines the reliability of conventional resistivity-porosity-
saturation models in providing accurate estimates of fluid saturations in organic-rich
source rocks.
2.1 Introduction
The well-log-based assessment of mineralogy, kerogen, porosity, and hydrocarbon
saturation in organic-rich source rocks is challenging. It involves many pre-assumptions
for physical properties such as density, photoelectric factor, porosity, compressional
slowness, and electrical resistivity of pure minerals and fluids in the formation. The
workflow presented in this thesis uses core data to decrease non-uniqueness of the
results and provides reliable estimates for volumetric/weight concentration of minerals,
kerogen, porosity, and water saturation. The accuracy of conventional resistivity-
9
porosity-saturation models is examined by comparing the fluid saturation estimates
against available core measured water saturation.
2.2 An introduction to geology of Haynesville formation
The Haynesville shale in East Texas and Louisiana is one of the most prolific shale-gas
plays in the continental United States. Different shale-gas plays exhibit diverse
characteristics depending on basin configuration, structural movements, sedimentary
input, sea-level fluctuation, and thermal maturity of organic matter. In addition, shale
plays within the same basin show similar variations that are significant in terms of
thermal maturity of kerogen and need to be considered. As such, the Haynesville shale is
characterized by a range in carbonate and silica content, in porosity, in different
geochemical characteristics, as well as in different lithofacies types.
The Haynesville mudrocks are classified as mudstones. These fine-grained rocks contain
35% - 57% of clay minerals. The unlaminated siliceous mudstone facies is associated
with the highest TOC values, which range between 4% and 8%. The carbonate-rich
facies can also have enriched organic matter with TOC weight concentrations of 3% -
5% (Hammes et al., 2009). There is also abundant pyrite throughout in colloidal as well
as framboidal forms. Organic matter is predominantly type II/III kerogen, with an
average thermal maturity of 1.25% Ro (vitrinite reflectance).
10
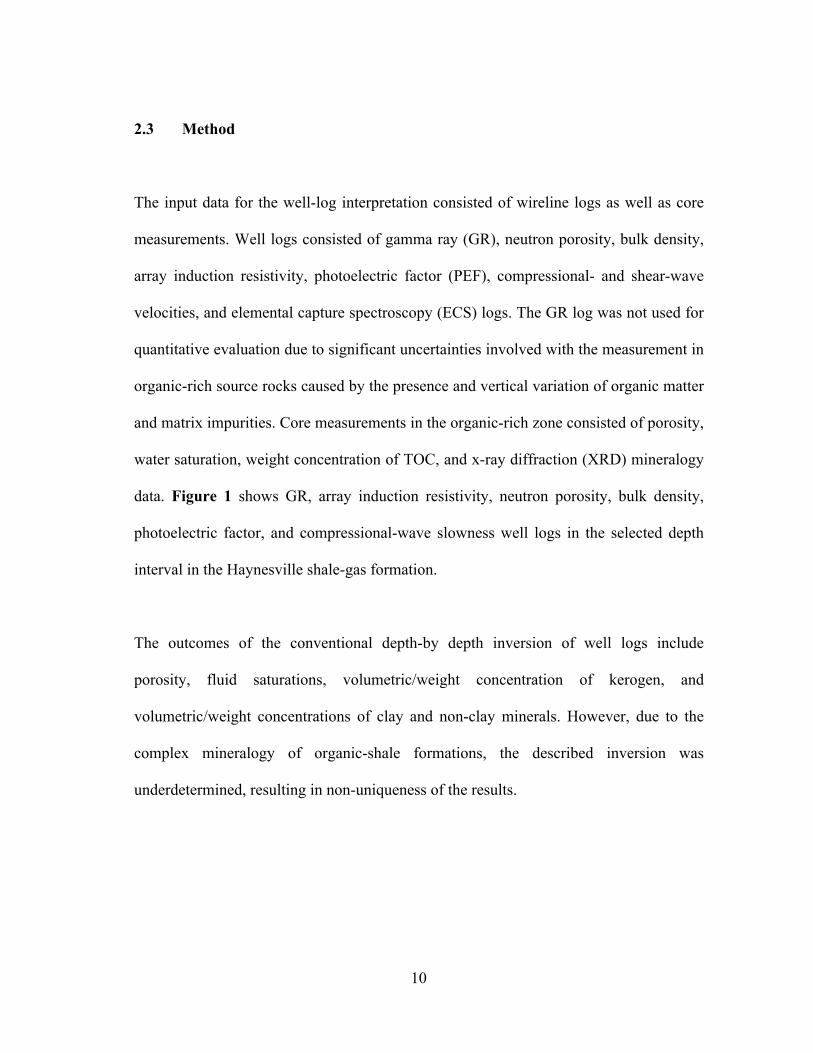
2.3 Method
The input data for the well-log interpretation consisted of wireline logs as well as core
measurements. Well logs consisted of gamma ray (GR), neutron porosity, bulk density,
array induction resistivity, photoelectric factor (PEF), compressional- and shear-wave
velocities, and elemental capture spectroscopy (ECS) logs. The GR log was not used for
quantitative evaluation due to significant uncertainties involved with the measurement in
organic-rich source rocks caused by the presence and vertical variation of organic matter
and matrix impurities. Core measurements in the organic-rich zone consisted of porosity,
water saturation, weight concentration of TOC, and x-ray diffraction (XRD) mineralogy
data. Figure 1 shows GR, array induction resistivity, neutron porosity, bulk density,
photoelectric factor, and compressional-wave slowness well logs in the selected depth
interval in the Haynesville shale-gas formation.
The outcomes of the conventional depth-by depth inversion of well logs include
porosity, fluid saturations, volumetric/weight concentration of kerogen, and
volumetric/weight concentrations of clay and non-clay minerals. However, due to the
complex mineralogy of organic-shale formations, the described inversion was
underdetermined, resulting in non-uniqueness of the results.
11
Figure 1: Field Example: Conventional well logs in a well drilled in Haynesville shale-gas formation. Panels from left to right show depth, gamma ray, array induction resistivity, neutron porosity and bulk density, photoelectric factor, and compressional-wave slowness well logs.

12
To mitigate the non-uniqueness of the results, various techniques were employed based
on the workflow introduced by Quirein et al., (2010). The applied techniques included
(a) decreasing the number of unknown mineral components in the assumed
petrophysical/compositional rock model, (b) applying constraints based on correlations
between volumetric concentrations of minerals, and (c) using a pre-calculated depth-by-
depth volumetric concentration of kerogen as an input curve to constrain the joint
inversion.
2.3.1 Define petrophysical and compositional model
The number of unknown mineral components in the assumed
petrophysical/compositional model was originally determined using core XRD bulk
mineralogy data. Next, minerals with less than 2.5% volumetric concentration were
eliminated from the initial petrophysical model. Finally, minerals with similar physical
properties such as illite-mica and mixed layer clay were lumped together. The assumed
components in the final petrophysical/compositional model included:
(a) Non-clay minerals comprising of quartz, plagioclase, calcite, dolomite, and
pyrite,
(b) Illite as the only clay mineral,
(c) Kerogen, and
(d) Fluids including gas and saline water.

13
Figure 2 shows the final petrophysical/compositional model assumed for well-log
interpretation.
Figure 2: Assumed petrophysical/compositional rock model for organic-rich source rocks used for well-log interpretation.
2.3.2 Establishing constraints between volumetric concentrations of minerals
Analysis of the core XRD data revealed a linear correlation between volumetric
concentrations of plagioclase and quartz (Figure 3). The linear correlation between
volumetric concentrations of plagioclase and quartz was given by
CPlagioclase = 0.133CQuartz +1.824 , (1)

14
where CPlagioclase is the volumetric concentration of plagioclase and CQuartz is the
volumetric concentration of quartz. This linear correlation was used as an equality
constraint in the inversion of well logs.
Figure 3: Correlation between volumetric concentration of plagioclase and quartz obtained from core measurements.
2.3.3 Assessment of volumetric concentration of kerogen
A depth-by-depth volumetric concentration of kerogen, separately calculated using
ΔlogR method (Passey et al., 1990), was used as an input curve to constrain the joint
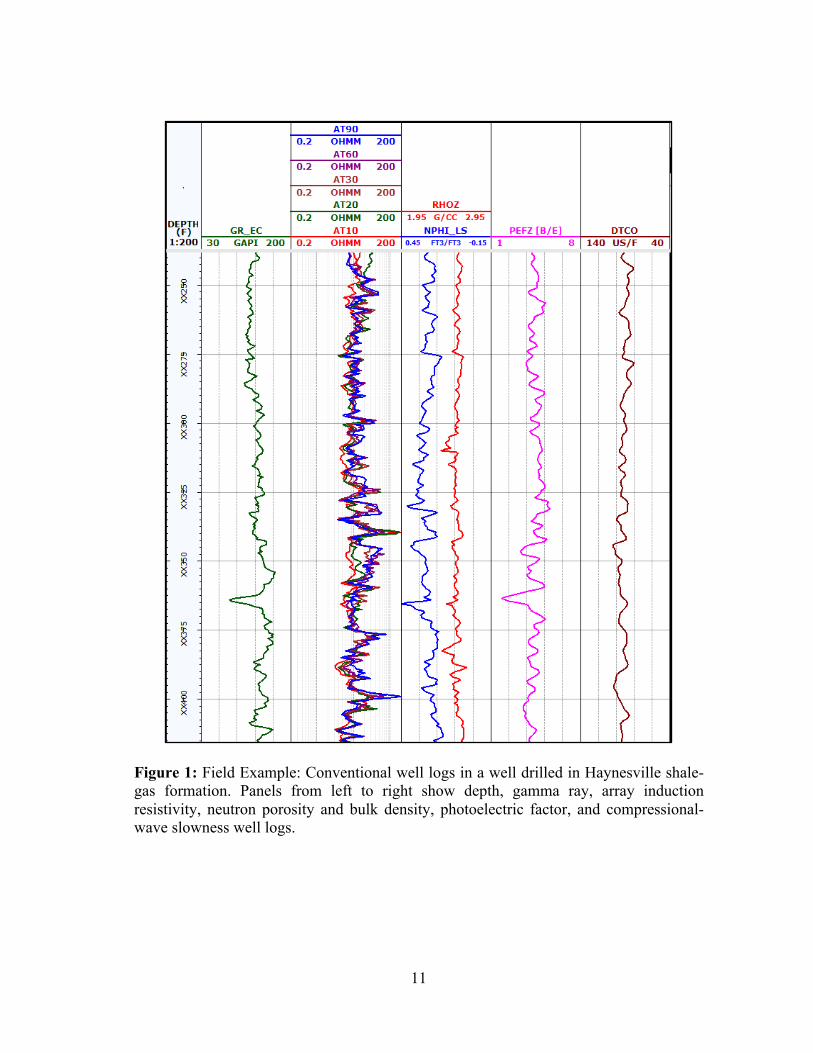
inversion of well logs. First, the density of organic matter was estimated using a simple

15
crossplot of the inverse core grain density and the TOC weight concentration from core
data. The correlation between the grain density and the weight concentration of TOC
was given by
1ρgrain
= 0.0048TOC + 0.35 , (2)
where ρgrain is the core grain density and TOC is the weight concentration of TOC from
core data. From this correlation, a value of 1.2 g/cc was obtained for density of organic
matter, which was used in the model parameters for the joint inversion of input well
logs. Figure 4 shows the correlation between inverse core-measured grain density and
TOC weight concentration obtained from core data.
Next, depth-by-depth weight concentration of TOC was estimated using the ΔlogR
technique developed by Passey (1990). This method uses array induction deep resistivity
well logs and acoustic compressional-wave slowness well logs to estimate weight
concentration of TOC. The resistivity and compressional-wave slowness well logs were
overlain and baselined in a “non-source” rock closest to the zone of interest. With the
baseline established, organic-rich intervals were recognized based on the separation
between the two logs. The separation between the deep resistivity and compressional-
wave slowness well logs was measured and a depth-by-depth ΔlogR curve was
generated.
16
Figure 4: Correlation between weight concentration of TOC from core and inverse of core grain density.
ΔlogR was calculated via (Passey et al., 1990)
Δ logR = log(R Rbaseline )+ 0.02(Δt − Δtbaseline ) , (3)
where R is the resistivity measurement in ohm-m, Δt is the measured compressional-
wave slowness in µsec/ft, Rbaseline is the resistivity value corresponding to the Δtbaseline
value when the well logs are baselined in the non-source rock zone.
17
The ΔlogR separation is linearly related to TOC and is a function of thermal maturity of
the organic matter. The empirical equation used to calculate TOC from ΔlogR was given
by (Passey et al., 1990)
WTOC = (Δ logR)×10(2.297−0.1688LOM ) , (4)
where WTOC is the weight concentration of total organic carbon content and LOM is the
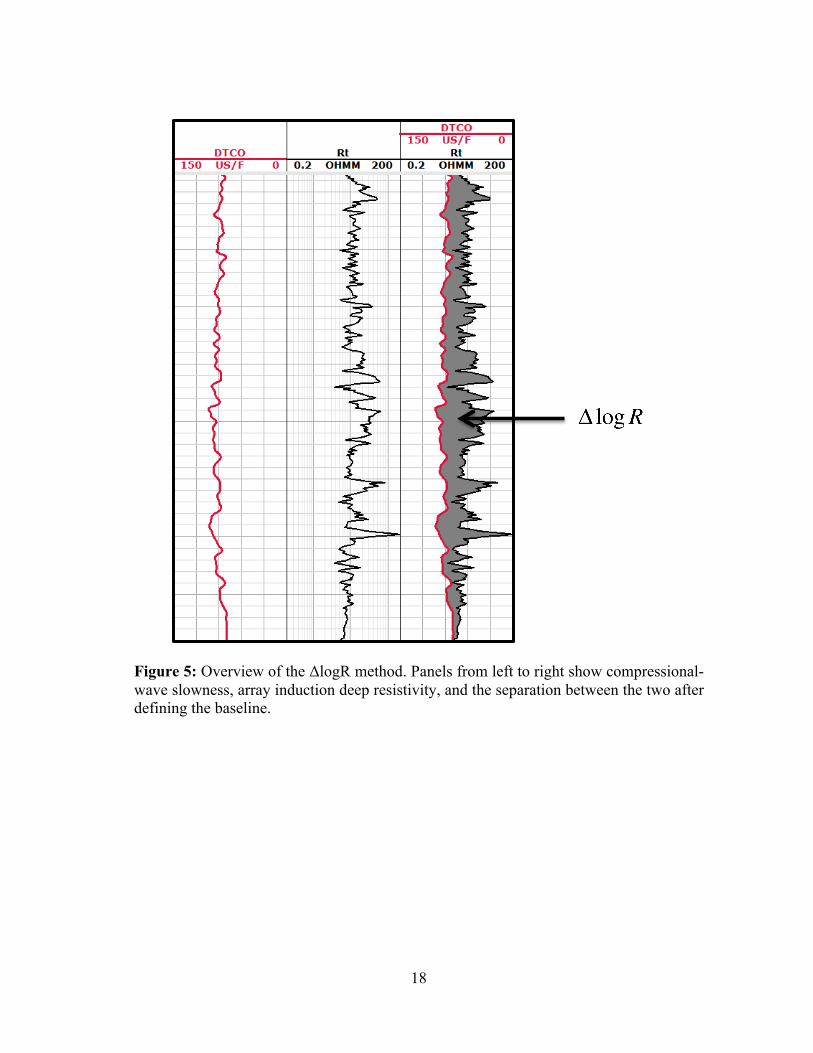
level of maturity. Figure 5 shows the resistivity, compressional-wave slowness, and
depth-by-depth estimates of TOC weight concentration.
Next, an empirical correlation was obtained from regression of core weight
concentration of TOC and core volumetric concentration of kerogen given by
(5)
where Ck is the volumetric concentration of kerogen and WTOC is the weight
concentration of TOC.
Ck = 2.234WTOC + 0.089 ,
18
Figure 5: Overview of the ΔlogR method. Panels from left to right show compressional-wave slowness, array induction deep resistivity, and the separation between the two after defining the baseline.
19
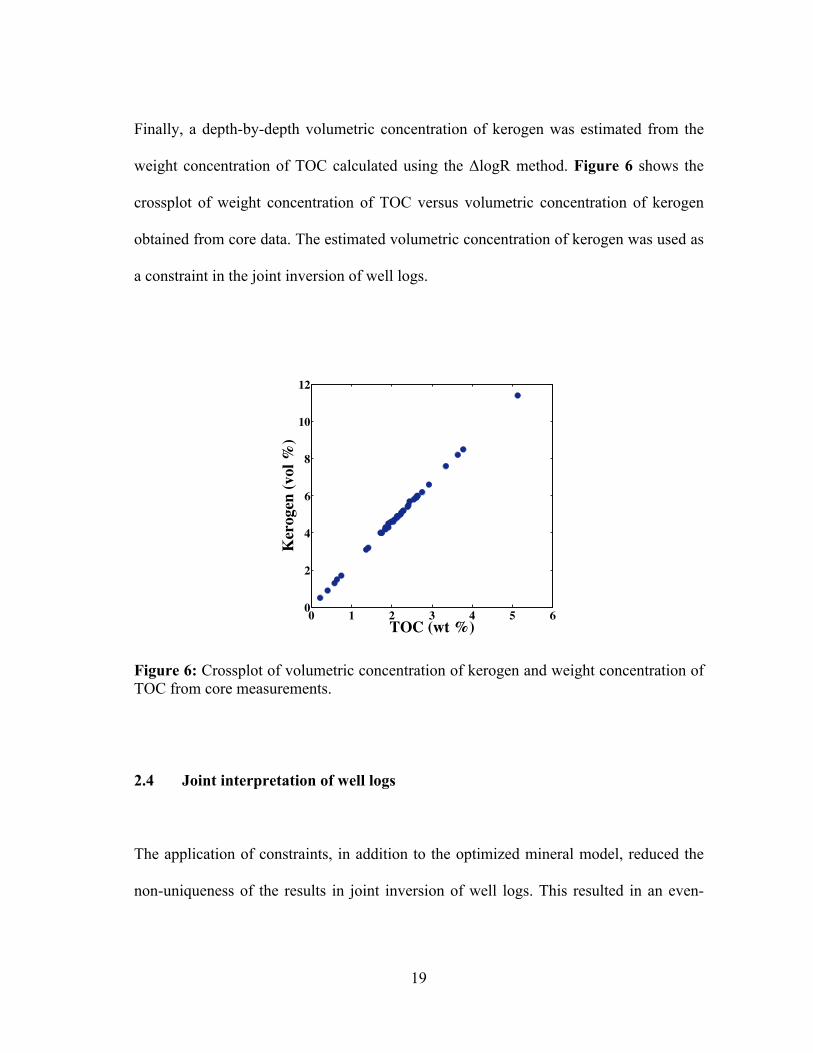
Finally, a depth-by-depth volumetric concentration of kerogen was estimated from the
weight concentration of TOC calculated using the ΔlogR method. Figure 6 shows the
crossplot of weight concentration of TOC versus volumetric concentration of kerogen
obtained from core data. The estimated volumetric concentration of kerogen was used as
a constraint in the joint inversion of well logs.
Figure 6: Crossplot of volumetric concentration of kerogen and weight concentration of TOC from core measurements.
2.4 Joint interpretation of well logs
The application of constraints, in addition to the optimized mineral model, reduced the
non-uniqueness of the results in joint inversion of well logs. This resulted in an even-
0 1 2 3 4 5 60
2
4
6
8
10
12
TOC (wt %)
Ker
ogen
(vol
%)

20
determined inversion. Commercial software was used to perform joint inversion of well
logs to assess the depth-by-depth petrophysical and compositional properties of the
formation. Input well logs to the inversion included array induction resistivity, bulk
density, neutron porosity, photoelectric factor, compressional-wave slowness, and ECS
logs. The outputs included volumetric concentrations of minerals, porosity, and water
saturation. Dual Water model, a conventional resistivity-porosity-saturation model, was
used as part of the joint interpretation of well logs to estimate fluid saturations. The
inversion parameters were calibrated based on comparison of well-log interpretation
results against available core measurements. The Archie’s parameters in Dual-water
model were estimated by calibration against core porosity and water saturation in depth
intervals with minimal TOC.
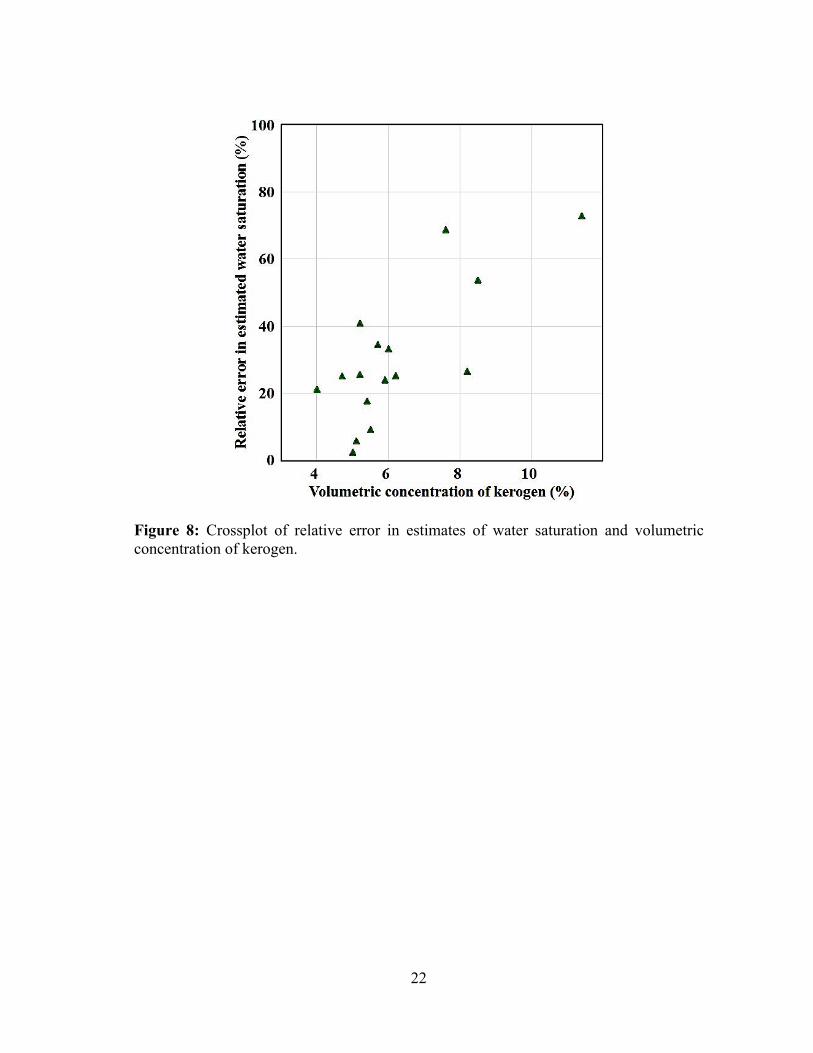
Well-log interpretation results showed good agreement with core data for porosity and
volumetric/weight concentrations of minerals (Figure 7). However, significant relative
errors of 20% - 40% in estimates of water saturation (compared to water saturation
obtained from core measurements) were observed in zones with high volumetric
concentration of kerogen (Figure 8). These results suggested a significant impact of
highly mature kerogen on estimates of fluid saturations using conventional resistivity-
porosity-saturation models. In addition to high volumetric concentration of mature
kerogen in these zones, the presence of pyrite associated with kerogen could also be
responsible for the error in estimates of water saturation.

21
Figure 7: Field Example: Comparison of the results obtained from well-log interpretation against core measurements for total porosity (ninth left-hand panel), total water saturation (tenth left-hand panel), volumetric concentrations of mineral constituents (seventh left-hand panel), and volumetric concentration of minerals obtained from core measurements (eighth left-hand panel). Panels from left to right show depth, gamma ray, array induction resistivity, neutron porosity and density, PEF, and compressional-wave slowness logs.
22
Figure 8: Crossplot of relative error in estimates of water saturation and volumetric concentration of kerogen.

23
CHAPTER III
METHOD
This chapter presents a pore-scale numerical simulation approach for assessment of
effective electrical resistivity of rock-fluid media. In this approach, a digital porous
medium was created based on SEM (scanning electron microscopy) images of rock in
organic-rich source rock formations. Then, a numerical simulator was developed for
assessment of electric field, electric currents, and effective electrical resistivity in 2D
(two-dimensional) and 3D (three-dimensional) pore-scale images. This chapter discusses
the numerical simulation method developed to solve the Laplace conductivity equation
based on a finite difference approach. It also presents the petrophysical and electrical
rock model used for pore-scale numerical simulations in organic-rich source rocks.
The first section in this chapter provides the theoretical basis behind simulation of
electrical conduction phenomena at the pore-scale level in porous media. Section 3.2
describes the modeling process and the development of the finite difference based
numerical simulator. Section 3.3 discusses the methodology used to develop 2D and 3D
synthetic images of organic-rich source rocks. It develops a petrophysical/compositional
rock model assumed for pore-scale numerical simulations based on petrophysical,
compositional, and electrical properties of rock constituents.

24
3.1 Introduction
For a steady state conductivity problem, where the currents are steady in time, the charge
conservation equation is given by
∇⋅J = 0 , (6)
where ∇⋅ is the divergence operator and 𝚥 is the electric displacement field. The
constitutive equation is given by
J =σ
E , (7)
where 𝜎 is the electrical conductivity of the medium and 𝐸 is the electric field. The
electric field can be expressed in terms of the scalar electric potential via
E = −∇V , (8)
where V is the electric field potential. Equations 7 and 8 can be substituted in Equation
6 to give
−∇⋅(σ∇V ) = 0 . (9)

25
Equation 9 is known as the differential form of the Laplace steady state conductivity
equation. This second order Partial Differential Equation (PDE) can be discretized into a
set of linear, simultaneous equations. The following section describes the finite
difference discretization of the Laplace conductivity equation.
3.2 Finite difference method
Finite difference methods have dominated computational science since its inception and
are still utilized for a wide array of computational engineering and science problems.
Briefly, the method can be characterized as follows:
(i) It utilizes uniformly spaced grids.
(ii) Derivatives at each node are numerically approximated using a finite
difference stencil.
(iii) A system of equations is obtained by evaluating the previous step for each
node.
(iv) The system of equations is solved for the electric field potential, which is the
dependent variable.
The Laplace equation in cartesian coordinates can be expressed as
. (10) − ∂(σ∇V )x∂x
+∂(σ∇V )y
∂y+∂(σ∇V )z
∂z⎛⎝⎜
⎞⎠⎟= 0

26
Equation 10 was discretized using Taylor series. Given a function f(x), the second order,
central difference approximation of the second derivative, f”(x) can be expressed as
d 2 fdx2
= f (x − Δx)− 2 f (x)+ f (x + Δx)Δx2
+O(Δx2 ) , (11)
where Δx represents the increment in x and O(Δx2) is the error of approximation.
Figure 9: Seven-point finite difference stencil used for discretization of the Laplace conductivity equation in a 3D domain.
The finite difference approximation of the second order Laplace’s equation on a
cartesian grid was derived using a seven-point finite difference 3D stencil as shown in
Figure 9.
(i,j+1,k)
(i-1,j,k)
(i,j-1,k)
(i,j,k+1)
(i,j,k-1)
(i+1,j,k)
(i,j,k)

27
Next, the differential form was discretized expanding each term via
∂(σ∇V )x
∂x=(σ i+1, j ,k +σ i, j ,k )(Vi+1, j ,k −Vi, j ,k )− (σ i, j ,k +σ i−1, j ,k )(Vi, j ,k −Vi−1, j ,k )
2Δx2 , (11)
∂(σ∇V )y
∂y=(σ i, j+1,k +σ i, j ,k )(Vi, j+1,k −Vi, j ,k )− (σ i, j ,k +σ i, j−1,k )(Vi, j ,k −Vi, j−1,k )
2Δy2 , (12)
and
∂(σ∇V )z
∂z=(σ i, j ,k+1 +σ i, j ,k )(Vi, j ,k+1 −Vi, j ,k )− (σ i, j ,k +σ i, j ,k−1)(Vi, j ,k −Vi, j ,k−1)
2Δz2 , (13)
where σi,j,k is the local conductivity at location (i,j,k), Vi,j,k is the electric potential at
location (i,j,k), and Δx, Δy, and Δz represent the increments in x, y, and z directions,
respectively. Next, the PDE in Equation 11 was expressed as a set of linear,
simultaneous equations given by
(σ i−1, j ,k + 2σ i, j ,k +σ i+1, j ,k )2Δx2
+(σ i, j−1,k + 2σ i, j ,k +σ i, j+1,k )
2Δy2+(σ i, j ,k−1 + 2σ i, j ,k +σ i, j ,k+1)
2Δz2⎛⎝⎜
⎞⎠⎟Vi, j ,k −
(σ i−1, j ,k +σ i, j ,k )Vi−1, j ,k + (σ i, j ,k +σ i+1, j ,k )Vi+1, j ,k2Δx2
−
(σ i, j−1,k +σ i, j ,k )Vi, j−1,k + (σ i, j ,k +σ i, j+1,k )Vi, j+1,k2Δy2
−
(σ i, j ,k−1 +σ i, j ,k )Vi, j ,k−1 + (σ i, j ,k +σ i, j ,k+1)Vi, j ,k+12Δz2
= 0.
(14)

28
The electric field potential at each node point was obtained as a solution to the linear
system of equations in Equation 15 expressed as
KV = B , (15)
where K is the stiffness matrix representing the matrix comprised of the coefficients to
the electric potential terms, B represents the matrix comprised of elements derived from
the boundary conditions imposed on the problem, and V is the matrix comprised of the
electric potentials at each node. The solution to Equation 16 was derived by solving for
spatial distribution of electric field potential using either direct or iterative methods.
3.2.1 Boundary conditions
Solution to Equation 16 requires the specification of certain conditions that the electric
field potential must satisfy at the boundary of the 3D domain. A preset electric potential
was applied on two opposite boundaries and imposed Dirichlet boundary conditions.
Furthermore, no electric current flow was assumed across the other boundaries and
Neumann boundary conditions were imposed at these boundaries. While the Dirichlet
boundary conditions were incorporated in the matrix B, imposing Neumann boundary
conditions was challenging.

29
Figure 10 shows the mesh generated over a slice of the 3D domain. The total number of
nodes in x, y, and z directions are m, n, and p respectively. For the Dirichlet nodes
(shown in green), the electric potential at nodes on the left boundary was given by
Vi,1,k =Vleft , (16)
where Vi,1,k is the electric potential on the nodes at j = 1 and Vleft is the preset constant
electric potential on the left boundary.
Similarly, electric potential at nodes on the right boundary was given by
Vi,n,k =Vright , (17)
where Vi,n,k is the electric potential on the nodes at j = n and Vright is the preset constant
electric potential on the right boundary. Therefore, the assumed potential difference
between the right and left boundaries was calculated via
ΔV =Vleft −Vright . (18)
For the Neumann nodes (red nodes in Figure 10), the derivative of electric potential in
the direction normal to the boundary is zero, expressed via

30
, (19)
and
. (20)
(a) (b) Figure 10: (a) Sample 3D domain and (b) grid generated over a 2D section. Circles in green, red, and blue represent Dirichlet nodes, Neumann nodes, and ghost nodes, respectively.
The nodes on i = 1 and i = m are, however, boundary nodes and electric potentials Vi-1,j,k
and Vi+1,j,k, for central difference discretization of Equations 20 and 21 are not present in
the domain. To enforce the Neumann boundary condition, the concept of ghost nodes
∂Vi, j ,k∂y
j⎛⎝⎜
⎞⎠⎟ i=1
i (− j) = 0
∂Vi, j ,k∂y
j⎛⎝⎜
⎞⎠⎟ i=m
i j = 0
i
j k
i
j k

31
was used. Ghost nodes (blue nodes in Figure 10) were imagined outside the domain and
the central difference approximation at i = 1, i = m, k = 1, and k = p was evaluated to
impose the boundary condition.
3.2.2 Node-numbering
First, the linear system of equations given by Equation 15 was derived for internal
nodes and the nodes under Dirichlet and Neumann boundary conditions. Next, a node-
numbering scheme was developed to assemble the stiffness matrix, K, and matrix B.
Figure 11 shows an example of the node-numbering scheme in a 6x6x6 3D domain. It
illustrates the node-numbers over two subsequent 2D faces of the 3D domain.
Figure 11: Mesh generated over two subsequent 2D faces of the 6x6x6 3D domain. The nodes are referenced in a row, column, and face format. Circles in green and red represent Dirichlet nodes and Neumann nodes, respectively.

32
The stiffness matrix, K, was assembled using the coefficients of the electric potential
terms in Equation 15. For instance, consider the 3D finite difference stencil around a
node given by (row,column,face) as shown in Figure 12. The stiffness matrix was then
populated with the coefficients for each grid point placed at the appropriate position
based on the node-numbering scheme illustrated in Figure 11.
Figure 12: Seven-point finite difference stencil in 3D for a node referenced in row, column, and face matrix notation.
3.2.3 Summary
The stiffness matrix in this problem was a sparse matrix, leading to an ill-conditioned
inverse problem. Iterative method was used to optimize computational time and solve
the system of simultaneous equations for the electric field potential at each grid point.
(row-1,column,face)
(row,column-1,face)
(row+1,column,face)
(row,column,face+1)
(row,column,face-1)
(row,column+1,face)
(row,column,face)

33
For numerical simulations in the 3D pore-scale images, the quasi-minimal residual
method (QMR) was used to solve for the electric potential, iteratively.
The 3D numerical simulator was developed to model steady state electrical flow through
the porous medium. The cell-centered finite difference code was developed in
MATLAB®. The input to the simulator includes (a) digitized pore-scale image of rock-
fluid system, (b) electrical resistivity of each matrix/fluid component, and (c) assumed
potential difference between two opposite boundaries of the image. The simulator solves
for the spatial distribution of electric field potential with a preset potential difference at
two opposite boundaries of the porous medium. The other boundaries were assumed to
be no-flow boundaries. Next, the spatial distribution of electrical current was computed
through the porous medium and effective electrical resistivity of the 3D domain was then
derived using Ohm’s law. To optimize the number of grids and consequently CPU
(Central Processing Unit) time, grid size was progressively decreased until a variation of
less than 0.25% in the estimated electrical resistivity was achieved. However, the grid
size can be variable in different cases with different spatial distribution of fluids, grains,
and kerogen. The following section describes the assumed petrophysical/compositional
rock model and segmentation method used to build synthetic images of organic-rich
source rock.
34
3.3 The assumed petrophysical/compositional rock model
The inputs for the numerical simulations were synthetic digital representations of
organic-rich source rock. Synthetic images of the rock-fluid system were developed
based on SEM images of organic-rich source rock in order to capture the spatial
distribution of organic matter and porosity of the rock. For instance, rock images in the
Haynesville shale-gas formation were used to model dispersed spatial distribution of
kerogen, and rock images in the Woodford shale-gas formation were used to represent
layered spatial distribution of kerogen. The 2D digital images were segmented to define
matrix/fluid constituents including non-conductive matrix, kerogen, brine, and
hydrocarbon. Furthermore, 3D synthetic images of organic-rich source rocks were
developed using random walk and random distribution algorithms to spatially distribute
kerogen and pore space. 3D images can also be developed using 3D FIB-SEM (Focused
Ion Beam-Scanning Electron Microscopy) images, if available. Figure 13 describes the
assumed petrophysical rock model used to segment the digital images. This assumed
petrophysical/compositional model includes non-conductive matrix, conductive minerals
such as pyrite, kerogen, gas within kerogen, and saline water.
35
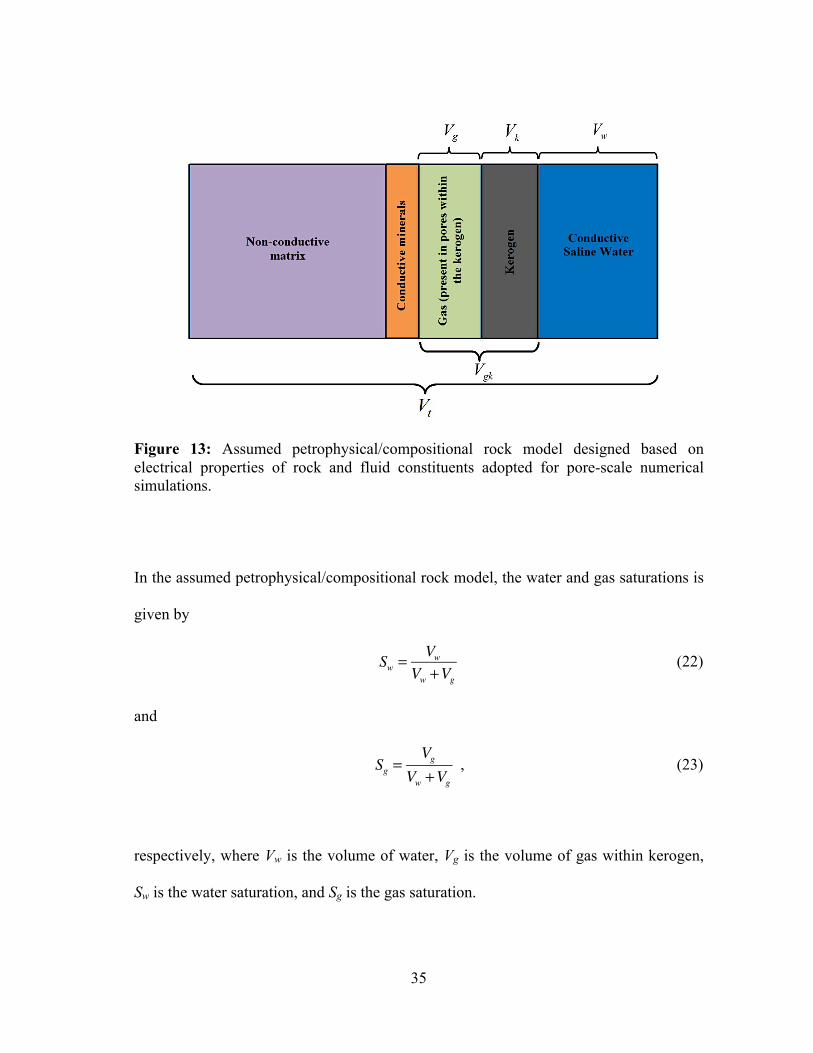
Figure 13: Assumed petrophysical/compositional rock model designed based on electrical properties of rock and fluid constituents adopted for pore-scale numerical simulations.
In the assumed petrophysical/compositional rock model, the water and gas saturations is
given by
Sw =Vw
Vw +Vg (22)
and
Sg =Vg
Vw +Vg , (23)
respectively, where Vw is the volume of water, Vg is the volume of gas within kerogen,
Sw is the water saturation, and Sg is the gas saturation.

36
The volumetric concentration of kerogen, Ck, is given by
Ck =VkVt
, (24)
where Vk is the volume of kerogen and Vt is the total rock volume. The kerogen porosity,
ϕk, is expressed as
φk =VgVgk
, (25)
where Vgk represents the net volume of gas-bearing kerogen and is given by
Vgk =Vg +Vk . (26)
The total porosity of the rock-fluid system, ϕt, is defined as
φt =Vg +VwVt
. (27)

37
CHAPTER IV
PORE-SCALE NUMERICAL SIMULATIONS OF ELECTRICAL RESISTIVITY
IN ORGANIC-RICH SOURCE ROCKS
This chapter documents the application of the numerical simulation method described in
Chapter III in four synthetic cases. Pore-scale numerical simulations were used to
quantify the impact of volumetric/weight concentration of kerogen, kerogen electrical
conductivity, kerogen porosity, and spatial connectivity of kerogen-water network on
effective electrical resistivity of organic-rich source rocks. Finally, the chapter presents
the possible improvement in estimates of fluid saturations using resistivity-porosity-
saturation models by taking into account the effect of kerogen on electrical resistivity
measurements. The first synthetic case presents a sensitivity analysis to quantify the
effect of electrical conductivity, spatial distribution, and volumetric concentration of
kerogen on electrical resistivity in 2D images of organic-rich source rock. The second
synthetic case is used to investigate the impact of spatial connectivity of kerogen-water
network on electrical resistivity in 3D images of organic-rich source rock. The third
synthetic case quantifies the correlation between gas-filled kerogen porosity and
electrical conductivity of kerogen. Finally, the fourth synthetic case shows the
improvement in estimates of fluid saturations in organic-rich source rocks by taking into
account the effect of conductive gas-saturated kerogen.
38
4.1 Synthetic Case No. 1: Effect of kerogen conductivity and volumetric
concentration of kerogen on electrical resistivity of organic-rich source
rocks
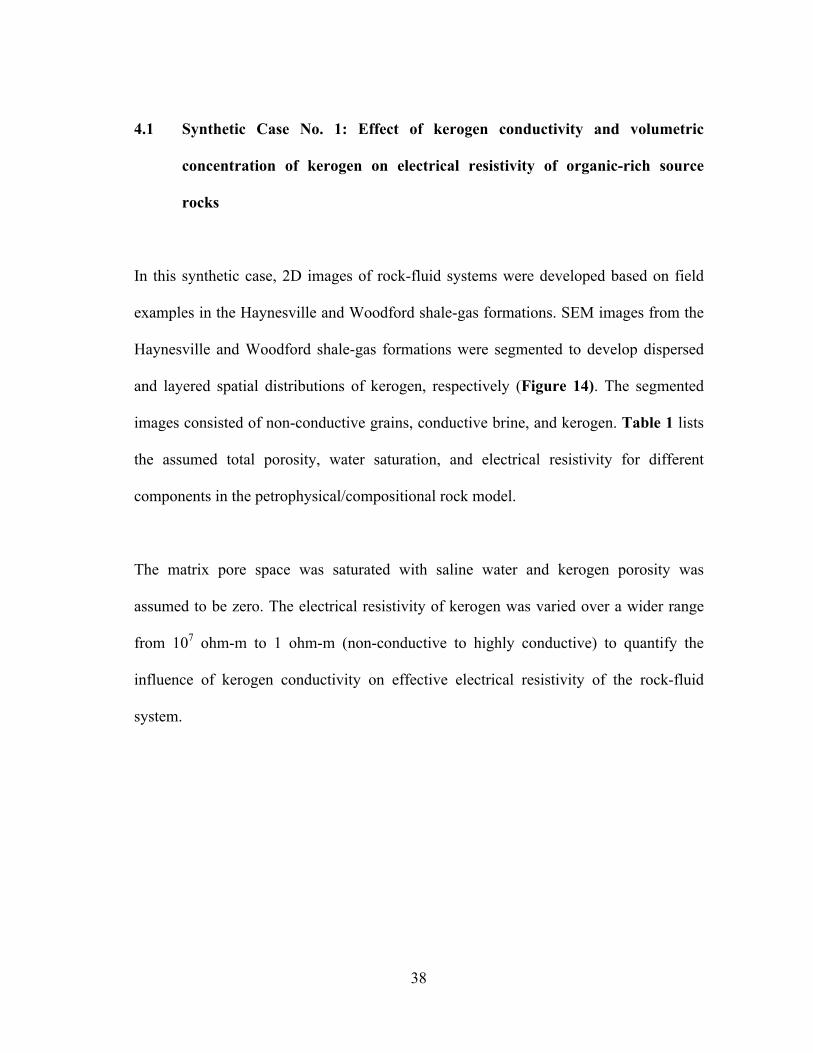
In this synthetic case, 2D images of rock-fluid systems were developed based on field
examples in the Haynesville and Woodford shale-gas formations. SEM images from the
Haynesville and Woodford shale-gas formations were segmented to develop dispersed
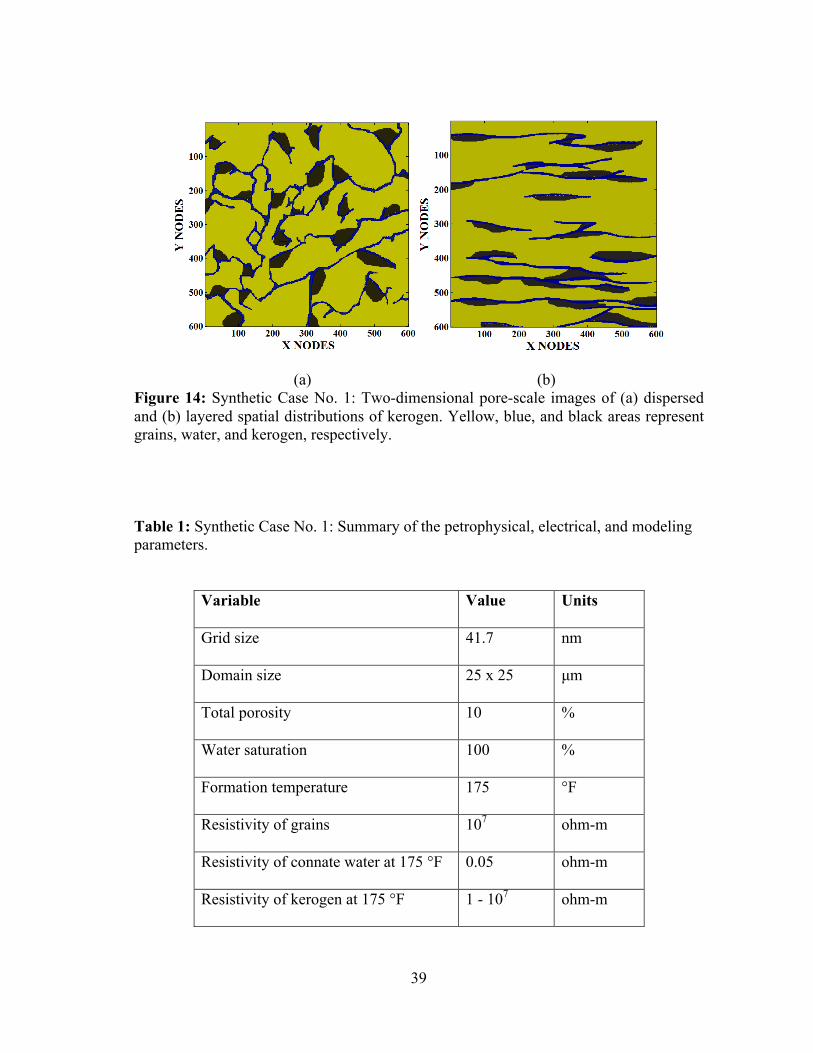
and layered spatial distributions of kerogen, respectively (Figure 14). The segmented
images consisted of non-conductive grains, conductive brine, and kerogen. Table 1 lists
the assumed total porosity, water saturation, and electrical resistivity for different
components in the petrophysical/compositional rock model.
The matrix pore space was saturated with saline water and kerogen porosity was
assumed to be zero. The electrical resistivity of kerogen was varied over a wider range
from 107 ohm-m to 1 ohm-m (non-conductive to highly conductive) to quantify the
influence of kerogen conductivity on effective electrical resistivity of the rock-fluid
system.
39
(a) (b) Figure 14: Synthetic Case No. 1: Two-dimensional pore-scale images of (a) dispersed and (b) layered spatial distributions of kerogen. Yellow, blue, and black areas represent grains, water, and kerogen, respectively.
Table 1: Synthetic Case No. 1: Summary of the petrophysical, electrical, and modeling parameters.
Variable Value Units
Grid size 41.7 nm
Domain size 25 x 25 µm
Total porosity 10 %
Water saturation 100 %
Formation temperature 175 °F
Resistivity of grains 107 ohm-m
Resistivity of connate water at 175 °F 0.05 ohm-m
Resistivity of kerogen at 175 °F 1 - 107 ohm-m

40
Figure 15: Synthetic Case No. 1: Comparison of the impact of kerogen conductivity on electrical resistivity of organic-rich source rocks. Blue and red lines show estimated effective rock electrical resistivity in the synthetic cases with dispersed and layered kerogen distributions, respectively.
Figure 15 shows the sensitivity of effective electrical resistivity of the rock-fluid system
to electrical conductivity of kerogen for both dispersed and layered spatial distributions
of kerogen. Results suggest that for kerogen electrical resistivity greater than 100 ohm-
m, the electrical resistivity of rock remains unaffected by the presence of kerogen.
Furthermore, there is a sharper decrease in electrical resistivity of rock in the case with
layered distribution of kerogen compared to the case with dispersed distribution of
kerogen. The sharper decrease in the case of layered kerogen distribution is due to the
greater kerogen network connectivity.
100101102103104105106107100
101
Electrical resistivity of kerogen (ohmïm)
Elec
tric
al r
esist
ivity
of o
rgan
icïr
ich
sour
ce r
ock
(ohm
ïm)
Dispersed
Layered

41
(a) (b)
Figure 16: Synthetic case I: Sensitivity analysis on the impact of volumetric concentration of kerogen on effective rock electrical resistivity of organic-rich source rock in (a) dispersed and (b) layered spatial distribution of kerogen.
Next, a sensitivity analysis was performed to quantify the effect of volumetric
concentration of kerogen on electrical resistivity of the rock-fluid system. The
volumetric concentration of kerogen was varied from 10% to 30%. Figure 16 shows the
sensitivity analysis of electrical resistivity to volumetric concentration of kerogen for
dispersed and layered cases, respectively. The matrix porosity was assumed to be 10%
and was fully saturated with saline water. In both cases electrical resistivity of rock-fluid
system decreased with increase in volumetric concentration of kerogen. A significant
drop in estimated electrical resistivity was observed at 15% and 20% volumetric
concentration of kerogen in the dispersed and layered cases, respectively. The more
0 10 20 30 40
1.6
1.8
2
2.2
2.4
2.6
Volumetric concentrationof kerogen (%)
Elec
tric
al r
esist
ivity
of
orga
nicï
rich
sour
ce r
ock
(ohm
ïm)
0 10 20 30 40
1.6
1.8
2
2.2
2.4
2.6
Volumetric concentrationof kerogen (%)
Elec
tric
al r
esist
ivity
of
orga
nicï
rich
sour
ce r
ock
(ohm
ïm)

42
significant decrease in electrical resistivity in the case of layered kerogen is due to the
increase in connectivity of kerogen network.
In the next synthetic case, numerical simulations were performed to quantify the impact
of spatial distribution and connectivity of kerogen-water network in 3D images of
organic-rich source rocks.
4.2 Synthetic Case No. 2: Impact of kerogen spatial distribution and
connectivity of kerogen-water network on electrical resistivity of organic-
rich source rocks
In addition to volumetric concentration and conductivity of kerogen, the connectivity of
kerogen and water phase can have a significant impact on electrical resistivity
measurements. Synthetic Case No. 2 examines the impact of kerogen and water phase
connectivity on electrical resistivity of organic-rich source rocks.
First, a sensitivity analysis was run to investigate the effect of kerogen conductivity on
electrical resistivity of 3D image of organic-rich source rock, where kerogen network is
connected. A synthetic 3D pore-scale image of the rock-fluid system was developed with
20% volumetric concentration of kerogen and 5% matrix porosity fully saturated with
saline water (Figure 17).

43
Figure 17: Synthetic Case No. 2: Three-dimensional pore-scale image of organic-rich source rock. Yellow, blue, and black areas represent grains, water, and kerogen, respectively.
Table 2 lists the petrophysical, compositional, and electrical parameters assumed in the
numerical simulations. The electrical resistivity of kerogen was progressively decreased
from 107 ohm-m to 1 ohm-m to examine the effect on effective electrical resistivity of
synthetic 3D pore-scale image of organic-rich source rock. Figure 18 shows the results
of the sensitivity analysis. With the increase in connectivity of kerogen network in the
synthetic 3D image, there was an increased sensitivity of electrical resistivity of the rock
to kerogen conductivity, compared to Synthetic Case No. 1. The impact of kerogen on
electrical resistivity of organic-rich source rock was observed at 1000 ohm-m electrical

44
resistivity of kerogen in Synthetic Case No. 2 compared to 100 ohm-m in Synthetic Case
No. 1.
Table 2: Synthetic case II: Summary of the assumed petrophysical, electrical, and modeling parameters.
Variable Value Units
Grid size 25 nm
Domain size 2.5 x 2.5 x 2.5 µm
Volumetric concentration of kerogen 20 %
Total porosity 5 %
Water saturation 100 %
Formation temperature 175 °F
Resistivity of grains 107 ohm-m
Resistivity of connate water at 175 °F 0.05 ohm-m
Resistivity of kerogen at 175 °F 1 - 107 ohm-m
Next, two synthetic 3D images of organic-rich source rock were developed with similar
volumetric concentration of kerogen, water saturation, and porosity but different spatial
connectivity of kerogen and water phase (Figure 19). The network shown in Figure 19a
had less kerogen-water-network connectivity compared to the one shown in Figure 19b.
The petrophysical, compositional, and electrical parameters assumed in the numerical

45
simulations were similar to those reported in Table 2. The electrical resistivity of
kerogen was assumed as 100 ohm-m in both cases.
Figure 18: Synthetic Case No. 2: Impact of kerogen conductivity on electrical resistivity of three-dimensional pore-scale image of organic-rich source rock.
The calculated electrical resistivity for the less connected kerogen-water network was
22.63 ohm-m while that of the more connected kerogen-water network was 13.83 ohm-
m. This difference corresponds to a 39% relative decrease in electrical resistivity due to
an increase in kerogen-water-network connectivity. The decrease in effective rock
electrical resistivity has a significant impact on the estimates of fluid saturation using
conventional resistivity-porosity-saturation models, which leads to a 30% overestimate
in water saturation, in this case.
100101102103104105106107100
101
102
Resistivity of kerogen (ohmïm)
Elec
tric
al r
esist
ivity
of
org
anicïr
ich
sour
ce r
ock
(ohm
ïm)

46
Figure 19: Synthetic Case No. 2: Three-dimensional pore-scale images of two organic-rich source rocks with (a) low connectivity and (b) high connectivity of kerogen-water network. Yellow, blue, and black areas in the 3D image represent grains, water, and kerogen, respectively.
4.3 Synthetic Case No. 3: Effective electrical resistivity of gas-saturated kerogen
Presence of gas in nano-scale pore structure within kerogen is another parameter
affecting electrical resistivity of organic-rich source rocks. Previous publications
suggested about 50% of the volume of the organic matter in overmature organic-rich
source rocks may consist of hydrocarbon-wet pores (Passey et al., 2010). A recently
introduced petrophysical model for organic-rich source rocks assumes that hydrocarbon
phase occupies the kerogen pore space while matrix porosity is filled with water (Alfred
et al., 2012). Synthetic Case No. 3 investigates the impact of gas-filled pore space inside
kerogen on the effective electrical resistivity of kerogen-gas system.
47
First, 3D synthetic images of kerogen-gas system were developed by randomly
distributing gas-filled pores within the kerogen domain. Three kerogen-gas systems were
built with kerogen electrical resistivity of 1000 ohm-m, 500 ohm-m, and 100 ohm-m.
Gas-filled pores were assumed to have a size of 25nm by 25nm by 25nm. Gas in the
pores was assumed to be non-conductive with an electrical resistivity of 107 ohm-m.
Effective electrical resistivity of gas-filled kerogen was then estimated using the
developed numerical simulator. A progressive increase in the gas-filled kerogen porosity
(i.e., from 5% - 50%) quantified the impact of gas-filled pores on effective electrical
resistivity of kerogen-gas system. The estimated electrical resistivity was the median of
results from 20 random distributions of fully gas-saturated kerogen pores for each case
of gas-filled kerogen porosity.
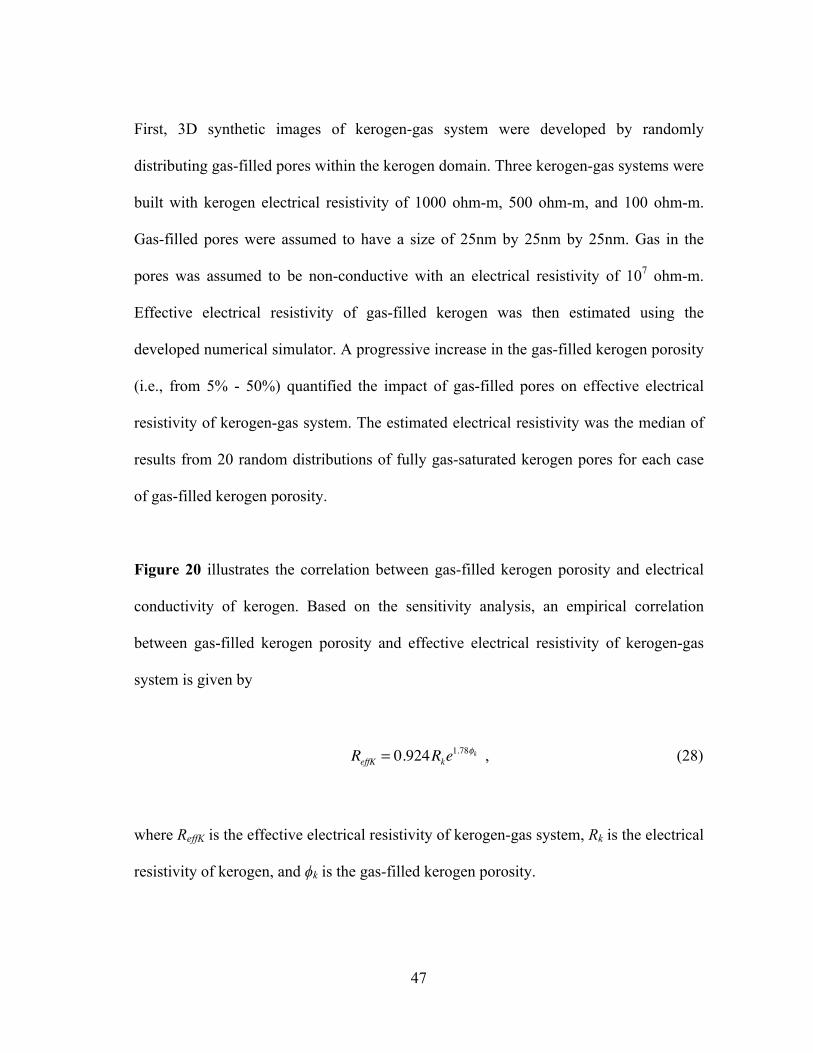
Figure 20 illustrates the correlation between gas-filled kerogen porosity and electrical
conductivity of kerogen. Based on the sensitivity analysis, an empirical correlation
between gas-filled kerogen porosity and effective electrical resistivity of kerogen-gas
system is given by
, (28)
where ReffK is the effective electrical resistivity of kerogen-gas system, Rk is the electrical
resistivity of kerogen, and ϕk is the gas-filled kerogen porosity.
ReffK = 0.924Rke1.78φk

48
Figure 20: Synthetic Case No. 3: Correlation between the effective electrical resistivity of kerogen-gas system and gas-filled kerogen porosity. Blue, red, and green points show the effective electrical resistivity of kerogen-gas system when electrical resistivity of kerogen is assumed to be 1000 ohm-m, 500 ohm-m, and 100 ohm-m, respectively.
In the next synthetic case study, numerical simulations were performed on 3D organic-
rich source rocks with gas-saturated kerogen. The effect of conductive gas-saturated
kerogen on electrical resistivity measurements in organic-rich source rocks and its
impact on estimates of hydrocarbon saturation using conventional resistivity-porosity-
saturation models is discussed.
4.4 Synthetic Case No. 4: Organic-rich source rocks with gas-saturated kerogen
Synthetic Case No. 4 examines the effect of conductive gas-saturated kerogen on
electrical resistivity of organic-rich source rocks. 3D images of organic-rich source rock
0 0.1 0.2 0.3 0.4 0.5102
103
Gasïfilled kerogen porosity (v/v)
Effe
ctiv
e el
ectr
ical
res
istiv
ity o
f ke
roge
nïga
s sys
tem
(ohm
ïm)
Rk = 1000 ohmïmRk = 500 ohmïmRk = 100 ohmïm

49
were developed with the pore structure and spatial distribution of kerogen similar to
Synthetic Case No. 3. In this case, matrix pores were fully saturated with brine and
kerogen pores were fully saturated with gas. The electrical conductivity of kerogen was
varied to investigate its impact on effective electrical resistivity of 3D organic-rich
source rock. Kerogen porosity, however, remained constant.
First, the effective electrical resistivity of the synthetic organic-rich source rock was
estimated for different electrical conductivities of kerogen using numerical simulations.
Table 3 lists the assumed petrophysical, electrical, and modeling parameters for
Synthetic Case No. 4. Next, the estimated effective electrical resistivity of the rock was
used to calculate the water saturation using a conventional resistivity-porosity-saturation
model (i.e., Archie’s equation in this case).
Figure 21 shows the relative difference between the estimated water saturation using
Archie’s equation in the presence of conductive kerogen and the estimated water
saturation assuming kerogen is non-conductive. For instance, in the presence of
conductive kerogen with 100 ohm-m resistivity, Archie’s equation overestimated water
saturation by 23%. Taking into account the effect of conductive kerogen on electrical
resistivity of organic-rich source rocks can improve estimates of hydrocarbon saturation
by 10% - 23%.

50
Figure 21: Synthetic Case No. 4: Impact of electrical resistivity of kerogen on relative error in estimates of water saturation if obtained using conventional resistivity-porosity-saturation models (i.e., Archie’s equation in this case).
The relative error in estimates of water saturation due to the presence of conductive
kerogen depends on the salt concentration of connate water present in the organic-rich
source rock. If the salt concentration of connate water is high, then the relative impact of
conductive kerogen on effective electrical resistivity of organic-rich source rock is small.
A sensitivity analysis was performed on the impact of salt concentration of connate
water (varied from 60 kppm NaCl to 200 kppm NaCl) on relative error in water
saturation estimates if obtained using conventional-resistivity-saturation models in the
presence of conductive kerogen with 100 ohm-m resistivity. Figure 22 illustrates the
decreasing impact of conductive kerogen on the relative error in water saturation
estimates when salt concentration of connate water increases.
1011021031040
10
20
30
40
50
60
Electrical resistivity of kerogen (ohmïm)
Rel
ativ
e er
ror
in
wat
er sa
tura
tion
estim
ates
(%)

51
Table 3: Synthetic Case No. 4: Summary of the assumed petrophysical, electrical, and modeling parameters.
Variable Value Units
Grid size 25 nm
Domain size 2.5 x 2.5 x 2.5 µm
Matrix porosity 5 %
Volumetric concentration of kerogen 20 %
Gas-filled kerogen porosity 35 %
Formation temperature 175 °F
Resistivity of grains 107 ohm-m
Resistivity of connate water at 175 °F 0.05 ohm-m
Resistivity of gas 107 ohm-m
Resistivity of kerogen at 175 °F 1 - 107 ohm-m
Archie’s factor, a 1 [ ]
Archie’s porosity exponent, m 2.18 [ ]
Archie’s saturation exponent, n 2.12 [ ]
52
Figure 22: Synthetic Case No. 4: Impact of salt concentration of connate water on the relative error in water saturation estimates due to the presence of conductive kerogen with 100 ohm-m resistivity.
Furthermore, the impact of kerogen porosity on effective electrical resistivity of organic-
rich source rocks was examined. Sensitivity analysis was performed by progressively
increasing kerogen porosity, while all other petrophysical and compositional parameters
were assumed constant. Figure 23 shows the effect of kerogen porosity on the effective
electrical resistivity of the rock in the presence of conductive kerogen with 100 ohm-m
resistivity. The effective electrical resistivity of the organic-rich rock-fluid system
increases, when gas-filled kerogen porosity increases.
0 50 100 150 200 25010
15
20
25
30
Salinity of connate water (kppm)
Rel
ativ
e er
ror
in w
ater
satu
ratio
n es
timat
es (%
)

53
Figure 23: Synthetic Case No. 4: Impact of kerogen porosity on effective electrical resistivity of organic-rich source rocks.
0 0.2 0.4 0.6 0.8 1101
102
Kerogen porosity (v/v)
Elec
tric
al r
esist
ivity
of o
rgan
icïr
ich
sour
ce r
ock
(ohm
ïm)
54
CHAPTER V
CONCLUSIONS
This chapter summarizes the main contributions of the work described in this thesis,
provides conclusions drawn from the results of well-log interpretation and pore-scale
numerical simulations, and suggests recommendations for future work.
5.1 Summary
The objective of this thesis was to investigate and quantify the effect of petrophysical
and compositional properties of organic-rich source rocks on electrical resistivity
measurements in these formations. First, joint interpretation of well logs and core
measurements from a field example in the Haynesville shale-gas formation was
performed to examine the reliability of conventional resistivity-porosity-saturation
models in assessment of water saturation in organic-rich source rocks. Next, a pore-scale
numerical simulator was developed using finite difference method to discretize the
Laplace conductivity equation in porous media. The numerical simulator solves for
spatial distribution of electric field potential, electric current and estimates effective
electrical resistivity of pore-scale rock-fluid systems. The numerical simulations were
performed using a single compute node on the supercomputer. Each node had 24 GB of
DDR3 1333 MHz memory with each core operating at 2.8 GHz. CPU time for 2D
numerical simulations discussed in Synthetic Case No. 1 was 4 hours. This increased to

55
around 24 hours - 72 hours for 3D numerical simulations, in highly heterogeneous
porous media, reported in Synthetic Cases 2, 3, and 4. Further, sensitivity analysis was
performed using the numerical simulator to investigate the impact of volumetric
concentration of kerogen, electrical conductivity of kerogen, spatial distribution of
kerogen, connectivity of kerogen-water network, and kerogen porosity on electrical
resistivity of organic-rich source rocks.
5.2 Conclusions
The main conclusions drawn from this thesis can be summarized as follows:
• Well-log interpretation in the Haynesville shale-gas formation showed that
conventional resistivity-porosity-saturation models were not reliable for
assessment of hydrocarbon saturation using electrical resistivity measurements.
• Relative errors ranging from 20% - 40% in estimates of water saturation from
conventional models compared to core measurements were observed in the zones
with high volumetric concentration of kerogen. This could be due to highly
mature conductive kerogen and/or presence of conductive mineral such as pyrite
inside the kerogen network.
• Results from numerical simulations performed in Synthetic Case No. 1 illustrated
the impact of kerogen conductivity, and volumetric concentration of kerogen on
electrical resistivity of pore-scale images with layered and dispersed spatial
distributions of kerogen. The effective electrical resistivity of organic-rich source

56
rocks decreased for both layered and dispersed kerogen when the electrical
conductivity of kerogen and volumetric concentration of kerogen increased.
However, a steeper decline was observed in layered spatial distribution of
kerogen compared to that of dispersed spatial distribution of kerogen. This
difference is attributed to the increased directional connectivity of kerogen
network in the layered case compared to the dispersed case.
• Results from Synthetic Case No. 2 illustrated the effect of spatial distribution and
connectivity of kerogen-water phase on electrical resistivity of organic-rich
source rock. The increased connectivity in 3D pore-scale representations of
organic-rich source rock had a significant impact on effective electrical
resistivity of the rock-fluid system. The effect of kerogen on effective electrical
resistivity of organic-rich source rock was observed at kerogen electrical
resistivities less than 1000 ohm-m (compared to 100 ohm-m in the case of 2D
images of organic-rich source rocks). Furthermore, it was observed that the
electrical resistivity of organic-rich source rocks decreased by 39% if
connectivity of kerogen-water network increased, while kerogen concentration
remained the same.
• Results from Synthetic Case No. 3 provided an empirical correlation between the
gas-filled kerogen porosity and effective electrical resistivity of kerogen-gas
system. This correlation can be used to estimate the effective electrical resistivity
of the kerogen-gas system at different thermal maturities.

57
• Synthetic Case No. 4 illustrated the significant impact of conductive kerogen on
effective electrical resistivity of organic-rich source rocks with gas-saturated
kerogen. Results from pore-scale numerical simulations showed a 10% - 23%
improvement in accuracy of water saturation estimates when the impact of
conductive kerogen was taken into account.
• The results reported in this thesis can be used to develop a new resistivity-
porosity-saturation model, which takes into account the presence of highly
mature conductive kerogen. This would significantly improve estimates of
hydrocarbon saturation as part of the combined petrophysical interpretation of
well logs in organic-rich source rocks.
5.3 Recommendations
The following provides recommendations for future work to expand on the work
reported in this thesis:
• The electrical resistivity of kerogen assumed in this thesis is 2-3 orders of
magnitude higher than the conductivities observed in pure organic semi-
conductors at reservoir temperature. However, accurate electrical resistivity
values for kerogen are required, which need to be obtained using laboratory
experiments.
• Finite difference based numerical simulator developed in this thesis was
restricted in terms of the grid size that can be used. Performing numerical
58
simulations become computationally expensive for grid numbers greater than
300x300x300. Application of parallel computing would help improve CPU time
and increase computational efficiency.
• Numerical simulations using finite difference methods in highly heterogeneous
porous media can be computationally expensive due to increased grid numbers.
Application of finite element methods or streamline-based numerical simulation
methods can decrease computational time compared to finite difference methods.
• This thesis studied the effect of kerogen conductivity, volumetric concentration
of kerogen, spatial distribution and connectivity of kerogen-water network, and
kerogen porosity on electrical resistivity measurements in organic-rich source
rocks. This research could be extended to study the impact of spatial distribution
and connectivity of pyrite, relative conductivity of clay to that of formation
water, and spatial connectivity of kerogen on electrical resistivity measurements.
It would then be possible to develop a new resistivity-porosity-saturation model
that takes into account the petrophysical, compositional, and electrical properties
of organic-rich source rocks.
59
REFERENCES
Alfred, D. and Vernik, L., 2012, A new petrophysical model for organic shales:
Transactions of the SPWLA 53rd Annual Logging Symposium, Cartagena, Columbia,
June 16-20.
Barwise, A. J. G., Mann, A. L., Eglinton, G., Gowar, A. P., Wardroper, A. M. K., and
Gutteridge, C. S., 1984, Kerogen characterization by 13C NMR spectroscopy and
pyrolysis-mass spectrometry: Organic Geochemistry, vol. 6, p. 343–349.
Dennis, L. W., Maciel, G. E., Hatcher, P. G., and Simoneit, B. R. T., 1982, 13C Nuclear
magnetic resonance studies of kerogen from Cretaceous black shales thermally altered
by basaltic intrusions and laboratory simulations: Geochimica et Cosmochimica Acta,
vol. 46, p. 901–907.
Hammes, U., Eastwood, R., Rowe, H. D., and Reed, R. M., 2009, Addressing
conventional parameters in unconventional shale-gas systems: depositional
environment, petrography, geochemistry, and petrophysics of the Haynesville Shale,
Unconventional energy resources: making the unconventional conventional: 29th
Annual GCSSEPM Foundation Bob F. Perkins Research Conference, p. 181–202,
Houston, December 6–8.
60
Heidari, Z., Torres-Verdin, C., and Pregg, W. E., 2012, Improved estimation of mineral
and fluid volumetric concentrations from well logs in thinly bedded and invaded
formations: Geophysics, vol. 77, no. 3, p. 79-98.
Heidari, Z., Torres-Verdin, C., and Pregg, W. E., 2011, Quantitative method for
estimating total organic carbon and porosity, and for diagnosing mineral constituents
from well logs in shale-gas formations: Transactions of the SPWLA 52nd Annual
Logging Symposium, Colorado Springs, Colorado, May 14-18.
Li, L., Meller, G., and Kosina, H., 2007, Temperature and field-dependence of hopping
conduction in organic semiconductors: Microelectronics Journal, vol. 38, p. 47-51.
Mao, J., Fang, X., Lan, Y., Schimmelmann, A., Mastalerz, M., Xu, L., and Schmidt-
Rohr, K., 2010, Chemical and nanometer-scale structure of kerogen and its change
during thermal maturation investigated by advanced solid-state 13C NMR
spectroscopy: Geochimica et Cosmochimica Acta, vol. 74, p. 2110-2127.
Meng, D., Ma, T. M., Geng, C. W., and Sun, Y., 2012, Test method and experimental
research on resistance of oil shale under high temperature: Global Geology, vol. 15(3),
p. 245-251.

61
Miknis, F. P., Smith, J. W., Maughan, E. K., and Maciel, G. E., 1982, Nuclear magnetic
resonance: a technique for direct nondestructive evaluation of source-rock
potential: AAPG Bulletin-American Association of Petroleum Geologists, vol. 66, p.
1396–1401.
Miknis, F. P., Jiao, Z. S., Macgowan, D. B., and Surdam, R. C., 1993, Solid-state NMR
characterization of Mowry shale from the Powder River Basin: Organic
Geochemistry, vol. 20, p. 339–347.
Passey, Q. R., Creaney, S., Kulla, J. B., Moretti, F. J., and Stroud, J. D., 1990, A
practical model for organic richness from porosity and resistivity logs: The American
Association of Petroleum Geologists, vol. 74, no. 12, p. 1777-1794.
Passey, Q. R., Bohacs, K. M., Esch, W. L., Klimentidis, R., and Sinha, S., 2010, From
oil-prone source rock to gas-producing shale reservoir – geologic and petrophysical
characterization of unconventional shale-gas reservoirs: Paper SPE 131350,
Proceedings of the CPS/SPE International Oil and Gas Conference and Exhibition,
Beijing, China, 8–10 June.
Patience, R. L., Mann, A. L., and Poplett, I. J. F., 1992, Determination of molecular

62
structure of kerogens using 13C NMR spectroscopy: II. The effects of thermal
maturation on kerogens from marine sediments: Geochimica et Cosmochimica Acta,
vol. 56, p. 2725–2742.
Quirein, J., Witkowsky, J., Truax, J., Galford, J., Spain, D., and Odumosu, T. 2010,
Integrating core data and wireline geochemical data for formation evaluation and
characterization of shale gas reservoirs: Paper SPE 134559, Proceedings of the SPE
Annual Technical Conference and Exhibition, Florence, Italy, 19-22 September.
Rajeshwar, K., Das, M., and Dubow, J., 1980, D.C. electrical conductivity of Green
River oil shales: Nature, vol. 287, p. 131-133.
Ramirez, T. R., Klein, J. D., Bonnie, R. J. M., and Howard, J. J., 2011, Comparative
study of formation evaluation methods for unconventional shale-gas reservoirs:
application to the Haynesville Shale (Texas): Paper SPE 144062, Proceedings of the
SPE North American Unconventional Gas Conference and Exhibition, The
Woodlands, Texas, USA, 14-16 June.
Requejo, A. G., Gray, N. R., Freund, H., Thomann, H., Melchior, M. T., Gebhard, L. A.,
Bernardo, M., Pictroski, C. F., and Hsu, C. S., 1992, Maturation of petroleum source

63
rocks. 1. Changes in kerogen structure and composition associated with hydrocarbon
generation: Energy & Fuels, vol. 6, p. 203–214.
Smernik, R. J., Schwark, L., and Schmidt, M. W. I., 2006, Assessing the quantitative
reliability of solid-state C-13 NMR spectra of kerogens across a gradient of thermal
maturity: Solid State Nuclear Magnetic Resonance, vol. 29, p. 312–321.
Solli, H., Van Graas, G., Leplat, P., and Krane, J., 1984, Analysis of kerogens of
miocene shales in a homogenous sedimentary column. A study of maturation using
flash pyrolysis techniques and carbon-13 CP-MAS NMR: Organic Geochemistry, vol.
6, p. 351–358.
Sondergeld, C. H., Newsham, K. K., Comisky, J. T., Rice, M. C., and Rai, C. S., 2010,
Petrophysical considerations in evaluating and producing shale gas resources: Paper
SPE 131768, Proceedings of the SPE Unconventional Gas Conference, Pittsburg,
Pennsylvania, USA, 23-25 February.
Wei, Z. B., Gao, X. X., Zhang, D. J., and Da, J., 2005, Assessment of thermal evolution
of kerogen geopolymers with their structural parameters measured by solid-state C-13
NMR spectroscopy: Energy & Fuels, vol. 19, p. 240–250.

64
Werner-Zwanziger, U., Lis, G., Mastalerz, M., and Schimmelmann, A., 2005, Thermal
maturity of type II kerogen from the New Albany Shale assessed by C-13 CP/MAS
NMR: Solid State Nuclear Magnetic Resonance, vol. 27, p. 140–148.
Witte, E. G., Schenk, H. J., Muller, P. J., and Schwochau, K., 1988, Structural
modifications of kerogen during natural evolution as derived from 13C CP/MAS
NMR, IR spectroscopy and Rock-Eval pyrolysis of Toarcian shales: Organic
Geochemistry, vol. 13, p. 1039–1044.