quantifying fluorescent glycan uptake to elucidate strain
TRANSCRIPT

RESEARCH Open Access
Quantifying fluorescent glycan uptake toelucidate strain-level variability in foragingbehaviors of rumen bacteriaLeeann Klassen1,2†, Greta Reintjes1,3†, Jeffrey P. Tingley1, Darryl R. Jones1, Jan-Hendrik Hehemann3,4,Adam D. Smith1, Timothy D. Schwinghamer1, Carol Arnosti5, Long Jin1, Trevor W. Alexander1, Carolyn Amundsen1,Dallas Thomas1, Rudolf Amann3, Tim A. McAllister1 and D. Wade Abbott1,2*
Abstract
Gut microbiomes, such as the microbial community that colonizes the rumen, have vast catabolic potential andplay a vital role in host health and nutrition. By expanding our understanding of metabolic pathways in theseecosystems, we will garner foundational information for manipulating microbiome structure and function toinfluence host physiology. Currently, our knowledge of metabolic pathways relies heavily on inferences derivedfrom metagenomics or culturing bacteria in vitro. However, novel approaches targeting specific cell physiologiescan illuminate the functional potential encoded within microbial (meta)genomes to provide accurate assessmentsof metabolic abilities. Using fluorescently labeled polysaccharides, we visualized carbohydrate metabolismperformed by single bacterial cells in a complex rumen sample, enabling a rapid assessment of their metabolicphenotype. Specifically, we identified bovine-adapted strains of Bacteroides thetaiotaomicron that metabolized yeastmannan in the rumen microbiome ex vivo and discerned the mechanistic differences between two distinctcarbohydrate foraging behaviors, referred to as “medium grower” and “high grower.” Using comparative whole-genome sequencing, RNA-seq, and carbohydrate-active enzyme fingerprinting, we could elucidate the strain-levelvariability in carbohydrate utilization systems of the two foraging behaviors to help predict individual strategies ofnutrient acquisition. Here, we present a multi-faceted study using complimentary next-generation physiology and“omics” approaches to characterize microbial adaptation to a prebiotic in the rumen ecosystem.
Keywords: Microbiome, Carbohydrate, Rumen, Glycoside hydrolase, Fluorescent polysaccharides, Yeast mannan,Bacteroides
BackgroundRuminants have evolved foregut digestive systems spe-cialized in the bioconversion of recalcitrant, complexcarbohydrates into energy. These catabolic processes relyon a core bacterial community composed predominantly
of the genera Prevotella, Butyrivibrio, Fibrobacter, andRuminococcus, families Lachnospiraceae and Ruminococ-caceae, and orders Bacteroidales and Clostridiales [1, 2].The rumen microbiome is estimated to contain 69,000carbohydrate-active enzyme (CAZyme) genes [3] thatencode extensive catalytic activities. Despite this vastgenetic repertoire and catalytic potential, the microbialconversion of plant fiber to host-accessible metabolitesin the rumen is suboptimal and could be improved [4,5]. For example, supplementation with direct fed micro-organisms, such as Bacteroides spp., or prebiotic
© The Author(s). 2021 Open Access This article is licensed under a Creative Commons Attribution 4.0 International License,which permits use, sharing, adaptation, distribution and reproduction in any medium or format, as long as you giveappropriate credit to the original author(s) and the source, provide a link to the Creative Commons licence, and indicate ifchanges were made. The images or other third party material in this article are included in the article's Creative Commonslicence, unless indicated otherwise in a credit line to the material. If material is not included in the article's Creative Commonslicence and your intended use is not permitted by statutory regulation or exceeds the permitted use, you will need to obtainpermission directly from the copyright holder. To view a copy of this licence, visit http://creativecommons.org/licenses/by/4.0/.The Creative Commons Public Domain Dedication waiver (http://creativecommons.org/publicdomain/zero/1.0/) applies to thedata made available in this article, unless otherwise stated in a credit line to the data.
* Correspondence: [email protected]†Leeann Klassen and Greta Reintjes contributed equally to this work.1Lethbridge Research and Development Centre, Agriculture and Agri-FoodCanada, 5403-1st Avenue South, Lethbridge, Alberta T1J 4B1, Canada2Department of Biological Sciences, University of Lethbridge, Lethbridge,Alberta T1K 3M4, CanadaFull list of author information is available at the end of the article
Klassen et al. Microbiome (2021) 9:23 https://doi.org/10.1186/s40168-020-00975-x
carbohydrates that modify the rumen microbiome to en-hance feed conversion may help address the emergingchallenges associated with sustainable production offood animals [6].In diverse animal symbioses and environmental ecosys-
tems, Bacteroides spp. and other members of Bacteroidetesare thought to play central roles in glycan digestion becausethey encode highly specialized carbohydrate metabolic sys-tems called polysaccharide utilization loci (PULs) [7, 8].The first described PUL was the starch utilization system ofBacteroides thetaiotaomicron (B. theta: BtVPI-5482) [9],and since its description, PULs that metabolize glycans withunique chemistries have been found in diverse ecosystems[8, 10–12]. PULs are distinguished by the presence of aTonB-dependent transporter coupled to a surface glycan-binding protein, known as the SusC/D-like complex, andother associated proteins that modify or bind the target gly-can. These gene products function together in an orches-trated cascade to transport oligosaccharides into theperiplasm where monosaccharides are released from poly-meric substrates and used for primary metabolism. PULscan operate through a “distributive” mechanism, which re-leases products [13] to the microbial community or a “self-ish” mechanism [14], which limits product loss byconfining substrate depolymerization within the cell [8, 15].Recently, PUL-prediction [16] and whole-PULcharacterization [14, 17] have become common approachesfor the discovery of new CAZyme families and catalytic ac-tivities at the species [18] and strain levels [19, 20]. Themost common enzymes encoded within PULs are glycosidehydrolases (GHs), which cleave glycosidic bonds by acid-base catalysis [21]. GHs are divided into sequence-relatedfamilies that display conserved folds, mechanisms, and cata-lytic residues. However, these features are not necessarilyrepresentative of function as many different GH familiesare polyspecific [22].In addition to microorganisms that improve the effi-
ciency of digestion, prebiotic glycans, such as yeast α-mannan (YM) and its derivative oligosaccharides (i.e., α-mannanoligosaccharides), are known to provide benefi-cial physiological outcomes to animals, such as cattleand pigs [23–25]. Prebiotics can enhance feed digestionand cattle health by becoming selective nutrients forsymbiotic gut bacteria, such as Bacteroides spp. The di-gestion of YM requires a collection of CAZymes target-ing distinct linkages using different modes of activity,including α-mannanases and α-mannosidases [15].CAZymes that possess these activities are commonlyfound in family GH38, GH76, GH92, GH99, and GH125[14, 26, 27], and correspondingly, these enzymes arepresent in PULs that target YM (i.e., MAN-PULs).YM-specific CAZymes and PULs are widely distrib-
uted in Bacteroidetes; however, individual species differin their abilities to consume α-mannans depending on
the structural complexity of the substrate [14]. For ex-ample, Bacteroides xylanisolvens NLAE-zl isolated frompigs reared on a diet infused with distillers’ grains couldonly metabolize debranched YM [14]. The pathway re-sponsible for YM catabolism in these strains (i.e., MAN-PUL1) was encoded on a transposable element, suggest-ing that aspects of YM metabolism can be exchangedbetween strains [14]. This finding is consistent with re-ports of specialized metabolic abilities being transferredto intestinal Bacteroides spp. from species that occupyecologically distinct habitats [19, 20, 28], facilitating theirpersistence within highly competitive ecosystems andadaption to spatially and culturally diversified diets.Although major advances have been made in under-
standing the diversity of metabolic potential in symbioticbacteria and the mechanisms of prebiotic utilization, es-tablishing stable engineered microbiomes in complexecosystems, such as the rumen, will require more de-tailed knowledge of the competitive and complementaryprocesses that drive metabolic phenotypes at the strainlevel. To achieve this, “next-generation physiology”-based [29] approaches that identify metabolic potentialsof individual bacteria, thereby providing critical insightsof cellular functions and assigning cellular phenotypes,must be developed. One such approach is fluorescentlylabeled polysaccharides (FLA-PS). FLA-PS were initiallydeveloped to demonstrate selfish uptake of marine poly-saccharides in marine Bacteroidetes [30] and have alsobeen applied to the gut bacterium BtVPI-5482 to con-firm that YM metabolism also occurs through a selfishmechanism [31]. Fluorescent glucose analogs have beenrecently used to study glucose uptake by rumen bacteria[32]; however, use of fluorescent polysaccharides in therumen has been limited until now.Here, for the first time, we apply FLA-PS as a next-
generation physiology approach to directly visualize YMmetabolism by single cells in a complex rumen commu-nity and subsequently classify populations of cells usingfluorescence in situ hybridization (FISH). We combinethis analysis with a multi-tiered study of the evolutionand function of YM metabolism in bovine-adapted B.theta strains (BtBov), which adopt one of two dichotom-ous growth phenotypes, referred to as “High Grower”(HG) or “Medium Grower” (MG), based on the opticaldensity of cultures after 24 h. Despite displaying distinctgrowth profiles, the genetic, transcriptomic, or biochem-ical factors that contributed to the differential growthphenotypes of these strains remained to be defined.Using genomics, transcriptomics, and CAZyme finger-printing, multiple MAN-PUL architectures were identi-fied in this study that are consistent with reports forhuman-associated BtVPI-5482 [14] and key differencesin the YM utilization systems between MGs and HGswere revealed. To define the mechanisms that contribute
Klassen et al. Microbiome (2021) 9:23 Page 2 of 18
to these growth phenotypes, we present a new quantita-tive application of FLA-PS, which we believe has far-reaching implications for elucidating differences in sub-strate utilization of individual cells within complex mi-crobial communities.
ResultsEx vivo visualization of YM-metabolizing taxa within therumen communityTo assess the capability of rumen microbiota tometabolize YM, extracted rumen samples were incu-bated with FLA-YM and visualized on feed particles andin solution (Fig. 1a, b). The total cell density in 100 μmpre-filtered rumen fluid, as determined by enumeratingDAPI-stained cells, was 2.98 × 10⁸ ± 6.02 × 10⁷ cellsml−1 (Fig. 1c). In these complex communities, on aver-age 6.1% ± 0.5% of cells showed uptake of FLA-YM (0%after 15 min, 6% after 3 h, 7% after 1 day, 6% after 3days). Fluorescence in situ hybridization (FISH) usingthe CF968 probe [33] specific for the phylum Bacteroi-detes showed that 2.9 ± 0.5% of the cells showing FLA-YM uptake were members of the Bacteroidetes. In total,Bacteroidetes made up 34.8% ± 6.8% of the rumen bac-terial community and only a fraction of these (~ 3%)showed uptake of FLA-YM (Fig. 1c). The microbial com-munity composition of these rumen samples was deter-mined by 16S rRNA metagenomics sequencing. Thecommunity was dominated by Bacteroidetes, specificallythe genus Prevotella 1, which demonstrated that YMmetabolism has penetrated distantly related members ofthe phylum (Fig. 1d).
Isolation and growth profiling of YM-utilizing BtBov strainsTargeted isolation approaches were performed to select-ively isolate bovine-adapted-bacteria that utilize Saccha-romyces cerevisiae YM from enriched rumen and fecalcommunities. Single colonies were observed within 24 h,with new colonies forming up to 96 h. In total, 50 bac-terial isolates were collected and each mannan-degrading (MD) isolate was assigned a reference number(e.g., isolate #8 = MD8). The majority of these isolateswere identified by 16S rRNA gene sequencing as strainsof B. theta using the NCBI BLASTN database [34], andreferred to as BtBov (Fig. 2a, Supplementary Table 1).YM metabolism was confirmed for each MD strain by
growth in liquid cultures using S. cerevisiae YM as thesole carbon source (Fig. 2b, Supplementary Fig. 1). Inter-estingly, based on their growth on S. cerevisiae YM, theBtBov isolates and BtVPI-5482 control strain were di-vided into two populations (Supplementary Table 2):“Medium Growers” (MGs; plateaued growth at OD600 ~0.4 after 24 h) and “High Growers” (HGs; plateauedgrowth at OD600 ~ 0.7 after 24 h). Notably, this growthphenotype is substrate specific and does not extend to
other substrates, such as mannose in which all strainshave a similar growth curve (data not shown), and YMfrom Schizosaccharomyces pombe (S. pombe; Supple-mentary Fig. 1b). In addition, the 16S rRNA gene top-ology of the BtBov isolates did not reveal a discernablerelationship with the growth phenotype (Fig. 2a).
Visualization and quantification of differential FLA-YMuptake by BtBov isolatesTo determine if the rate of glycan uptake varied betweenthe two growth types, representative strains, one fromeach growth population and BtVPI-5482 as a control,were incubated with FLA-YM. BtVPI-5482, MD33MG, andMD40HG cells became fluorescent, whereas cells incu-bated with unlabeled YM did not (Fig. 2c). Phenotypic dif-ferences in FLA-YM uptake over time were determined bysplitting cell populations by flow cytometric gating intoFLA-positive and FLA-negative cells (Supplementary Fig.2a). The total fluorescence intensity (rate of uptake) wassignificantly different between the representative strains(MD40HG vs. MD33MG t(10) = 4.4, p value = 0.001;MD40HG vs. BtVPI-5482 t(10) = 3.9, p value = 0.003;BtVPI-5482 vs. MD33MG t(10) = 4.0, p value = 0.002) (Fig.2d). The change in mean fluorescence of the three strainsshowed a similar temporal pattern, increasing from 0 to120min, peaking at 120min, and declining from 120 to1440min (Fig. 2e). Although all three strains showed up-take of FLA-YM after 60min, MD33MG had the lowestfluorescence intensity at each time point. MD40HG dis-played the highest fluorescence intensity, 2.7-fold higherthan MD33MG. BtVPI-5482 displayed a fluorescence in-tensity between the two bovine strains for each time point,with a peak value 1.9-fold higher than MD33MG. Add-itionally, MD40HG cells showed a more rapid uptake (22%at 5min), BtVPI-5482 cells showed an intermediate rateof uptake (9% at 5min), and MD33MG had the slowest up-take rate (2% at 5 min) (Fig. 2e, Supplementary Fig. 2b).To test if the phenotypic differences were inherited be-
tween generations, we measured the differences in FLA-YM uptake with and without prior exposure to YM. Thecultures continued to display the same phenotypic up-take patterns (MD40HG and BtVPI-5482 higher uptake,MD33MG low uptake, Fig. 3a–c). However, previous ex-posure to YM resulted in a heightened cellular responseas indicated by more rapid rates of FLA-YM uptake rela-tive to cultures previously grown on mannose-MM (Fig.3b–d). All cultures grown on mannose-MM reached alower mean fluorescence and the temporal change inmean fluorescence was slower, with quantifiable uptakeoccurring only after 4 to 8 h.
Characterization of genotypes by PUL delineationWhole-genome sequencing and de novo assembly wereused to identify genes involved in YM metabolism.
Klassen et al. Microbiome (2021) 9:23 Page 3 of 18

Fig. 1 YM utilization by BtBov isolates. Images of a 100 μm on food particles and b 10 μm filtered rumen extract incubated with FLA-YM andstained with DAPI and Bacteroides-FISH probe (FISH-CF968). Cells were visualized by epifluorescence microscopy. c Counts of cells from FLA-YMincubated rumen extract stained with DAPI, FISH-CF968, FLA-YM, and both FISH-CF968 and FLA-YM. Mean ± standard deviation shown. d 16SrRNA metagenomics sequencing data of extracted rumen communities showing most prevalent phyla (left) and the distribution of Bacteroidetesspp. (right). N = 4
Klassen et al. Microbiome (2021) 9:23 Page 4 of 18

SPAdes [35] assembly output and average nucleotide iden-tity based on BLAST+ (ANIb) [36] are shown in Supple-mentary Table 2. The ANIb results supported the 16SrRNA gene sequence data, confirming that each isolate wasa strain of B. theta. Furthermore, comparative genomics re-vealed that these strains have acquired unique CAZome re-positories (Fig. 4a) and PUL updates (Supplementary Fig.3); features that may assist with their colonization of thebovine gut and represents opportunities for developingbovine-adapted probiotics (Supplementary Discussion).
Reconstruction of the three YM-specific PULs andalignment with BtVPI-5482 MAN-PULs determined thatthere was a high level of synteny among all strains inthese pathways (Supplementary Fig. 4a). MAN-PUL2and MAN-PUL3 were absolutely conserved, whereasMAN-PUL1, a PUL tailored for the consumption ofmannan from S. pombe [14] (Supplementary Fig. 1b),was only present in BtVPI-5482, MD33MG, andMD35MG. The presence of MAN-PUL1 in two MGs in-dicated this pathway was not responsible for the HG
Fig. 2 Characterization of BtBov isolates. a 16S rRNA gene sequence comparison of BtVPI-5482 and BtBov strains. Scale represents number ofnucleotide changes across horizontal axis. b Growth profiles of BtVPI-5482, BtΔMAN-PUL1/2/3, MD33MG, and MD40HG grown on 0.5% YM-MM. cSR-SIM of B. theta strains 0-min and 60-min post-incubation with FLA-YM. Cells co-stained with Nile Red and DAPI. d Mean fluorescence ofbacterial cells cultured in FLA-YM or YM-MM (control). **p value < 0.01; ***p value < 0.001; ns p value > 0.05. e Bars represent percentage of totalcells showing an uptake of FLA-YM in cultures sampled over time. Green = increased FLA-YM uptake; grey = no uptake. Mean cell fluorescencerepresented by line graph; solid line = mean of cells with FLA-YM signal; dotted line = mean of cells showing no FLA-YM uptake
Klassen et al. Microbiome (2021) 9:23 Page 5 of 18

phenotype. The HMNG-PUL, which is specific for diges-tion of high mannose N-glycans and not activated byYM in BtVPI-5482 [14], was also conserved in each ofthe BtBov genomes.
CAZome fingerprintingTo determine if there was amino acid sequence diver-gence within MAN-PULs, and potentially the functionof homologous enzymes, polyspecific CAZyme familiesGH92 and GH76 were analyzed by SACCHARIS [37].Enzyme sequences from GH92 and GH76 wereembedded into phylogenetic trees comprised of all char-acterized enzyme sequences from each family (Supple-mentary Fig. 4b, c). Notably, every sequence withinMAN-PUL1, MAN-PUL2, and MAN-PUL3 displayedthe highest level of amino acid sequence conservationwith its syntenic homolog. This suggested that each PULis under strong selective pressure to function as an in-tact catabolic system. To determine if CAZyme se-quences were conserved in other potential α-mannan-degrading PULs, a genome-wide approach (i.e., CAZomefingerprinting) was used [37]. Each isolate encoded be-tween twenty-four and twenty-six GH92s and eight ornine GH76s (Fig. 4b, Supplementary Fig. 4b,c). OnlyMD17HG and MD51HG displayed identical conservationfor GH76, whereas every GH92 tree was unique.
Topological differences were observed for other α-mannan active enzyme families (e.g., GH38, GH99, andGH125), suggesting that despite the high level of func-tional conservation within the MAN-PULs, metabolicspecialization in α-mannan consumption between thesestrains may be encoded within orphan PULs [38]. There-fore, the contributions of two exogenous GH76s to theforaging behavior of HGs and MGs were investigated.BtGH76-MD40 is a surface-exposed GH76 inserted intoPUL55 of HGs (Fig. 4b) and is active on intact S. cerevi-siae and S. pombe YM [39]. BT_3782 is a periplasmicendo-α-mannanase that generates small oligosaccharideproducts [14]. Addition of recombinant BtGH76-MDand BT_3782 to pure cultures of MD33MG did not aug-ment the MG growth phenotype (Supplementary Fig. 5),suggesting that acquisition of BtGH76-MD40 or aug-mented endo-mannanase activity were not responsiblefor the HG phenotype.
Differences in YM import between phenotypesThe differential transport kinetics of FLA-YM (Fig. 2c–e) and absence of genetic differences in PUL structurebetween phenotypes (Supplementary Fig. 4a) suggestedthat glycan transport processes may be responsible forthe MG and HG growth phenotypes. Alignment of theSusC-like amino acid sequences from MAN-PULs 1, 2,
Fig. 3 Reproducible YM foraging behaviors in BtBov isolates. a Growth profiles of MD33MG and MD40HG inoculated from cultures cultivatedovernight on mannose-MM (1°) or YM-MM (2°). b Fluorescence intensity of individual cells of BtBov strains incubated in FLA-YM. Cells used toinoculate FLA-YM cultures were previously grown overnight in either YM-MM or Mannose-MM (Man) (N = 1). c Mean fluorescence of cellscultured in FLA-YM with significance (p < 0.05) between the cultures previously grown on YM (right) indicated by asterisk (N = 10,000). d SR-SIMimages of BtVPI-5482, MD33MG, and MD40HG cultured in Man or YM and incubated with FLA-YM
Klassen et al. Microbiome (2021) 9:23 Page 6 of 18

and 3 and HMNG-PUL from BtVPI-5482, MD33MG,and MD40HG revealed that proteins cluster into func-tional clades (Fig. 5a). Furthermore, when the SusC-like
and SusD-like transport proteins from each MD strainwere aligned with BT_3788 (Fig. 5b) and BT_3789 (Fig.5c) of BtVPI-5482, respectively, the proteins partitioned
Fig. 4 CAZyme fingerprinting of YM metabolism by BtBov isolates. a GH enzyme families encoded within the genomes of MD40HG and MD33MG
that differ in total number of sequences. BtVPI-5482 sequences are provided as a reference for each GH family. b Phylogenetic trees ofcharacterized GH92s and GH76s, and BtBov sequences generated with SACCHARIS [37]. Circles represent BtBov sequences and white circleshighlight sequences from PULs with mannan activity: 1, 2, or 3 = MAN-PULs 1, 2, or 3, respectively; H = HMNG-PUL; 55 = BtMD40 PUL55.Activities assigned to characterized enzymes within each clade for GH92 and GH76 are depicted using the provided legend. Outer ring representscharacterized specificities. Numbers in parenthesis indicate the total number of enzymes within each strain
Klassen et al. Microbiome (2021) 9:23 Page 7 of 18
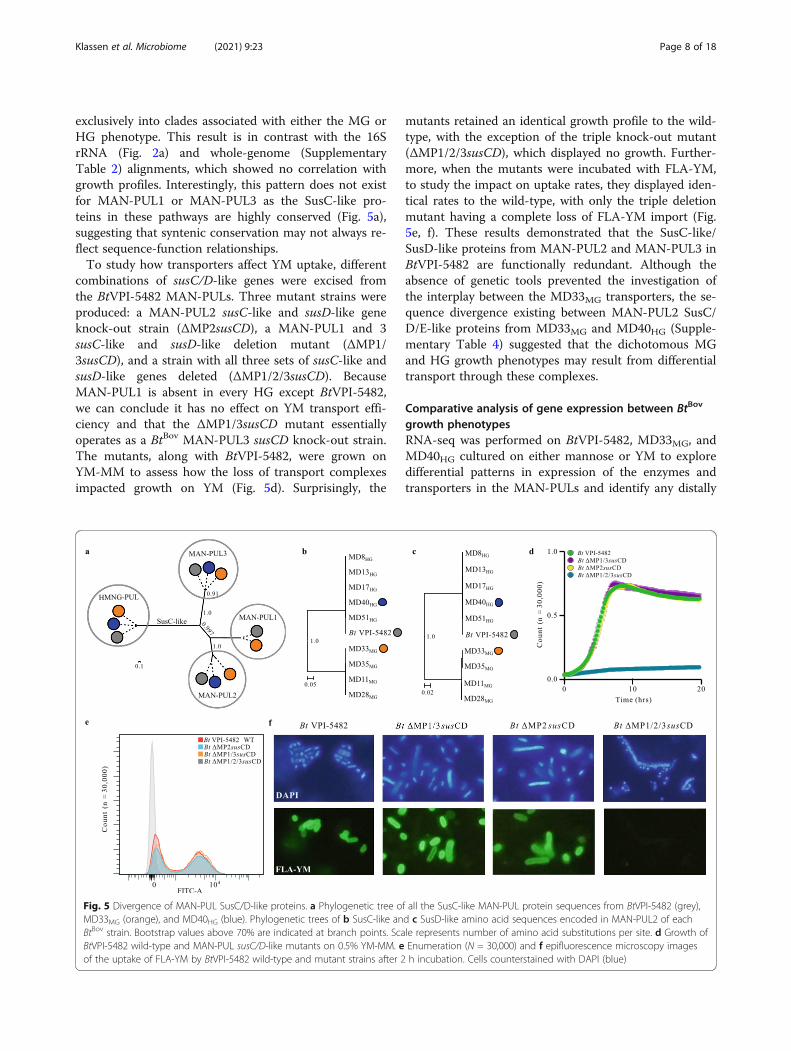
exclusively into clades associated with either the MG orHG phenotype. This result is in contrast with the 16SrRNA (Fig. 2a) and whole-genome (SupplementaryTable 2) alignments, which showed no correlation withgrowth profiles. Interestingly, this pattern does not existfor MAN-PUL1 or MAN-PUL3 as the SusC-like pro-teins in these pathways are highly conserved (Fig. 5a),suggesting that syntenic conservation may not always re-flect sequence-function relationships.To study how transporters affect YM uptake, different
combinations of susC/D-like genes were excised fromthe BtVPI-5482 MAN-PULs. Three mutant strains wereproduced: a MAN-PUL2 susC-like and susD-like geneknock-out strain (ΔMP2susCD), a MAN-PUL1 and 3susC-like and susD-like deletion mutant (ΔMP1/3susCD), and a strain with all three sets of susC-like andsusD-like genes deleted (ΔMP1/2/3susCD). BecauseMAN-PUL1 is absent in every HG except BtVPI-5482,we can conclude it has no effect on YM transport effi-ciency and that the ΔMP1/3susCD mutant essentiallyoperates as a BtBov MAN-PUL3 susCD knock-out strain.The mutants, along with BtVPI-5482, were grown onYM-MM to assess how the loss of transport complexesimpacted growth on YM (Fig. 5d). Surprisingly, the
mutants retained an identical growth profile to the wild-type, with the exception of the triple knock-out mutant(ΔMP1/2/3susCD), which displayed no growth. Further-more, when the mutants were incubated with FLA-YM,to study the impact on uptake rates, they displayed iden-tical rates to the wild-type, with only the triple deletionmutant having a complete loss of FLA-YM import (Fig.5e, f). These results demonstrated that the SusC-like/SusD-like proteins from MAN-PUL2 and MAN-PUL3 inBtVPI-5482 are functionally redundant. Although theabsence of genetic tools prevented the investigation ofthe interplay between the MD33MG transporters, the se-quence divergence existing between MAN-PUL2 SusC/D/E-like proteins from MD33MG and MD40HG (Supple-mentary Table 4) suggested that the dichotomous MGand HG growth phenotypes may result from differentialtransport through these complexes.
Comparative analysis of gene expression between BtBov
growth phenotypesRNA-seq was performed on BtVPI-5482, MD33MG, andMD40HG cultured on either mannose or YM to exploredifferential patterns in expression of the enzymes andtransporters in the MAN-PULs and identify any distally
Fig. 5 Divergence of MAN-PUL SusC/D-like proteins. a Phylogenetic tree of all the SusC-like MAN-PUL protein sequences from BtVPI-5482 (grey),MD33MG (orange), and MD40HG (blue). Phylogenetic trees of b SusC-like and c SusD-like amino acid sequences encoded in MAN-PUL2 of eachBtBov strain. Bootstrap values above 70% are indicated at branch points. Scale represents number of amino acid substitutions per site. d Growth ofBtVPI-5482 wild-type and MAN-PUL susC/D-like mutants on 0.5% YM-MM. e Enumeration (N = 30,000) and f epifluorescence microscopy imagesof the uptake of FLA-YM by BtVPI-5482 wild-type and mutant strains after 2 h incubation. Cells counterstained with DAPI (blue)
Klassen et al. Microbiome (2021) 9:23 Page 8 of 18
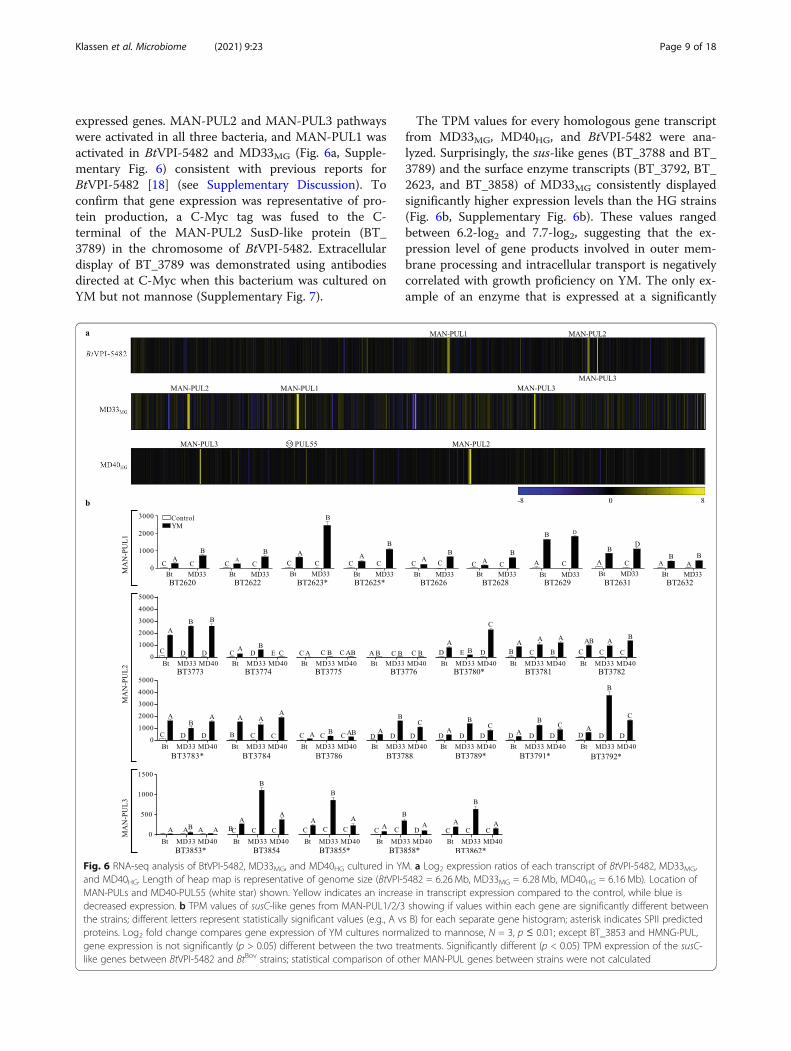
expressed genes. MAN-PUL2 and MAN-PUL3 pathwayswere activated in all three bacteria, and MAN-PUL1 wasactivated in BtVPI-5482 and MD33MG (Fig. 6a, Supple-mentary Fig. 6) consistent with previous reports forBtVPI-5482 [18] (see Supplementary Discussion). Toconfirm that gene expression was representative of pro-tein production, a C-Myc tag was fused to the C-terminal of the MAN-PUL2 SusD-like protein (BT_3789) in the chromosome of BtVPI-5482. Extracellulardisplay of BT_3789 was demonstrated using antibodiesdirected at C-Myc when this bacterium was cultured onYM but not mannose (Supplementary Fig. 7).
The TPM values for every homologous gene transcriptfrom MD33MG, MD40HG, and BtVPI-5482 were ana-lyzed. Surprisingly, the sus-like genes (BT_3788 and BT_3789) and the surface enzyme transcripts (BT_3792, BT_2623, and BT_3858) of MD33MG consistently displayedsignificantly higher expression levels than the HG strains(Fig. 6b, Supplementary Fig. 6b). These values rangedbetween 6.2-log2 and 7.7-log2, suggesting that the ex-pression level of gene products involved in outer mem-brane processing and intracellular transport is negativelycorrelated with growth proficiency on YM. The only ex-ample of an enzyme that is expressed at a significantly
Fig. 6 RNA-seq analysis of BtVPI-5482, MD33MG, and MD40HG cultured in YM. a Log2 expression ratios of each transcript of BtVPI-5482, MD33MG,and MD40HG. Length of heap map is representative of genome size (BtVPI-5482 = 6.26 Mb, MD33MG = 6.28 Mb, MD40HG = 6.16 Mb). Location ofMAN-PULs and MD40-PUL55 (white star) shown. Yellow indicates an increase in transcript expression compared to the control, while blue isdecreased expression. b TPM values of susC-like genes from MAN-PUL1/2/3 showing if values within each gene are significantly different betweenthe strains; different letters represent statistically significant values (e.g., A vs B) for each separate gene histogram; asterisk indicates SPII predictedproteins. Log2 fold change compares gene expression of YM cultures normalized to mannose, N = 3, p ≤ 0.01; except BT_3853 and HMNG-PUL,gene expression is not significantly (p > 0.05) different between the two treatments. Significantly different (p < 0.05) TPM expression of the susC-like genes between BtVPI-5482 and BtBov strains; statistical comparison of other MAN-PUL genes between strains were not calculated
Klassen et al. Microbiome (2021) 9:23 Page 9 of 18

higher level in the MD40HG strain was BT_3780 (12.5-fold higher than MD33MG), which encodes a GH130 thatis active on β-1,2-mannosides [40].
Differences in YM hydrolysis and importThe enzymatic processing of YM (amount of YM prod-ucts, extent of YM utilization, and total free mannosepresent in the post-growth supernatants) by each culturewas analyzed using a combination of methods. Thinlayer chromatography (TLC) (Fig. 7a) revealed that therewas no detectable free mannooligosaccharides or man-nose in the supernatant of the YM-MM negative control.Consistent with this observation, the BtMAN-PUL1/2/3deletion mutant (ΔMAN-PUL1/2/3) did not grow onYM and was unable to release products into themedium. BtVPI-5482 and each of the HGs generated asimilar product profile, with a noticeable loss of YM sig-nal and faint detection of oligosaccharides and mannose.In contrast, the post-growth media of MGs containedmore mannose and had residual YM (Fig. 7a). Gaschromatography-mass spectrometry determined that thequantity of total mannosides (YM and oligosaccharides)in the supernatant was 1.48 and 1.40-fold higher forMD33MG (1.36 ± 0.29) than BtVPI-5482 (0.92 ± 0.04)and MD40HG (0.97 ± 0.05), respectively (Fig. 7b). Fur-thermore, post-growth BtVPI-5482 and MD40HG cul-tures, but not MD33MG, showed (p < 0.05) lower totalmannose concentration in the media relative to the YM-MM negative control (Fig. 7b). This suggests that, con-sistent with their higher growth densities (Fig. 2b) andthin layer chromatography, BtVPI-5482 and MD40HG
consume more YM.To determine if surface α-mannanases generate differ-
ent product profiles, cultures of BtVPI-5482, MD33MG,and MD40HG were incubated with FLA-YM and theproducts were analyzed by fluorescence-coupled high-
performance liquid chromatography. In BtVPI-5482 andMD40HG, there was preferential hydrolysis of large FLA-YM products (> 10 kDa, ~ 55-mer), which was accom-panied by a relative accumulation of lower molecularweight (< 4 kDa; ~ 22-mer) hydrolysis products (Fig. 7c,Supplementary Fig. 8).
DiscussionThe gut microbiome plays an integral role in digestionand nutrient acquisition. Improved understanding of thefunctional potential encoded within members of themicrobiota is still required to define metabolic abilitiesand microbial-prebiotic interactions. Next-generationphysiology approaches represent promising strategies torapidly assign cellular phenotypes and can consolidategenomic predictions [29]. By combining phenotypic andsequencing approaches, we have conducted a high-resolution study of differential YM utilization by isolatedbovine-associated bacterial strains. In liquid culture, theisolates displayed one of two growth patterns: MG orHG; trends that were independent of taxonomic rela-tionships (Fig. 2a, b, Supplementary Table 2). Thisshowed that closely related Bacteroides spp. have evolveddifferent foraging strategies for the same substrate. FLA-PS were successfully used to visualize (Fig. 2c) and quan-tify the accumulation (Fig. 2d) and uptake rate (Fig. 2e)of YM products in bacterial cells, confirming that HGsuse a selfish mode of metabolism on this substrate, aspreviously reported for BtVPI-5482 [14, 31]. In contrast,the MG strains consumed less YM and released man-nose into the medium (Fig. 7a, b), suggesting that MGsare less adept at YM catabolism and display some prop-erties consistent with distributive metabolism (Figs. 2band 7c).Comparative genomics revealed genotypes with high
synteny across genomes and MAN-PUL pathways, with
Fig. 7 Differential transport of YM by BtBov strains. a TLC analysis of post-growth supernatants (50 h) of MD isolates grown on 0.5% YM-MM. B.theta = BtVPI-5482, ΔMAN = BtΔMAN-PUL1/2/3, Man = mannose standard. b Quantification of total mannose (free and polymerized) insupernatants of BtVPI-5482, MD33MG, and MD40HG grown in 0.5% YM-MM for 21 h. Normalized to a no-cell control, N = 2, asterisk indicatessignificant difference (p < 0.05) relative to control. c Percent distribution of FLA-YM hydrolysis products in the supernatants of BtVPI-5482,MD33MG, and MD40HG grown in 0.2% FLA-YM over time. N = 3
Klassen et al. Microbiome (2021) 9:23 Page 10 of 18

few exceptions. Perhaps the most interesting geneticanomaly is the sequence variability of the MAN-PUL2SusC/D-like proteins, which elegantly branch into twoclades coinciding with the HG and MG growth pheno-type (Fig. 5b, c), as well as differential rates and totallevels of FLA-PS uptake (Fig. 2c–e, Supplementary Fig.2b). Previously, it was shown that the amino acid hom-ology of a SusD-like protein involved in utilization oftwo different fructans was low between two strains of B.theta, despite their taxonomic similarity [41], highlight-ing that syntenic genes within PULs can evolve inde-pendently. Here we report that SusC/D-like amino acidsequences from the major PUL involved in metabolismof YM correlate with differential utilization of a commonsubstrate (Fig. 5b, c). MD40HG likely has a more efficienttransport process (Fig. 7), as suggested by the followingresults: there is no perceived difference in the structuresof surface enzymes encoded within the MAN-PULs(Supplementary Fig. 4), the outer surface endo-α-mannanases are expressed at lower levels in HGs (Fig.6b), the addition of exogenous endo-GH76s to MGgrowth cultures did not augment MG growth (Supple-mentary Fig. 5), and the higher growth and faster dis-appearance of large YM products in MD40HG cultures(Fig. 7). Whether this is the direct result of higher trans-porter efficiency in MD40HG or indirect result fromimpoverished transport leading to product inhibition ofsurface enzymes in MD33MG is unclear. Intriguingly, de-letion of MAN-PUL1/3 susC/D or the MAN-PUL2susC/D did not impede growth of BtVPI-5482 on YM oruptake of YM (Fig. 5d–f), suggesting SusC/D-like pairsin MAN-PUL2 and 3 are functionally redundant in HGs.Based upon sequence identity (Supplementary Table 4),MGs possess one compromised SusC/D/E complex(MAN-PUL2) and one high-performing SusC/D com-plex (MAN-PUL3), which are regulated differently be-tween the strains. In MD33MG, the MAN-PUL3 susC-like gene (bt3854 homolog) is expressed at a level similarto the MAN-PUL2 susC-like gene (bt3788 homolog),and at a level 2.9-fold higher than its homologous genein MD40HG (Fig. 6b). Higher expression of outer surfaceproteins in MD33MG is a consistent pattern (Fig. 6b).Despite the higher expression levels of the MAN-PUL3SusC/D-like complex in MD33MG, and the ability of theMAN-PUL3 SusC/D-like complex to compensate for de-letion of the MAN-PUL2 transporter in BtVPI-5482(Fig. 5d, e), the MAN-PUL3 SusC/D-like complex inMD33MG is unable to rescue the MG growth phenotypeof the representative strain. Thus, the SusC/D-like com-plexes in MAN-PUL2 and MAN-PUL3 appear to com-pete for substrates and the inefficiencies of transportascribed to the MAN-PUL2 complex are related to itsability to transport, but not recruit, YM substrates. Fur-ther biochemical and structural studies of the MAN-
PUL2 SusC/D-like proteins are warranted to tease apartthese results.The “Nutrient Niche Hypothesis” [42] suggests that
metabolic abilities are determined by the creation andfilling of ecological nutrient niches. In theory, these rela-tionships could be in response to the introduction of anew dietary glycan (i.e., prebiotic), resulting in the selec-tion for or adaptation of a bacterium with the metaboliccapacity to consume it. In this study, the MG and HGphenotypes represent a variation on this theme, as twoclosely related populations (> 98% identity) adapted tothe colonization of a common host (Supplementary Fig.3) display different (Fig. 2b, Supplementary Fig. 1), yetreproducible (Fig. 3a) and inducible (Fig. 3b–d) foragingbehaviors on the same substrate. These findings raiseseveral unsolved questions related to the existence andpersistence of MGs, and potentially other glycan foragersthat are less adept at substrate utilization, in the rumen.If HGs have a superior capacity for YM metabolism,why are MGs not eliminated by competitive exclusion?And if MGs have restricted abilities to digest YM and/ortransport YM products (Fig. 7), why are these PULs notselected against and excised from the genome? The ex-istence of multiple metabolic phenotypes suggests thatecological selection factors may be responsible. Firstly,Bacteroides spp. are generalists with the capacity toutilize a wide variety of substrates available in the diet oftheir hosts and glycan responses are prioritized in Bac-teroides spp. [43, 44]. MGs may possess a different sub-strate hierarchy than HGs and, correspondingly, displaymore prowess for consuming chemically distinct glycans.Alternative substrate priorities would reduce the com-petitive burden on MGs when provided with complexdiets. In this regard, the acquisition of new CAZymes orPULs that endow a microorganism with an ability toconsume new substrates has been hypothesized to occurby horizontal gene transfer and is linked to spatial anddietary habits [20, 28]. YM from S. cerevisiae (Supple-mentary Fig. 1a) and S. pombe (Supplementary Fig. 1b)were the substrates used in this study and showcasedthat HGs are not consistently superior when it comes toglycan utilization. Further investigation into the abilityof MGs and HGs to utilize other substrates is warrantedto identify additional variability in substrate utilizationand preference. Secondly, feeding strategies, such as dis-tributive metabolism, may foster beneficial syntrophicrelationships at multiple levels within a community [45,46]. The generation of public goods [13] by MGs pro-vides nutrients to species that are incapable of digestingYM. This event would increase the richness of the com-munity and, potentially, result in the generation of add-itional secondary metabolites that benefit the lifestyle ofMGs. Furthermore, it has been shown that both the con-centrations and complexity of available substrate cause
Klassen et al. Microbiome (2021) 9:23 Page 11 of 18
differential selection of distributive or selfish foragingstrategies [47–49].Comparison of the MD40HG and MD33MG CAZomes
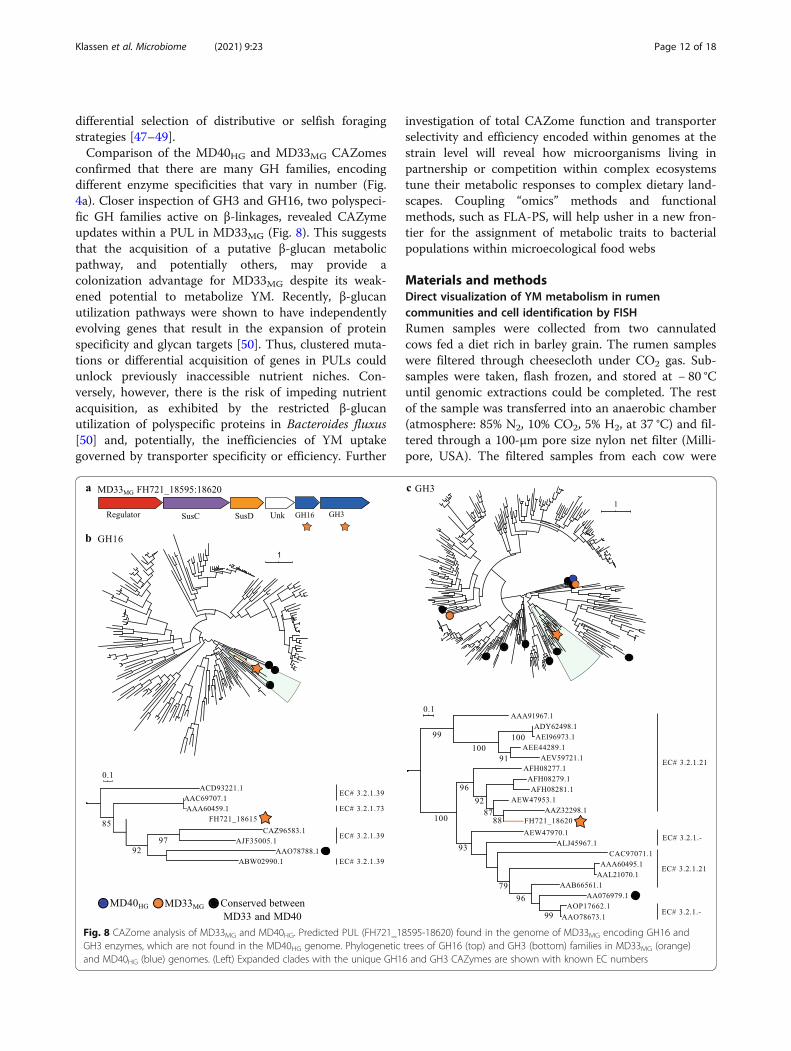
confirmed that there are many GH families, encodingdifferent enzyme specificities that vary in number (Fig.4a). Closer inspection of GH3 and GH16, two polyspeci-fic GH families active on β-linkages, revealed CAZymeupdates within a PUL in MD33MG (Fig. 8). This suggeststhat the acquisition of a putative β-glucan metabolicpathway, and potentially others, may provide acolonization advantage for MD33MG despite its weak-ened potential to metabolize YM. Recently, β-glucanutilization pathways were shown to have independentlyevolving genes that result in the expansion of proteinspecificity and glycan targets [50]. Thus, clustered muta-tions or differential acquisition of genes in PULs couldunlock previously inaccessible nutrient niches. Con-versely, however, there is the risk of impeding nutrientacquisition, as exhibited by the restricted β-glucanutilization of polyspecific proteins in Bacteroides fluxus[50] and, potentially, the inefficiencies of YM uptakegoverned by transporter specificity or efficiency. Further
investigation of total CAZome function and transporterselectivity and efficiency encoded within genomes at thestrain level will reveal how microorganisms living inpartnership or competition within complex ecosystemstune their metabolic responses to complex dietary land-scapes. Coupling “omics” methods and functionalmethods, such as FLA-PS, will help usher in a new fron-tier for the assignment of metabolic traits to bacterialpopulations within microecological food webs
Materials and methodsDirect visualization of YM metabolism in rumencommunities and cell identification by FISHRumen samples were collected from two cannulatedcows fed a diet rich in barley grain. The rumen sampleswere filtered through cheesecloth under CO2 gas. Sub-samples were taken, flash frozen, and stored at − 80 °Cuntil genomic extractions could be completed. The restof the sample was transferred into an anaerobic chamber(atmosphere: 85% N2, 10% CO2, 5% H2, at 37 °C) and fil-tered through a 100-μm pore size nylon net filter (Milli-pore, USA). The filtered samples from each cow were
Fig. 8 CAZome analysis of MD33MG and MD40HG. Predicted PUL (FH721_18595-18620) found in the genome of MD33MG encoding GH16 andGH3 enzymes, which are not found in the MD40HG genome. Phylogenetic trees of GH16 (top) and GH3 (bottom) families in MD33MG (orange)and MD40HG (blue) genomes. (Left) Expanded clades with the unique GH16 and GH3 CAZymes are shown with known EC numbers
Klassen et al. Microbiome (2021) 9:23 Page 12 of 18

then aliquoted into three tubes. One tube was immedi-ately fixed with 1% formaldehyde (FA) for 1 h at roomtemperature as the 0 h control. The other tubes were in-cubated with 20 μL FLA-YM for a final concentration of3.1 nM and fixed with FA after 1 day and 3 days. Imme-diately after fixation, all samples were filtered through a47mm (0.2-μm pore size) polycarbonate filter (Milli-pore), using a 0.45-μm cellulose acetate support filter(Millipore) and a gentle vacuum of < 200 mbar. Afterdrying, the filters were stored at − 20 °C.Total cell counts were determined by staining with 4′,
6-diamidino-2-phenylindole (DAPI) and visualizing on aLeica DMRX epifluorescence microscope (Leica,Germany). The number of FLA-YM stained cells was de-termined by enumerating cells which had a positiveDAPI and FLA-YM signal (excitation at 405-nm and488-nm wavelengths, respectively). For FISH, oligo-nucleotide probe CF968 targeting Bacteroidetes (5′-GGTAAGGTTCCTCGCGTA-3′) [33] was used, whichwas covalently labeled with four ATTO594 fluoro-chromes by Biomers (Konstanz, Germany). FISH wasperformed with slight alterations to the protocol ofManz et al. [51]. The hybridization buffer contained 900mM NaCl, 20 mM TRIS-HCl (pH 7.5), 0.02% sodium do-decyl sulfate, 10% dextran sulfate (w/v), and 1% (w/v)blocking reagent (Boehringer, Germany) with a formam-ide concentration of 55%. Hybridizations were carriedout at 35 °C in a humidity chamber overnight, with asubsequent 15-min wash in a buffer containing 10mMNaCl, 20 mM TRIS-HCl (pH 7.5), 5 nM EDTA (pH 8),and 0.01% sodium dodecyl sulfate at 37 °C. After FISH,the abundance of Bacteroidetes as well as Bacteroidetesshowing FLA-YM uptake was enumerated using a LeicaDMRX epifluorescence microscope.DNA from the frozen rumen samples was extracted
using the Qiagen DNeasy PowerSoil Kit, and sampleswere sent to McGill GenomeQuebec for Illumina MiSeqPE250 16S rRNA metagenomics sequencing. The 16SrRNA sequences were merged and quality trimmedusing the BBTools [52] software and subsequently classi-fied using the standard settings of the SILVAngs pipelineusing the SSU rRNA seed of the SILVA database release132 [53]. All analysis and plotting of the microbial diver-sity data were done using RStudio version 3.6.3 usingthe Vegan package [54, 55]
Isolation of bovine-adapted mannan degradersBovine rumen and fecal samples were collected forin vitro batch culture experiments. Ruminal and fecal in-oculants from cattle were enriched anaerobically (atmos-phere: 85% N2, 10% CO2, 5% H2) at 37 °C with one ofthe following substrates: Bio-Mos® (1% w/v), corn dis-tillers’ grains (1% w/v), or YM (1% w/v). Bacteria wereisolated from the enriched batch cultures by streaking
onto nutrient-restricted media supplemented with 0.5%YM to select for YM-degraders (supplementarymethods). In total, 50 YM-degrading bacterial isolateswere characterized for their propensity to metabolizeYM. Nine of these isolates were selected for detailedanalysis in this study.
Growth profiling of bovine isolatesBovine isolates, wild-type BtVPI-5482, and a mutant Btstrain lacking MAN-PULs 1, 2, and 3 (ΔMAN-PUL1/2/3) [14] were cultured anaerobically (atmosphere: 85%N2, 10% CO2, 5% H2) at 37 °C overnight in tryptone-yeast-glucose (TYG) medium (supplementary methods).All incubations were performed in an anaerobic cham-ber at 37 °C. The overnight cultures (OD600 1.0–1.4)were diluted to an OD600 of 0.05 in 2X Bacteroides min-imal medium (MM), pH 7.2 (supplementary methods).Wells of a 96-well microtiter plates (Falcon) were filledwith 100 μL of sterilized 1% (w/v) YM (Sigma, St. Louis,USA; M7504) or mannose along with 100 μL inoculant(n = 4). Negative control wells consisted of 100 μL 2XMM combined with 100 μL 1% (w/v) of YM or mannoseand were used to normalize growth curves. One hundredmicroliters of bacterial suspension was inoculated to getstarting OD600 ~ 0.025. Plates were sealed with polyur-ethane Breathe-Easy gas-permeable membranes (Sigma;Z390059). Absorbance (600 nm) of each well was mea-sured with a Biotek Eon microplate reader and recordedon Biotek Gen5 software every 10 min for 50 h. Mean (±standard deviation) of each condition (n = 4) was visual-ized using GraphPad Prism 6. Two replicates of eachstrain were also cultured on YM extracted from the cellwall of S. pombe (supplementary methods).Post-growth cultures were harvested and centrifuged.
Supernatants were taken and 6 μL was ran on a silicasheet in 2:1:1 (butanol to d2H2O to acetic acid) runningbuffer. The plate was dried at ambient temperature andstained with orcinol (diluted to 1% in a solution of 70:3ethanol to sulfuric acid). Once the plate was dry, it wasactivated in an oven at 120 °C and imaged using a geldoc XR image system (Bio-Rad).
Genome sequencing, assembly, and annotation of BtBov
strainsThe 16S rRNA of 50 bovine bacterial isolates was se-quenced to determine taxonomic classification using theuniversal primers 27F and 1492R (supplementarymethods). Based on growth profiles (OD600 > 0.4) and16S rRNA sequences, nine isolates were chosen forwhole-genome sequencing using Illumina MiSeq PE150bp. Genomes were assembled using SPAdes de novo as-sembly [35]. The K-mer value in SPAdes was chosenfrom (21, 33, 55, and 77 defaults for 150 bp reads). Qual-ity reporting of the assemblies was done using Quast
Klassen et al. Microbiome (2021) 9:23 Page 13 of 18

[56]. SPAdes assembly N50s, largest contigs, and num-ber of contigs are shown in Supplementary Table 2. Ge-nomes were uploaded to the NCBI submission portaland annotated using the NCBI Prokaryotic AnnotationPipeline. Isolate contigs were blasted against the refer-ence genome BtVPI-5482 for MAN-PUL1/2/3 and theHMNG-PUL using NCBI BLAST (2.7.1) [34]. SPAdescontig assemblies were aligned with the JSpeciesWS ref-erence BtVPI-5482 genomes to calculate average nucleo-tide identity based on BLAST+ (ANIb) [36].
Production of BtVPI-5482 MAN-PUL mutantsFlanking regions (~ 750 bp) of the susC/D-like genesfrom each MAN-PUL were PCR amplified, stitched to-gether, and ligated into pExchange-tdk (pEx-tdk). Theplasmids were transformed into E. coli strain S17-1λpir,which were donor cells used to conjugate the plasmidsinto the BtVPI-5482 ΔPUL75Δtdk recipient strain todelete the sus-like gene pairs [57]. Mutants with theMAN-PUL1 Sus genes deleted (ΔMP1susCD) were thenconjugated with E. coli cells containing a plasmid withthe flanking regions for the MAN-PUL3 Sus genes tocreate a dual mutant (ΔMP1/3susCD). The dual mutantwas then conjugated with E. coli cells that contained aplasmid with the MAN-PUL2 Sus flanks to produce atriple mutant (ΔMP1/2/3susCD). Plasmids and mutantswere sequenced at each step of this process.The three knock-out strains, along with BtVPI-5482
wild-type, were grown on 0.5% YM-MM as describedabove. In addition, the strains were incubated with FLA-YM and sampled at 0 h, 1 h, 1 day, and 3 days. Thesesamples were fixed and stored at 4 °C until analyzed byflow cytometry and epifluorescence microscopy (seebelow).
PUL delineation and comparative CAZomicsIsolate contigs were processed through EMBOSSGetORF [58] to determine open reading frames; thesedata were run through the dbCAN [59] HMMscan toidentify CAZyme sequences. CAZyme sequences werethen analyzed by SACCHARIS [37] (Sequence Analysisand Clustering of CarboHydrate Active enzymes forRapid Informed prediction of Specificity). User CAZymesequences were trimmed to their catalytic domain withdbCAN [59], aligned with MUSCLE [60], and fitted to aphylogenetic tree using ProtTest3 [61] to find the appro-priate amino acid replacement model. RAxML [62] orFastTree [63] was used to generate the final tree. GHsfrom families 38, 76, 92, 99, and 125 identified in the ge-nomes of the MD isolates were analyzed by SACCHARIS. Phylogenetic trees were developed using FastTree,and Newick file outputs were viewed and plotted usingITOL (doi.org/10.1093/nar/gkz239).
RNA-seq: assembly, quantitation, and comparativeanalysisRNA from BtVPI-5482, MD33MG, and MD40HG grownin 0.5% mannose or YM (see supplementary methods)was extracted and purified using a GeneJET RNA Purifi-cation kit (Thermo Scientific) within 1 week of storageat − 80 °C. RNA was sent to Génome Québec for Illu-mina HiSeq 4000 PE100bp sequencing. Using Geneiousv11.1.2 [64], each set of reads was mapped to their previ-ously assembled genomic sequence or, in the case ofBtVPI-5482, to the genomic sequence from the NCBIdatabase (NC_004663). Expression levels were calculatedas transcript expression (transcript per kb per million;TPM) for each growth treatment. Ambiguously mappedreads were counted as partial matches. The GeneiousDESeq2 [65] plugin was used to compare the expressionlevels between the two treatments, producing log2 ex-pression ratios and p values.Generalized linear mixed models in SAS PROC GLIM
MIX (SAS 9.4, SAS Institute, Cary, NC, USA) were usedto estimate statistically significant (p < 0.05) differencesof TPM means (least squares-means) for the MAN-PUL1/2/3 susC-like genes of each bacterial strain. Basedon the Bayesian information criterion (BIC) of the gen-eralized linear mixed models, the response was modeledusing the log-normal distribution. The expression ofgene transcripts was the dependent variable in modelswith two independent fixed factors: bacterial strain (i.e.,BtVPI-5482, MD33MG, or MD40HG) and media treat-ment (i.e., YM or mannose). Mixed models of varianceheterogeneity were selected based on the BIC. For thestudied transcripts, the variance of expression was het-erogeneous for the experimental treatments, bacteria, ortheir interaction. The statistical significance of the inter-action between the TPM values of MAN-PUL genes foreach bacterial strain and the media treatment was deter-mined using an F test. Bonferroni’s method was used formultiple comparisons (Supplementary Table 3).
Production of SusD-like protein C-myc fusion B. thetastrainThe C-myc epitope (EQKLISEEDL) was fused to the C-terminal domain of the MAN-PUL2 SusD-like protein(BT_3789) with a linker sequence (STSTST) betweenthe SusD-like nucleotide sequence and the C-myc se-quence BtVPI-5482 Δtdk Δpul75 (control), and BtVPI-5482 Δtdk Δpul75 SusD-like C-myc fusion mutant wasinoculated in TYG and cultured as described above. Thecells were centrifuged and resuspended in 1 mL 2X MM.One hundred microliters of the resuspension was inocu-lated into 0.5% YM-MM and incubated for 4 h at 37 °C.The cells were then centrifuged and washed three timesin phosphate-buffered saline (PBS) pH 7.4 (PBS; 137 mMNaCl, 2.7 mM KCl, 10 mM Na2HPO4), before
Klassen et al. Microbiome (2021) 9:23 Page 14 of 18
resuspension in 2 mL 2X MM. Two hundred twenty-fivemicroliters of the resuspended cells was added to 1.5 mL0.2% FLA-YM or YM-MM and incubated for 3 h at37 °C. One hundred microliters of each culture was col-lected and fixed in 1% formaldehyde for 1 h at roomtemperature. The samples were then incubated with 1:2500 rabbit IgG anti-C-myc polyclonal antibody (Ther-moFisher #PA1-981) for 1 h at room temperature. Thesamples were then washed four times in PBS and resus-pended in 1:2500 goat anti-rabbit DyLight 650 nm sec-ondary antibody (ThermoFisher #84546) for 1 h at roomtemperature. The samples were then washed and storedin PBS until further analysis.
Sequence comparison and modeling of SusC/D/E-likeproteinsMUSCLE was used to align MAN-PUL2 and 3 SusC-like, SusD-like (SGBPA), and SusE-like (SGBPB) aminoacid sequences of each isolate and calculate percentidentity (Supplementary Table 4). The 16S rRNA geneand MAN-PUL2 SusC-like and SusD-like amino acidphylogenetic trees were generated using the maximumlikelihood method and Tamura-Nei model [66]. Evolu-tionary analyses were performed by MEGA X [67]. Treeswith the highest log likelihood are shown in Fig. 4b andc.
Generation of FLA-YM conjugatesA previously defined protocol [30, 68] was used to gen-erate fluorescently labeled YM (FLA-YM), with slightvariations (supplementary methods).
Visualization of FLA-YM uptake by strains of BtBov
Wild-type BtVPI-5482, BtΔMAN-PUL1/2/3, and rumenisolates MD33MG and MD40HG were inoculated in TYGand grown as described above. Cells were harvested atOD600 ~ 1.0 and centrifuged (4700×g) for 5 min, thesupernatant was removed, and pellets resuspended in 2mL 2X MM for the first two washes. After the third cen-trifugation, pellets were resuspended in 2 mL MM with0.5% YM (BtVPI-5482, MD33MG, and MD40HG) or 0.5%glucose + YM (BtΔMAN-PUL1/2/3) as the sole carbonsource (not conjugated to FLA). After ~ 18-h incubation,cultures were centrifuged and washed three times inPBS, with the final resuspension in 2 mL 2X MM. Threehundred microliters of the resuspended pellet was ali-quoted into 0.2% unlabeled YM or FLA-YM. Twenty mi-croliters of the 2X MM resuspension was used as the 0-h time point, as the cells were not exposed to FLA-YM.Forty microliters aliquots of each condition were takenat time points: 5 min, 1 h, and 24 h. The cells were cen-trifuged (10 min; 2300×g), and the pellet was fixed in 1%formaldehyde (FA; Sigma; F8775) in PBS, at 4 °C for 18–24 h. The fixed cells were centrifuged (10 min; 2300×g)
and washed in 1X PBS. The samples were centrifugedand stored at 4 °C in the dark until visualized by SR-SIM(supplementary methods).
Quantification of the rate of FLA-YM uptake by BtBov
isolatesBtVPI-5482, MD33MG, and MD40HG were grown inTYG and prepared as described above. After 24 h of in-cubation, cultures were placed into 2 mL 0.5% YM. Cellswere harvested in exponential phase (OD600 0.6–1.0),centrifuged (10 min; 2300×g), and resuspended in 2 mL2X MM. Three hundred microliters of this suspensionwas added to 1mL 2 X MM. Then 20 μL of each culturewas aliquoted into 1 mL 1% FA and used as the T0 timepoint. Into the remaining 280 μL, 0.2% FLA-YM and150 ng/mL fluoresceinamine (FLA) or YM was addedand subsamples of 40 μL were taken at 5, 10, 15, 20, 30,and 60min and 2, 4, 8, and 24 h. The subsamples werecentrifuged (10 min, 2300×g), and the cell pellets werefixed in 1% FA in 1X PBS, at 4 °C for 18–24 h. The fixedcells were centrifuged (10 min; 2300×g) and resuspendedin 1ml 1X PBS and stored at 4 °C in the dark.Cell fluorescence due to FLA or FLA-YM uptake was
quantified in all samples using an Accuri C6 flow cyt-ometer (BD Accuri Cytometers). The 8-peak and 6-peakvalidation bead suspensions (Spherotech, IL, USA) wereused as internal references. All samples were measuredunder laser excitation at 488 nm from a blue-green laser,and the green fluorescence was collected in the FL1channel (530 ± 30 nm). Using the medium as a back-ground, an electric threshold of 17,000 FSC-H was set toreduce the background noise. All measurements weredone at a slow flow rate and a total of 10,000 (FLA-YM)or 5000 (YM and FLA) events per sample were acquired.Bacteria were detected from the signature plot of SSC-Hvs green fluorescence (FL1-H). The FCM output was an-alyzed using FlowJo v10-4-2 (Tree Star, USA). The FCMfiles were imported into FlowJo, and both the totalpopulation (all events) and main population (automatedgating through event density) were determined. For eachpopulation (total and main), sample statistics (counts,mean fluorescence, and the standard deviation) were de-termined from the raw FL1-H data. The results wereexported and analyzed using Welch’s t tests in R studiousing the packages Vegan and Rioja [55, 69] to deter-mine statistical difference between the control (YM andFLA) and FLA-YM incubation within each strain andbetween the FLA-YM incubation of each strain.
Quantification of mannose in minimal medium using GC-MSCell culture medium after incubation in 1% YM-MMwas collected after 24 h and centrifuged (4700×g for 15mins), and the supernatant was passed through a syringe
Klassen et al. Microbiome (2021) 9:23 Page 15 of 18

filter (0.2 μm cellulose acetate membrane, VWR). Thefiltrate was kept frozen for 48 h at − 20 °C and thenthawed and centrifuged (3000×g, 30 min) at roomtemperature. Concentration of mannose in the resultingsupernatant was tested based on our previous report[70], with some modifications to cope with the relativelylarge amount of starting carbohydrate material and thepresence of minimum medium. One milliliter of thesupernatant was evaporated to dryness under a gentleflow of nitrogen. The residue was suspended and mag-netically stirred in 3.5 mL of 6M TFA at 100 °C for 6 hwith headspace filled with nitrogen, followed by additionof internal standard myo-inositol (0.4 mg dissolved in0.5 mL of water) and evaporation to dryness. Monosac-charides were reduced by magnetic stirring overnight in10mg of NaBD4 (99% D, Alfa Aesar) dissolved in 2 mLof 1M ammonium oxide solution, followed by quench-ing excess reductant with acetic acid and evaporating todryness. Boric acid was removed by evaporation to dry-ness five times in 3mL of 10% (v/v) acetic acid inmethanol followed by five times in 3 mL of absolutemethanol. The residue was suspended in 4 mL of aceticanhydride, followed by magnetic stirring at 100 °C for 2h with headspace filled with nitrogen, cooling to roomtemperature, and evaporation to dryness. The derivativeswere purified by partitioning with water and dichloro-methane, recovered by collecting and evaporating to dry-ness the organic phase after three changes of water, andre-dissolved and diluted in ethyl acetate for analysis onan Agilent 7890A-5977B GC-MS system (Agilent Tech-nologies, Inc., CA, USA). Sample solution (1 μL) wassplitless-injected to the system, and optimal analyte sep-aration was achieved on a medium polarity SP2380 col-umn (30 m × 0.25 mm × 0.20 μm, Sigma-Aldrich) with aconstant helium flow of 0.8 mL/min and with oventemperature programmed to start at 55 °C (hold 1 min)followed by increasing at 30 °C/min to 120 °C then at12 °C/min to 255 °C (hold 20 min). Two separate experi-ments were conducted for each sample. Mannose con-centration was calculated based on calibration curveestablished from a series of mannose standard solutioncontaining internal standard.
Measurement of YM hydrolysisSamples from BtVPI-5482, MD33MG, and MD40HG cul-tures in 0.2% FLA-YM (as above) and a no-cell negativecontrol were filtered through 0.2-μm cellulose acetatemembrane syringe filter (VWR). The filtrates were flashfrozen and stored at − 80 °C until analysis. Samples wereanalyzed as described in Arnosti 2003 [68]; in brief, sam-ples were injected onto two columns of Sephadex G50and G75 gel linked in series, with the column effluentpassing through a Hitachi fluorescence detector set toexcitation and emission wavelengths of 490 and 530 nm,
respectively. The columns were standardized using FITCdextran standards (150 kDa, 70 kDa, 40kDA, 10 kDa, 4kDa, FITC-glucose, and free fluorophore; Sigma), so thefraction of polysaccharide eluting in each molecularweight class at each time point could be calculated.
Supplementary InformationThe online version contains supplementary material available at https://doi.org/10.1186/s40168-020-00975-x.
Additional file 1. Supplementary figures
Additional file 2. Supplementary materials
AcknowledgementsWe wish to thank Sherif Ghobrial and Chad Lloyd for the assistance with theFLA-YM hydrolysis measurements, and Elizabeth Lowe, Newcastle University,for the kind gift of the MAN-PUL1/2/3 KO mutant.
Authors’ contributionsLK assisted with the rumen extractions and performed the rumenincubations with FLA-YM, selective bacterial growth profiling and TLC ana-lysis, RNA sequencing, production of FLA-YM, FGC-bacterial incubations, con-struction of the SusD-C-myc mutant and evaluation of production, andextraction of S. pombe YM; prepared figures; and wrote manuscript. GR con-ducted the epifluorescence microscopy and SR-SIM analysis, FISH analysis,cell enumeration of rumen samples, flow cytometry sorting and analysis, andstatistical analysis and assisted with figure and manuscript writing and prep-aration. JPT performed comparative genome and protein sequence analysisand assisted with figure preparation. DRJ assisted with comparative genomeand protein analysis. JHH helped conceive of the study, interpreted the data,and assisted in the preparation of the manuscript. ADS performed isolationsof rumen bacteria and 16S rRNA sequencing. TDS conducted the statisticalanalysis of RNA-seq data. CAr assisted with the generation of FLA-PS, analysisFLA-PS products, and preparation of the manuscript. LJ performed therumen collections and assisted with the bacterial isolations. TWA assistedwith the rumen extractions and preparation of the manuscript. CAm assistedwith the RNA-seq analysis and figure generation. DT assisted with theCAZyme fingerprinting and maintenance of the SACCHARIS pipeline. RAhelped conceive of the study and assisted with the SR-SIM microscopy andpreparation of the manuscript. TAM assisted with the animal study, rumenextractions, and preparation of the manuscript. DPY assisted with the dataanalysis and preparation of the manuscript. DWA helped conceive of thestudy, secured the funding, designed the study, performed the data analysis,and assisted with figure and manuscript preparation. The authors read andapproved the final manuscript.
FundingThis work was supported by funding from the Beef and Cattle ResearchCouncil awarded to DWA (Grant: FDE.13.15 & FDE.14.17). JHH, GR, and RAwere supported by the Max Planck Society. RA and JHH acknowledge thesupport by the Deutsche Forschungsgemeinschaft (DFG) in the framework ofthe research unit FOR2406 “Proteogenomics of Marine PolysaccharideUtilization (POMPU)” by grants AM 73/9-1 and HE 7217/1-1. GR has receivedfunding from the European Union’s Horizon 2020 research and innovationprogram under the Marie Sklodowska-Curie grant agreement No. 840804.CAr was supported by NSF OCE-1736772, DE-SC0013887, and DE-SC0019012.
Availability of data and materialsThe datasets generated and analyzed during the current study are availablein the NCBI repository in the whole-genome sequencing BioProject No:PRJNA546576 (BioSample Accession Numbers: MD8HG, SAMN11961934;MD11MG, SAMN11961935; MD13HG, SAMN11961936; MD17HG,SAMN11961937; MD28MG, SAMN11961938; MD33MG, SAMN11961939;MD35MG, SAMN11961940; MD40HG, SAMN11961941; MD51HG,SAMN11961942), and RNA sequencing BioProject No: PRJNA658335 (BioSam-ple Accession Numbers: BtVPI-5482, SAMN15866569; MD33MG,SAMN15866570; MD40HG SAMN15866571). The read mapping of RNA-seqdata was done using the assembled genomic sequences from the BioProject
Klassen et al. Microbiome (2021) 9:23 Page 16 of 18

or to the genomic sequence of BtVPI-5482 found in the NCBI database(NC_004663).
Competing interestsThe authors declare that they have no competing interests.
Author details1Lethbridge Research and Development Centre, Agriculture and Agri-FoodCanada, 5403-1st Avenue South, Lethbridge, Alberta T1J 4B1, Canada.2Department of Biological Sciences, University of Lethbridge, Lethbridge,Alberta T1K 3M4, Canada. 3Max Planck Institute for Marine Microbiology,28359 Bremen, Germany. 4Center for Marine Environmental Sciences,University of Bremen (MARUM), 28359 Bremen, Germany. 5Department ofMarine Sciences, University of North Carolina, Chapel Hill 27599-3300, NC,USA.
Received: 26 June 2020 Accepted: 7 December 2020
References1. Weimer PJ. Redundancy, resilience, and host specificity of the ruminal
microbiota: implications for engineering improved ruminal fermentations.Front Microbiol. 2015;6:296.
2. Henderson G, Cox F, Ganesh S, Jonker A, Young W. Global Rumen Census C,Janssen PH: Rumen microbial community composition varies with diet andhost, but a core microbiome is found across a wide geographical range. SciRep. 2015;5:14567.
3. Stewart RD, Auffret MD, Warr A, Wiser AH, Press MO, Langford KW, Liachko I,Snelling TJ, Dewhurst RJ, Walker AW, et al. Assembly of 913 microbialgenomes from metagenomic sequencing of the cow rumen. Nat Commun.2018;9:870.
4. Huws SA, Creevey CJ, Oyama LB, Mizrahi I, Denman SE, Popova M, Muñoz-Tamayo R, Forano E, Waters SM, Hess M, et al. Addressing global ruminantagricultural challenges through understanding the rumen microbiome: past,present, and future. Front Microbiol. 2018;9:2161.
5. Lima J, Auffret MD, Stewart RD, Dewhurst RJ, Duthie C-A, Snelling TJ, WalkerAW, Freeman TC, Watson M, Roehe R. Identification of rumen microbialgenes involved in pathways linked to appetite, growth, and feedconversion efficiency in cattle. Front Genet. 2019;10:701.
6. Uyeno Y, Shigemori S, Shimosato T. Effect of probiotics/prebiotics on cattlehealth and productivity. Microbes Environ. 2015;30:126–32.
7. Foley MH, Cockburn DW, Koropatkin NM. The Sus operon: a model systemfor starch uptake by the human gut Bacteroidetes. Cell Mol Life Sci. 2016;73:2603–17.
8. Grondin JM, Tamura K, Dejean G, Abbott DW, Brumer H. Polysaccharideutilization loci: fueling microbial communities. J Bacteriol. 2017;199:e00860.
9. Anderson KL, Salyers AA. Biochemical evidence that starch breakdown byBacteroides thetaiotaomicron involves outer membrane starch-binding sitesand periplasmic starch-degrading enzymes. J Bacteriol. 1989;171:3192–8.
10. Kruger K, Chafee M, Ben Francis T, Glavina Del Rio T, Becher D, Schweder T,Amann RI, Teeling H. In marine Bacteroidetes the bulk of glycandegradation during algae blooms is mediated by few clades using arestricted set of genes. ISME J. 2019;13:2800–16.
11. Martens EC, Kelly AG, Tauzin AS, Brumer H. The devil lies in the details: howvariations in polysaccharide fine-structure impact the physiology andevolution of gut microbes. J Mol Biol. 2014;426:3851–65.
12. Teeling H, Fuchs BM, Becher D, Klockow C, Gardebrecht A, Bennke CM,Kassabgy M, Huang S, Mann AJ, Waldmann J, et al. Substrate-controlledsuccession of marine bacterioplankton populations induced by aphytoplankton bloom. Science. 2012;336:608–11.
13. Rakoff-Nahoum S, Coyne MJ, Comstock LE. An ecological network ofpolysaccharide utilization among human intestinal symbionts. Curr Biol.2014;24:40–9.
14. Cuskin F, Lowe EC, Temple MJ, Zhu Y, Cameron EA, Pudlo NA, Porter NT,Urs K, Thompson AJ, Cartmell A, et al. Human gut Bacteroidetes can utilizeyeast mannan through a selfish mechanism. Nature. 2015;517:165–9.
15. Abbott DW, Martens EC, Gilbert HJ, Cuskin F, Lowe EC. Coevolution of yeastmannan digestion: Convergence of the civilized human diet, distal gutmicrobiome, and host immunity. Gut Microbes. 2015;6:334–9.
16. Terrapon N, Lombard V, Drula E, Lapebie P, Al-Masaudi S, Gilbert HJ,Henrissat B. PULDB: the expanded database of polysaccharide utilizationLoci. Nucleic Acids Res. 2018;46:D677–83.
17. Larsbrink J, Rogers TE, Hemsworth GR, McKee LS, Tauzin AS, Spadiut O,Klinter S, Pudlo NA, Urs K, Koropatkin NM, et al. A discrete genetic locusconfers xyloglucan metabolism in select human gut Bacteroidetes. Nature.2014;506:498–502.
18. Martens EC, Lowe EC, Chiang H, Pudlo NA, Wu M, McNulty NP, Abbott DW,Henrissat B, Gilbert HJ, Bolam DN, Gordon JI. Recognition and degradationof plant cell wall polysaccharides by two human gut symbionts. PLoS Biol.2011;9:e1001221.
19. Hehemann JH, Kelly AG, Pudlo NA, Martens EC, Boraston AB. Bacteria of thehuman gut microbiome catabolize red seaweed glycans with carbohydrate-active enzyme updates from extrinsic microbes. Proc Natl Acad Sci U S A.2012;109:19786–91.
20. Pluvinage B, Grondin JM, Amundsen C, Klassen L, Moote PE, Xiao Y, Thomas D,Pudlo NA, Anele A, Martens EC, et al. Molecular basis of an agarose metabolicpathway acquired by a human intestinal symbiont. Nat Commun. 2018;9:1043.
21. Davies G, Henrissat B. Structures and mechanisms of glycosyl hydrolases.Structure. 1995;3:853–9.
22. Lombard V, Golaconda Ramulu H, Drula E, Coutinho PM, Henrissat B. Thecarbohydrate-active enzymes database (CAZy) in 2013. Nucleic Acids Res.2014;42:D490–5.
23. Finck DN, Ribeiro FRB, Burdick NC, Parr SL, Carroll JA, Young TR, BernhardBC, Corley JR, Estefan AG, Rathmann RJ, Johnson BJ. Yeast supplementationalters the performance and health status of receiving cattle. Prof Anim Sci.2014;30:333–41.
24. Miguel JC, Rodriguez-Zas SL, Pettigrew JE. Efficacy of a mannanoligosaccharide (Bio-Mos®) for improving nursery pig performance. J SwineHealth Prod. 2004;12:296–307.
25. Wohlt JE, Corcione TT, Zajac PK. Effect of yeast on feed intake andperformance of cows fed diets based on corn silage during early lactation. JDairy Sci. 1998;81:1345–52.
26. Gregg KJ, Zandberg WF, Hehemann JH, Whitworth GE, Deng L, Vocadlo DJ,Boraston AB. Analysis of a new family of widely distributed metal-independent alpha-mannosidases provides unique insight into theprocessing of N-linked glycans. J Biol Chem. 2011;286:15586–96.
27. Zhu Y, Suits MD, Thompson AJ, Chavan S, Dinev Z, Dumon C, Smith N,Moremen KW, Xiang Y, Siriwardena A, et al. Mechanistic insights into aCa2+-dependent family of alpha-mannosidases in a human gut symbiont.Nat Chem Biol. 2010;6:125–32.
28. Hehemann JH, Correc G, Barbeyron T, Helbert W, Czjzek M, Michel G.Transfer of carbohydrate-active enzymes from marine bacteria to Japanesegut microbiota. Nature. 2010;464:908–12.
29. Hatzenpichler R, Krukenberg V, Spietz RL, Jay ZJ. Next-generation physiologyapproaches to study microbiome function at single cell level. Nat RevMicrobiol. 2020;18:241–56.
30. Reintjes G, Arnosti C, Fuchs BM, Amann R. An alternative polysaccharideuptake mechanism of marine bacteria. ISME J. 2017;11:1640–50.
31. Hehemann JH, Reintjes G, Klassen L, Smith AD, Ndeh D, Arnosti C, Amann R,Abbott DW. Single cell fluorescence imaging of glycan uptake by intestinalbacteria. ISME J. 2019;13:1883–9.
32. Tao J, McCourt C, Sultana H, Nelson C, Driver J, Hackmann TJ. Use of afluorescent analog of glucose (2-NBDG) to identify uncultured rumenbacteria that take up glucose. Appl Environ Microbiol. 2019;85:e03018.
33. Acinas SG, Ferrera I, Sarmento H, Díez-Vives C, Forn I, Ruiz-González C,Cornejo-Castillo FM, Salazar G, Gasol JM. Validation of a new catalysedreporter deposition–fluorescence in situ hybridization probe for theaccurate quantification of marine Bacteroidetes populations. EnvironMicrobiol. 2015;17:3557–69.
34. Altschul SF, Gish W, Miller W, Myers EW, Lipman DJ. Basic local alignmentsearch tool. J Mol Biol. 1990;215:403–10.
35. Bankevich A, Nurk S, Antipov D, Gurevich AA, Dvorkin M, Kulikov AS, LesinVM, Nikolenko SI, Pham S, Prjibelski AD, et al. SPAdes: a new genomeassembly algorithm and its applications to single-cell sequencing. J ComputBiol. 2012;19:455–77.
36. Richter M, Rosselló-Móra R, Oliver Glöckner F, Peplies J. JSpeciesWS: a webserver for prokaryotic species circumscription based on pairwise genomecomparison. Bioinformatics (Oxford, England). 2016;32:929–31.
37. Jones DR, Thomas D, Alger N, Ghavidel A, Inglis GD, Abbott DW. SACCHARIS: an automated pipeline to streamline discovery of carbohydrate active
Klassen et al. Microbiome (2021) 9:23 Page 17 of 18

enzyme activities within polyspecific families and de novo sequencedatasets. Biotechnol Biofuels. 2018;11:27.
38. Ndeh D, Rogowski A, Cartmell A, Luis AS, Basle A, Gray J, Venditto I, Briggs J,Zhang X, Labourel A, et al. Complex pectin metabolism by gut bacteriareveals novel catalytic functions. Nature. 2017;544:65–70.
39. Jones DR, Xing X, Tingley JP, Klassen L, King ML, Alexander TW, Abbott DW.Analysis of active site architecture and reaction product linkage chemistryreveals a conserved cleavage substrate within diverse yeast mannans for anendo-alpha-mannanase. J Mol Biol. 2020;432:1083-97.
40. Cuskin F, Basle A, Ladeveze S, Day AM, Gilbert HJ, Davies GJ, Potocki-Veronese G, Lowe EC. The GH130 family of mannoside phosphorylasescontains glycoside hydrolases that target beta-1,2-mannosidic linkages inCandida Mannan. J Biol Chem. 2015;290:25023–33.
41. Joglekar P, Sonnenburg ED, Higginbottom SK, Earle KA, Morland C, Shapiro-Ward S, Bolam DN, Sonnenburg JL. Genetic variation of the SusC/SusDhomologs from a polysaccharide utilization locus underlies divergentfructan specificities and functional adaptation in Bacteroidesthetaiotaomicron strains. mSphere. 2018;3:e00185-18.
42. Freter R, Brickner H, Botney M, Cleven D, Aranki A. Mechanisms that controlbacterial populations in continuous-flow culture models of mouse largeintestinal flora. Infect Immun. 1983;39:676–85.
43. Rogers TE, Pudlo NA, Koropatkin NM, Bell JS, Moya Balasch M, Jasker K,Martens EC. Dynamic responses of Bacteroides thetaiotaomicron duringgrowth on glycan mixtures. Mol Microbiol. 2013;88:876–90.
44. Tuncil YE, Xiao Y, Porter NT, Reuhs BL, Martens EC, Hamaker BR. Reciprocalprioritization to dietary glycans by gut bacteria in a competitiveenvironment promotes stable coexistence. mBio. 2017;8:e01068-17.
45. Koropatkin NM, Cameron EA, Martens EC. How glycan metabolism shapesthe human gut microbiota. Nat Rev Microbiol. 2012;10:323–35.
46. Morris BE, Henneberger R, Huber H, Moissl-Eichinger C. Microbial syntrophy:interaction for the common good. FEMS Microbiol Rev. 2013;37:384–406.
47. Reintjes G, Fuchs BM, Scharfe M, Wiltshire KH, Amann R, Arnosti C. Short-term changes in polysaccharide utilization mechanisms of marinebacterioplankton during a spring phytoplankton bloom. Environ Microbiol.2020;22:1884–900.
48. Rogowski A, Briggs JA, Mortimer JC, Tryfona T, Terrapon N, Lowe EC, BasléA, Morland C, Day AM, Zheng H, et al. Glycan complexity dictates microbialresource allocation in the large intestine. Nat Commun. 2015;6:7481.
49. Sarmento H, Morana C, Gasol JM. Bacterioplankton niche partitioning in theuse of phytoplankton-derived dissolved organic carbon: quantity is moreimportant than quality. ISME J. 2016;10:2582–92.
50. Déjean G, Tamura K, Cabrera A, Jain N, Pudlo NA, Pereira G, Viborg AH, VanPetegem F, Martens EC, Brumer H. Synergy between cell surfaceglycosidases and glycan-binding proteins dictates the utilization of specificbeta(1,3)-glucans by human gut Bacteroides. mBio. 2020;11:e00095–20.
51. Manz W, Amann R, Ludwig W, Wagner M, Schleifer K-H. Phylogeneticoligodeoxynucleotide probes for the major subclasses of proteobacteria:problems and solutions. Syst Appl Microbiol. 1992;15:593–600.
52. Bushnell B, Rood J, Singer E. BBMerge - Accurate paired shotgun readmerging via overlap. PLoS One. 2017;12:e0185056.
53. Quast C, Pruesse E, Yilmaz P, Gerken J, Schweer T, Yarza P, Peplies J,Glöckner FO. The SILVA ribosomal RNA gene database project: improveddata processing and web-based tools. Nucleic Acids Res. 2013;41:D590–6.
54. Team R. RStudio: integrated development for R. Boston: RStudio. PBC; 2020.55. Oksanen J, Kindt R, Legendre P, O’Hara B, Stevens MHH, Oksanen MJ,
Suggests M. The vegan package. Comm Ecol Package. 2007;10:719.56. Gurevich A, Saveliev V, Vyahhi N, Tesler G. QUAST: quality assessment tool
for genome assemblies. Bioinformatics. 2013;29:1072–5.57. Jones DR, Smith MB, McLean R, Grondin JM, Amundsen CR, Inglis GD,
Selinger B, Abbott DW. Engineering dual-glycan responsive expressionsystems for tunable production of heterologous proteins in Bacteroidesthetaiotaomicron. Sci Rep. 2019;9:17400.
58. Rice P, Longden I, Bleasby A. EMBOSS: the European Molecular BiologyOpen Software Suite. Trends Genet. 2000;16:276–7.
59. Yin Y, Mao X, Yang J, Chen X, Mao F. Xu Y: dbCAN: a web resource forautomated carbohydrate-active enzyme annotation. Nucleic Acids Res. 2012;40:W445–51.
60. Edgar RC. MUSCLE: multiple sequence alignment with high accuracy andhigh throughput. Nucleic Acids Res. 2004;32:1792–7.
61. Darriba D, Taboada GL, Doallo R, Posada D. ProtTest 3: fast selection of best-fit models of protein evolution. Bioinformatics. 2011;27:1164–5.
62. Stamatakis A. RAxML version 8: a tool for phylogenetic analysis and post-analysis of large phylogenies. Bioinformatics. 2014;30:1312–3.
63. Price MN, Dehal PS, Arkin AP. FastTree 2 – approximately maximum-likelihood trees for large alignments. PLoS One. 2010;5:e9490.
64. Kearse M, Moir R, Wilson A, Stones-Havas S, Cheung M, Sturrock S, Buxton S,Cooper A, Markowitz S, Duran C, et al. Geneious basic: an integrated andextendable desktop software platform for the organization and analysis ofsequence data. Bioinformatics (Oxford, England). 2012;28:1647–9.
65. Love MI, Huber W, Anders S. Moderated estimation of fold change anddispersion for RNA-seq data with DESeq2. Genome Biol. 2014;15:550.
66. Tamura K, Nei M. Estimation of the number of nucleotide substitutions inthe control region of mitochondrial DNA in humans and chimpanzees. MolBiol Evol. 1993;10:512–26.
67. Kumar S, Stecher G, Li M, Knyaz C, Tamura K. MEGA X: molecularevolutionary genetics analysis across computing platforms. Mol Biol Evol.2018;35:1547–9.
68. Arnosti C. Fluorescent derivatization of polysaccharides and carbohydrate-containing biopolymers for measurement of enzyme activities in complex. JChromatogr B. 2003;793:181–91.
69. Juggins S. rioja: analysis of quaternary science data; 2017.70. MacMillan JL, Vicaretti SD, Noyovitz B, Xing X, Low KE, Inglis GD, Zaytsoff
SJM, Boraston AB, Smith SP, Uwiera RRE, et al. Structural analysis of broilerchicken small intestinal mucin O-glycan modification by Clostridiumperfringens. Poult Sci. 2019;98:5074–88.
Publisher’s NoteSpringer Nature remains neutral with regard to jurisdictional claims inpublished maps and institutional affiliations.
Klassen et al. Microbiome (2021) 9:23 Page 18 of 18