pathophysiological role of aberrant glycan …
TRANSCRIPT

Chem. Listy 107, s343–s345 (2013) CECE Junior 2013 Posters
s343
BERNADETT BARKASZIa and ANDRÁS
GUTTMANb
a Semmelweis University 2nd Department of Pathology, Budapest, b MTA-PE–Translational Glycomics Research Group, University of Pannonia, Veszprém, Hungary [email protected] Summary
Glycan structures are involved in tumor progression
and metastasis formation (See Fig. 1) by affecting cell proliferation and survival, adhesion, migration, angiogenesis and immunogenic mimicry. Investigation on glycosylation could help to establish high-sensitivity screening methods based on unique pattern. Rational drug design could also target glycosylation pathways.
1. Introduction Glycosylation is the most diverse post-translational
modification1. Many glycosylation changes in cell surface proteins have been observed to facilitate tumor cells in hematogenous spread and invasion. Besides, glycans are responsible for organizing cell surface microdomains2,3. Growth factor receptors are prone to accumulate within
these structures, where the interaction with microdomain molecules affects their kinase activity. Membrane distribution of epithelial growth factor receptor (EGFR) is also influenced by tri- and tetra-antennary N-glycan cell surface lattice that can decrease constitutive endocytosis of the receptor4. The recently recognized phenomenon of O-GlcNAcylation of nuclear proteins also contributes to the malignant phenotype. A large number of chromatin associated proteins, RNA polymerase II and many nuclear oncogenes and tumor suppressor genes are all reportedly O-GlcNAcylated5,6.
2. Experimental Glycans can be analyzed after chemical or enzymatic
release. Chemical release is performed by hydrazinolysis, which releases both N-glycans and O-glycans. O-glycans can be selectively released beta-elimination. N-glycans can be obtained by PNGase F digestion7. Native glycans do not ionize efficiently in MS and have low UV/VIS absorption coefficients, preventing efficient spectroscopic detection. Therefore, derivatization, such as permethylation or chromophore / fluorophore labeling is essential before mass spectrometric and liquid chromatography or capillary electrophoresis analysis7.
3. Results and discussion
3.1. Branched N-glycans Increased 1,6-branching of N-glycan content and
elevated MGAT5 level is widely observed in cancer cells8 to inhibit integrin clustering, reducing the adhesion and thus inducing migration9. Besides, affinity of N-glycans to galectins increases the proportion of branching8. Tri- and tetraantennary N-glycans are ligands of galectins that regulate surface level of glycoproteins by forming a molecular lattice preventing endocytosis. Glycoproteins rich in N-glycans exhibit hyperbolic responses to stimuli10 and constitutive endocytosis is slow8, promoting surface retention of EGFR (ref.4).
3.2. Increased sialylation and fucosylation
Selectins contribute to cancer-metastasis. The
presence of E-selectin ligands on cancer cells correlates with increased adhesion to endothelial cells11. They mediate cell tethering and rolling through the recognition of sialyl-fucosylated Lewis carbohydrates (See Fig. 2). Overexpression of these is associated with cancer
PATHOPHYSIOLOGICAL ROLE OF ABERRANT GLYCAN EXPRESSION IN TU-MORIGENESIS AND CANCER PROGRESSION
Fig. 1. Hematogenous spread and metastasis-forming is a cascade of events. Tumor cells have to detach from their stro-mal environment, intravasate in the blood stream, survive in the circulation and after extravasation, proliferate in the target organ to form a metastasis

Chem. Listy 107, s343–s345 (2013) CECE Junior 2013 Posters
s344
metastasis forming12.
3.3. Glycosylation on growth factor receptors Monosialodihexosylganglioside (GM3) acts via
binding to the EGFR through carbohydrate interactions that require both glycosylation of the EGFR and sialylation of GM3. GM3 is observed to act as a membrane microdomain (lipid raft) organizer13, in which receptors are able to associate. GM3 interferes with caveolin-1 function and inhibits microdomain formation. Binding of caveolin-1 to the EGFR inhibits EGF-induced proliferation and migration, while dissociation from caveolin-1 facilitates EGFR activation14.
3.4. O-GlcNAcylated nuclear proteins
A large number of chromatin associated proteins,
nuclear oncogenes and tumor supressor genes are O-GlcNAcylated15. Transcription factor cellular-myc has Threonin58 in the transactivation domain that is the major site of both O-GlcNAcylation and phosphorylation16,17. This mutation hot spot region Thr58 of c-Myc is O-GlcNAcylated, but the same site is rapidly phosphorylated when the cells are stimulated to grow17. Phosphorylated retinoblastoma protein (pRB) acts is through its interactions with the E2 promoter binding factor transcription factor. E2F mediates the G1/S transition of the cell cycle. In G1, pRB binds to E2F, while in late G1, pRB becomes hyperphosphorylated and E2F is released allowing the co-activator binding (See Fig. 3). An interesting reciprocal relationship was observed between phosphorylation and O-GlcNAcylation level18.
4. Conclusions Describing detailed glycosylation in cancer is of
practical importance in future diagnostics and rational drug design with biomarker-mediated delivery of therapeutic agents. Many glycoproteins are already clinically utilized as tumor markers; however, most diagnostic tests only measure the expression of the polypeptide epitope. Diagnostic tests that recognize specific glycoforms of a protein would be of higher sensitivity and specificity. Fucosylated -fetoprotein has already been clinically approved as a diagnostic marker of primary hepatocarcinoma19,20. Anti-tumor glycan antibodies bound to anti-cancer drugs are also an option in developing highly selective therapies with minimal toxicity to healthy cells.
This work was supported by the MTA-PE Translation
Glycomics grant #97101.
REFERENCES 1. Spiro R.G.: Glycobiology 12, 43R (2002). 2. Wang et al.: J. Biol. Chem. 278, 48770 (2003). 3. Wang et al.: Glycobiology 11, 515 (2001). 4. Dennis et al.: Traffic 10, 1569 (2009). 5. Hart et al.: Annu. Rev. Biochem. 80, 825 (2011). 6. Wells et al.: Amino Acids 40, 877 (2011). 7. Ruhaak et al.: Anal. Bioanal. Chem. 397, 3457 (2010). 8. Lau D.: Glycobiology 18, 750 (2008). 9. Gu Taniguchi: Cell Adh. Migr. 2, 243 (2008). 10. Lau et al.: Cell 129, 123 (2007). 11. Barthel et al.: Proc. Natl. Acad. Sci. 106, 19491
Fig. 2. Selectins are carbonhydrate-binding molecules ex-pressed by endothelial cells, platelets and leukocytes. Se-lectins mediate cell thethering and rolling through the recognition of sialyl-fucosylated Lewis carbonhydrates that are frequently overexpressed in malignant tumors
Fig. 3. In the G0/G1 phase of the cell cycle, hypo-phosphorylated pRb complexes with transcription factors of the E2F family (indicated as E2F and DP) inhibiting their ability to activate transcription. Cell cycle dependent phosphor-ylation of pRb by cyclin/cdk complexes releases E2F to activate transcription of target genes required for S-phase of the cell cycle

Chem. Listy 107, s343–s345 (2013) CECE Junior 2013 Posters
s345
(2009). 12. IP Witz et al.: Immunol. Lett. 116, 218 (2008). 13. Simons K., Ikonen E.: Nature 387, 569 (1997). 14. Wang et al.: Cancer Res. 67, 9986 (2007). 15. Comer Hart: Biochemistry 40, 7845 (2001). 16. Chou et al.: Proc. Natl. Acad. Sci. 92, 4417 (1995). 17. Kamemura et al.: J. Biol. Chem. 277, 19229 (2002). 18. Wells et al.: Amino Acids 40, 877 (2011). 19. Nouso et al.: J. Gastroenterol. Hepatol. 26, 1195
(2011). 20. Moriya et al.: Anticancer Res. 33, 997 (2013).

Chem. Listy 107, s346–s347 (2013) CECE Junior 2013 Posters
s346
ANDREA CELA, ALES MADR, JINDRA MUSILOVA, MARTA ZEISBERGEROVA, and ZDENEK GLATZ Department of Biochemistry, Faculty of Science and CEITEC, Masaryk University, Brno, Czech Republic [email protected] Summary
Quantification of amino acids is a significant task for
many scientific areas. Amino acids play a complex role in a living organism thus amino acid profiling of human biological fluids can be used for supplementary diagnostic purposes. Capillary electrophoresis coupled with in-house assembled contactless conductivity detection showed to be reliable and sensitive enough for quantification of 18 amino acids in 26 human plasma samples. Principal component analysis resulted in a partial grouping of the plasma samples with the same diagnosis proving potential use of presented method for supplementary diagnostic purposes.
1. Introduction Amino acids (AA) are important biochemical
compounds. AA are building blocks of proteins, they are involved in a synthesis of several neurotransmitters, porphyrins and nucleic acids. Quantification of AA in human biological fluids can reveal metabolic disorders which disrupt metabolic pathways of AA leading to accumulation of certain AA, intermediates or by-products. AA profiling can also reveal health-state of a living organism thus can be used for supplementary diagnostic purposes.
2. Experimental
2.1. Method Capillary electrophoresis coupled with in-house
assembled contactless conductivity detection (CE-C4D) was chosen for AA analyses. Separation conditions follow the articles published earlier1–4 and were optimized for human plasma samples. Background electrolyte (BGE) was composed of 8 % (v/v) acetic acid with 0.1 % (m/m) (hydroxyethyl)-cellulose. BGE was filtered using nylon
membrane filters with 0.45 μm porosity and degassed in an ultrasonic bath for 10 minutes. Fused-silica capillary of 80.0 cm total length and 50/375 m inner/outer diameter was used. Length from sample introduction side to a detector was 65.6 cm. Capillary was kept at 30 °C and separation voltage was set at 30 kV (anode at a capillary inlet side). Sample was introduced into capillary using pressure drop of 50 mbar for 30 seconds (equals to 0.5 psi for 43.5 seconds).
2.2. Sample treatment
Human plasma samples were stored in a freezer at –
70 °C. The sample was thawed at a room temperature on the day of measurement. Proteins in the human plasma samples were precipitated by an addition of acetonitrile in the volume ratio 1:2, then thoroughly mixed and centrifuged for 10 minutes at 10 000×g. Supernatant was enriched by an addition of guanidineacetic acid (internal standard) giving final concentration of 50 M and 3.1× diluted plasma sample. The addition of internal standard serves for correction of imprecision of sample introduction and potential sample concentration due to evaporation.
AMINO ACID PROFILING OF HUMAN PLASMA SAMPLES USING CAPILLARY ELECTROPHORESIS WITH CONTACTLESS CONDUCTIVITY DETECTION
Fig. 1. Graph of the 1st and 2nd principal scores. Same symbols represent the same diagnosis; i) empty circle cancer, ii) filled circle cystic fibrosis, iii) empty square coagulation defects, purpu-ra and other hemorrhagic conditions, iv) filled square other ve-nous embolism and thrombosis

Chem. Listy 107, s346–s347 (2013) CECE Junior 2013 Posters
s347
3. Results and discussion Twenty-six human plasma samples were collected
from patients diagnosed with i) cancer, ii) cystic fibrosis, iii) coagulation defects, purpura and other hemorrhagic conditions and iv) other venous embolism and thrombosis. Samples were both from men and women, 1–66 years old (31 years old on average).
There were quantified 18 AA in the all samples. Concentrations of these AA were submitted to principal component analysis and the first, the second and the third principal component scores were extracted. Visualization of the extracted principal component scores in the 3D space showed partial grouping of the plasma samples with the same diagnosis. Partial grouping can be ascribed to large differences in patient ages and generic definition of the diagnosis.
4. Conclusions Presented CE-C4D method is suitable for reliable and
sensitive analysis of human plasma samples. Sample treatment is simple and inexpensive. Analysis of 26 human plasma samples differing in age and diagnosis showed
changes in AA profiles. There were quantified 18 AA in total resulting in partial grouping of the same diagnosis. It can be considered that AA profiling based on CE-C4D can be used for supplementary diagnostic purposes in medical practice where determination of proper diagnosis is unclear or when specific markers are not discovered yet.
No ethical standards were violated. Financial support granted by the Czech Science
Foundation (Project No. P206/11/0009) and the European Social Fund (Project No. CZ.1.07/2.3.00/20.0182 administered by the Ministry of Education, Youth and Sports of the Czech Republic) is highly acknowledged.
REFERENCES 1. Coufal P., Zuska J., van de Goor T., Smith V., Gas B.:
Electrophoresis 24, 671 (2003). 2. Samcova E., Tuma P.: Electroanalysis 18, 152 (2006). 3. Tuma P., Samcova E., Andelova K.: J. Chromatogr., B
839, 12 (2006). 4. Tuma P., Malkova K., Samcova E., Stulik K.: J. Sep.
Sci. 33, 2394 (2010).

Chem. Listy 107, s348–s350 (2013) CECE Junior 2013 Posters
s348
PETR ČESLAa, TOMÁŠ ROUŠAR
b, ERIKA NÝDLOVÁ
a,b, MARTINA VRBOVÁa,b, LENKA
ČESLOVÁa, and JAN FISCHER
a a University of Pardubice, Faculty of Chemical Technology, Department of Analytical Chemistry, Pardubice, b University of Pardubice, Faculty of Chemical Technology, Department of Biological and Biochemical Sciences, Pardubice, Czech Republic [email protected] Summary
A liquid chromatography-tandem mass spectrometry
method for the determination of two acetaminophen metabolites, i.e. acetaminophen-glutathione and acetaminophen-cysteine conjugates was developed. The octadecyl silica gel column has been used together with the gradient elution of methanol/water for fast separation of metabolites in less than four minutes. Tandem mass spectrometry in multiple reaction monitoring mode was applied for identification and quantitation of metabolites using deuterated acetaminophen as the internal standard.
1. Introduction Acetaminophen (paracetamol) represents most
common antipyretic and analgesic drug being sold in almost all countries around the world. When it is used
within therapeutic limits, it is metabolized by sulfation or glucuronidation pathway. After overdose, the oxidation pathway of acetaminophen (Fig. 1) becomes more important yielding N-acetyl-para-benzoquinone imine (NAPQI), which is further rapidly metabolized to acetaminophen-glutathione conjugate (APAP-SG). Recently, we have shown that APAP-SG can also play possible pathological role1–3.
For the monitoring and quantitation of acetaminophen metabolites, the fast and efficient analytical tools are needed. Liquid chromatography with tandem mass spectrometry (LC/MS/MS) is usually used for the determination of acetaminophen and its metabolites4–9. In present work, we have developed fast and accurate method for identification and quantitation of acetaminophen and its two metabolites, acetaminophen-glutathione and acetaminophen-cysteine conjugates employing separation on octadecyl silica gel column packed with porous shell particles coupled to triple quadrupole tandem mass spectrometer operated in multiple reaction monitoring mode. Both the conditions of separation and the mass spectrometric detection parameters were optimized and the developed method is presented herein.
2. Experimental Acetaminophen (N-(4-hydroxyphenyl)acetamide,
APAP) and its deuterated analogue (APAP-D4) used as internal standard, acetic acid and methanol was purchased from Sigma-Aldrich (St. Louis, MO, USA). The reagents used for the synthesis of acetaminophen-glutathione
DEVELOPMENT OF LC/MS/MS METHOD FOR DETERMINATION OF ACETAMINOPHEN METABOLITES
Fig. 1. Oxidation metabolic pathway of acetaminophen

Chem. Listy 107, s348–s350 (2013) CECE Junior 2013 Posters
s349
conjugate (APAP-SG) and acetaminophen-cysteine conjugate (APAP-CYS) were purchased from Lachema (Czech Republic). APAP-SG and APAP-CYS were synthesized as described elsewhere1,3.
The LC/MS/MS analyses were performed on Shimadzu modular binary gradient LC system consisted of two LC-20ADXR pumps, autosampler SIL-20ADXR (Shimadzu, Kyoto, Japan), column thermostat LCO 102 (ECOM, Prague, Czech Republic) coupled with QTRAP 4500 MS instrument operated in electrospray mode (AB SCIEX, Framingham, MA, USA). The separation was performed on Kinetex C18 column packed with porous shell particles (100 3.0 mm, 2.6 m; Phenomenex,
Torrance, CA, USA) maintained at 40 °C. The mobile phase consisted from water with addition of 0.1 % (v/v) acetic acid (A) and methanol (B) with flow rate of 0.4 mL min–1. The gradient profile was 0 min – 10 % B, 5 min – 70 % B, 7 min – 70 % B, 8 min – 10 % B.
3. Results and discussion For the precise and accurate determination of APAP
and its metabolites APAP-SG and APAP-CYS, the separation and detection conditions were optimized. The employing of octadecyl silica gel column packed with
APAP APAP-SG APAP-CYS
MRM transition 152.0/109.9 454.9/271.9 271.0/140.0
Polarity mode positive negative positive
Declustering potential, DP [V] 71 –65 62
Collision energy, CE [V] 21 –22 33
Collision exit potential, CXP [V] 8 –9 10
Dwell time [ms] 100 100 100
Table I Optimized conditions for MS/MS detection of acetaminophen and its two metabolites
Fig. 2. LC/MS/MS analysis of acetaminophen and its two metabolites using developed method. TIC – total ion current, XIC – ex-tracted ion chromatograms for multiple reaction monitoring transitions of metabolites

Chem. Listy 107, s348–s350 (2013) CECE Junior 2013 Posters
s350
porous shell particles significantly decreased the time of the analysis and improved the efficiency and detection limits. The MS/MS detection conditions were optimized by direct injection of appropriate standards to the mass spectrometer and by measuring the signal intensity in dependence on the optimized parameters. The optimized MS/MS conditions are shown in Table I. The MRM transition for APAP corresponds to the most intense fragment ion [M+H-CH2=C=O]+ m/z 109.9, followed by the [M+H-CH3-CO-NH2]
+ ion m/z 93 in the positive ion mode. The fragmentation of APAP-SG and APAP-CYS yielded in the cleavage of the glutathione/cysteine chain, with the most intense fragment ion m/z 271.9 for APAP-SG and the less intense fragment ions m/z 181.9 and 143.0, all in the negative ion mode.
The separation of APAP and its metabolites APAP-SG and APAP-CYS using MS/MS detection under optimized conditions with total ion current and extracted ion currents for corresponding MRM transitions is shown in Fig. 2. The quantitation of all compounds was carried out using deuterated acetaminophen as internal standard. The developed LC/MS/MS method has been applied for the purity control of the synthesized standards of APAP metabolites and for the analysis of the metabolites in liver rat mitochondria samples.
4. Conclusions The method for determination of acetaminophen,
acetaminophen-glutathione metabolite with possible toxic role, and acetaminophen-cysteine has been developed. The optimized separation conditions employing porous shell particle packed column and tandem mass spectrometric detection in multiple reaction monitoring mode was used for the fast and accurate identification and quantitation of the compounds in biological samples.
This work was financially supported by the Ministry of Health of the Czech Republic, project No. NT14320-3/2013.
REFERENCES 1. Roušar T., Nýdlová E., Česla P., Staňková P., Kučera
O., Pařík P., Červinková Z.: Physiol. Res. 61 (Suppl. 2), S103 (2012).
2. Roušar T., Pařík P., Kučera O., Bartoš M., Červinková Z.: Physiol. Res. 59, 225 (2010).
3. Nýdlová E., Vrbová M., Česla P., Jankovičová B., Ventura K., Roušar T.: J. Applied. Toxicol. in print, doi:10.1002/jat.2914 (2013).
4. Ohta M., Kawakami N., Yamato S., Shimada K.: J. Pharm. Biomed. Anal. 30, 1759 (2003).
5. Wen B., Fitch W. L.: J. Mass Spectrom. 44, 90 (2009).
6. An J. H., Lee H. J., Jung B. H.: Biomed. Chromatogr. 26, 1596 (2012).
7. Tonoli D., Varesio E., Hopfgartner G.: J. Chromatogr., B 904, 42 (2012).
8. Hairin T., Marzilawati A. R., Didi E. M. H., Mahadeva S., Lee Y. K., Rahman N. A., Mustafa A. M., Chik Z.: Anal. Methods 5, 1955 (2013).
9. Taylor R. R., Hoffman K. L., Schniedewind B., Clavijo C., Galinkin J. L., Christians U.: J. Pharm. Biomed. Anal. 83, 1 (2013).

Chem. Listy 107, s351–s352 (2013) CECE Junior 2013 Posters
s351
TEREZA DEDOVA, ANDREA CELA, ALES MADR, and ZDENEK GLATZ Department of Biochemistry, Faculty of Science and CEITEC, Masaryk University, Brno, Czech Republic [email protected] Summary
The capillary electrophoresis coupled with fluorescence detection is a very powerful tool for analysis of amino acids in biological samples such as urine, plasma, liquor, etc. It can be also used for an additional diagnosis of various metabolic disorders. Labelling with fluorophore molecule is necessary in order to detect amino acids (AA) with a fluorescence detector. For this purpose various derivatization techniques have been introduced over the years. Naphtalene-2,3-dicarbaldehyde (NDA) reaction with a primary amine group in the presence of a cyanide ion is often used to form fluorescent 2-substituted 1-cyanobenz[f]insodoles. Nevertheless, to the best of our knowledge, no unified method was described in research publications. In this study, various mixing schemes were tested to propose the best technique for the derivatization reaction in high yield and reproducibility.
1. Introduction In our research, we have discovered that the order of
the addition of reagents is crucial to minimize undesired benzoin condensation reaction of NDA. Benzoin condensation is a reaction catalysed by a nucleophile, in which two aromatic aldehydes react to form alfa-hydroxyketons1. An example is a reaction of two benzaldehyde molecules catalysed by a cyanide ion which results in production of benzoin. A similar reaction occurs when NDA is mixed with cyanide in the absence of amine, resulting in formation of several side products (Fig. 1)2. Our contribution deals with undesired benzoin condensation reaction of NDA and investigates the influence of addition order of reactants on labelling outcome.
2. Experimental
2.1. Material and methods
The commercially available Agilent G7100 CE
system (Agilent Technologies, Santa Clara, CA, USA) equipped with an in-house-assembled Led-IF detector and integrated UV detector was used. The Led-IF detector uses
NAPHTALENE-2,3-DICARBALDEHYDE DERIVATIZATION OF AMINO ACIDS – AN IMPROVED TECHNIQUE FOR MINIMIZATION OF BENZOIN CONDENSATION
Fig. 1. Reaction scheme of the NDA benzoin type condensation. NDA (1) in a methanolic solution reacts in the presence of air and cyanide to form several products

Chem. Listy 107, s351–s352 (2013) CECE Junior 2013 Posters
s352
a blue LED diode with the emission maximum at 450 nm. Agilent ChemStation software was used for data acquisition and integration. Separations were carried out on bare fused silica capillaries with 50 m inner and 375 m outer diameters and polyimide protective coating. The total and effective lengths of the capillary were 68.5 cm and 50 cm, respectively.
2.2. Kinetics of NDA condensation
Reaction kinetics of benzoin condensation of NDA
and benzaldehyde were compared. Changes in levels of NDA and benzoin were quantified as a change in absorbance at 250 nm. The reaction mixtures were thoroughly stirred and then maintained at 37 °C for 180 minutes at 450 rpm. Samples were collected in 10 minutes intervals during the first hour and then in 30 minutes intervals. The reaction was stopped by direct analysis of the aliquots.
2.3. Effect of reactants mixing order
Four different mixing schemes of NDA labelling
reaction were studied. All reactions were conducted in amber microtubes to protect light sensitive NDA derivatives of AA. In first mixing scheme3 (Reaction 1) AA, Na2B4O7, NaCN and NDA were added in this order. In the second reaction (Reaction 2) AA, Na2B4O7, NDA and NaCN were mixed. For the third reaction (Reaction 3), based on paper published by Siri research group4, a reaction mixture containing Na2B4O7, NDA and NaCN was prepared in advance and subsequently added to AA. In all cases the reaction mixtures were thoroughly vortexed and kept at 25 °C for 30 minutes at 450 rpm. The reaction was then stopped by freezing the samples at –70 °C. Based on the results obtained from these measurements, new mixing scheme (Reaction 4) was designed where AA were mixed with a prepared mixture of Na2B4O7 and NaCN, followed by NDA. This simplifies the labelling procedure and prevents the unwanted side reaction.
3. Results and discussion
3.1. NDA condensation kinetics Our experiment indicates that the NDA benzoin type
condensation reaction is more rapid than benzoin condensation of benzaldehyde (data not shown). Significant changes in NDA levels were detected already after 10 minutes of incubation time when the level of NDA dropped to less than 50 %. After 50 minutes only 2 % of
initial NDA level was detected. A pale yellow solution after 60 minutes and a formation of brown precipitate after 120 minutes of incubation were observed. The precipitation was significantly enhanced when the temperature was decreased to 4 °C. Based on these results it was assumed that the addition order of reactants can play an important role during the labelling procedure due to the consumption of NDA.
3.2. Effect of reactants mixing order
There was observed no significant difference between
Reaction 1 and Reaction 2 (P < 0.05). Both of these reactions had a good output, although the amount of pipetting steps is more likely to cause random errors. Reaction 3 is easier to perform, however the decrease in yield for Reaction 3 was significant compared to Reaction 1 (P < 0.05). Additionally the difference between Reaction 1 and Reaction 4 was insignificant (P < 0.05), thus we prefer Reaction 4, considering the advantage of reducing the amount of pipetting steps.
4. Conclusions Based on our results, it is possible to simplify the
recommended labelling reaction by preparing mixture consisting of Na2B4O7 and NaCN without unwanted effect on the outcome of the reaction. Reaction 4 will be used for further optimization. Other conditions such as the effect of pH and the incubation temperature will be tested in further studies along with derivatization of biological samples and evaluation of stability of AA-NDA derivatives.
The financial support granted by the Czech Science
Foundation (Project No. P206/11/0009) and the European Social Fund (Project No.CZ.1.07/2.3.00/20.0182 administered by the Ministry of Education, Youth and Sports of the Czech Republic) is highly acknowledged.
REFERENCES 1. McMurry J.: Organic Chemistry. 6th ed., p. 1243.
Pacific Grove: Brooks/Cole publishing company, 2004.
2. McGill C. M., Swearingen K. E., Drew K. L., Rasley B. T., et al.: J. Heterocycl. Chem. 42, 475 (2005).
3. Roach M. C., Harmony M. D.: Anal. Chem. 59, 411 (1987).
4. Siri N., Lacroix M., Garriques J. C., Poinsot V., et al.: Electrophoresis 27, 4446 (2006).

Chem. Listy 107, s353–s354 (2013) CECE Junior 2013 Posters
s353
BOGLÁRKA DÖNCZŐa, LÁSZLÓ KALMÁR
a, JÁNOS KERÉKGYÁRTÓ
b, ZOLTÁN SZURMAIb,
and ANDRÁS GUTTMANa
a Horvath Laboratory of Bioseparation Sciences, MMKK, University of Debrecen, Debrecen, b Institute of Biology and Ecology, University of Debrecen, Debrecen, Hungary [email protected] Summary
The viral-surface envelope glycoproteins of HIV are
abundantly decorated with complex and high mannose type N-glycans (> 20 glycosylation sites). Synthesis of a large number of closely related structural determinants of high mannose antennae was carried out by means of the combination of conventional and combinatorial carbohydrate chemistry. The chitobiose part of the core structure was replaced by a simple octyl aglycone. The pseudo tetra- (2) and penta- (3)-saccharides were prepared by standard carbohydrate chemistry. The -mannosidic linkage was created by the oxidation-reduction technique. Random mannosylation of acceptors 2 and 3 resulted in a mixture of predominantly pseudo penta- and hexasaccharides, respectively. After removal of the protecting groups, the interaction of the synthesized mixture of oligosaccharides and gp120 binding proteins will be investigated.
1. Introduction N-glycoproteins are ubiquitous on eukaryotic cell
surfaces and in body fluids. The dynamically growing field of glycobiology is devoted to defining structural and functional roles of glycans in numerous biological recognition processes, including, for example, viral and bacterial infection, tumor metastasis, immune response and many other receptor-mediated signaling processes1,2. Chemical synthesis provides a valuable means to produce glycans, which serve as model compounds to gain insight into N-glycoprotein structure and function, as tools to study biomolecular interactions and as effectors to evoke biological responses3. However, due to the large number of possible connections, chemical preparation of oligosaccharides is much more complicated than the synthesis of other biopolymers such as peptides or nucleic acids. The synthesis of oligosaccharides can be characterised as the regio- and stereoselective formation of interglycosidic linkages. To date, there are no general applicable methods or strategies for synthesis of complex
large oligosaccharides and consequently the preparation of oligosaccharides is very time consuming.
All N-glycans share a common core sugar sequence of Man-(1→6)-[Man(1→3)]-Man-(1→4)-GlcNAc-(1→4)-GlcNAc-(1→Asn-X-Ser/Thr. In the case of oligomannose type, only mannose residues are attached to the core. Among complex types, this type of glycans are also found decorating viral-surface envelope glycoproteins of HIV4.
Based on the experience of the last 30 years5–9 our research program focuses on the preparation of large number of closely related structural determinants of high mannose antennae by means of the combination of the conventional and combinatorial carbohydrate chemistry. After removal of the protecting groups the generated mixture of random oligosaccharides will be evaluated with their interaction with gp120 binding proteins.
2. Experimental The 1H NMR (200, 360 and 500 MHz) and 13C NMR
(50.3, 90.54 and 125.76 MHz) spectra were recorded with Bruker WP-200 SY, Bruker AM-360 and Bruker DRX-500 spectrometers. The MALDI measurements were carried out with a Bruker MALDI-TOF mass spectrometer, equipped with a 337-nm nitrogen laser. The accelerating voltage was 20.0 kV. 2,5-Dihydroxybenzoic acid was used as matrix and 100–200 laser shots were applied for each spectrum. The reactions were monitored by TLC on Kieselgel 60 F254 (Merck, Darmstadt) with detection by charring with sulfuric acid. Kieselgel 60 (Merck) was used for short-column chromatography.
3. Results and discussion The key compound of our synthetic route was octyl
3-O-allyl-2,4-di-O-benzyl--D-mannopyranoside 1, which can be considered as a selectively protected pseudo core trisaccharide, containing -mannosidic linkage and the chitobiose part is replaced by a simple octyl aglycone.
Compound 1 was prepared by conventional carbohydrate chemistry starting from a gluco compound in 9 synthetic steps. The -mannosidic linkage was created
COMBINATORIAL GLYCOMICS 1: SYNTHESIS OPTIONS
Compound 1

Chem. Listy 107, s353–s354 (2013) CECE Junior 2013 Posters
s354
by C-2 epimerization of the initially introduced -D-gluco unit via oxidation followed by stereoselective reduction. Condensation of 1 and acetylated mannose imidate followed by deacetylation gave pseudo tetrasaccharide acceptor 2 bearing 4 free OH-groups.
Removal of the allyl function of compound 1 resulted in a diol which was glycosylated with acetylated mannose imidate to yield a pseudo pentasaccharide. Deacetylation of this latter derivative resulted in acceptor 3 with 8 free OH-groups.
“Random glycosylations” of pseudo tetra- (2) and pentasaccharide (3) acceptors with various mannosyl donors yielded the mixtures of predominantly pseudo penta- and hexasaccharides, respectively.
The biological experiments will be carried out after removal of the protecting groups from the synthetic products.
4. Conclusions The combination of the classical and combinatorial
carbohydrate chemistry seems to be a very promising approach for the preparation of random oligosaccharide libraries of biochemical interest.
The authors acknowledge the support of the MTA-PE
Translation Glycomics Grant # 97101.
REFERENCES 1. Dwek R. A.: Chem. Rev. 96, 683 (1996). 2. Varki A.: Glycobiology 3, 97 (1993). 3. Mandal M., Dudkin V. Y., Geng X., Danishefsky S.
J.: Angew. Chem. 43, 2557 (2004). 4. Scanlan C. N., Offer J., Zitzmann N., Dwek R. A.:
Nature 446, 1038 (2007). 5. Kerekgyarto J., Kamerling J. P., Bouwstra J. B.,
Vliegenthart J. F., Liptak A.: Carbohydr. Res. 186, 51 (1989).
6. Lichtenthaler F. W., Klares U., Szurmai Z., Werner B.: Carbohydr. Res. 305, 293 (1997).
7. Kerekgyarto J., Agoston K., Batta G., Kamerling J. P., Vliegenthart J. F. G.: Tetrahedron Lett. 39, 7189 (1998).
8. Szurmai Z., Janossy L., Szilagyi Z., Vekey K.: J. Carbohydr. Chem. 17, 417 (1998).
9. Kalmar L., Agoston K., Szurmai Z., Donczo B., Kerekgyarto J.: J. Carbohydr. Chem. 31, 203 (2012).
Compound 2
Compound 3

Chem. Listy 107, s355–s357 (2013) CECE Junior 2013 Posters
s355
PAVOL ĎURČa, PETR KUBÁŇ
b, MIROSLAVA BITTOVÁ
a, and FRANTIŠEK FORETb
a Institute of Chemistry, Masaryk University, Brno, b Bioanalytical Instrumentation, CEITEC, Masaryk University, Brno, Czech Republic [email protected] Summary
A new, simple and rapid capillary electrophoretic method with contactless conductivity detection for screening of formate, oxalate and glycolate in various body samples (blood serum, saliva, urine, exhaled breath condensate) is presented. The target analytes are separated in less than 6 minutes in an electrolyte composed of 50 mM L-histidine and 50 mM 2-(N-morpholino)ethanesulfonic acid at pH 5.9. A short (33 cm) fused silica capillary with 25 m ID is used. LODs range from 0.4 to 1.25 M. The method provides a simple and rapid diagnostic test in suspected intoxication of industrial chemicals and is able to distinguish the ingested liquid, based on its metabolite trace providing a fast screening tool that can be applicable in clinical practice.
1. Introduction Intoxication by short chain alcohols belongs to the
most common intoxication that occurs repeatedly worldwide. Methanol and ethylene glycol ingestion is the most common and it is a medical emergency that requires prompt diagnosis and intervention to prevent morbidity or mortality. The parent alcohols are much less toxic then their metabolites, notably formic, glycolic and oxalic acids that are responsible for various symptoms including loss of vision, CNS depression, renal failure etc.1. Unfortunately, there is presently no simple and fast analytical method that could be used in clinical practice for simultaneous determination of all three metabolites. Therefore the development of a new, fast and simple analytical method able to selectively analyze these metabolites in various human body samples is of paramount importance. In this contribution, we show capillary electrophoresis with contactless conductivity detection as a suitable technique.
2. Experimental
2.1. Instrumentation, samples and electrolytes Analyses were performed using Agilent CE system
(Model G1600AX) at –15 kV. A fused silica capillary (25 M ID/375 M OD, 33/18 cm total/effective length, Microquartz GmBH, Germany) was used. The analytes were detected by a custom made C4D detector, ADMET (Ver. 5.06, ADMET, Prague, Czech Republic).
The optimized BGE consisted of 50 mM 2-(N-morpholino)ethanesulfonic acid (MES) and 50 mM L-histidine (HIS).Various body samples were diluted with DI water and injected into the CE system hydrodynamically: exhaled breath condensate (EBC, no diluton), blood serum (1:100), saliva (1:100) and urine (1:500).
3. Results and discussion
3.1. Optimization of the separation electrolyte system
An optimization of the separation electrolyte system
was conducted to separate the peaks of oxalate, formate a glycolate from the other peaks of the compounds that can be present in the various body fluid samples. With the help of PeakMaster 5.3 freeware, several background electrolytes were simulated to separate the analytes of interest. Initially, an electrolyte consisting of 15 mM Glu/10 mM HIS and 30 M CTAB was applied2, but unlike in the simulations, the oxalate peak in experiment was seriously tailing. Its shape was improved by selecting another separation electrolyte with a high ionic strength and excluding the positively charged EOF modifier (CTAB). Best results were obtained with electrolyte consisting of 50 mM MES, 50 mM HIS at pH 5.9. The separation using this electrolyte was tested experimentally and electropherograms showed efficient separation of oxalate, formate and glycolate from the other peaks. A short separation capillary of 33 cm total/18 cm effective lengths allowed a rapid separation (under 6 min) even in the counter-EOF mode and a separation of model mixture of 15 inorganic anions and organic acids is shown in Fig. 1.
3.2. Analytical parameters of the method
The analytical parameters of the developed CE
method for oxalate, formate and glycolate were investigated. The calibration curves using an internal
CAPILLARY ELECTROPHORETIC SCREENING OF TOXIC METABOLITES IN VARIOUS BODY FLUIDS – A SIMPLE DIAGNOSTIC TOOL TO DIFFERENTIATE METHANOL AND ETHYLENE GLYCOL POISONING

Chem. Listy 107, s355–s357 (2013) CECE Junior 2013 Posters
s356
standard (fumarate) were strictly linear in the range of 0–90 M and were similar in all matrices. They are shown in Fig. 2. The R2 ranged from 0.9971 to 0.9998. The formate calibration in saliva had the same slope but was shifted due to the presence of large concentration of formate in saliva.
The limits of detection were 0.4, 0.5 and 1.25 M for oxalate, formate and glycolate, respectively and limits of quantitation were 1.3, 1.7, 4.2 M. Repeatability (n=10) of migration times ranged from 0.3 to 0.7 % RSD and repeatability of peak areas ranged from 2.9 to 3.1 % RSD.
The recoveries were also investigated. The recoveries were calculated after addition of known amount of analyte (35 and 70 M) and internal standard – fumarate (70 M) into each sample. The recovery values ranged between 89.3 and 108.9 %.
3.3. Analysis of real samples
Various body fluid samples were analyzed using the
developed method. The samples were retrieved from
Fig. 1. The separation of model mixture of 15 inorganic anions and organic acids; 1 – chloride, 2 – nitrite, 3 – nitrate, 4 – thiocya-nate, 5 – sulfate, 6 – oxalate, 7 – formate, 8 – fumarate, 9 – malonate, 10 – tartrate, 11 – maleate, 12 – citrate, 13 – glycolate, 14 – acetate, 15 – lactate
Fig. 2. Calibration curves for oxalate, formate and glycolate in various body fluid samples and DI water

Chem. Listy 107, s355–s357 (2013) CECE Junior 2013 Posters
s357
healthy volunteers at the Masaryk University and some of the clinical samples were retrieved from the Department of Anesthesiology and Resuscitation, Havirov Hospital, Czech Republic. The samples of healthy volunteers contained small amounts of formate (saliva, serum, urine), oxalate (serum) and glycolate (urine), all within the physiological ranges. The blood serum samples of patients intoxicated with methanol during the methanol outbreak in 2012 contained significantly elevated concentrations of formate.
To demonstrate the applicability of the developed method, the electropherograms of diluted lyophilized blood serum (1), blood serum sample of patient who has been hospitalized with serious methanol intoxication (2) and diluted lyophilized blood serum with addition of 10 M oxalate, formate, glycolate and 50 M fumarate (internal standard) (3) is shown in Fig. 3.
The spiked model serum sample shows that all toxic metabolites can be sensitively detected and can indicate the type of toxic alcohol that has been ingested by the patient. In methanol intoxication (Fig. 3-2) from the three possible metabolites only formate peak occurs, which points to methanol as the source of intoxication. Should the person be intoxicated by ethylene glycol, peaks of glycolate and oxalate could be sensitively detected. The spiked metabolites could also be detected in all other, non-invasive samples (exhaled breath condensate, urine, saliva).
4. Conclusions A rapid CE-C4D method for determination of oxalate,
formate and glycolate in various body fluid samples was developed. The method is fast (< 6 min) and simple because only sample preparation is dilution with distilled water. Mentioned toxic metabolites can be determined in various samples both, invasively and noninvasively taken. Especially those noninvasively taken samples may be attractive from the point of a fast screening and diagnostic tool.
The authors acknowledge the financial support from
the Grant Agency of the Czech Republic (Grant No. P206/13/21919S). Part of the work was realized in CEITEC – Central European Institute of Technology 355 with research infrastructure supported by the project CZ.1.05/1.1.00/02.0068 356 financed from European Regional Development Fund.
REFERENCES 1. Jacobsen D., McMartin K. E.: Med. Toxicol. Adverse
Drug Exp. 1, 309 (1986). 2. Kubáň P., Foret F., Bocek R.: J. Chromatogr., A 1281,
142 (2013).
Fig. 3. Separation of human serum samples; 1 – lyophilized serum (1:100), 2 – serum of patient intoxicated with methanol (1:100), 3 – lyophilized serum with spiked oxalate, formate, glycolate and IS. CE conditions the same as in Fig. 1

Chem. Listy 107, s358–s359 (2013) CECE Junior 2013 Posters
s358
FILIP DUŠAa,b and KAREL ŠLAIS
a a Institute of Analytical Chemistry of Academy of Sciences of the Czech Republic, v. v. i., Brno, b Department of Biochemistry, Faculty of Science, Masaryk University, Brno, Czech Republic [email protected] Summary
Present electrophoretic separation methods rely on
sophisticated high-voltage power supplies capable of programing a voltage / current time course during an analysis. In this paper we suggest design of a simple high-voltage power supply for isoelectric focusing composed from affordable and commonly available electrical parts. It is based on features of the voltage multiplier invented by Cockcroft and Walton. Electrical characteristics of the power supply enabled power load controlled isoelectric focusing analysis thus eliminating need for programing voltage time course and reducing analysis total time.
1. Introduction Since their invention, electrophoretic methods have
become powerful separation techniques used in life science. With the increase in popularity came plenty of power supplies with ever improving control of the voltage, electric current and power load. From this three quantities power load is especially important for isoelectric focusing (IEF). Applied power is the main factor influencing Joule heat generation during an IEF run and hence it is very important to control it throughout a whole IEF analysis.
Although there are commercially available power supplies with power load limitation for gel and capillary electrophoresis formats this is not true for strip IEF format. Instead of units or tens of watt limitation suitable for gel and capillary geometry, limitation with tens of Milliwatt is needed for strip format. For that reason we suggest a new simple electrophoretic power supply based on features of a voltage multiplier which is able to maintain power load limit demanded for strip IEF.
2. Experimental The novel power supply was assembled from diodes
rated for 1 A / 1000 V and 10, 15, 22, 33, 47, 68, and 100 nF capacitors rated for 250 V AC according to the circuit diagram shown in Fig. 1. In a recent work we have
developed a strip IEF device with a separation bed made from nonwoven fabric1 which was used for a testing of the suggested power supply. Please see the given reference for details of the device design and a composition of testing model IEF mixture. Completed power supply circuit was then installed into the IEF device and outputs were connected to the electrodes and inputs were connected to 220 V AC cable, which was plugged to the power line before analysis. Finally the IEF device with the new power supply was switched on and electrodes were loaded with resistors covering range of resistance from 10 kΩ to 1 GΩ. At the same time, electric current was monitored and voltage and power load were calculated from obtained values. Subsequently, a graph including mentioned quantities was produced. The power supply was run with model IEF mixture and electric current was registered through the whole separation. Relevant voltage, power load, and resistance were calculated using extrapolation function and plotted into a time dependence graph.
3. Results and discussion Firstly, the suggested power supply was constructed
and electrode outputs were loaded by set of resistors of known resistance. The resistance range was chosen with regard to the common IEF mixture conductivity during an IEF run in strip geometry. After the collection, values of the electric current were plotted to a graph (see Fig. 2A). One can see that through the range of the tested resistances the power supply maintained the power load below 90 mW with even lower limit of 25 mW at very low resistances. Maximum voltage, defined by circuit design, was 5 kV. These data indicated that the power supply should be able
NEW ISOELECTRIC FOCUSING POWER SUPPLY BASED ON FEATURES OF VOLTAGE MULTIPLIER
Fig. 1. Circuit diagram of the developed IEF power supply

Chem. Listy 107, s358–s359 (2013) CECE Junior 2013 Posters
s359
to handle power load limited IEF analysis. This was tested by connection of the power supply electrodes to a nonwoven strip IEF device and IEF was run with a model mixture containing colored pI markers1. Electrical characteristics of the analysis are shown in Fig. 2B. Voltage reached 5 kV after 14 hours of focusing while power load increased slightly from 25 mW to 88 mW and then decreased quickly as focusing approached to a steady state. Application of low power load in the beginning of IEF was important due to high conductivity of the unresolved sample. This limitation becomes crucial when samples with high salt concentrations are employed. As a result, the power load controlled power supply enables focusing sample of unknown composition and moreover no optimization of a voltage time course was necessary.
4. Conclusions We proposed a new power load controlled power
supply for isoelectric focusing in strip geometry. The
power supply was based on features of Cockcroft Walton voltage multiplier. Advantageously, it was made from readily available parts and was easy to construct. A monitoring of power supply electrical characteristics showed that power load was kept below 0.1 mA during testing with set of defined resistors. Moreover, the power supply was tested with model IEF mixture including colored pI markers. As a result, the obtained data suggests that the power supply can be easily utilized in IEF strip format analyses.
This work was supported by the Ministry of the
Interior of the Czech Republic (Project No. VG20102015023), by the Academy of Sciences of the Czech Republic (institutional support RVO: 68081715). This project is co-financed by the European Social Fund and the state budget of the Czech Republic (CZ.1.07/2.3.00/20.0182).
REFERENCE 1. Duša F., Šlais K.: Electrophoresis 34, 1519 (2013).
Fig. 2. A – electrical characteristics of the suggested power supply after loading it with set of resistors, B – electrical characteris-tics of IEF of the model mixture which was run by the power supply

Chem. Listy 107, s360–s361 (2013) CECE Junior 2013 Posters
s360
MILOŠ DVOŘÁK, HANA ŠURANSKÁ, and MILENA VESPALCOVÁ Institute of Food Science and Biotechnology, Faculty of Chemistry, Brno University of Technology, Purkyňova 118, 61200 Brno, Czech Republic [email protected] Summary
This paper describes application of capillary zone
electrophoresis for determination of selected short-chain organic acids in wine must during the controlled fermentation process by inoculation of fresh must by autochthonous (isolated) S. cerevisiae strain. In order to determine organic acids indirect photometric detection (254 nm) was used. We separated six basic organic acids with short chain and identified in real samples. Separation system contained 3,5-dinitrobenzoic acid and cationic surfactant (CTAB). Separation took place on uncoated fused silica capillary. We focused on monitoring of organics acids amount during fermentation process.
1. Introduction Determination of major organic acids in wine must is
an important control step for biotechnological productions and microbiological tests. Their composition and changes are an indicator of the state of the process, as an indicator of sensory and quality characteristics of the product. In the field of microbiology carboxylic acids are an important parameter that helps the taxonomically classify the microbes or to monitor the impact of changes in conditions on the behavior of microorganisms1. Quick and easy alternative with sufficient efficiency offer electromigration methods. In particular, capillary zone electrophoresis and their arrangement is the most suitable principle for rapid analysis of biological samples containing short-chain organic acids2.
2. Experimental All reagents were of analytical grade (p.a). Standards
of organic acids and cetyltrimethylamonium bromide (CTAB) were from Sigma-Aldrich, 3,5-dinitrobenzoic acid (3,5-DNB) from Penta. Standard stock solutions were prepared with purified water (Milli-Q).
Capillary electrophoresis system was used PrinCE 460 (PrinCE Technologies B.V., Emmen, Neederland)
with UV-VIS detector Spectra SYSTEM UV2000 (Thermo Separation Products Inc., San Jose, USA) and fused silica capillary, I.D 50 m (MicroSolv Technology Corporation, Long Branch, NJ, USA). Registration of signal was realized by CSW 1.7 (DataAppex, Praha, Czech Republic).
All solutions were before used filtered through a 0.45 m membrane. Backgound electrolyte (BGE) contained 10 mmol L–1 3,5-dinitrobenzoic acid with 0,2 mmol L–1 CTAB. pH was set up at 3,2 (NaOH). Fused silica capillary had total length 75 cm, effective length 25 cm. Before first analysis capillary was conditioned with 1 mol L–1 NaOH (1200 mBar, 20 min), Milli-Q water (1200 mBar, 10 min), and BGE (1200 mBar, 10 min) with elektrokinetic flush (+25 kV). Between analyses capillary was reconditioned BGE with elektrokinetic reflush (1200 mBar, +25 kV, 5 min). The electrophoretic system was operated with inverted polarity and constant voltage of –30 kV. Indirect photometric detection was set up 254 nm. Temperature of all systems was constant at 25 °C (ref.3).
Samples of wine must at different stages of fermentation for analysis were filtered (0.45 µm porous membrane) and diluted MQ-Water.
Samples of wine must were fermentated by different strains of yeast – commercial and isolated “in situ” from vineyard. Different strains of yeast were applied to the wine must from vineyard differing of agricultural processing – ecological and integration process. Isolation of yeast and prepare of fermented must are not subject of this research4.
3. Results and discussion 27 samples of white wine must was measured
(“Sauvignon blanc” variety) and 46 samples of red wine must (“Pinot noir” variety). “Sauvignon blanc” must was obtained from ecological agriculture process and “Pinot noir” must were obtained from ecological and integrated agriculture process. Both musts were fermented by commercial and autochthonous S. cerevisiae strain.
We determined tartaric, citric, malic, lactic, succinic and acetic acids during the process of fermentation. Significant differences were observed only in the case tartaric and malic acid (decrease of amount in the time) and lactic acid (increase of amount). Results of changes amount determined acids white and red must correlated. It was observed, that acetic, citric and succinic acid are not utilized.
MONITORING OF SELECTED ORGANIC ACIDS DURING THE PRODUCTION OF TRADITIONAL MORAVIAN WINE BY CAPILLARY ZONE ELECTROPHORESIS (CZE)

Chem. Listy 107, s360–s361 (2013) CECE Junior 2013 Posters
s361
4. Conclusions Capillary zone electrophoresis with indirect
photometric detection and chosen separation system is shown to be sufficient and effective tool for monitoring of the content of carboxylic acids in the wine must. Method was fast enough, economical and effective. It reflected a sufficient reproducibility. We determined amount of selected organic acids in wine musts, the amount of organic acids seems to be independent of yeast strains and mode of grape agriculture.
REFERENCES 1. Sádecká. J., Polonský. J.: J. Chromatogr., A 880, 243
(2000). 2. Molnár-Perl. I.: J. Chromatogr., A 891, 1 (2000). 3. Peres R. G., Moraes E. P., Micke G. A., Tonin F. G.,
Tavares M. F. M., Rodriguez-Amaya D. B.: Food Control 20, 548 (2009).
4. Šuranská H., Vránová D., Omelkova J., Vadkertiová R.: Chem. Pap. 66, 861 (2012).
Fig. 1. Example – Determined concentration of organic acids (mg L–1) in the time. Samples: “Pinot noir” variety obtained from eco-logical agriculture vineyard, must was inoculated by commercial yeast

Chem. Listy 107, s362–s363 (2013) CECE Junior 2013 Posters
s362
VERONIKA DVORAKOVA, MICHAELA CADKOVA, BARBORA JANKOVICOVA, LUCIE KORECKA, and ZUZANA BILKOVA Department of Biological and Biochemical Sciences, Faculty of Chemical Technology, University of Pardubice, Pardubice, Czech Republic [email protected] Summary
The aim of this work was conjugation of quantum
dots (QDs) with IgG antibody molecules fixed through antigen bound on solid phase and subsequent elution of resulting conjugate. Antibody labeled with QDs can be applied for amplification of signal detected by electrochemical biosensor in routine screening of different clinically important substances such as tumor markers.
1. Introduction Among serious cancerous diseases with high
incidence in today population belongs ovarian or colorectal cancer. Development of rapid, specific and available method for detection of such cancerous diseases is the goal in today research. System which provides all these qualities is represented by ultrasensitive biosensor based on QDs conjugated with antibodies specific to target antigen. This biosensor should be able to detect very low levels of tumor markers in variety of human body fluids1.
QDs are tiny particles of semiconductor material, usually based on selenides or sulfides of metals like cadmium or zinc, which are only a few nanometers in size. They have unique optical and electrical properties and that is reason why QDs enable to amplify measured signal of target structures2.
New approach of conjugation of antibodies with QDs could improve biosensor's sensitivity. Our experiment consists of five main steps: covalent binding of model antigen ovalbumin (OVA) on solid phase, blocking of free carboxylic groups on solid phase, immobilization of anti-OVA IgG, conjugation of IgG with QDs and effective elution of labeled IgG (Fig. 1). Final product is detected by voltammetric method (SWV – square wave anodic stripping voltammetry) by using interface PalmSens with miniaturized screen-printed electrode (SPE). Superparamagnetic microparticles were used as solid phase for their popular qualities which are mainly easy manipulation and separation of conjugated and free QDs.
2. Experimental part Antigen ovalbumin (OVA, Albumin from chicken
egg white, Sigma-Aldrich, St. Louis, MO, USA) in amount of 50 g and 25 g was bound overnight at 4 °C to 1 mg of magnetic particles SiMAG-Carboxyl (1 m, Chemicell GmbH, Berlin, Germany) in 0.1 M MES buffer pH 5.0 after 30 minutes activation by EDC (N-(3-dimethyl-aminopropyl)-N′-ethylcarbodiimide hydrochloride, Sigma-Aldrich, St. Louis, MO, USA) in combination with sulfo-NHS (N-hydroxysulfosuccinimide sodium salt, Sigma-Aldrich, St. Louis, MO, USA) at room temperature (RT). Amount of EDC and sulfo-NHS was used in following ratio: 7.5 mg of EDC and 1.25 mg of sulfo-NHS per 1 mg of particles. Sodium dodecylsulphate-polyacrylamide gel electrophoresis (SDS-PAGE) was used as control technique for determination of OVA immobilization efficiency. Then biofunctionalised particles were blocked by 1 M ethylenediamine (Sigma-Aldrich, St. Louis, MO, USA) or 1 M ethanolamine (Sigma-Aldrich, St. Louis, MO, USA) for 1 hour at RT. Blocking reagents were properly washed out by 0.1 M phosphate buffer pH 7.3. Subsequently immobilization of rabbit anti-OVA antibodies (Tetracore, MD, Rockville, USA) was realized.
CONJUGATION OF ANTIBODIES FIXED TO SOLID PHASE WITH QUANTUM DOTS FOR AMPLIFICATION OF SIGNAL IN ELECTROCHEMICAL IMMUNOSENSOR
Fig. 1. Principle of conjugation experiment

Chem. Listy 107, s362–s363 (2013) CECE Junior 2013 Posters
s363
0.5 mg of blocked magnetic particles with bound OVA was incubated with 25 g of antibodies for 1.5 hour at RT in 0.1 M phosphate buffer pH 7.3 with 0.15 M NaCl with constant rotation. Washing of particles by using 0.1 M phosphate buffer pH 7.3 in combination with 0.1 M phosphate buffer pH 7.3 with 0.2 M NaCl followed. SDS-PAGE was also used for control of immunocomplex creation between target antigen molecules and antibodies. For conjugation of anti-OVA 2.3 l of 8 M QDs (CdSe/ZnS, Qdot® 565 ITKTM carboxyl quantum dots, Invitrogen, USA) were used. Overnight binding of QDs at 4 °C was carried out after 30 minutes activation of antibodies by EDC. Finally effective elution of labeled antibodies was realized by using 0.05% trifluoroacetic acid (TFA). Electrochemical detection was used as confirmatory technique for detection of our target product. Native gel electrophoresis (native PAGE) combined with measuring of fluorescence, SDS-PAGE and microscopic detection were used as supplementary detection methods.
3. Results and discussion OVA and anti-OVA were used as model system for
optimization of this experiment. Preparation of biofunctionalised magnetic particles, which is key step, was successful. OVA should be bound in monolayer which represents the best conditions for immobilization of anti-OVA. Anti-OVA are in this case ideally distributed on the particle surface for effective conjugation of QDs. We carried out conjugation of antibodies with QDs by well-known carbodiimide technique. We used very low amount of EDC (0.1–0.5 mg of EDC) to activation of amino groups of target antibodies to prevent unwanted cross-linking and aggregation of particles with antibodies and QDs. The main goal of using blocking reagents before conjugation of IgG with QDs was to prevent binding of QDs with free amino groups situated on biofunctionalised
magnetic particles surface. New approach of conjugation presented in this work is based on using solid phase (in our case biofunctionalised magnetic particles) for fixing labeled antibodies which brings better and easier manipulation with whole conjugate and mainly possible separation of conjugated and unconjugated QDs which is using other conventional approaches usually complicated. For elution we applied acidic pH which allows releasing of conjugate from immunocomplex and after separation of particles with OVA using magnetic separator we obtain pure conjugate. Finally conjugate was monitored by wide range of different detection techniques from which detection by electrochemical biosensor was the most important. In this case we reached required amplification of measured signal corresponding to prepared conjugate.
4. Conclusions We prepared conjugate formed by specific anti-OVA
antibodies and CdSe/ZnS-QDs, which can be used for amplification of measured electrochemical signal. In our next work we would like to apply this protocol for preparation of conjugate with specificity against HE4 and pepsinogen, which are significant tumor markers.
This work was supported by Czech Science
Foundation (project GACR P206/12/0381) and by the Ministry of Education, Youth and Sports of the Czech Republic (project CZ.1.07/2.3.00/30.0021 “Enhancement of R&D Pools of Excellence at the University of Pardubice”).
REFERENCES 1. Lin J., Ju H.: Biosens. Bioelectron. 20, 1461 (2005). 2. Samir T. M., Mansour M. M., Kazmierczak S. C.,
Azzazy H. M.: Nanomedicine 11, 1755 (2012).

Chem. Listy 107, s364–s366 (2013) CECE Junior 2013 Posters
s364
MILAN FRAŇOa, MICHAELA GALLEE
b, JOZEF MARÁK
c, and PAVOL KOIŠb
a Department of Molecular Biology, Faculty of Natural Sciences, Comenius University in Bratislava, Bratislava, b Department of Organic Chemistry, Faculty of Natural Sciences, Comenius University in Bratislava, Bratislava, c Department of Analytical Chemistry, Faculty of Natural Sciences, Comenius University in Bratislava, Bratislava, Slovak Republic [email protected] 1. Introduction
The analysis of nucleic acids (NA) is widely applied
and routine in many molecular biology laboratories. NA hybridization techniques are important tools in the variety of diagnostic and biological applications, for example disease detection. However, for nucleic-acid based diagnostic applications more sensitive and faster methods are required. In the last decades microRNA (miRNA) is on the top of the clinical diagnostics research. The miRNA is a type of short (22 nt) non-coding ribonucleic acid molecule found in eukaryotic and some prokaryotic genome. miRNAs are a group of post-transcriptional regulators at the level of mRNA. The human genome may encode over 1100 miRNAs. miRNAs are estimated to regulate at least 30% of all protein coding genes. The miRNAs are involved in most major biological processes in cell like differentiation, proliferation, apoptosis and many others. Except miRNAs role in the normal functioning of cells, so miRNAs has been associated with many human diseases, for example cancer (oncomiRs). miRNAs are aberrantly expressed in cancer and different types of cancer have different expression profiles of miRNAs compared with normal cells, which may ultimately lead to a novel cancer-specific and cancer type-selective treatment and diagnostic strategy1,2. New ways for miRNAs quantification are methods based on capillary electrophoresis (CE) techniques, especially capillary isotachophoresis (ITP) and capillary zone electrophoresis (CZE). The ITP is a modern analytical technique which allows subnanomolar analysis and huge preconcentration (approx. 1 million times) of miRNA samples. We are proposing a combination of ITP with CZE to the analysis of small fragments of nucleic acid by principle hybridization target with the oligonucleotides detection probe by UV-VIS detection.
2. Experimental
2.1. Materials and buffers For hybridization study we used DNA
oligonucleotides synthesized in our laboratory (targets-probes) with no secondary or secondary (hairpin) structure. All DNA oligonucleotides used in hybridization study were full complementary. We used the concentration range of oligonucleotides from 1 pM to 100 nM. For the ITP-CZE experiments, we used 2-amino-2-hydroxymethyl-propane-1,3-diol based electrolytes3 with MgCl2, and 0,1% hydroxyethyl cellulose (HEC) and 0,2–1 % hydroxymethyl ethyl cellulose (MHEC). We used HEC for suppression of electroosmotic flow (EOS), MHEC such as separation sieving matrix, and equimolar concentrations of Mg2+ to promote of hybridization. All chemicals were obtained from Sigma-Aldrich, and all solutions were prepared in ultrapure millipore water, and stored at 4 °C. Synthesized oligonucleotides were stored at –20 °C in nuclease free deionized water.
2.2. ITP-CZE experimental model
For our experiments, we used ITP-CZE (Villa
Labeco) with 180 mm long, and 80 m inner diameter separation capillary with double-jacket water cooling, and with UV-VIS detector. Measurements of ITP-CZE parameters were performed under a 100 A constant current.
3. Results and discussion We experimentally demonstrate the hybridization and
separation models for on-line combinations ITP-CZE with used the model DNA oligonucleotides. We are able to separate model DNA non-complementary oligonucleotides with an identical length, but the different base composition (Fig. 1). For demonstrated model hybridization assay we used model self-hybridization DNA oligonucleotides with melting points 61 °C (Fig. 2).
Efficiency of hybridization of oligonucleotides depends mainly on their structure and concentration, temperature and salt concentration. Addition of different additives to electrolytes, for example HEC, MHEC, acrylamide, improved the separation of single-stranded (ss) and double-stranded (ds) DNA forms. The high temperature can be reached in ITP-CZE columns during the separation process what can have a destabilizing effect on the duplex formation. This can be suppressed by using active cooling of capillaries. Optimization of the driving
SIMULTANEOUS HYBRIDIZATION AND SEPARATION OF SMALL NUCLEIC ACID FRAGMENTS WITH COMBINATION CAPILLARY ISOTACHOPHORESIS AND CAPILLARY ZONE ELECTROPHORESIS

Chem. Listy 107, s364–s366 (2013) CECE Junior 2013 Posters
s365
current conditions and the composition of electrolytes provided clearly separated ss- and ds-DNA forms what is documented in Fig. 1 and Fig. 2.
4. Conclusions This paper shows the possibility of analyzing more
complex samples (e.g. nucleic acids) with ITP-CZE. It was found, this technique is suitable for the study of hybridization of model short fragment of nucleic acids on the very low detection limit. Our experimental method delivers results in less than 20 minutes with the limit of detection (LOD) of 15 pM. We analyzed hybridization and separation of short DNA oligonucleotides that had similar sequences to mature miRNAs. The control of temperature
Fig. 1. Initial demonstration of the ITP–CZE separations of model non-complementary oligonucleotides with addition of 0.2% MHEC to the electrolytes, (1) oligo-110036 (2) oligo-110037 (3) separation of oligo-110036 and 110037. UV-VIS detection at λ = 260 nm, shift in X and Y axis
Fig. 2. Initial demonstration of the ITP-CZE hybridization assay of model self-hybridization oligonucleotides with addition of 0.2% MHEC, (1) oligo-11003X (ss- denaturation) (2) oligo-11003X (ss and ds-partial denaturation) (3) oligo-11003X (ds-hybridization). UV-VIS detection at λ = 260 nm, shift in X and Y axis

Chem. Listy 107, s364–s366 (2013) CECE Junior 2013 Posters
s366
was a critical step for the preservation of the double-stranded structure of DNA hybrids in our experiment. This ITP-CZE combination provides sufficient selectivity and sensitivity for nucleic acid quantifications with minimal financial requirements. Improving this method can lead to clinical applications of miRNA as ideal biomarker for cancer diagnostic assay.
This work was carried out with the financial support from the VEGA grants Nos. 1/0962/12, 1/1305/12 and Comenius University Grant No. UK/548/2013.
REFERENCES 1. Brandi N., et al.: J. Biochem. 148, 381 (2010). 2. Wang Z., Yang B.: Springer. 2010, p. 408. 3. Schoch B. R., Ronaghi M., Santiago J. G.: Lab Chip 9,
2145 (2009).

Chem. Listy 107, s367–s369 (2013) CECE Junior 2013 Posters
s367
MICHAELA GALLEEa, MILAN FRAŇO
b, and PAVOL KOIŠ
a a Comenius University in Bratislava, Faculty of Natural Sciences, Department of Organic Chemistry, Bratislava, b Comenius University in Bratislava, Faculty of Natural Sciences, Department of Molecular Biology, Bratislava, Slovak Republic [email protected] Summary
1. Introduction Over the last years the selective detection of the anion
pyrophosphate (PPi) seems very required. PPi is a biologically important target, mainly is a component of all nucleotides, which are a major component of DNA and RNA. Many a time nucleotides or nucleosides are results of enzymatic reactions, especially reactions, which are
catalyzed by kinases or phosphatases and glycosyltransferases. The binuclear zinc complex-based fluorescent probe for detection PPi appears useful1–3. This chemosensor strongly bind to PPi and emit increased fluorescence intensity. Fluorescent chemosensors have multiple advantages, primarily high sensitivity, low cost, easy of application, and versatility. This work is focused on synthesis of 9,10-bis[(2,2-dipicolylamino)methyl]anthracene-zinc complex, its fluorescent properties and applications.
2. Synthesis of the Zinc complex 1 Fluorescent chemosensor 9,10-bis[(2,2’-dipicolyl-
amino)methyl]anthracene-zinc complex 1 was prepared by three-step synthesis (Fig. 1). The first step was synthesis of 9,10-bis(chloromethyl)anthracene by chloromethylation of anthracene4. The second step was nucleofilic substitution of 9,10-bis(chloromethyl)anthracene with 2,2’-dipicolylamine to provide 9,10-bis[(2,2’-dipicolylamino)methyl]anthracene. The chemosensor 1 was prepared by complex-forming reaction of 9,10-bis[(2,2’-dipicolylamino)methyl]anthracene with Zn(NO3)2
(ref.2). Fluorescence spectra were recorded on a Tecan Safire 2 Microplate Reader.
APLICATION OF FLUORESCENT CHEMOSENSOR FOR ENZYMATIC ANALYSIS
Fig. 1. Synthesis of fluorescent chemosensor 1

Chem. Listy 107, s367–s369 (2013) CECE Junior 2013 Posters
s368
3. Results and discussion Prepared fluorescent probe 1 was tested in the
presence of various molecules, which are common parts of the enzymatic reactions. A remarkably large fluorescence enhancement was observed when PPi was added to the neutral aqueous solution of 1 (Fig. 2, 3).
Glycosylated nucleotides are typical substrates for glycosyltransferases, whereas non-glycosylated nucleotides are products of these enzymes. For this reason, we tested effect of UDP, UDP-glucose and GDP, GDP-
mannose on fluorescent of chemosensor 1. We found that chemosensor 1 is able to recognize and bind free UDP and analogical GDP and markedly increase of fluorescent intensity. On the other hand, glycosylated nucleotides don´t have the same effect on fluorescent intensity, (Fig. 4).
Finally, we applied receptor 1 for determination of activity phosphatidyl-manosyltransferase and flavonol-3-O-glucosylransferase. We found that chemosensor is able to recognize and bind UDP and GDP in a dynamic system such as enzymatic reaction (data not shown).
4. Conclusions Many chemosensors for cations are known, the
spectrum of chemosensors for anions is much poorer, despite their important role in biology, clinical diagnostics, and environmental monitoring. This paper shows the possibility of fluorescent analyzing biological anions, concretely pyrophosphate. Prepared binuclear zinc complex based fluorescent probe 1 selectively senses PPi and nucleotides with a large fluorescence enhancement, whereas no detectable fluorescence change was induced by monophosphate species and various other anions. Fluorescence of 1 is greatly intensified by the UDP and GDP, whereas the glycosylated UDP-glucose and GDP-mannose does not induce the fluorescence change. To our knowledge we use this chemosensor for analysis of enzymatic activity manosyltransferase and O-gluco-syltransferase. The detailed study of prepared chemosensor
Fig. 3. Fluorescent spectral change of receptor 1 [5 M] upon the addition of PPi: [PPi] = 0, 5, 10, 15, 20 M; (λex = 380 nm, λem = 400–600 nm). (Inset) Fluorescent titration curve of 1 [5 M] upon addition of PPi: [PPi] = 0, 5, 10, 15, 20 M (λex = 380 nm, λem = 434 nm)
Fig. 2. Photograph of the increased emission of the receptor 1 in the presence of pyrophosphate (right); the solution of 1 only (left); only water (middle)

Chem. Listy 107, s367–s369 (2013) CECE Junior 2013 Posters
s369
is oriented to the development of sensitive and fast real-time method for determination of specific enzymes.
This work was carried out with the financial support
from the VEGA grants Nos. 1/0962/12.
REFERENCES 1. Ojida A., Hamachi I.: Bull. Chem. Soc. Jpn. 79, 35
(2006). 2. Ojida A., Mito-oka Y., Inoue M., Hamachi I.: J. Am.
Chem. Soc. 124, 6256 (2002). 3. Wongkongkatep J., Miyahara Y., Ojida A., Hamachi
I.: Angew. Chem. Int. Ed. 45, 665 (2006). 4. Altava B., Burguete M. I., Escuder B., Luis S. V.,
García-España E., Muñoz M. C.: Tetrahedron. 53, 2629 (1997).
Fig. 4. (A) Fluorescent titration curves of 1 [1M] upon addition of UDP and UDP-glucose: [UDP;UDP-glc]: 0,2; 0,4; 0,6; 0,8; 1; 1,2; 1,4 M; (B) Fluorescent titration curves of 1 [2 M] upon addition of GDP and GDP-mannose [GDP; GDP-man]= 1, 2, 4, 6 M; (λex = 380 nm, λem = 437 nm)

Chem. Listy 107, s370–s372 (2013) CECE Junior 2013 Posters
s370
MICHAL GREGUŠa,b, PETR KUBÁŇ
b, and FRANTIŠEK FORET
b
a Department of Chemistry, Masaryk University, Brno, b Group of Bioanalytical Instrumentation, CEITEC MU, Brno Czech Republic [email protected] Summary
A miniature sampler for exhaled breath condensate
(EBC) collection was constructed and the repepatability of the collection procedure was studied. The samples were analyzed by CE-C4D home-made instrument. To improve the repeatability of the EBC collection, first the collection tubes, straws and vials require cleanup to remove unwanted interferents. Second, the breathing pattern should be kept uniform. We demonstrate that by adopting these measures, repeatability can be improved from 21.4–186.5 % RSD (non-standardized sampling) to 3.6–80.3 % RSD (standardized sampling) and is comparable than with the commercial device (6.6–75.6 % RSD).
1. Introduction Exhaled breath condensate (EBC) is a promising
diagnostic body fluid that can be applied in lung respiratory research and diagnosis. EBC is obtained by cooling and condensation of exhaled air (non-invasive sampling). Its main components are inorganic ions, small organic molecules and proteins. The utility of EBC in clinical practice has however been hampered by the low repeatability, lack of standardization of both the collection equipment and the breathing techniques, resulting in large spread of the clinical data. In this work we have attempted to improve the repeatability of the sampling by (i) designing procedures for proper cleanup and maintenance of the collection devices and by (ii) standardization of breathing pattern.
2. Experimental
2.1. Electrophoretic and detection system, injection, electrolytes A purpose-built CE instrument with C4D detector1
was employed for all electrophoretic separations. The separation voltages of –15 kV and +15 kV (for cations and anions, respectively) were provided by a high voltage
power supply unit (Spellman CZE2000R Start Spellman, Pulborough, UK). The separation capillaries were fused-silica capillaries (50 m I.D., 360 m O.D., 44/20 cm total/effective length, Polymicro Technologies, Phoenix, AZ, USA). Standards and EBC samples were injected hydrodynamically at 15 cm for 60 s. The optimized BGE composition2 used in this work was 20 mmol L–1 MES, 20 mmol L–1 HIS, 30 mol L–1 CTAB and 2 mmol L–1 18-crown-6 at pH 6 and was used for separation of both anions and cations only by reversing the voltage polarity.
2.2. Samplers for EBC collection
Two types of EBC samplers were used and tested and
are depicted in Fig. 1. Laboratory-made sampling device was constructed from a 2 ml polypropylene syringe and a cooled (–20 °C) aluminium cylinder to achieve with maximum simplicity and minimal cost (unit price is about 1 CZK, excl. cooling cylinder). For comparison a commercially available device (R-Tube, www.r-tube.com) was used (unit price is about 500–700 CZK, excl. cooling cylinder). The laboratory-made device was constructed so that it would facilitate the sampling of a single exhaled breath. 3. Results and discussion
To improve the repeatability of the sampling, we have
optimized the cleanup and maintenance procedure for the laboratory-made sampler and also standardized the breathing patterns. The EBC was analyzed by CE-C4D and the peaks were identified by spiking with standards.
3.1. Typical electropherogram and identification of
peaks See Fig. 2.
3.2. Cleaning procedures As a first procedure to improve sampling
repeatability, new syringes were washed with DI water and immersed into a large beaker with DI water for 24 hours and sealed to prevent absorption of the components for the laboratory air. After 24 hours, syringes were flushed with deionized water and dried up by clean, dry air. The same procedure was also applied for collection vials (0.25ml volume) and sampling straws. Sealed, pre-cleaned R-tube samplers were used as supplied from the manufacturer. Cleaned vials were also used for storage of EBC collected by R-Tube. This cleaning procedure resulted in significantly improved repeatability of the measured ions
IMPROVING THE REPEATABILITY OF SAMPLING PROCEDURES FOR EXHALED BREATH CONDENSATE ANALYSIS

Chem. Listy 107, s370–s372 (2013) CECE Junior 2013 Posters
s371
Fig. 1. Schematic view of the laboratory-made EBC sampler (A) and R-Tube (B) used in the studies
Fig. 2. Analysis of EBC. Electropherogram of determination of cations (line A) and anions (line B). CE conditions are the same as in part 2.1.
0 1 2 3 4time [min]
350
400
450
500
550
600
650
vo
ltag
e [
mV
]
NH4+
K+
Ca2+
Na+ Mg2+
Cl-
NO2-
NO3-
SO42-
acetatelactate
propionate
butyrate
A
B
in the samples. For comparison, non-standardized sampling was used, in which new syringes, vials and straws were tested without any cleanup procedure.
3.3. Breathing patterns Secondly, the breathing patterns were standardized.
Every collected EBC sample was obtained upon three deep

Chem. Listy 107, s370–s372 (2013) CECE Junior 2013 Posters
s372
0
400
800
1200
0
40
80
120
160
Cl- NO3- acetate propionate NO2- SO42- lactate butyrate
standardized lab-made sampler
non-standardized lab-made sampler
R-Tube
Fig. 3. Range comparison of values of peaks areas obtained by standardized/non-standardized lab-made sampler and R-Tube
exhales of the same length (eight seconds). This corresponded to the total exhaled volume of 9.6 L (3 3.2 L) and the approximate volume of EBC was 60 L. Prior to collection, the volunteers were asked to calmly breathe for 5 minutes. To maintain similar breathing pattern when using R-tube device, every collected EBC sample was obtained upon three deep exhales of the same length (four seconds, due to the larger ID of the collection tube). The exhaled volume and the collected EBC volumes were thus identical. In non-standardized collection, there was no control of the breathing pattern, exhaled volume and number of exhalations. The results are shown in Fig. 3.
4. Conclusions A laboratory-made sampler was optimized for
analysis of ionic content of EBC. The repeatability of the collection procedure was studied and two important procedures are suggested to improve the overall collection repeatability. First the collection tubes, straws and vials require cleanup to remove unwanted interferents. Second, the breathing pattern should be kept uniform and possibly the total exhaled volume should be the same. We
demonstrate that by adopting these measures, repeatability can be improved from 21.4–186.5 % RSD (non-standardized sampling) to 3.6–80.3 % RSD (standardized sampling) and is comparable than with the commercial device (6.6–75.6 % for R-tube). Further, the developed laboratory-made sampler is significantly cheaper and allows collecting the EBC from a single breath. The research and characterization of a single breath is in progress.
The authors acknowledge the financial support from
the Grant Agency of the Czech Republic (Grant No. P206/13/21919S). Part of the work was realized in CEITEC – Central European Institute of Technology 355 with research infrastructure supported by the project CZ.1.05/1.1.00/02.0068 356 financed from European Regional Development Fund.
REFERENCES 1. Zhang L., Khaloo S. S., Kubáň P., Hauser P. C.:
Meas. Sci. Technol. 17, 3317 (2006). 2. Kubáň P., Kobrin E. G., Kaljurand M.: J.
Chromatogr., A 1267, 587 (2012).

Chem. Listy 107, s373–s375 (2013) CECE Junior 2013 Posters
s373
JANA HORSKÁ, PAVLÍNA GINTEROVÁ, JURAJ ŠEVČÍK, and JAN PETR
Regional Centre of Advanced Technologies and Materials – Department of Analytical Chemistry and Department of Analytical Chemistry, Faculty of Science, Palacký University in Olomouc, Olomouc, Czech Republic [email protected] Summary
Imatinib, bosutinib, dasatinib, pazopanib, erlotinib,
canertinib and vatalanib are new important anticancer drugs, especially for treatment chronic myeloid leukemia. All of these substances without imatinib are being tested in clinical trials with very promising results. Imatinib is the standard first-line therapy at chronic myeloid leukemia for almost 10 years. The aim of our work was to develop the
fastest separation of all these drugs in one run. According to the structure of drugs, capillary zone electrophoresis was chosen. The separation was performed with a background electrolyte containing 100 mM phosphoric acid, adjusted by sodium hydroxide to pH 2.75.
1. Introduction Imatinib, bosutinib, dasatinib, pazopanib, erlotinib,
canertinib and vatalanib (chemical structures are shown in Fig. 1) are newly developed drugs that may successfully be used for the treatment of patients with chronic myeloid leukemia (CML), gastrointestinal stromal tumors (GIST) and other disaeses1. CML, the general term for cancers of the blood, is a clonal myeloproliferative disorder of the hematopoietic stem cell, which presents an acquired cytogenetic abnormality, the Philadelphia chromosome (Ph). The Ph, which occurs as a result of reciprocal
A PILOT STUDY ON SEPARATION OF NEW DRUGS FOR TREATMENT OF LEUKEMIA BY CAPILLARY ZONE ELECTROPHORESIS
Fig. 1. Structures of anticancer drugs. a, imatinib; b, bosutinib; c, pazopanib; d, dasatinib; e, erlotinib; f, canertinib; g, vatalanib
a b
c d
e f g

Chem. Listy 107, s373–s375 (2013) CECE Junior 2013 Posters
s374
translocation between chromosomes 9 and 22, produces a Brc-Abl gene, which encodes a protein with elevated tyrosine kinase activity which is responsible for the disease pathogenesis1,2. All of these drugs are classified as inhibitors of tyrosine kinases2.
Imatinib (also known as the Gleevec) is the most studied substance of these drugs. Imatinib is the standard first-line therapy at any of the three stages CML (blast crisis, accelerated phase, or in chronic phase after failure of interferon- therapy) for almost 10 years. Imatinib is a rationally designed oral signal transduction inhibitor that specifically targets several protein tyrosine kinases, Abl, Arg (Abl-related gene), the stem-cell factor receptor (c-KIT), the platelet-derived growth factor receptor (PDGF-R), and their oncogenic forms, most notably Bcr-Abl (ref.3–5).
In this study, the capillary electrophoresis (CE) method with UV detection was used to separate the anticancer drugs. CE is a powerful analytical separation technique, which is popular in analysis of various drugs in biological samples, pharmaceutical preparations and environmental matrices6. The main advantages of CE are the fast and precise separations with lower cost, which includes low solvent, electrolyte and sample consumption7.
2. Experimental
2.1. Chemicals and reagents Electrolyte components: phosphoric acid and sodium
hydroxide were purchased from Sigma Aldrich (St. Louis,
MO, USA). The drugs standards, imatinib, bosutinib, dasatinib, pazopanib, erlotinib, canertinib and vatalanib were bought from the LC Laboratories (Woburn, USA). Bosutinib was bought also from Sigma Aldrich. Stock standard solutions of all drugs were prepared at a concentration of 1 mg mL–1 in deionized water and methanol and were appropriately diluted in deionized water for preparation working solutions at concentration of 10 g mL–1. All solutions were stored under refrigeration at –20 °C in the absence of light. 2.2. Apparatus
All the separations were performed on the capillary electrophoresis system HP 3DCE (Agilent Technologies, Waldbronn, Germany) with the diode array detector; the detection wavelength was 214 nm. Uncoated fused silica capillaries (MicroSolv Technology, NJ, USA) with 50 m i.d., total capillary length 33.0 cm, effective length 24.5 cm, were used in these experiments. The capillary cassette was thermostated at 25°C. Before each analysis the capillary was rinsed with 0.1 mol L–1 NaOH (2 min), deionized water (3 min), and then with the buffer (5 min).
3. Results and discussion First, dissociation constants (pKa) of the studied
analytes were estimated using the MarvinSketch software. According to the calculated pKa values, it was found that all studied analytes are positively charged at low pH values. For this reason, the first experiments were tested in acidic pH (2.0–3.0). As a starting buffer, phosphate buffer at concentration of 100 mM was chosen. Then, the effect
Fig. 2. Electropherogram of analyzed drugs. 1, vatalanib; 2, imatinib; 3, bosutinib; 4, canertinib; 5, dasatinib; 6, pazopanib; 7, erlotinib

Chem. Listy 107, s373–s375 (2013) CECE Junior 2013 Posters
s375
of pH was evaluated with sodium as counter-ions. The pH of 2.0, 2.25, 2.5, 2.75 and 3.0 was tested. Only partial separation provided the pH values of 2.0, 2.25, 2.5 and 3.0. The best separation was achieved at the pH of 2.75 (Fig. 2). All the analytes were separated in 8 minutes with following migration order: vatalanib, imatinib, bosutinib, canertinib, dasatinib, pazopanib and erlotinib. Relative standard deviations of migration times did not exceed 0.9 %.
4. Conclusion In this study, an easy and fast CZE method for
separation of anticancer drugs was developed. As a consequence, we believe that the proposed method can be an interesting alternative for the determination of these drugs by liquid chromatography.
The financial support of the research by the
Operational Program Research and Development for Innovations – European Regional Development Fund (project CZ.1.05/2.1.00/03.0058) and the Operational Program Education for Competitiveness – European
Social Fund (project CZ.1.07/2.3.00/20.0018), the Grant Agency of the Czech Republic (project P206/12/1150), and the Student project UP Olomouc PrF_2013_030 is gratefully acknowledged.
REFERENCES 1. Ajimura T. O., Borges K. B., Ferreira A. F., Gastro F.
A., Gaitani C. M.: Electrophoresis 32, 1885 (2011). 2. Khoury H. J., Cortes J. E., Kantarjian H. M.,
Gambacorti-Passerini C., Baccarani M., Dong-Wook K., Zaritskey A., Countouriotis A., Besson N., Leip E., Kelly V., Brümmendorf T. H.: Blood 119, 3403 (2012).
3. Li J., Huang Y., Huang L., Ye L., Zhou Z., Xiang G., Xu L.: J. Pharm. Biomed. Anal. 70, 7026 (2012).
4. Mumprecht S., Matter M., Pavelic V., Ochsenbein A. F.: Blood 85, 3406 (2006).
5. Flores J. R., Berzas J. J., Castaneda G., Rodriguez N.: J. Chromatogr., B 794, 381 (2003).
6. Alia I., Haquea A., Wania W. A., Saleema K., Zaabib M. A.: Biomed. Chromatogr. 27, 1296 (2013).
7. Rosemana D. S., Weinbergerb R.: J. Pharm. Biomed. Anal. 85, 67 (2013).

Chem. Listy 107, s376–s377 (2013) CECE Junior 2013 Posters
s376
HRONEŠOVÁ L.a, HOLACKÁ K.a, POLÁŠKOVÁ A.b, ADÁMIK M.b, NAVRÁTILOVÁ L.b, TICHÝ V.b, HELMA R.b, BALLOVÁ Ľ.c, BUSOVA M.d, BAŽANTOVÁ P.e, FOJTA M.b, and BRÁZDOVÁ M.a,b
a University of Veterinary and Pharmaceutical Sciences Brno, Faculty of Pharmacy, Department of Chemical Drugs, Brno, b Institute of Biophysics, v. v. i., Brno, c University of Veterinary and Pharmaceutical Sciences Brno, Faculty of Pharmacy, Department of Natural Drugs, Brno, d University of Veterinary and Pharmaceutical Sciences Brno, Faculty of Veterinary Hygiene and Ecology, Department of Biochemistry, Biophysics and Chemistry, Brno, e University of Ostrava, Faculty of Nature Science, Department of Biology and Ecology, Ostrava, Czech Republic
1. Introduction Tumor suppressor p53 protein (wtp53) is
a transcription factor regulating cell response to cellular and genotoxic stress. Wtp53 function is based on sequence specific interactions with DNA sequences (p53CON) in gene promoters responsible for progression of cell cycle, apoptosis and DNA repair. Mutation in TP53 gene occurs in about 50 % of cancer cases. Expression of mutant p53 proteins is associated with increased cancer resistance to chemo- and radiotherapy and tumor progression. Mutant p53 protein pro-oncogenic functions are connected to
mutp53 conformation, inability to regulate wtp53 target genes, ability to regulate pro-oncogenic mutp53 target genes and blocking of tumor suppressor functions of family members -p63 and p73. Wtp53 conformation is dependent on presence of zinc ion, as an important cofactor of p53 structure. Interestingly, many of mutant p53 proteins contain destabilized protein conformation and are prone to loss of zinc ion. One direction of novel antitumor therapies is focused on p53 reactivation. Recently it was shown that zinc can re-established chemosensitivity in breast cancer cell with R175H mutant p53. The mechanism of reactivation is still not fully understood1. In our work we concentrated on investigating of zinc role in mutant p53 biochemistry of glioblastoma cell lines Onda 10, Onda 11 and U251.
2. Experimental Glioblatoma cell lines U87, Onda 10, Onda 11 and
U251 (expressing wtp53, G245S, R273C and 273H) were cultivated and treated with cisplatin or doxorubicin and supplemented by ZnCl2 as described in ref.1–3. Colony assay, western-blotting analysis was described in ref.1–3.
3. Results and discussion To evaluate whether zinc could affect p53 mutant pro-
oncogenic function, we first analyzed the effect of zinc ions on long term survival of glioblastoma cell lines expressing different mutant p53 proteins (G245S, R273C
INFLUENCE OF P53 MUTATION ON RESPONSE OF HUMAN GLIOBLASTOMA TO CYTOSTATIC TREATMENT
Onda11 (R273C)
ZnCl2 - + - +
DOX - - + +
U251 (R273H)
ZnCl2 - + - +
DOX - - + +
0,0
20,0
40,0
60,0
80,0
100,0
120,0
mock Zn DOX DOX+Zn
% c
olo
ny
form
ing
abili
ty
0,0
20,0
40,0
60,0
80,0
100,0
120,0
mock Zn DOX DOX+Zn
% c
olo
ny
form
ing
abili
ty
Fig. 1. Colony forming assay, cell survival after zinc and doxorubicin treatment

Chem. Listy 107, s376–s377 (2013) CECE Junior 2013 Posters
s377
and R273H) in response to doxorubicin and cisplatin treatments. We observed significant enhancement of cell death in U251 and Onda11 cell lines after doxorubicin treatment followed zinc supplementation as shown by quantization of colony assays (Fig. 1). This finding is in agreement with previously observations done with breast cancer cell line expressing R175H (ref.1) and suggests that zinc supplementation might affect anti-tumor drug treatment of mutant p53 expressing cell lines. We next addressed the question of whether mutant p53 is stabilized after drug treatment in glioblastoma cell lines. We observed significant induction of p53 protein expression after cisplatin, 5-FU or doxorubicin treatment in all three glioblastoma cell lines, interestingly each cell line reacts uniquely (Fig. 2). Mutant p53 stabilization was observed in U251 by all used drugs (the best response was observed with 5-FU), in the case of Onda11 the best inducing agent was doxorubicin and for Onda10 we observed only weak activation after 5-FU and doxorubicin treatment.
To determine effect of zinc supplementation on cytotoxicity of tested anticancer drugs we have used MTT assay and the results showed, that zinc enhanced cytotoxicity mainly for doxorubicin treatment. Finally we investigated the effect of zinc ion on p53-DNA interaction in vitro and in cells by EMSA and luciferase reporter assay. In agreement with our previous finding4 we observed using EMSA that zinc ion inhibits binding of purified p53 proteins, zinc inhibition is reversible and can be restored by excess of EDTA or DTT. Interestingly, zinc treatment on cells did not affect p53 binding to DNA as was observed by lucifierase assay. Moreover we observed activation of p53-DNA binding activity by zinc supplementation. So far we were not successful in reactivating of p53-DNA specific activity of studied purified mutant p53 proteins but experiments with mutant p53 proteins directly prepared from glioblastoma cells are still ongoing.
4. Conclusions Zinc has a crucial role in biology of p53. Our results
show that zinc supplementation might affect anti-tumor drug treatment of mutant p53 expression cell lines U251, Onda11 and Onda10.
This study was supported by the IGA VFU Brno
103/2013/FaF, by the Czech Science Foundation 13-36108S and SGS07/PrF/2013 for P.B.
REFERENCES 1. Puca R., Nardinocchi L., Porru M., Simon A. J., et al.:
Cell Cycle 10, 1679 (2011). 2. Brazdova M., Navratilova N., Tichy V., Nemcova K.,
et al.: PloS One 8, e59567 (2013). 3. Brazdova M., Quante T., Togel L., Walter K., et al.:
Nucleic Acids Res. 37, 1486 (2009). 4. Palecek E., Brazdova M., Brazda V., Palecek J., et al.:
FEBS J. 268, 573 (2001).
β-actin
p53
p53
Onda10p53
β -actin
Onda11
U251
- cis 5-FU DOXCell line
β -actin
(R273H)
(R273C)
(G245S)
β-actin
p53
p53
Onda10p53
β -actin
Onda11
U251
- cis 5-FU DOXCell line
β -actin
β-actin
p53
p53
Onda10p53
β -actin
Onda11
U251
- cis 5-FU DOXCell line
β-actin
p53
p53
Onda10p53
β -actin
Onda11
U251
- cis 5-FU DOXCell line
β-actin
p53
p53
Onda10p53
β -actin
Onda11
U251
- cis 5-FU DOXCell line
β -actin
(R273H)
(R273C)
(G245S)
Fig. 2. p53 analysis after drug treatment

Chem. Listy 107, s378–s380 (2013) CECE Junior 2013 Posters
s378
IVETA HUKELOVÁ, ĽUDOVÍT SCHREIBER, and RADOSLAV HALKO Department of Analytical Chemistry, Faculty of Natural Sciences, Comenius University in Bratislava, Bratislava, Slovakia [email protected] Summary
The aim of this paper was developed a simple liquid chromatography method for determination organic acids in various sample matrixes. For this purpose, ion-exclusion chromatography (IEC) was used and the organic acids were determinate in human urine sample and wine sample. 1. Introduction
Separation, identification and quantitative analysis of
aliphatic and aromatic acids are important due to their widespread presence in the environment and the use of both in medicine, agriculture and industry.
Free form aliphatic acids are found in various fruits e.g. malic acid in apples, citric acid in citrus fruits or tartaric, lactic and malic acids in grapes which concentration is necessary to know in winemaking. In the food industry are used as preservatives, for example benzoic acid as the sodium salt, which has the characteristics of an inhibitor for microorganisms. Carboxylic acids also serve as indicators of certain diseases, when their higher concentration e.g. in urine evokes a metabolic disorder called organic aciduria, which belongs to the hereditary metabolic disorders. The best known acidurias are propionic, glutaric, methylmalonic and pyroglutaric acid. Determination of carboxylic acids is very important for patients with diabetes, kidney disease and other metabolic disorders1–3.
2. Experimental
2.1. Chemicals All analytical standard-grade organic acids were
obtained from Merck (Darmstadt, Germany) as the methanol (< 99% (v/v) for liquid chromatography). Stock standard solutions were obtained by dissolution of the acids in Simplicity water or methanol. The Simplicity water was purified by passage through a Simplicity® Ultrapure Laboratory Water Systems (Molsheim –
France). Potassium dihydrogen phosphate (KH2PO4) and 85 % (v/v) phosphoric acid (H3PO4) supplied by Merck (Darmstadt, Germany) were used for the preparation of mobile phase. Hydrochloric acid 37% (v/v) (Merck – Darmstadt, Germany) and ethyl acetate (Chemapol Group – Prague, Czech Republic) were used for human urine sample pretreatment.
2.2. Apparatus
Separation was carried out on a liquid
chromatography Elite LaChrom (Merck – Hitachi, Darmstadt, Germany) equipped with pump L-2130, autosampler L-2200, thermostat L-2300, diode array detector L-2450. Organic acids were separated on a silica based analytical column with specially modified reversed-phase functional group Alltech PrevailTM organic acid 5 m (150 × 4.6 mm, I.D) with an Prevail organic acid 5 m (7.5 × 4.6 mm, I.D) guard column (Grace – Deerfield, USA).
3. Results and discussion The composition of the separation buffer solution and
further experimental conditions have been optimized to achieve the best separation of organic acids. Aliphatic and aromatic acids were simultaneously separated using mobile phase composed of (A) 25 mmol L–1 KH2PO4 with pH 2.3 and (B) methanol with 25 mmol L–1 H3PO4 in ratio 80:20. The separation was performed with gradient elution at 25 °C and flow rate of 1 mL min–1. Injected volume of standard solutions mixture was 20 L. The organic acids were detected with DAD at 220 nm. The gradient parameters are listed in Tab. I and obtained chromatogram is shown in Fig. 1.
Calibrations for test acids were obtained by plotting peak area vs. concentration and were linear in the range 0.01–10 mmol L–1. The concentration dependences are linear, with coefficients of correlation better than 0.998 and detection limits (S/N = 3) were from 0.1 mmol L–1 to 0.1 mol L–1. The reproducibility (relative standard deviation, n = 3) from injecting 20 L of standard solution of test acids ranged between 0.33 % and 3.66 %.
The proposed method was demonstrated for the simultaneous determination of aliphatic and aromatic acids in human urine sample and wine sample. Organic acids were extracted from human urine using ethyl acetate after acidified with 5 mol L–1 HCl. The organic solvent was evaporated to dryness and the residues were re-dissolved in 1 mL of phosphate buffer. The white wine (Devín 2012, Topoľčianky s.r.o) was diluted with phosphate buffer in ratio 1:5 and was directly injected into the
DETERMINATION OF ALIPHATIC AND AROMATIC CARBOXYLIC ACIDS IN DIFFERENT SAMPLES BY ION-EXCLUSION CHROMATOGRAPHY

Chem. Listy 107, s378–s380 (2013) CECE Junior 2013 Posters
s379
chromatographic system. Fig. 2 and 3 show obtained sample chromatograms.
The quantification of organic acids in samples was carried out by using the method of calibrations curve and standard addition method. We used the standard addition method to determine whether the matrix of a sample changes the analytical sensitivity. The identified organic acids and their concentrations in both samples are listed in Tab. II.
4. Conclusions The proposed HPLC method with DAD detection
could be used for automated analysis of the main and minor organic acid in human urine sample and wine due to the simple sample pre-treatment and the good validation results (LOD, linearity, precision and recovery). Continuing work in our laboratory will be focused on separation of organic acids using HPLC in combination with mass spectrometry.
Time (min) 0 8 15 36 43 44 45 46 47 57
A (%) 100 100 72 48 30 30 10 10 100 100
B (%) 0 0 28 52 70 70 90 90 0 0
Table I Gradient elution parameters for separation of aliphatic and aromatic acids
Fig. 1. Chromatogram of model mixture of 32 organic acids. Peak identification: (1) oxalic, (2) tartaric, (3) malic, (4) malonic, (5) lactic, (6) acetic, (7) maleic, (8) citric, (9) succinic, (10) fumaric, (11) propionic, (12) levulic, (13) methylsuccinic, (14) pyromellitic, (15) galic, (16) 3,4-dihydroxybenzoic (17) 3,5-dihydroxybenzoic, (18) trimellitic, (19) phtalic, (20) 4-hydroxybenzoic, (21) 2,4-dihydroxybenzoic, (22) vanillic, (23) syringic, (24) 2-methoxybenzoic, (25) trimesic, (26) benzoic, (27) ferulic, (28) salicylic, (29) 3-methoxybenzoic, (30) 2-methylbenzoic, (31) cinnamic, (32) 3-methoxycinnamic
Fig. 2. Chromatogram of human urine sample. Peak identification: see Fig. 1
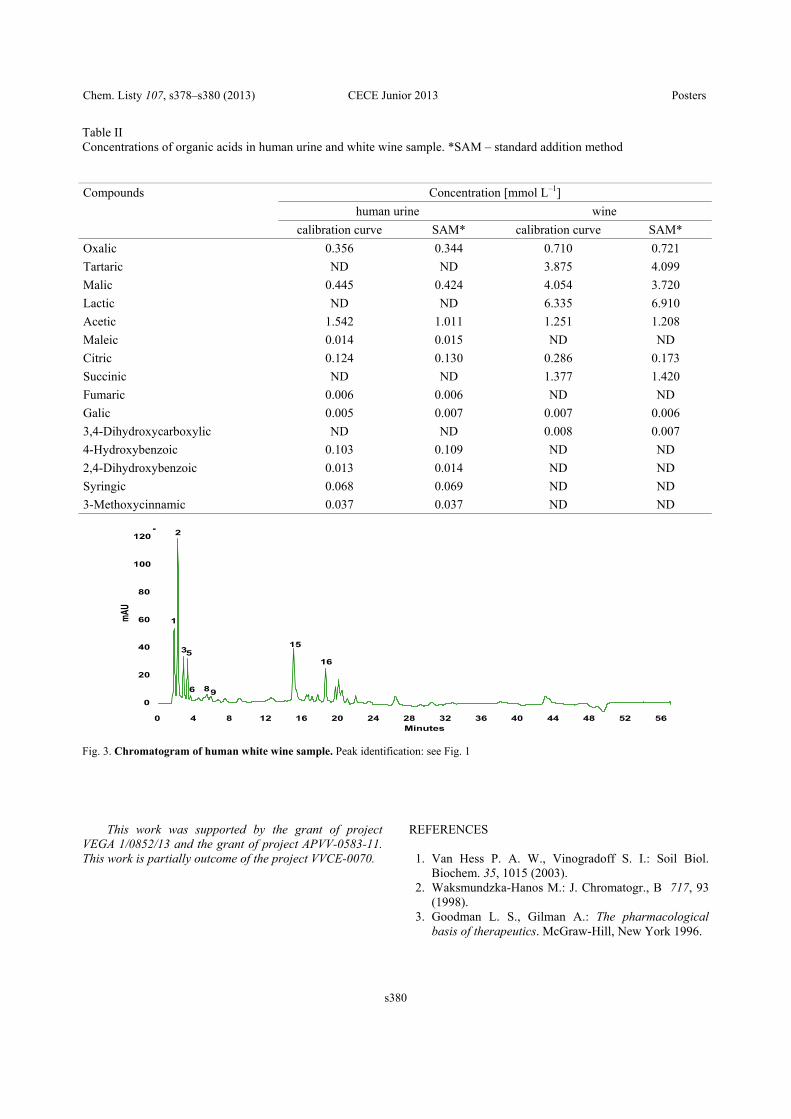
Chem. Listy 107, s378–s380 (2013) CECE Junior 2013 Posters
s380
This work was supported by the grant of project VEGA 1/0852/13 and the grant of project APVV-0583-11. This work is partially outcome of the project VVCE-0070.
REFERENCES 1. Van Hess P. A. W., Vinogradoff S. I.: Soil Biol.
Biochem. 35, 1015 (2003). 2. Waksmundzka-Hanos M.: J. Chromatogr., B 717, 93
(1998). 3. Goodman L. S., Gilman A.: The pharmacological
basis of therapeutics. McGraw-Hill, New York 1996.
Compounds Concentration [mmol L–1]
human urine wine
calibration curve SAM* calibration curve SAM*
Oxalic 0.356 0.344 0.710 0.721
Tartaric ND ND 3.875 4.099
Malic 0.445 0.424 4.054 3.720
Lactic ND ND 6.335 6.910
Acetic 1.542 1.011 1.251 1.208
Maleic 0.014 0.015 ND ND
Citric 0.124 0.130 0.286 0.173
Succinic ND ND 1.377 1.420
Fumaric 0.006 0.006 ND ND
Galic 0.005 0.007 0.007 0.006
3,4-Dihydroxycarboxylic ND ND 0.008 0.007
4-Hydroxybenzoic 0.103 0.109 ND ND
2,4-Dihydroxybenzoic 0.013 0.014 ND ND
Syringic 0.068 0.069 ND ND
3-Methoxycinnamic 0.037 0.037 ND ND
Fig. 3. Chromatogram of human white wine sample. Peak identification: see Fig. 1
Table II Concentrations of organic acids in human urine and white wine sample. *SAM – standard addition method

Chem. Listy 107, s381 (2013) CECE Junior 2013 Posters
s381
HUI CHEN, ERWIN ADAMS, and ANN VAN SCHEPDAEL Pharmaceutical Analysis, Faculty of Pharmaceutical Sciences, KU Leuven, Leuven, Belgium [email protected] 1. Introduction
Phosphorylation mediated by protein kinase is one of
the most common post-translational modifications known to regulate biological output1. Abl1 is a tyrosine kinase, one of the three main classes of protein kinase. The Bcr-Abl fusion gene is associated with chronic myeloid leukemia2. Developing a cost- and time-effective method for screening kinase inhibitors has become very important nowadays. In this report, an on-line screening of Abl1 inhibitors by CE/MS using transverse diffusion of laminar flow profiles (TDLFP)3,4 for reactant mixing is presented.
2. Experimental CE/MS experiments were carried out on a Beckman
P/ACE MDQ (Beckman Coulter, Fullerton, CA, USA) coupled to an Esquire 3000 HCT ion trap mass spectrometer (Bruker Daltonics, Bremen, Germany) using a sheath liquid co-axial interface from Agilent Technologies (Waldbronn, Germany). CE analyses were performed in fused-silica capillary (85 cm total length, 50 m i.d.). New fused-silica capillaries were rinsed with 1 M-NaOH for 30 min at 20 psi and water for 15 min at 20 psi. After this treatment, capillaries were coated with a bilayer coating of Polybrene-poly(vinyl sulfonic acid) (PB-PVS). The phosphorylation was initiated in the capillary by mixing three reactant plugs using TDLFP. After reaction, the phosphorylated product was separated using a separation voltage of 30 kV and quantified in the selected reaction monitoring (SRM) mode.
3. Results and discussion
3.1. MS optimization A sheath liquid of water-methanol (50:50, v/v)
containing 0.1% formic acid at a flow rate of 5 L min–1 was used. The positive ion mode was used. By using the SRM mode the sensitivity enhanced about 60 fold compared with MS full scan mode.
3.2. CE system
20 mM ammonium acetate buffer with pH of 6.8 was
used as BGE. To conquer the protein adsorption problem, capillary coating was performed. In order to prevent MS contamination and detection interference, static coatings have to be used. In this work, PB-PVS were strongly attached to the capillary surface by adsorption. This coating can be produced simply by flushing the capillary with solutions of PB and PVS.
3.3. Abl1 in-capillary reaction
TDLFP was chosen to mix the reactants in capillary
since it can be used for mixing more than two reactants. 2 mM MgCl2 in 20 mM ammonium acetate buffer with pH 6.8 was used as reaction buffer, which was similar to the BGE to avoid reaction and separation problems.
REFERENCES 1. Gratz A., Gotz C., Jose J.: Electrophoresis 31, 634
(2010). 2. Saglio G., Cilloni D.: Cell Mol. Life Sci. 61, 2897
(2004). 3. Krylova S. M., Okhonin V., Evenhuis C. J., Krylov S.
N.: Trend Anal. Chem. 28, 987 (2009). 4. Krylova S. M., Okhonin V., Krylov S. N.: J. Sep. Sci.
32, 742 (2009).
ON-LINE SCREENING OF ABL1 INHIBITORS BY CAPILLARY ELECTROPHORESIS COUPLED TO MASS SPECTROMETRY