quantification of product emissions from ... documents...isopropenyl-6-oxo-heptanal (ipoh), and...
TRANSCRIPT

EPHECT is co-funded by European Union (Executive Agency for Health and Consumers- EAHC) framework of the Health Programmes 2006-2013
QUANTIFICATION OF PRODUCT EMISSIONS FROM TRANSFORMATION REACTIONS WITH TERPENE CHEMISTRY IN A TEST CHAMBER, SIMULATING EXPOSURES FROM A KITCHEN CLEANING AGENT, A PASSIVE AIR FRESHENER, AND A PLUG-IN AIR FRESHENER WP6 – DELIVERABLE 7 NRCWE Asger W. Nørgaard, Peder Wolkoff VITO Frederick Maes, Marianne Stranger, Eddy Goelen Reviewer: Professor Derrick Crump, Cranfield University

“© NRCWE VITO JRC All rights on the materials described in this document rest with NRCWE, VITO and JRC. This document is produced in the frame of the EPHECT-project. The EPHECT-project is co-funded by the European Union in the framework of the health Programmes 2006-2013. The information and views set out in this document are those of the author(s) and do not necessarily reflect the official opinion of the European Union. Neither the European Union institutions and bodies nor any person acting on their behalf, nor the authors may be held responsible for the use which may be made of the information contained herein. Reproduction is authorized provided the source is acknowledged.”
Contents
3
Contents
LIST OF FIGURES ................................................................................................................................................ 4
LIST OF TABLES .................................................................................................................................................. 5
ABSTRACT .......................................................................................................................................................... 6
INTRODUCTION ................................................................................................................................................. 7
PART I: STUDY OF KITCHEN CLEANING AGENT AND A PLUG-IN AIR FRESHENER IN PRESENCE OF OZONE (BY NRCWE) ............................................................................................................................................................. 8
1.1 Methods ............................................................................................................................................ 8
1.2 Results ............................................................................................................................................. 11
1.3 Discussion ........................................................................................................................................ 13
PART II STUDY OF A PASSIVE AIR FRESHENER BEFORE AND AFTER ADDING OZONE (BY VITO AND JRC)....... 15
2.1 Introduction ..................................................................................................................................... 15
2.2 Methods .......................................................................................................................................... 15
2.3 Discussion ........................................................................................................................................ 17
REFERENCES..................................................................................................................................................... 22
List of figures
4
LIST OF FIGURES
Figure 1 Gas-phase concentrations of selected VOCs and ozone from the test of a kitchen cleaning agent (A2). ................................................................................................................................................................. 11 Figure 2 Gas-phase concentrations of limonene, selected VOCs and ozone from plug-in air freshener (A11). ......................................................................................................................................................................... 12 Figure 3 Concentration profiles of terpenoids before and after the addition of ozone to a passive air freshener emission experiment (higher concentrations) ................................................................................ 17 Figure 4 Concentration profiles of terpenoids before and after the addition of ozone to a passive air freshener emission experiment (lower concentrations) ................................................................................. 18 Figure 5 Concentration profiles of SRP before and after the addition of ozone to a passive air freshener emission experiment ....................................................................................................................................... 19 Figure 6 Concentration profile of formaldehyde measured by SIFT-MS before and after the addition of ozone to a passive air freshener emission experiment ................................................................................... 20 Figure 7 Total particle counts before and after the addition of ozone to a passive air freshener emission experiment ...................................................................................................................................................... 20 Figure 8 Size distribution of the total particles at the first concentration peak after adding the ozone to a passive air freshener experiment .................................................................................................................... 21

List of tables
5
LIST OF TABLES
Table 1 Test chamber specifications and test conditions for kitchen cleaning agent (KCA) and electrical air freshener (PIAF). ................................................................................................................................................ 9 Table 2 Health assessment (respiratory effects) of kitchen cleaning agent, low ozone (10 ppb). ................. 13 Table 3 Health assessment (respiratory effects) of kitchen cleaning agent, high ozone (50 ppb). ................ 13 Table 4 Health assessment (respiratory effects) of plug-in air freshener, low ozone (10 ppb) in 20 m3 chamber. .......................................................................................................................................................... 14 Table 5 Health assessment (respiratory effects) of plug-in air freshener, high ozone (50 ppb) in 20 m3 chamber. .......................................................................................................................................................... 14 Table 6 Test chamber specifications and test conditions for the passive air freshener (PAF) ........................ 15

Abstract
6
ABSTRACT
Emissions of volatile organic compounds from three consumer products (kitchen cleaning agent (cream), a plug-in and a passive air freshener) were investigated in 20 and 0.72 m³ climate chambers, respectively, at low (0-5 ppb) and high ozone (~50 ppb) conditions. The products emitted terpenoids, inter alia limonene, dihydromyrcenol, geraniol, and linalool.
For the kitchen cleaning agent and plug-in air freshener ozone-initiated reactions were observed by air sampling on Tenax TA, followed by thermal desorption combined with gas chromatography and mass spectrometry and carbonyls sampled on DNPH cartridges and analyzed by HPLC. A number of oxygenated and poly-oxygenated reaction products were identified in the 20 m³ walk-in chamber: formaldehyde, acrolein, acetaldehyde, 4-acetyl-1-methylcyclohexene (4-AMCH), 6-methyl-5-heptene-2-one (6-MHO), 3-isopropenyl-6-oxo-heptanal (IPOH), and 4-oxo-pentanal (4-OPA). These compounds generally increased initially at the high ozone condition, while the terpenoids decayed. The plug-in air freshener resulted in concentrations of formaldehyde, acrolein, and 4-OPA at the high ozone condition that caused some concern regarding possible respiratory effects. It is recommended to more closely identify the sources and under what conditions these compounds are produced. Further testing under realistic conditions that mimics user pattern behavior is warranted to obtain acute and longer-term exposure data in context of relevant ozone exposure. Furthermore, toxicological testing of specific respiratory endpoints of these terpenoids in the presence of ozone is warranted to enable health risk assessment.
Secondary reaction products resulting from a passive air freshener were investigated in a 0.72 m³ climate chamber by increasing the ozone concentrations inside the chamber. Chamber equilibrium concentrations were obtained before introduction of ozone. In an ozone-free atmosphere, the product emitted terpenoids, inter alia limonene, dihydromyrcenol, eucalyptol, and linalool. Ozone-initiated reactions of these compounds were observed by sampling on Tenax TA and PDMS-Tenax; furthermore, the development of particles was monitored on-line and so was formaldehyde by SIFT mass spectrometry.
Introduction
7
INTRODUCTION
Common household cleaning products and air fresheners may contain chemicals that affect respiratory health among cleaning personnel (Zock et al., 2010). Domestic use that results in indoor exposure is also of concern, because of the possibility of in-situ chemistry by ozone (Nazaroff and Weschler, 2004). Limonene (an abundant and ubiquitous volatile organic compound (VOC) indoors and generally a major fragrance component in numerous products) in particular readily undergoes gas-phase reactions to produce a host of complex ozone-initiated reaction products. They comprise gaseous compounds (Calogirou et al., 1999; Atkinson and Arey, 2003) and some have low vapor pressure leading to self-nucleation and formation of secondary organic aerosols (Glasius et al., 2000; Koch et al., 2000), i.e. fine and ultrafine particles (Weschler and Shields, 1999; Wainman et al., 2000; Rohr et al., 2003; Nøjgaard et al., 2006; Destaillats et al., 2006; Singer et al., 2006; Vartiainen et al., 2006). Climate studies involving use of consumer products in the presence of ozone have previously been reported (Destaillats et al., 2006; Singer et al., 2006; Coleman et al., 2008; Huang et al., 2011). We followed the emissions of selected key VOCs from a selected common cleaning agent and air freshener within the EPHECT project, in the presence and in absence of ozone. Our objective was to investigate the formation of ozone-initiated reaction products from three selected consumer products under realistic user conditions, and to further carry out a brief risk assessment. The selection of the product types was based upon the qualitative identification of compounds that are known to easily undergo ozone-initiated reactions, i.e. terpenes, like limonene, within the time-frame of typical indoor exchange rates. Within the EPHECT testing programme, three products were identified to emit terpenes: kitchen cleaning agent (A2; KCA), a plug-in (electric) air freshener (A11; PIAF), and a perfume (A15). For further study of ozone-initiated reactions we excluded the perfume due to the overall uncertainty of designing a test scenario that would provide meaningful personal exposure data for a health assessment. We are aware of one study that has measured some exposures from the use of personal care products (Corsi et al., 2007). Thus, the perfume was replaced by a passive air freshener (A10; PAF). The outcomes of this explorative study are reported in two parts:
Part I: Study of kitchen cleaning agent and a plug-in air freshener in a walk-in 20.24 m³ test chamber.
Part II: Study of a passive air freshener in a 0.72 m³ test chamber.
These parts are reported separately in this document, because of their different objectives and experimental design.
The first part was designed to study the atmospheric concentrations (primary emissions as well as secondary reaction products) when a consumer product is placed in an ozone-enriched atmosphere in a walk-in chamber. The outcome of this experiment comprises exposure data, which is used for a brief health risk assessment of the emissions and secondary reaction products. The second part of the experiment on the other hand was designed to study changes in the steady state concentrations, when ozone is inserted into the chamber. Therefore, in this part of the study, the product is left to equilibrate for almost 24 h in the test chamber prior to the ozone addition, and air concentrations are monitored before and after the addition of ozone.

Study of kitchen cleaning agent (A2) and plug-in air freshener (A11) by NRCWE
8
PART I: STUDY OF KITCHEN CLEANING AGENT AND A PLUG-IN AIR FRESHENER IN PRESENCE OF OZONE (BY NRCWE)
1.1 Methods Chemicals Methanol (99.8 %), pentane (99.9 %), 4-Acetyl-1-methylcyclohexene (4-AMCH) (93 % and 3 % 3-acetyl-6-methylcyclohexene) and 6-methyl-5-heptene-2-one (6-MHO) (99 %) from Aldrich-Sigma. 3-Isopropenyl-6-oxo-heptanal (IPOH) (97 %) and 4-oxo-pentanal (4-OPA) (97 %) were synthesized according to Wolinsky and Barker (1960) and Hutton et al. (2003), respectively, by HM-Chemo Co, Shanghai Branch, CN and Shanghai Chempartner Co, CN. Test chamber Emission testing was carried out in a full scale walk-in chamber (20.24 m3) with an ante-chamber (2.72 m3). Chamber dimensions: height: 2.29 m; length: 3.46 m; width: 2.56. Wall material: Steel. Table 1 shows the chamber specification and test conditions for the KCA and PIAF. The chamber was supplied with HEPA filtered outdoor air taken from the roof of the building (low traffic density environment). The chamber could be lit by two fluorescent lamps in the ceiling; however, they were generally turned off. Immediately, after the start of the experiment, i.e. outer door closed, three mixing fans were turned on for one minute. The fans were placed on the floor in three corners and 5 cm from the chamber wall. The air exchange rate was set to 0.6 h-1. Prior to each experiment the chamber was purged by elevation of the exchange rate (ca. 15 h-1) for a minimum of 24 hours. The chamber background was monitored by both Tenax TA (VOCs) and DNPH (carbonyls) sampling, PID (photoionization) detection, and particles before each new experiment, see below. Temperature and relative humidity were measured by Tinytag loggers (Gemini data loggers, West Sussex, UK) placed near the sampling positions and the chamber outlet. Note, that particle measurements are not included in Part 1.

Study of kitchen cleaning agent (A2) and plug-in air freshener (A11) by NRCWE
9
Table 1 Test chamber specifications and test conditions for kitchen cleaning agent (KCA) and electrical air freshener (PIAF).
Test parameter
KCA (A2)
PIAF (A11)
Chamber vol, m3 20.24 Surface area, m2 1 Loading factor, m2/m3 0.05 Air exchange rate, h-1 0.6 ± 0.1 Temperature, °C 24 ± 2 Rel. humidity, % 40 ± 5 Air velocity, cm/s 0.05a Amount applied, g 39.8
Emission rate, g/hb 0.052-0.073 Amount per vol, g/m3 2.0 0.025 Initial ozone conc., ppb (low test; high test) ±5 ppb
<10; 55 <15; 50
Residual ozone conc. (minimum), ppb (low test; high test) ±5 ppb
<5;14 <10; 32
Other 3 mixing fans turned on for 1 min
Test duration, min 310 370 a) Determined from the exchange rate and chamber geometry. b) Based on total weight loss within test period at maximum setting. Products and application In series of near-realistic user scenarios KCA (ca. 40 g) was applied to a steel surface (1.0 m2) with a nitrile glove inside the chamber that simulates indoor conditions. The steel plate was placed on the floor; the entire operation took less than 2 min. The flask and glove was weighed before and after the application. The PIAF (ca. 0.5 g total emission) was tested in the centre of the chamber by inserting it in an electric plug and turning it on at the maximum setting; it was weighed before and after the experiment. Tests were undertaken without ozone generation (low test) and with ozone generation (high test). The application of the products at elevated ozone level was carried out within the chamber when a stable ozone concentration had been achieved. For experimental conditions, see Table 1. Ozone generation Ozone was generated photochemically with a thermostated mercury lamp housing controlled by a high performance variable power supply using air (medical grade) as described previously (Clausen et al., 2001). The ozone generator was adjusted manually to maintain a 50 ± 5 ppb ozone concentration inside the chamber for at least 1 h before the start of the application/turning on the product. The ozone-air mixture with a flow rate of ca. 0.5 l/min was fed through a ¼” Teflon tube into the chamber via the air inlet of the climate chamber. Ozone was measured from a sampling manifold (see below) with a calibrated API 400 UV ozone monitor (Teledyne API, San Diego, California) with a sampling frequency of 1 min.

Study of kitchen cleaning agent (A2) and plug-in air freshener (A11) by NRCWE
10
Sampling and analysis VOCs, carbonyls, and ozone were sampled through a sampling manifold (see Fig. 3 in EPHECT WP6, Part II (Stranger et al., 2013)). The manifold sampled air from about 5 cm from the chamber inner wall at 1.5 height. Samples for VOCs and carbonyls were taken in duplicate within 30 and 60 min intervals, respectively, starting the first time within the first 3 and 4 min after start of the application. After the first hour seven more air samples were taken at one hour intervals. The time of sampling is taken as the midpoint between start and end of each sampling period. VOC and carbonyl data (C1-C4) are reported as mean of duplicates corrected for chamber background air and rounded to nearest integer. VOCs were sampled in duplicate on Tenax TA (60-80 mesh) adsorbent tubes using both short (1) and long (2) sampling times. (1) Sample frequency of 30 or 60 min with a sampling time of 10 min at 100 mL/min and (2) Integrated sampling for 310-370 min at 20 mL/min. Calibrated pumps (Gillian Gilair 5, Sensidyne, US) were used in all cases. The Tenax TA tubes were analyzed using a Perkin Elmer Turbo Matrix 350 thermal desorber (TD) coupled to a Bruker SCION TQ GC-MS system (Bruker Daltonics, Bremen, DE). Desorption was carried out at 275 °C for 20 min follow by introduction of the sample into the GC column (30 m x 0.25 mm with 0.25 µm film thickness; VF-5MS, Agilent technologies, Santa Clara, US). The oven programme was as follows: 50 °C for 4 min, ramp 1: 4 °C/min to 120 °C, ramp 2: 50 °C/min to 250 °C hold for 2 min. Helium was used as carrier gas at an inlet pressure of 0.97 bar (ca. 1.5 mL/min). The mass spectrometer was operated in SIM/Scan mode using electron ionization. Transfer line and source were kept at 270 °C. Six-point calibration was applied (r2 > 0.999) using authentic standards in methanol or pentane for 4-OPA. The detection limit was in the order of 0.5-2 ng/tube, i.e. between 0.5-2 µg/m3 at 1 l sampling volume. Carbonyls (C1-C6) were sampled (ca. 120 l over 60 min) in duplicate on DNPH sampling cartridges (Supelco, LpDNPH S10) with a calibrated pump (Gillian Gilair 5, Sensidyne, US). The cartridges were eluted within 6 hours after sampling and analysed immediately thereafter by HPLC (Breeze, Waters, Milford, MA) with UV detection. A dedicated LC column facilitating acetone and acrolein separation was applied (Inertsil acrolein C18, 250x4.6 mm). Water and acetonitrile were used as solvents A and B, respectively. The elution gradient was as follows: 0-2 min isocratic 55 % B, 2-10 min gradient from 55 to 80 % B, 10-15 min gradient from 80 to 55 % B. The flow was 1.5 mL/min. A standard mix (Supelco, Carbonyl-DNPH Mix 1) was used for six-point calibration (r2 > 0.999). The detection limit is in the order of 1 µg/m3 for formaldehyde and acetaldehyde. An ozone scrubber was deliberately not used at this concentration level, and further to avoid artefact trapping of the carbonyls on the scrubber. The TVOC concentration was monitored in real-time by use of a PID equipped with a 10.6 eV lamp (ppbRAE, Raesystems, San Jose, CA).
Study of kitchen cleaning agent (A2) and plug-in air freshener (A11) by NRCWE
11
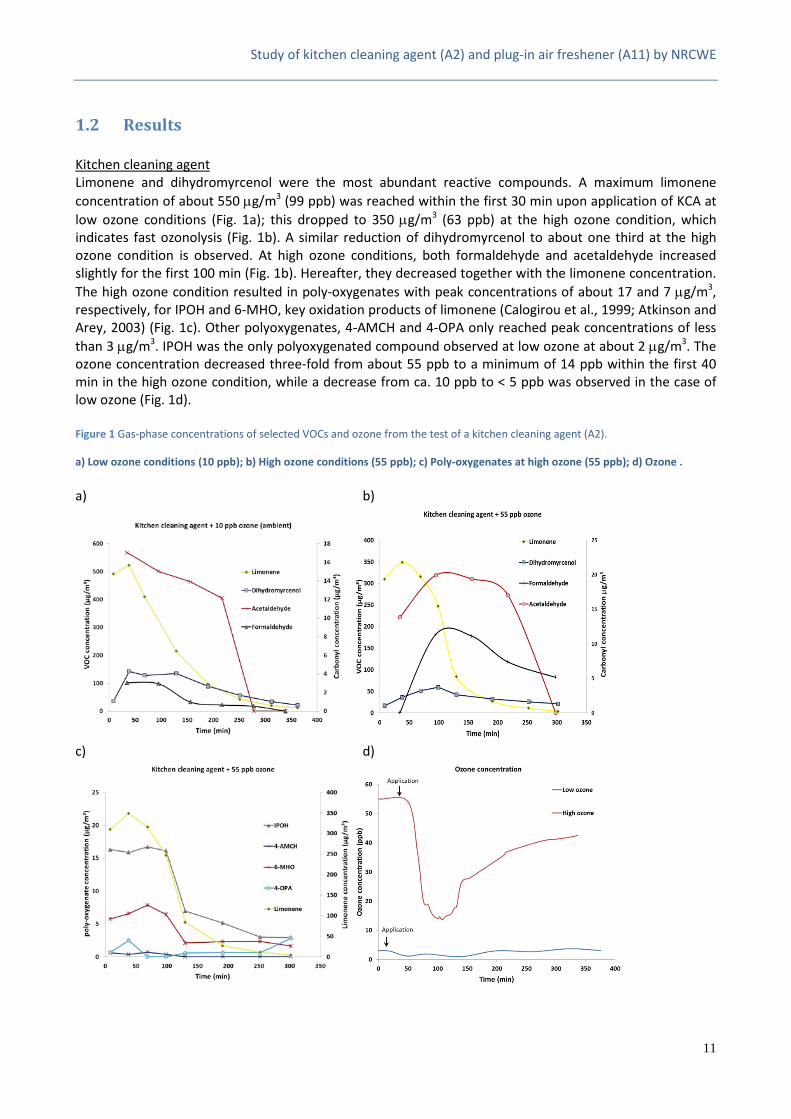
1.2 Results Kitchen cleaning agent Limonene and dihydromyrcenol were the most abundant reactive compounds. A maximum limonene concentration of about 550 µg/m3 (99 ppb) was reached within the first 30 min upon application of KCA at low ozone conditions (Fig. 1a); this dropped to 350 µg/m3 (63 ppb) at the high ozone condition, which indicates fast ozonolysis (Fig. 1b). A similar reduction of dihydromyrcenol to about one third at the high ozone condition is observed. At high ozone conditions, both formaldehyde and acetaldehyde increased slightly for the first 100 min (Fig. 1b). Hereafter, they decreased together with the limonene concentration. The high ozone condition resulted in poly-oxygenates with peak concentrations of about 17 and 7 µg/m3, respectively, for IPOH and 6-MHO, key oxidation products of limonene (Calogirou et al., 1999; Atkinson and Arey, 2003) (Fig. 1c). Other polyoxygenates, 4-AMCH and 4-OPA only reached peak concentrations of less than 3 µg/m3. IPOH was the only polyoxygenated compound observed at low ozone at about 2 µg/m3. The ozone concentration decreased three-fold from about 55 ppb to a minimum of 14 ppb within the first 40 min in the high ozone condition, while a decrease from ca. 10 ppb to < 5 ppb was observed in the case of low ozone (Fig. 1d). Figure 1 Gas-phase concentrations of selected VOCs and ozone from the test of a kitchen cleaning agent (A2).
a) Low ozone conditions (10 ppb); b) High ozone conditions (55 ppb); c) Poly-oxygenates at high ozone (55 ppb); d) Ozone . a) b)
c) d)
Study of kitchen cleaning agent (A2) and plug-in air freshener (A11) by NRCWE
12
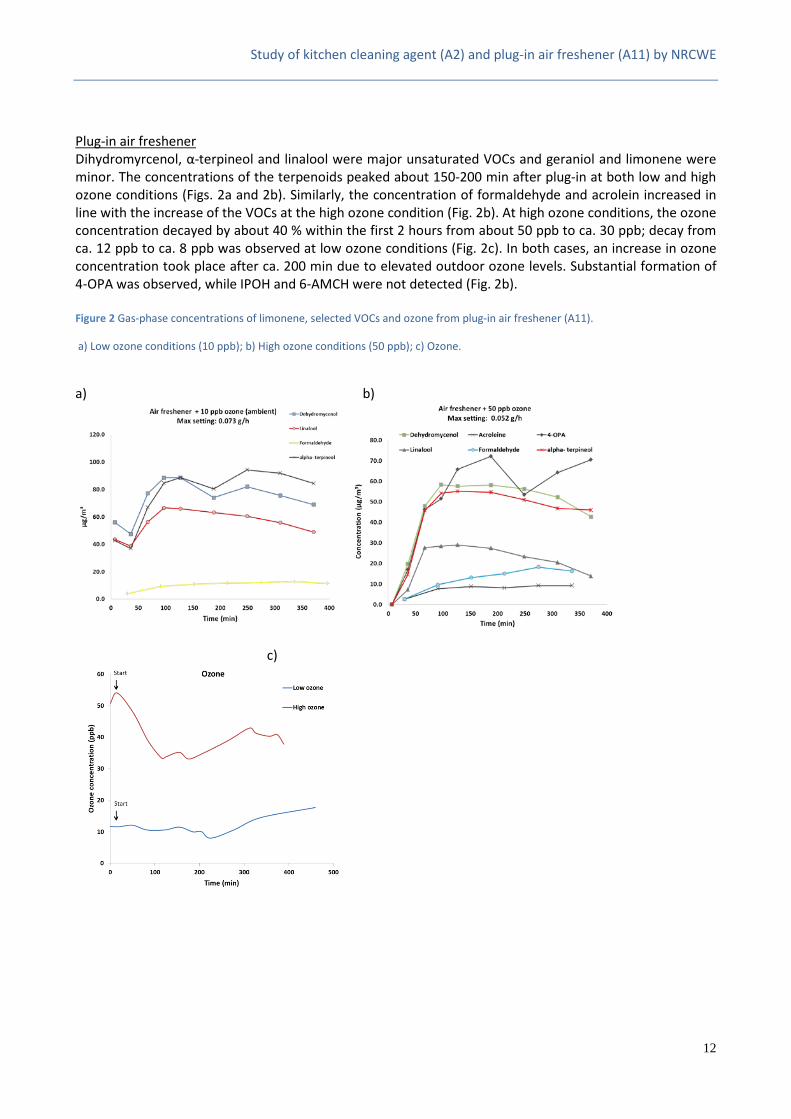
Plug-in air freshener Dihydromyrcenol, α-terpineol and linalool were major unsaturated VOCs and geraniol and limonene were minor. The concentrations of the terpenoids peaked about 150-200 min after plug-in at both low and high ozone conditions (Figs. 2a and 2b). Similarly, the concentration of formaldehyde and acrolein increased in line with the increase of the VOCs at the high ozone condition (Fig. 2b). At high ozone conditions, the ozone concentration decayed by about 40 % within the first 2 hours from about 50 ppb to ca. 30 ppb; decay from ca. 12 ppb to ca. 8 ppb was observed at low ozone conditions (Fig. 2c). In both cases, an increase in ozone concentration took place after ca. 200 min due to elevated outdoor ozone levels. Substantial formation of 4-OPA was observed, while IPOH and 6-AMCH were not detected (Fig. 2b). Figure 2 Gas-phase concentrations of limonene, selected VOCs and ozone from plug-in air freshener (A11).
a) Low ozone conditions (10 ppb); b) High ozone conditions (50 ppb); c) Ozone.
a) b)
c)
Study of kitchen cleaning agent (A2) and plug-in air freshener (A11) by NRCWE
13
1.3 Discussion Generally, the presence of ozone initiates consumption of the terpenoids resulting in a reduction of their concentration, while carbonyls and polyoxygenates increase that partly depends on the extent of the ozonolysis, e.g. (Calogirou et al., 1999; Atkinson and Arey, 2003; Destaillats et al., 2006; Forester and Wells, 2009), (see Table 2, Table 3, Table 4, Table 5). For example, the formaldehyde concentration showed a brief increase after the application of KCA. Furthermore, IPOH and 6-MHO increased substantially and temporarily and decayed in line with the consumption of limonene and the exchange rate. Substantial production of acrolein and 4-OPA was also observed for PIAF at high ozone conditions. Concentrations and health assessment (sensory irritation and airway limitation) on the basis of health based thresholds for limonene, formaldehyde, acetaldehyde, and polyoxygenates have previously been discussed by (Wolkoff and Nielsen, 2010; Wolkoff et al., 2013; Wolkoff, 2013). Limonene and acrolein were furthermore assessed regarding respiratory effects (EPHECT, WP7 Report, Carrer et al., 2013).
Since the testing was carried in a semi-realistic scenario and protocol in a walk-in 20 m3 climate chamber it is considered reasonable to carry out a tentative health assessment regarding respiratory effects as a first and conservative attempt, well knowing that upscaling would result in lower room concentrations. Such upscaling, however, requires advanced modeling. Further, the ozone concentration may be unrealistically high in some regions of Europe, leading to less formation of reaction products, cf. (Morrison et al., 2011).
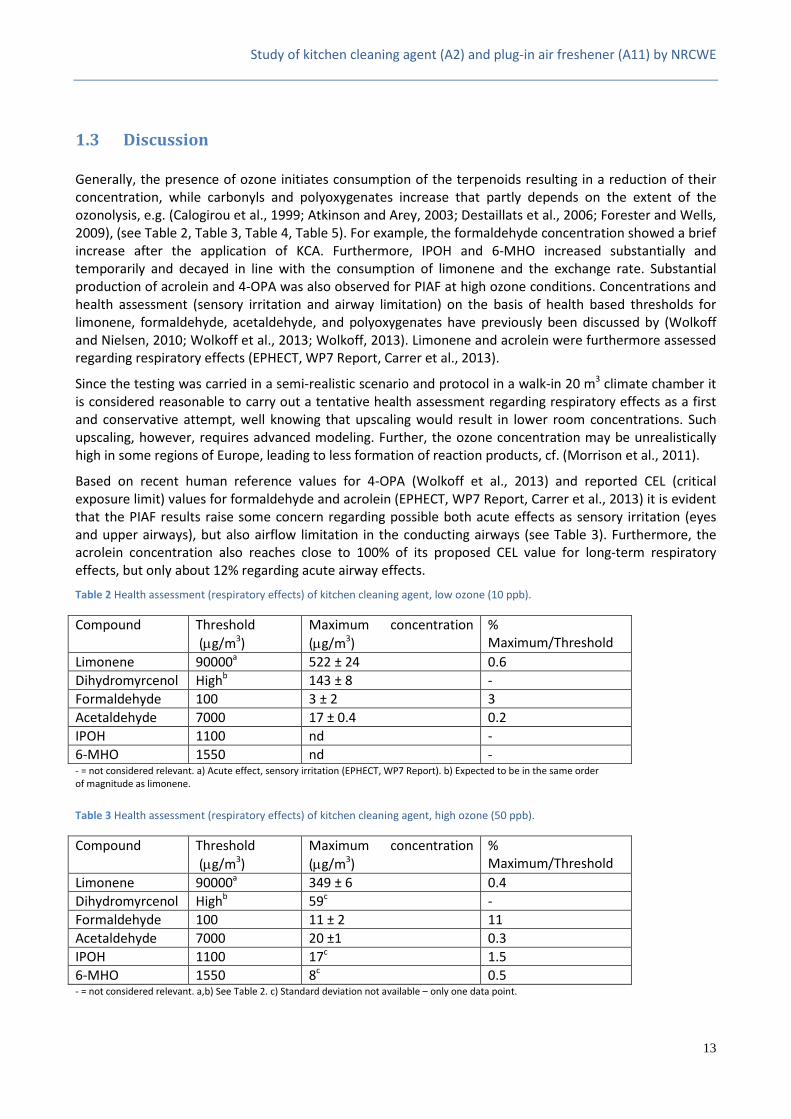
Based on recent human reference values for 4-OPA (Wolkoff et al., 2013) and reported CEL (critical exposure limit) values for formaldehyde and acrolein (EPHECT, WP7 Report, Carrer et al., 2013) it is evident that the PIAF results raise some concern regarding possible both acute effects as sensory irritation (eyes and upper airways), but also airflow limitation in the conducting airways (see Table 3). Furthermore, the acrolein concentration also reaches close to 100% of its proposed CEL value for long-term respiratory effects, but only about 12% regarding acute airway effects.
Table 2 Health assessment (respiratory effects) of kitchen cleaning agent, low ozone (10 ppb).
Compound Threshold (µg/m3)
Maximum concentration (µg/m3)
% Maximum/Threshold
Limonene 90000a 522 ± 24 0.6 Dihydromyrcenol Highb 143 ± 8 - Formaldehyde 100 3 ± 2 3 Acetaldehyde 7000 17 ± 0.4 0.2 IPOH 1100 nd - 6-MHO 1550 nd - - = not considered relevant. a) Acute effect, sensory irritation (EPHECT, WP7 Report). b) Expected to be in the same order of magnitude as limonene. Table 3 Health assessment (respiratory effects) of kitchen cleaning agent, high ozone (50 ppb).
Compound Threshold (µg/m3)
Maximum concentration (µg/m3)
% Maximum/Threshold
Limonene 90000a 349 ± 6 0.4 Dihydromyrcenol Highb 59c - Formaldehyde 100 11 ± 2 11 Acetaldehyde 7000 20 ±1 0.3 IPOH 1100 17c 1.5 6-MHO 1550 8c 0.5 - = not considered relevant. a,b) See Table 2. c) Standard deviation not available – only one data point.

Study of kitchen cleaning agent (A2) and plug-in air freshener (A11) by NRCWE
14
Table 4 Health assessment (respiratory effects) of plug-in air freshener, low ozone (10 ppb) in 20 m3 chamber.
Compound Threshold (µg/m3)
Maximum concentration (µg/m3)
% Maximum/Threshold
Limonene 9000a 6 ± 0.1 0.0007 Geraniol Highb 15 ± 1 - Linalool Highb 67 ± 1 - Dihydromyrcenol Highb 89 ± 3 - α-terpineol Highb 89 ± 4 - Formaldehyde 100 13 ± 0.5 13 Acrolein 10a/78 nd - Acetone 54000 21 ± 0.5 0.04 4-OPA 123 3 ± 1.5 3 6-MHO 1550 nd - - = not considered relevant. a) Long-term exposure value for respiratory effects (EPHECT, WP7 Report). b) Expected to be in the same order of magnitude as limonene. Table 5 Health assessment (respiratory effects) of plug-in air freshener, high ozone (50 ppb) in 20 m3 chamber.
Compound Threshold (µg/m3)
Maximum concentration (µg/m3)
% Maximum/Threshold
Limonene 9000a 1 ± 0.1 0.01 Geraniol Highb 7 ± 0.1 - Linalool Highb 29 ± 0.3 - Dihydromyrcenol Highb 58 ± 5 - α-terpineol Highb 55 ± 2.5 - Formaldehyde 100 18 ± 5 18 Acrolein 10a/78 9 ± 0.2 92 / 12 Acetone 54000 35 ± 1 0.06 4-OPA 123 72 ± 29 59 6-MHO 1550 8 ± 0.3 0.5 - = not considered relevant. a,b) See Table 4. These initial results clearly warrant further research into:
• Sources and what conditions are responsible for the formation of formaldehyde, 4-OPA and acrolein.
• Further testing under realistic conditions, modeling and its validation. • Integrated and dedicated risk assessment that implements user pattern behavior, acute and longer-
term exposure scenarios, and relates to realistic ozone exposures. • Toxicological testing of specific respiratory endpoints of selected fragrance-terpenoids in the
presence of ozone is warranted. • Health assessment that considers all potential health risks.
Part II Study of a passive air freshener before and after adding ozone (by VITO and JRC)
15
PART II STUDY OF A PASSIVE AIR FRESHENER BEFORE AND AFTER ADDING OZONE (BY VITO AND JRC)
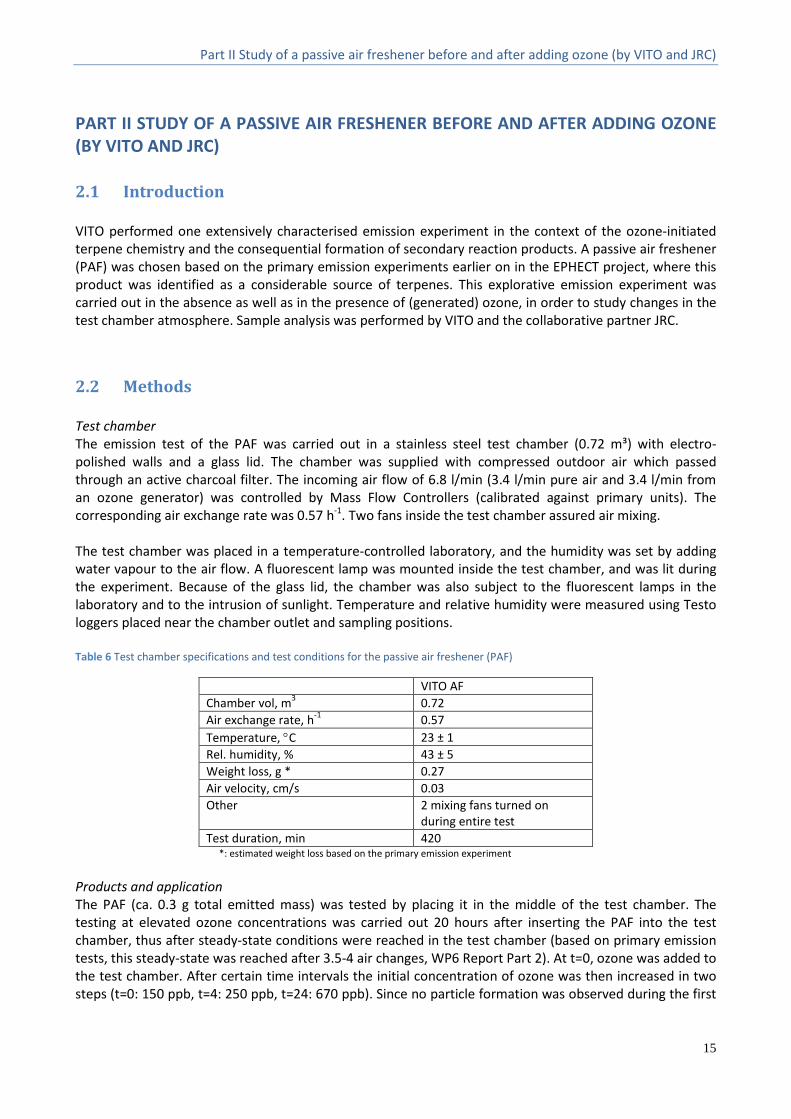
2.1 Introduction VITO performed one extensively characterised emission experiment in the context of the ozone-initiated terpene chemistry and the consequential formation of secondary reaction products. A passive air freshener (PAF) was chosen based on the primary emission experiments earlier on in the EPHECT project, where this product was identified as a considerable source of terpenes. This explorative emission experiment was carried out in the absence as well as in the presence of (generated) ozone, in order to study changes in the test chamber atmosphere. Sample analysis was performed by VITO and the collaborative partner JRC.
2.2 Methods Test chamber The emission test of the PAF was carried out in a stainless steel test chamber (0.72 m³) with electro-polished walls and a glass lid. The chamber was supplied with compressed outdoor air which passed through an active charcoal filter. The incoming air flow of 6.8 l/min (3.4 l/min pure air and 3.4 l/min from an ozone generator) was controlled by Mass Flow Controllers (calibrated against primary units). The corresponding air exchange rate was 0.57 h-1. Two fans inside the test chamber assured air mixing. The test chamber was placed in a temperature-controlled laboratory, and the humidity was set by adding water vapour to the air flow. A fluorescent lamp was mounted inside the test chamber, and was lit during the experiment. Because of the glass lid, the chamber was also subject to the fluorescent lamps in the laboratory and to the intrusion of sunlight. Temperature and relative humidity were measured using Testo loggers placed near the chamber outlet and sampling positions. Table 6 Test chamber specifications and test conditions for the passive air freshener (PAF)
VITO AF Chamber vol, m3 0.72 Air exchange rate, h-1 0.57 Temperature, °C 23 ± 1 Rel. humidity, % 43 ± 5 Weight loss, g * 0.27 Air velocity, cm/s 0.03 Other 2 mixing fans turned on
during entire test Test duration, min 420
*: estimated weight loss based on the primary emission experiment Products and application The PAF (ca. 0.3 g total emitted mass) was tested by placing it in the middle of the test chamber. The testing at elevated ozone concentrations was carried out 20 hours after inserting the PAF into the test chamber, thus after steady-state conditions were reached in the test chamber (based on primary emission tests, this steady-state was reached after 3.5-4 air changes, WP6 Report Part 2). At t=0, ozone was added to the test chamber. After certain time intervals the initial concentration of ozone was then increased in two steps (t=0: 150 ppb, t=4: 250 ppb, t=24: 670 ppb). Since no particle formation was observed during the first
Part II Study of a passive air freshener before and after adding ozone (by VITO and JRC)
16
4 hours (step 1: 150 ppb ozone), the ozone concentration level was increased. Note that the actual ozone concentration in the test chamber, if no reaction occurs, should be half the incoming concentration because of the two separate incoming flows i.e. t=0: 75 ppb, t=4: 125 ppb, t=24: 385 ppb. Ozone generation Ozone target concentrations were obtained using an ozone generator. The oxygen molecules in the dry clean air feed are transformed to ozone by the action of ultraviolet light. By adapting the air flow rate and the length of the glass tube that is exposed to the UV light, the concentrations can be altered. The generated concentrations used exceeded real-life concentrations in order to stimulate the formation of secondary reaction products; the test chamber concentrations were measured by an online ozone monitor (Thermo instruments). Sampling and analysis VOCs were sampled on Tenax TA (60-80 mesh) adsorbent tubes using a 60 min sampling time at 50 mL/min, 4 samples were collected during the first 8 hours of the experiment. Calibrated pumps (Gillian Gilair 5, Sensidyne, US) were used in all cases. The Tenax TA tubes were analyzed using a Markes Unity 1 thermal desorber (TD) coupled to an Agilent GC-MS system. Desorption was carried out at 280 °C for 15 min follow by introduction of the sample into the GC. The column was a 60 m x 0.32 mm with 0.25 µm film thickness (AT-5MS, Grace). The oven program was as follows: 35 °C for 1 min, ramp: 5 °C/min to 210 °C, hold for 4 min. Helium was used as carrier gas with a pressure of 70 kPa (ca. 1.8 mL/min). The mass spectrometer was operated in SIM/Scan mode using electron ionization. Transfer line and source were kept at 230 °C. Four-point calibration was applied (r2 > 0.995) using authentic standards. Carbonyls (C1-C6) were sampled (ca. 20 l over 60 min) on DNPH sampling cartridges (Waters) with a calibrated pump (Gillian Gilair 5, Sensidyne, US). The cartridges were eluted within 6 hours after sampling and analysed by HPLC (Waters, column Phenomenex 75*4.6 mm – 2.6 μm) with UV detection at 360 nm. Based on previous experiments it was decided not to use an ozone scrubber at these concentration because of the limited levels that could be reached at the outlet and further to avoid artefact trapping of the carbonyls on the scrubber. Carboxylic acids in PM are sampled on filters, and analysed by HPLC-UV (Agilent, column Phenomenex 250*4.6 mm – 5 μm) with UV detection at 210 nm. In this experiment the target compounds (oxalic, formic, acetic and maleic acid) were not detected and are thus not further discussed in this analysis. A SIFT-MS (Syft, New Zealand) was used as an online MS to profile the concentrations of selected VOCs during 8 hours. The SIFT-MS can be used quantitatively, but only when it’s calibrated for that compound. Moreover, it should be taken into account that this method is not selective for isomers, e.g. terpenes. Number and size distribution of ultrafine particles (14-700 nm, 3 min sampling frequency) is obtained with a scanning mobility particle sizer (TSI SMPS 3636) and CPC detector (condensation particle counter) which monitored the UFP concentration for a period of 24h after ozone was added into the chamber. A newly developed method to sample a selection of secondary reaction products was used during the 24h after the ozone was added into the chamber. It comprises sampling on PDMS (polydimethylsiloxane)/Tenax, followed by thermal desorption, GC separation and MS detection under similar conditions as the regular VOC Tenax analysis (Lazarov et al., 2013). VOC and carbonyl data are reported corrected for background air.
Part II Study of a passive air freshener before and after adding ozone (by VITO and JRC)
17
2.3 Discussion Terpenoids with 2 double C-C bonds (e.g. limonene, linalool) are known to be more susceptible for reacting, or have a higher reaction rate with ozone than those with a single C-C bond (α-pinene, β-pinene, dihydromyrcenol).
Samples collected one hour before ozone was added to the chamber (before t=0) can be considered as a bench-mark in this experiment: using this point in time as a reference point, the concentration profiles of the secondary reaction products (SRP) and of the terpenoids can be evaluated.
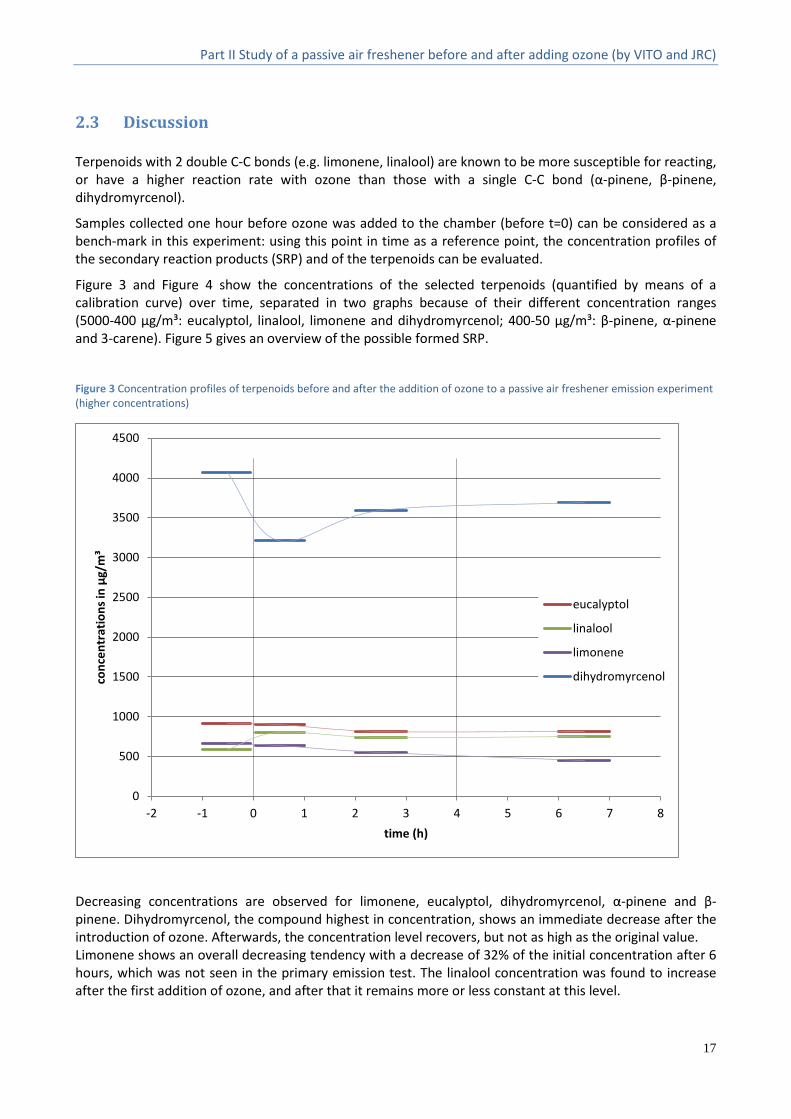
Figure 3 and Figure 4 show the concentrations of the selected terpenoids (quantified by means of a calibration curve) over time, separated in two graphs because of their different concentration ranges (5000-400 µg/m³: eucalyptol, linalool, limonene and dihydromyrcenol; 400-50 µg/m³: β-pinene, α-pinene and 3-carene). Figure 5 gives an overview of the possible formed SRP.
Figure 3 Concentration profiles of terpenoids before and after the addition of ozone to a passive air freshener emission experiment (higher concentrations)
Decreasing concentrations are observed for limonene, eucalyptol, dihydromyrcenol, α-pinene and β-pinene. Dihydromyrcenol, the compound highest in concentration, shows an immediate decrease after the introduction of ozone. Afterwards, the concentration level recovers, but not as high as the original value. Limonene shows an overall decreasing tendency with a decrease of 32% of the initial concentration after 6 hours, which was not seen in the primary emission test. The linalool concentration was found to increase after the first addition of ozone, and after that it remains more or less constant at this level.
0
500
1000
1500
2000
2500
3000
3500
4000
4500
-2 -1 0 1 2 3 4 5 6 7 8
conc
entr
atio
ns in
µg/
m³
time (h)
eucalyptol
linalool
limonene
dihydromyrcenol
Part II Study of a passive air freshener before and after adding ozone (by VITO and JRC)
18
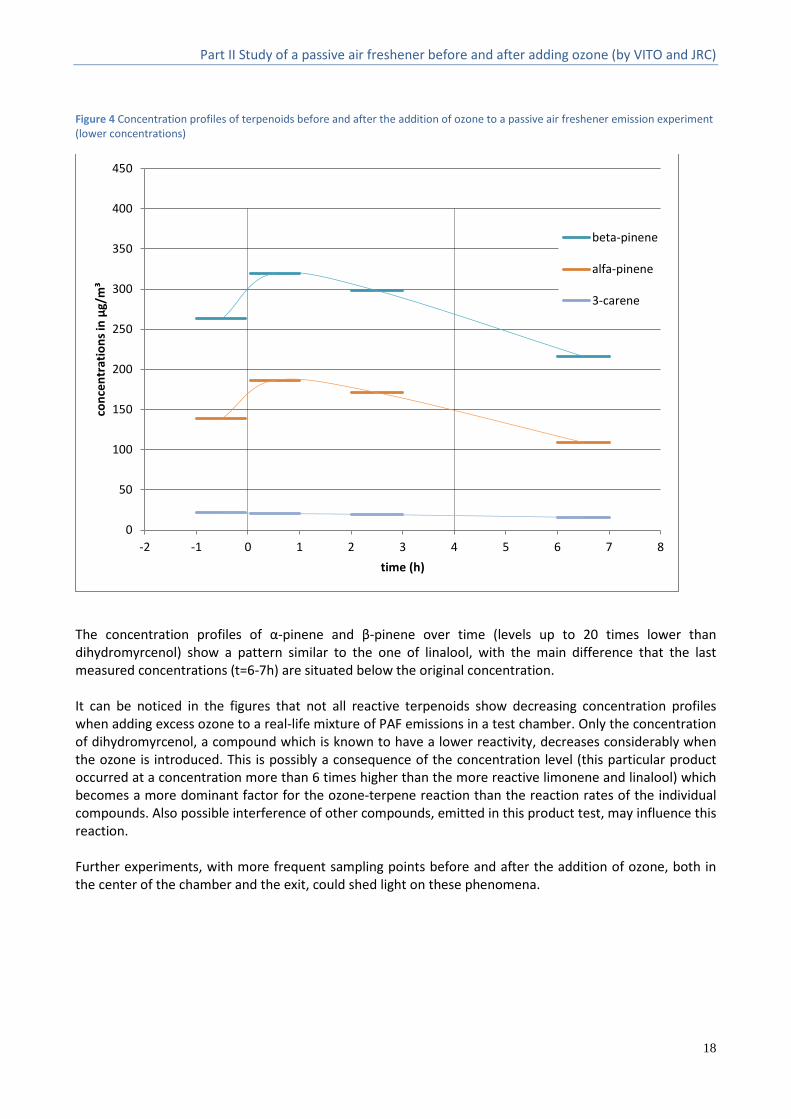
Figure 4 Concentration profiles of terpenoids before and after the addition of ozone to a passive air freshener emission experiment (lower concentrations)
The concentration profiles of α-pinene and β-pinene over time (levels up to 20 times lower than dihydromyrcenol) show a pattern similar to the one of linalool, with the main difference that the last measured concentrations (t=6-7h) are situated below the original concentration. It can be noticed in the figures that not all reactive terpenoids show decreasing concentration profiles when adding excess ozone to a real-life mixture of PAF emissions in a test chamber. Only the concentration of dihydromyrcenol, a compound which is known to have a lower reactivity, decreases considerably when the ozone is introduced. This is possibly a consequence of the concentration level (this particular product occurred at a concentration more than 6 times higher than the more reactive limonene and linalool) which becomes a more dominant factor for the ozone-terpene reaction than the reaction rates of the individual compounds. Also possible interference of other compounds, emitted in this product test, may influence this reaction. Further experiments, with more frequent sampling points before and after the addition of ozone, both in the center of the chamber and the exit, could shed light on these phenomena.
0
50
100
150
200
250
300
350
400
450
-2 -1 0 1 2 3 4 5 6 7 8
conc
entr
atio
ns in
µg/
m³
time (h)
beta-pinene
alfa-pinene
3-carene

Part II Study of a passive air freshener before and after adding ozone (by VITO and JRC)
19
Figure 5 Concentration profiles of SRP before and after the addition of ozone to a passive air freshener emission experiment
Figure 5 shows the concentration profiles of the SRP: polyoxygenates, formaldehyde and acetone.
It is interesting to notice that the highest concentrations of 4-OPA and 6-MHO are measured before the addition of ozone. Moreover, their chamber concentrations were found to decrease when ozone was added. It might be possible that the test chamber wasn’t properly rinsed after the previous experiments on secondary reaction products. However, this explanation is least probable since the chamber experiment started 20 hours before the addition of ozone at an air exchange rate of 0.57 h-1. Another possibility is that the PAF itself emits these compounds without any interference of ozone: more and earlier samplings will be needed to confirm this hypothesis.
3-IPOH is formed substantially: more than a tenfold increase was measured compared to the steady-state situation. Formaldehyde and acetone show an increasing concentration in each successive sampling. This is further illustrated in Figure 6, which shows the formaldehyde concentration profile generated by SIFT-MS that clearly confirms the increase of formaldehyde after adding the initial ozone concentration; the profile indicates a further increase in concentration when more ozone is added (at t=4).
0
50
100
150
200
250
300
-2 3 8 13 18 23
conc
entr
atio
ns in
µg/
m³
time (h)
4-OPA
6-MHO
3-IPOH
formaldehyde
acetone

Part II Study of a passive air freshener before and after adding ozone (by VITO and JRC)
20
Figure 6 Concentration profile of formaldehyde measured by SIFT-MS before and after the addition of ozone to a passive air freshener emission experiment
Figure 7 Total particle counts before (t=0) and after a stepwise increase of ozone to a passive air freshener emission experiment
0
5
10
15
20
25
30
35
40
-8 -6 -4 -2 0 2 4 6 8
conc
entr
atio
n in
µg/
m³
time (h)
0
20000
40000
60000
80000
100000
120000
140000
160000
-20 -15 -10 -5 0 5 10 15 20 25 30
tota
l par
ticle
cou
nts/
ml
hours
t=0: add 150 ppb ozone t=4: add 250 ppb ozone t=24: add 670 ppb ozone
Part II Study of a passive air freshener before and after adding ozone (by VITO and JRC)
21
The time when the PAF is emitting in the absence of ozone, nano-particles in the range of 14-700 nm are not noticeable. At t=0, when the first ozone concentration is introduced, no change is observed, although previous figures clearly indicate that secondary reactions are certainly ongoing. Soon after t=4, when the ozone concentration is increased, the nano-particles are visible in the total particle count: they reach an immediate maximum and return to a lower steady-state concentration. The same can be noticed when at t=24 the ozone concentration is further increased.
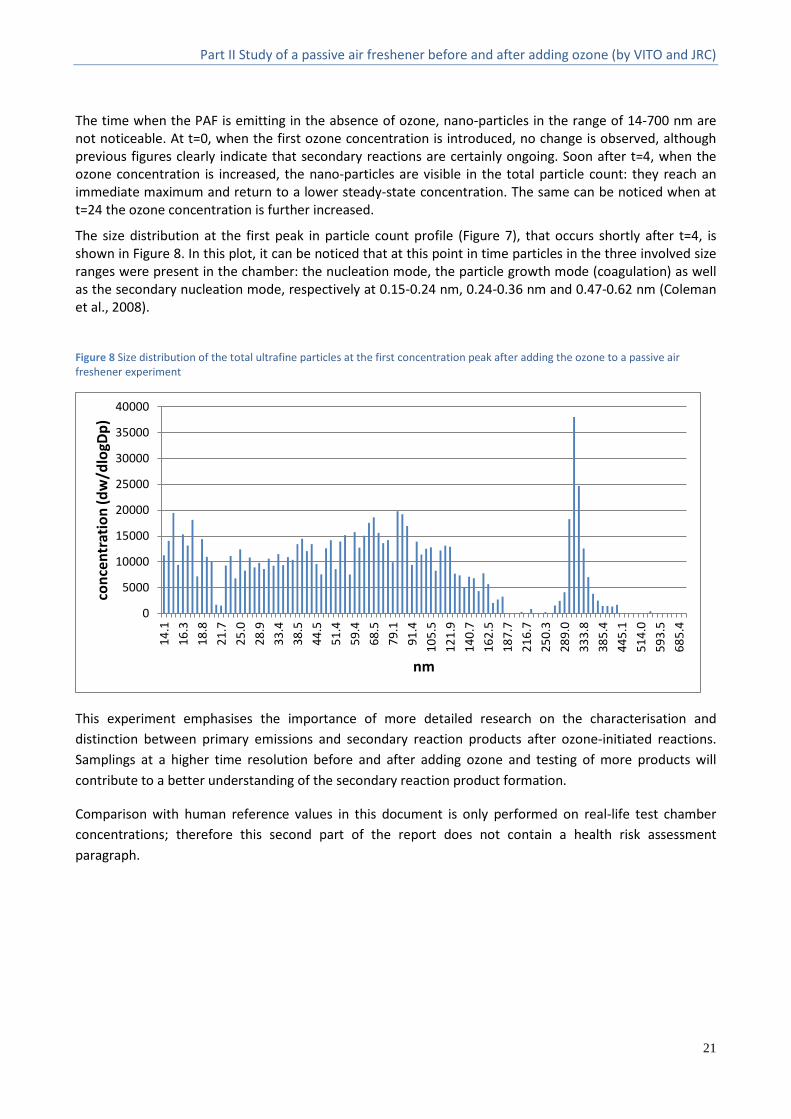
The size distribution at the first peak in particle count profile (Figure 7), that occurs shortly after t=4, is shown in Figure 8. In this plot, it can be noticed that at this point in time particles in the three involved size ranges were present in the chamber: the nucleation mode, the particle growth mode (coagulation) as well as the secondary nucleation mode, respectively at 0.15-0.24 nm, 0.24-0.36 nm and 0.47-0.62 nm (Coleman et al., 2008).
Figure 8 Size distribution of the total ultrafine particles at the first concentration peak after adding the ozone to a passive air freshener experiment
This experiment emphasises the importance of more detailed research on the characterisation and distinction between primary emissions and secondary reaction products after ozone-initiated reactions. Samplings at a higher time resolution before and after adding ozone and testing of more products will contribute to a better understanding of the secondary reaction product formation.
Comparison with human reference values in this document is only performed on real-life test chamber concentrations; therefore this second part of the report does not contain a health risk assessment paragraph.
0
5000
10000
15000
20000
25000
30000
35000
40000
14.1
16.
3 1
8.8
21.
7 2
5.0
28.
9 3
3.4
38.
5 4
4.5
51.
4 5
9.4
68.
5 7
9.1
91.
410
5.5
121.
914
0.7
162.
518
7.7
216.
725
0.3
289.
033
3.8
385.
444
5.1
514.
059
3.5
685.
4
conc
entr
atio
n (d
w/d
logD
p)
nm

References
22
REFERENCES
Atkinson R, Arey J. Gas-phase tropospheric chemistry of biogenic volatile organic compounds: a review. Atmospheric Environment 2003; 37: S197-S219.
B. K. Coleman, M. M. Lunden, H. Destaillats, W. W. Nazaroff 2008. Secondary organic aerosol from ozone-initiated reactions with terpene-rich household products Atmos Environ 42, 8234–8245
Calogirou A, Larsen BR, Kotzias D. Gas-phase terpene oxidation products: a review. Atmospheric Environment 1999; 33: 1423-1439.
Clausen PA, Wilkins CK, Wolkoff P, Nielsen GD. Chemical and biological evaluation of a reaction mixture of R-(+)-limonene/ozone: Formation of strong airway irritants. Environment International 2001; 26: 511-522.
Coleman BK, Lunden MM, Destaillats H, Nazaroff WW. Secondary organic aerosols from ozone-initiated reactions with terpene-rich household products. Atmospheric Environment 2008; 42: 8234-8251.
Corsi RL, Siegel J, Karamalegos A, Simon H, Morrison GC. Personal reactive clouds: Introducing the concept of near-head chemistry. Atmospheric Environment 2007; 41: 3161-3165.
Destaillats H, Lunden MM, Singer BC, Coleman BK, Hodgson AT, Weschler CJ, Nazaroff WW. Indoor secondary pollutants from household product emissions in the presence of ozone: A bench-scale chamber study. Environ Sci Technol 2006; 40: 4421-4428.
EPHECT WP6, Part II Report (2013) by Stranger et al. Quantification of the product emissions by laboratory testing. WP6 Part II – Results of product testing experiments.
EPHECT WP7 Report (2013) by Carrer P et al. Report on the health risk associated with emissions from household use of selected consumer products.
Forester CD, Wells JR. Yields of carbonyl products from gas-phase reactions of fragrance compounds with OH radical and ozone. Environ Sci Technol 2009; 43: 3561-3568.
Glasius M, Lahaniati M, Calogirou A, Di Bella D, Jensen NR, Hjorth J, Kotzias D, Larsen BR. Carboxylic acids in secondary aerosols from oxidation of cyclic monoterpenes by ozone. Environmental Science & Technology 2000; 34: 1001-1010.
Huang Y, Ho KF, Ho SSH, Lee SC, Yau PS, Cheng Y. Physical parameters effect on ozone-initiated formation of indoor secondary organic aerosols with emissions from cleaning products. J Hazard Mater 2011; 192: 1787-1794.
Hutton TK, Muir KW, Procter DJ. Switching between novel samarium(II)-mediated cyclization by a simple change in alcohol cosolvent. Org Lett 2003; 5: 4811-4814.
Koch S, Winterhalter R, Uherek E, Kolloff A, Neeb P, Moortgat GK. Formation of new particles in the gas-phase ozonolysis of monoterpenes. Atmospheric Environment 2000; 34: 4031-4042.
Lazarov, B., Swinnen, R., Spruyt, M., Goelen, E., Stranger, M., Desmet, G., and Wauters, E., 2013. Optimisation steps of an innovative air sampling method for semi volatile organic compounds. Atmos.Environ. 79, 780-786.
Morrison G, Shaughnessy R, Shu S. Setting maximum emission rates from ozone emitting consumer appliances in the United States and Canada. Atmos Environ 2011; 45: 2009-2016.
Nazaroff WW, Weschler CJ. Cleaning products and air fresheners. Exposure to primary and secondary pollutants. Atmospheric Environment 2004; 38: 2841-2865.

References
23
Nøjgaard JK, Bilde M, Stenby C, Nielsen OJ, Wolkoff P. The effect of nitrogen dioxide on particle formation during ozonolysis of two abundant monoterpenes indoors. Atmospheric Environment 2006; 40: 1030-1042.
Rohr AC, Weschler CJ, Koutrakis P, Spengler JD. Generation and quantification of ultrafine particles through terpene/ozone reaction in a chamber setting. Aerosol Science and Technology 2003; 37: 65-78.
Singer BC, Coleman BK, Destaillats H, Hodgson AT, Lunden MM, Weschler CJ, Nazaroff WW. Indoor secondary pollutants from cleaning product and air freshener use in the presence of ozone. Atmospheric Environment 2006; 40: 6696-6710.
Vartiainen E, Kulmala M, Ruuskanen J, Taipale R, Rinne J, Vehkamäki H. Formation and growth of indoor air aerosol particles as a result of d-limonene oxidation. Atmospheric Environment 2006; 40: 7882-7892.
Wainman T, Zhang J, Weschler CJ, Lioy PJ. Ozone and limonene in indoor air: A source of submicron particle exposure. Environmental Health Perspectives 2000; 108: 1139-1145.
Weschler CJ, Shields HC. Indoor ozone/terpene reactions as a source of indoor particles. Atmospheric Environment 1999; 33: 2301-2312.
Wolinsky J, Barker W. The synthesis of 1-acetyl-4-isopropyl-1-cyclopentene. J Am Chem Soc 1960; 82: 636-638.
Wolkoff P, larsen ST, Hammer M, Kofoed-Sørensen V, Clausen PA, Nielsen GD. Human reference values for acute airway effects of five common ozone-initiated terpene reaction products in indoor air. Toxicol Lett 2013; 216: 54-64.
Wolkoff P, Nielsen GD. Non-cancer effects of formaldehyde and relevance for setting an indoor air guideline. Environ Int 2010; 36: 788-799.
Wolkoff P. Indoor air pollutants in office environments: Assessment of comfort, health, and performance. Int J Hyg Environ Health 2013; 216: 371-394.
Zock JP, Vizcaya D, Le Moual N. Update on asthma and cleaners. Curr Opin Allergy and Clin Immunol 2010; 10: 114-120.