quantification of left ventricular function with premature...
TRANSCRIPT

1
Premature ventricular complexes (PVCs) are early electric depolarizations originating in the ventricular myocardium,
which can disrupt the coordinated electric depolarization and mechanical contraction of the heart. Idiopathic PVCs may create variable symptoms and may cause a cardiomyopathy. Clinically, PVC-induced cardiomyopathy remains a diagnosis of exclusion and conventional imaging is often used to rule out underlying disease.1
Accurate assessments of left ventricular (LV) function using conventional multishot cardiovascular magnetic resonance (CMR) acquisitions are hindered by the presence of frequent PVCs because of the irregularly irregular rhythm. In conven-tional multishot 2-dimensional (2D) CMR, data for a single slice are acquired over multiple cardiac cycles, and arrhythmias can lead to incorrect combination of data causing considerable image corruption.2 Retrospective ECG-gated acquisitions can use arrhythmia rejection to eliminate corruption because of ectopic beats. However, this approach discards data from ecto-pic contractions, markedly prolongs scan time during frequent PVCs, and can result in respiratory motion artifacts because
of unachievable breath-hold duration. Prospective ECG-gated acquisitions can also be used in patients with arrhythmias. If an arrhythmia is regular, the acquisition window can be prolonged to acquire several beats after each QRS. Unfortunately, this approach is easily corrupted by any irregularity in the rhythm pattern and also markedly prolongs the scan time, making it sensitive to respiratory motion artifacts.
Single-shot (real-time) 2D CMR eliminates the need for combination of data acquired from multiple heartbeats and allows for observation of each cardiac contraction in a 2D slice.3 The decreased spatial and temporal resolution associ-ated with conventional real-time imaging has previously led to a loss of slice volume accuracy.4 However, by combining non-Cartesian data acquisition, iterative image reconstruction, and semiautomated image processing, high spatial and tem-poral resolution real-time CMR images can be obtained and led to accurate measurement of 2D slice volume in a per-beat fashion.5,6
In this work, we combine a previously validated 2D real-time imaging technique with synchronous ECG recording,
© 2016 American Heart Association, Inc.
Circ Arrhythm Electrophysiol is available at http://circep.ahajournals.org DOI: 10.1161/CIRCEP.115.003520
Original Article
Background—Premature ventricular complexes (PVCs) are prevalent in the general population and are sometimes associated with reduced ventricular function. Current echocardiographic and cardiovascular magnetic resonance imaging techniques do not adequately address the effect of PVCs on left ventricular function.
Methods and Results—Fifteen subjects with a history of frequent PVCs undergoing cardiovascular magnetic resonance imaging had real-time slice volume quantification performed using a 2-dimensional (2D) real-time cardiovascular magnetic resonance imaging technique. Synchronization of 2D real-time imaging with patient ECG allowed for different beats to be categorized by the loading beat RR duration and beat RR duration. For each beat type, global volumes were quantified via summation over all slices covering the entire ventricle. Different patterns of ectopy, including isolated PVCs, bigeminy, trigeminy, and interpolated PVCs, were observed. Global functional measurement of the different beat types based on timing demonstrated differences in preload, stroke volume, and ejection fraction. An average of hemodynamic function was quantified for each subject depending on the frequency of each observed beat type.
Conclusions—Application of real-time cardiovascular magnetic resonance imaging in patients with PVCs revealed differential contribution of PVCs to hemodynamics. (Circ Arrhythm Electrophysiol. 2016;9:e003520. DOI: 10.1161/CIRCEP.115.003520)
Key Words: cardiac arrhythmias ◼ echocardiography ◼ magnetic resonance imaging ◼ stroke volume ◼ ventricular premature complexes
Received September 1, 2015; accepted February 19, 2016.From the Department of Bioengineering (F.C.), Cardiovascular Division, Department of Medicine (K.R., E.S.Z., G.E.S., F.E.M., Y.H.), Department of
Radiology (H.R., M.S., P.Y., W.R.T.W.), and Department of Surgery (J.G., R.C.G.), University of Pennsylvania, Philadelphia; and Laboratory of Cardiac Energetics, National Heart, Lung, and Blood Institute, National Institutes of Health, Bethesda, MD (P.K.).
Correspondence to Yuchi Han, MD, MMSc, Hospital of the University of Pennsylvania Cardiovascular Division, Room 9022, East Gates 3400 Spruce St, Philadelphia, PA 19104-4283. E-mail [email protected]
Quantification of Left Ventricular Function With Premature Ventricular Complexes Reveals Variable Hemodynamics
Francisco Contijoch, PhD; Kelly Rogers, BS; Hannah Rears; Mohammed Shahid, MSE; Peter Kellman, PhD; Joseph Gorman III, MD; Robert C. Gorman, MD; Paul Yushkevich, PhD;
Erica S. Zado, PA-C; Gregory E. Supple, MD; Francis E. Marchlinski, MD; Walter R.T. Witschey, PhD; Yuchi Han, MD, MMSc
by guest on July 10, 2018http://circep.ahajournals.org/
Dow
nloaded from

2 Contijoch et al Beat-to-Beat LV Function During PVCs
which allows for identification of different beat types based on RR intervals and the measurement of global LV volume via summation of 2D slice data covering the entire heart for each beat type.
MethodsPatient PopulationThe prospective study was approved by the Institutional Review Board at the University of Pennsylvania, and all subjects (n=15; 47.7±23.6 years old; 46.7% men) gave written informed consent. PVC burden was quantified via synchronously recorded ECG dur-ing CMR acquisition. Two subjects had no PVCs during the CMR examination despite a history of frequent PVCs. Thirteen patients had PVCs during real-time CMR (burden 25±14%; range 4%–50%), and they demonstrated a range of arrhythmic patterns, including bi-geminy, trigeminy, and interpolated PVCs. Two of the 13 subjects (subjects 5 and 6) were imaged twice. Subject 5 was imaged pre and post PVC ablation, and subject 6 had 2 different PVC burdens and ectopic patterns during 2 imaging sessions.
CMR AcquisitionCMR was performed on a 1.5 T imaging system (Avanto, Siemens Healthcare, Erlangen, Germany) equipped with nominal 40-mT/m magnetic field gradients, body radiofrequency transmit, and a 32-channel, anterior and posterior radiofrequency receiver array.
Real-time data were obtained using a 2D, multi-slice, free-breathing balanced steady-state–free precession sequence with a golden-angle radial trajectory with the following imaging param-eters: echo time, 1.4 ms; repetition time, 2.8 ms; number of radial k-space data, 128; field of view, 220 to 300 mm; pixel size, 1.72 to 2.34×1.72 to 2.34 mm; bandwidth, 1000 to 1221 Hz per pixel; slice thickness, 8 mm; slice spacing, 10 mm; and k-space sampling according to the golden angle (Φ=111.25°). Two-dimensional im-aging was performed at short-axis slice positions covering the en-tire LV. Six to eight thousand radial projections (16–22 s) per slice were acquired.
Image Reconstruction and Slice Volume QuantificationThe real-time image reconstruction and slice volume quantifica-tion methods have recently been validated in animals and in clini-cal patients.5,6 Briefly, image reconstruction was performed using a non-Cartesian parallel imaging (SENSE-based) algorithm in open-source software with 34 radial projections per image (image exposure time, 95.2 ms) and maximal view sharing (frame rate, 357 fps).7–9 Quantification of real-time images was performed through user-initialized active contour segmentation, which has been shown to provide slice volume values comparable with manual segmentation using clinical tools.6 Papillary muscles were excluded from the seg-mentation using the feature image and manual correction. The basal slice was determined by identification of the slice with mitral valve annular plane at end systole. LV slice volume was quantified from segmented data using the pixel size and slice thickness.
ECG Recording and SynchronizationECGs recorded in a magnetic field are distorted by the magnetohe-modynamic effect, which limits the interpretability of the 3-lead ECG when compared with a 12-lead ECG outside of the magnet.10 However, because of the need for ECG gating in cine CMR, robust 3-lead (ECG) acquisition, filtering, and real-time display are standard features of clinical CMR scanners. For this work, we implemented a logging algorithm to capture the ECG signal acquired during CMR. This results in synchronization between the ECG signal, real-time CMR image frames, and derived slice volume quantification as shown in Figure 1. The ECG distortion did not hinder the detection of QRS peaks and allowed for quantification of RR durations.11 Although QRS morphology is distorted by the magnetic field, the distortion is consis-tent across the same PVC beat type, which allowed for identification of each PVC beat type in all patients and exclusion of premature atrial contractions. ECG recording was continuous and synchronous during the imaging of the entire short axis of the LV. PVC burden was quanti-fied as the percentage of total beats during the scanning session.
Categorization of BeatsAfter detection of the R wave of the QRS complex via Pan–Tompkins algorithm implemented in Matlab (Mathworks, Natick MA), differ-ent beats were identified and categorized based on 2 measured RR
WHAT IS KNOWN
• Idiopathic premature ventricular complexes (PVCs) may create variable symptoms and are thought to cause a cardiomyopathy. Clinically, PVC-induced cardiomyopathy remains a diagnosis of exclusion.
•Conventional imaging is often used to rule out un-derlying disease. Techniques, such as conventional multishot MRI and echocardiography, do not pro-vide information on the hemodynamic function of different beat types.
WHAT THE STUDY ADDS
•Single-shot 2-dimensional magnetic resonance im-aging, when synchronized with ECG recording, can yield volumetric information on different beat types in patients with PVCs.
•The technique demonstrates that patients with similar prevalence of PVC can have different he-modynamic functions because of the stroke vol-ume of each beat type and the relative prevalence. This approach opens the door for more detailed evaluation of patients with suspected PVC-induced cardiomyopathy.
RV
LV
ECG
- V1
150
20
1050Time - secSl
ice V
olum
e - m
L
Figure 1. Two-dimensional real-time cardiovascular magnetic resonance imaging with synchronized ECG recording and mea-surement of slice volume over time. Top, A projection through the heart where the contraction of the left ventricle begins in sinus rhythm and transitions to premature ventricular complexes (PVCs). Middle, Synchronously recorded ECG with the identifica-tion of the R wave demarcated by a red triangle for sinus beats and green triangle for PVC beats. Bottom, Quantification of slice volume allows for observation of the change in slice function because of arrhythmia. The slice volume associated with the R wave (beginning of contraction) is shown via dots. For sinus con-tractions, the red dots occur close to the maximum slice volume (left ventricular end-diastolic volume [LV EDV]). However, during a PVC, the green dots indicate PVC preload, which may be sub-stantially lower than the LV EDV.
by guest on July 10, 2018http://circep.ahajournals.org/
Dow
nloaded from
3 Contijoch et al Beat-to-Beat LV Function During PVCs
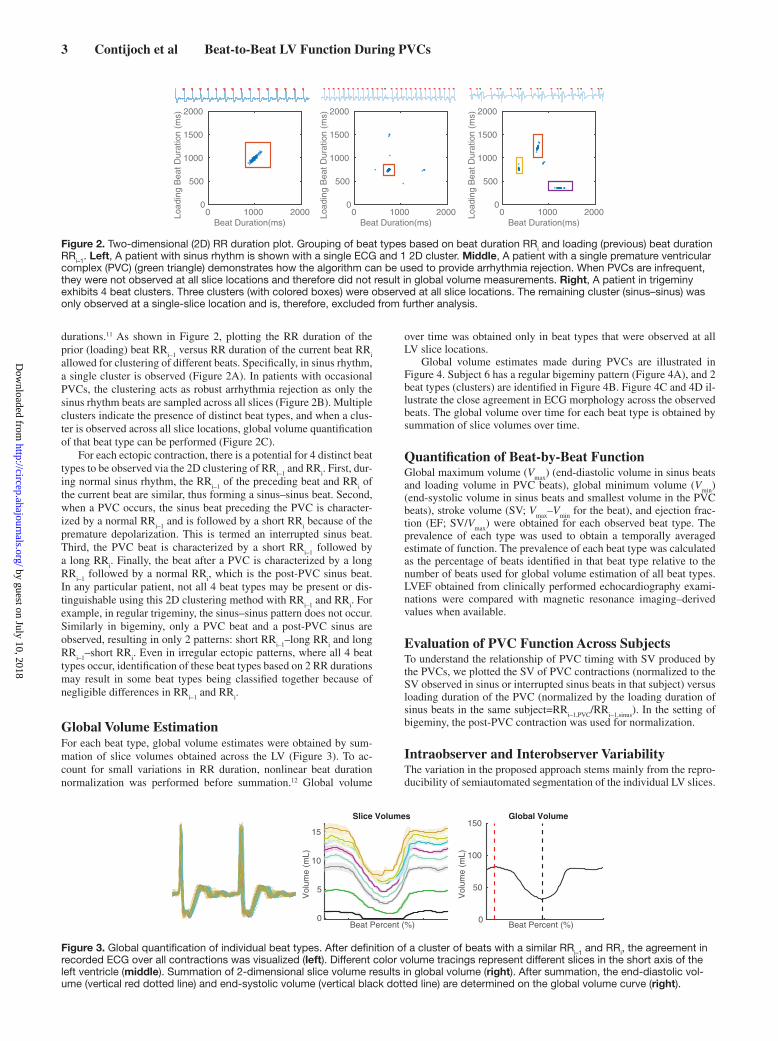
durations.11 As shown in Figure 2, plotting the RR duration of the prior (loading) beat RR
i–1 versus RR duration of the current beat RR
i
allowed for clustering of different beats. Specifically, in sinus rhythm, a single cluster is observed (Figure 2A). In patients with occasional PVCs, the clustering acts as robust arrhythmia rejection as only the sinus rhythm beats are sampled across all slices (Figure 2B). Multiple clusters indicate the presence of distinct beat types, and when a clus-ter is observed across all slice locations, global volume quantification of that beat type can be performed (Figure 2C).
For each ectopic contraction, there is a potential for 4 distinct beat types to be observed via the 2D clustering of RR
i–1 and RR
i. First, dur-
ing normal sinus rhythm, the RRi–1
of the preceding beat and RRi of
the current beat are similar, thus forming a sinus–sinus beat. Second, when a PVC occurs, the sinus beat preceding the PVC is character-ized by a normal RR
i–1 and is followed by a short RR
i because of the
premature depolarization. This is termed an interrupted sinus beat. Third, the PVC beat is characterized by a short RR
i–1 followed by
a long RRi. Finally, the beat after a PVC is characterized by a long
RRi–1
followed by a normal RRi, which is the post-PVC sinus beat.
In any particular patient, not all 4 beat types may be present or dis-tinguishable using this 2D clustering method with RR
i–1 and RR
i. For
example, in regular trigeminy, the sinus–sinus pattern does not occur. Similarly in bigeminy, only a PVC beat and a post-PVC sinus are observed, resulting in only 2 patterns: short RR
i–1–long RR
i and long
RRi–1
–short RRi. Even in irregular ectopic patterns, where all 4 beat
types occur, identification of these beat types based on 2 RR durations may result in some beat types being classified together because of negligible differences in RR
i–1 and RR
i.
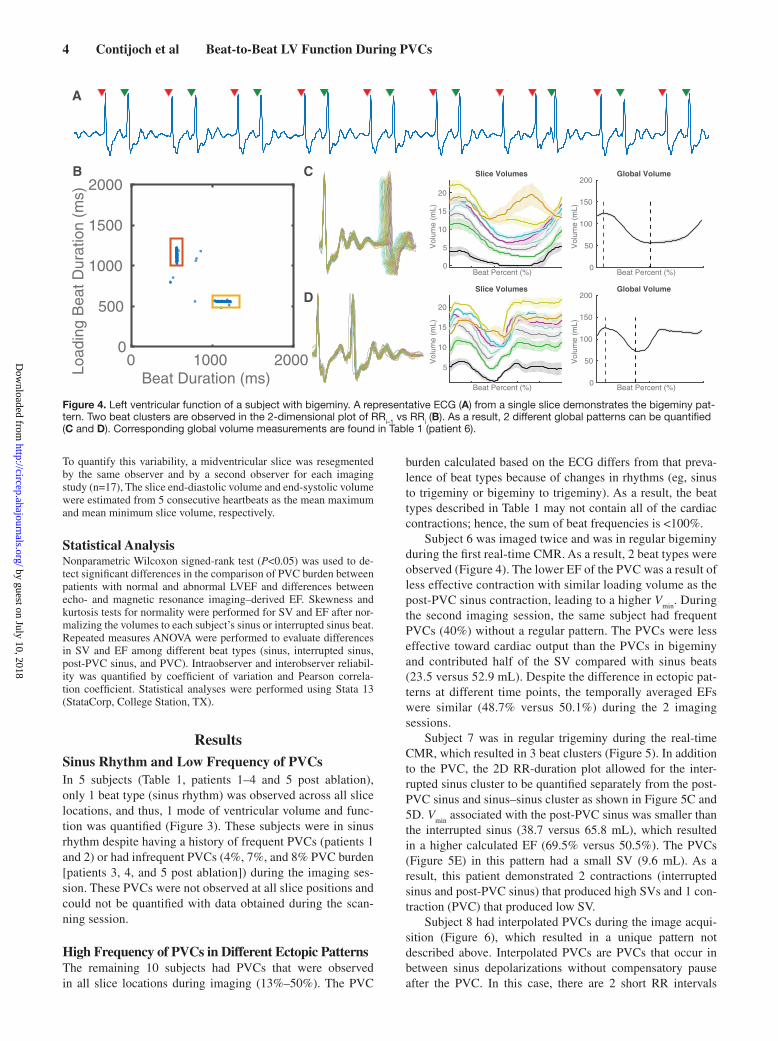
Global Volume EstimationFor each beat type, global volume estimates were obtained by sum-mation of slice volumes obtained across the LV (Figure 3). To ac-count for small variations in RR duration, nonlinear beat duration normalization was performed before summation.12 Global volume
over time was obtained only in beat types that were observed at all LV slice locations.
Global volume estimates made during PVCs are illustrated in Figure 4. Subject 6 has a regular bigeminy pattern (Figure 4A), and 2 beat types (clusters) are identified in Figure 4B. Figure 4C and 4D il-lustrate the close agreement in ECG morphology across the observed beats. The global volume over time for each beat type is obtained by summation of slice volumes over time.
Quantification of Beat-by-Beat FunctionGlobal maximum volume (V
max) (end-diastolic volume in sinus beats
and loading volume in PVC beats), global minimum volume (Vmin
) (end-systolic volume in sinus beats and smallest volume in the PVC beats), stroke volume (SV; V
max–V
min for the beat), and ejection frac-
tion (EF; SV/Vmax
) were obtained for each observed beat type. The prevalence of each type was used to obtain a temporally averaged estimate of function. The prevalence of each beat type was calculated as the percentage of beats identified in that beat type relative to the number of beats used for global volume estimation of all beat types. LVEF obtained from clinically performed echocardiography exami-nations were compared with magnetic resonance imaging–derived values when available.
Evaluation of PVC Function Across SubjectsTo understand the relationship of PVC timing with SV produced by the PVCs, we plotted the SV of PVC contractions (normalized to the SV observed in sinus or interrupted sinus beats in that subject) versus loading duration of the PVC (normalized by the loading duration of sinus beats in the same subject=RR
i–1,PVC/RR
i–1,sinus). In the setting of
bigeminy, the post-PVC contraction was used for normalization.
Intraobserver and Interobserver VariabilityThe variation in the proposed approach stems mainly from the repro-ducibility of semiautomated segmentation of the individual LV slices.
Beat Duration(ms)0 1000 2000Lo
adin
g B
eat D
urat
ion
(ms)
0
500
1000
1500
2000
Beat Duration(ms)0 1000 2000Lo
adin
g B
eat D
urat
ion
(ms)
0
500
1000
1500
2000
Beat Duration(ms)0 1000 2000Lo
adin
g B
eat D
urat
ion
(ms)
0
500
1000
1500
2000
Figure 2. Two-dimensional (2D) RR duration plot. Grouping of beat types based on beat duration RRi and loading (previous) beat duration RRi–1. Left, A patient with sinus rhythm is shown with a single ECG and 1 2D cluster. Middle, A patient with a single premature ventricular complex (PVC) (green triangle) demonstrates how the algorithm can be used to provide arrhythmia rejection. When PVCs are infrequent, they were not observed at all slice locations and therefore did not result in global volume measurements. Right, A patient in trigeminy exhibits 4 beat clusters. Three clusters (with colored boxes) were observed at all slice locations. The remaining cluster (sinus–sinus) was only observed at a single-slice location and is, therefore, excluded from further analysis.
Beat Percent (%)
Vol
ume
(mL)
0
5
10
15
Slice Volumes
Beat Percent (%)
Vol
ume
(mL)
0
50
100
150Global Volume
Figure 3. Global quantification of individual beat types. After definition of a cluster of beats with a similar RRi–1 and RRi, the agreement in recorded ECG over all contractions was visualized (left). Different color volume tracings represent different slices in the short axis of the left ventricle (middle). Summation of 2-dimensional slice volume results in global volume (right). After summation, the end-diastolic vol-ume (vertical red dotted line) and end-systolic volume (vertical black dotted line) are determined on the global volume curve (right).
by guest on July 10, 2018http://circep.ahajournals.org/
Dow
nloaded from
4 Contijoch et al Beat-to-Beat LV Function During PVCs
To quantify this variability, a midventricular slice was resegmented by the same observer and by a second observer for each imaging study (n=17), The slice end-diastolic volume and end-systolic volume were estimated from 5 consecutive heartbeats as the mean maximum and mean minimum slice volume, respectively.
Statistical AnalysisNonparametric Wilcoxon signed-rank test (P<0.05) was used to de-tect significant differences in the comparison of PVC burden between patients with normal and abnormal LVEF and differences between echo- and magnetic resonance imaging–derived EF. Skewness and kurtosis tests for normality were performed for SV and EF after nor-malizing the volumes to each subject’s sinus or interrupted sinus beat. Repeated measures ANOVA were performed to evaluate differences in SV and EF among different beat types (sinus, interrupted sinus, post-PVC sinus, and PVC). Intraobserver and interobserver reliabil-ity was quantified by coefficient of variation and Pearson correla-tion coefficient. Statistical analyses were performed using Stata 13 (StataCorp, College Station, TX).
ResultsSinus Rhythm and Low Frequency of PVCsIn 5 subjects (Table 1, patients 1–4 and 5 post ablation), only 1 beat type (sinus rhythm) was observed across all slice locations, and thus, 1 mode of ventricular volume and func-tion was quantified (Figure 3). These subjects were in sinus rhythm despite having a history of frequent PVCs (patients 1 and 2) or had infrequent PVCs (4%, 7%, and 8% PVC burden [patients 3, 4, and 5 post ablation]) during the imaging ses-sion. These PVCs were not observed at all slice positions and could not be quantified with data obtained during the scan-ning session.
High Frequency of PVCs in Different Ectopic PatternsThe remaining 10 subjects had PVCs that were observed in all slice locations during imaging (13%–50%). The PVC
burden calculated based on the ECG differs from that preva-lence of beat types because of changes in rhythms (eg, sinus to trigeminy or bigeminy to trigeminy). As a result, the beat types described in Table 1 may not contain all of the cardiac contractions; hence, the sum of beat frequencies is <100%.
Subject 6 was imaged twice and was in regular bigeminy during the first real-time CMR. As a result, 2 beat types were observed (Figure 4). The lower EF of the PVC was a result of less effective contraction with similar loading volume as the post-PVC sinus contraction, leading to a higher V
min. During
the second imaging session, the same subject had frequent PVCs (40%) without a regular pattern. The PVCs were less effective toward cardiac output than the PVCs in bigeminy and contributed half of the SV compared with sinus beats (23.5 versus 52.9 mL). Despite the difference in ectopic pat-terns at different time points, the temporally averaged EFs were similar (48.7% versus 50.1%) during the 2 imaging sessions.
Subject 7 was in regular trigeminy during the real-time CMR, which resulted in 3 beat clusters (Figure 5). In addition to the PVC, the 2D RR-duration plot allowed for the inter-rupted sinus cluster to be quantified separately from the post-PVC sinus and sinus–sinus cluster as shown in Figure 5C and 5D. V
min associated with the post-PVC sinus was smaller than
the interrupted sinus (38.7 versus 65.8 mL), which resulted in a higher calculated EF (69.5% versus 50.5%). The PVCs (Figure 5E) in this pattern had a small SV (9.6 mL). As a result, this patient demonstrated 2 contractions (interrupted sinus and post-PVC sinus) that produced high SVs and 1 con-traction (PVC) that produced low SV.
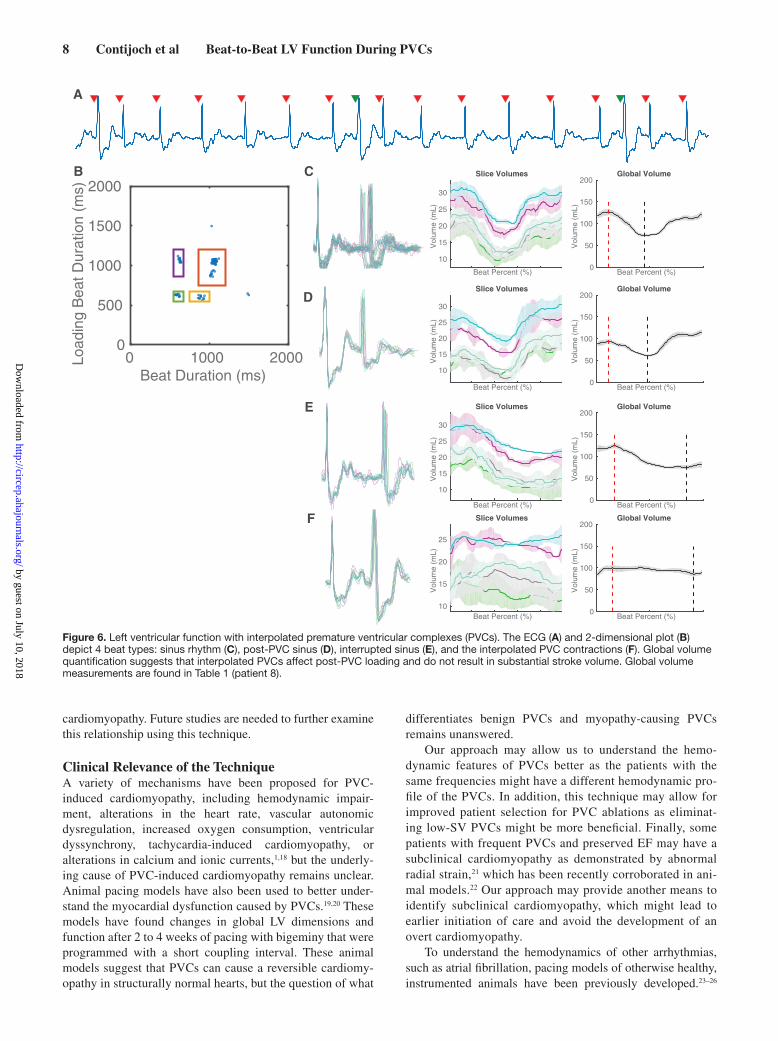
Subject 8 had interpolated PVCs during the image acqui-sition (Figure 6), which resulted in a unique pattern not described above. Interpolated PVCs are PVCs that occur in between sinus depolarizations without compensatory pause after the PVC. In this case, there are 2 short RR intervals
Beat Percent (%)
Vol
ume
(mL)
0
5
10
15
20
Slice Volumes
Beat Percent (%)
Vol
ume
(mL)
0
50
100
150
200Global Volume
Beat Percent (%)
Vol
ume
(mL)
5
10
15
20
Slice Volumes
Beat Percent (%)
Vol
ume
(mL)
0
50
100
150
200Global Volume
Beat Duration (ms) 0 1000 2000
Load
ing
Bea
t Dur
atio
n (m
s)
0
500
1000
1500
2000B C
D
A
Figure 4. Left ventricular function of a subject with bigeminy. A representative ECG (A) from a single slice demonstrates the bigeminy pat-tern. Two beat clusters are observed in the 2-dimensional plot of RRi–1 vs RRi (B). As a result, 2 different global patterns can be quantified (C and D). Corresponding global volume measurements are found in Table 1 (patient 6).
by guest on July 10, 2018http://circep.ahajournals.org/
Dow
nloaded from

5 Contijoch et al Beat-to-Beat LV Function During PVCs
Table 1. Beat Characteristics, Volumetric Measures, and Weighted Average of Study Subjects
Patient No.
Patient Information
Beat Type
Loading Beat
Duration, ms
Beat Observations
Volumetric Measures
Beat Frequency,
%
Temporal Average EF, %
Echo-Derived EF, %Age Sex
Arrhythmia Type
PVC Prevalence,
% Vmax
, mL SV, mL EF, %
1 31 F History of PVC
0 Sinus 849.6 207 81.1 44.0 54.3 …
2 22 M History of PVC
0 Sinus 905.0 130 143.1 55.2 38.6 38
3 90 F PVC 4 Sinus 740.1 20 152.3 59.2 38.9 …
4 56 M PVC 7 Sinus 964.0 41 103.5 49.7 48.0 …
5 19 F Irregular bigeminy
41 Post-PVC sinus
1010.5 66 162.2 59.3 36.5 11 23.0±9.4 36
PVC 666.3 66 145.6 24.0 16.5 22
Post ablation
8 Sinus 730.6 66 170.7 60.1 35.2
6 28 F Bigeminy 50 Post-PVC sinus
1132.6 32 123.7 67.9 54.9 44 48.6±6.3 …
PVC 558.3 53 125.6 53.1 42.3 44
PVC 40 Post PVC/sinus
1350.3 51 84.9 52.9 62.2 19 50.1±15.3 …
Interrupted sinus
1012.0 41 102.3 63.2 61.8 32
PVC 534.1 43 77.4 23.5 30.4 30
7 51 M Trigeminy 33 Post PVC/sinus
1224.0 44 126.9 88.2 69.5 29 44.5±22.5 65
Interrupted sinus
761.3 39 132.8 67.0 50.5 31
PVC 353.9 11 62.5 9.6 15.3 31
8 58 M Interpolated PVC
19 Sinus 1056.3 13 126.8 54.0 42.6 47 36.3±10.1 …
Post-PVC sinus
594.1 12 94.4 32.7 34.6 13
Interrupted sinus
1056.3 54 124.3 49.2 39.6 16
Interpolated PVC
625.5 18 100.0 14.0 14.0 14
9 59 F PVC 35 Post PVC/sinus
1288.6 19 83.9 61.7 73.6 39 69.1±8.8 …
Interrupted sinus
1131.4 48 85.5 63.1 73.9 13
PVC 675.4 63 38.8 20.2 52.1 14
10 42 F Irregular trigeminy
33 Post PVC/sinus
967.8 38 65.8 42.6 64.8 22 61.7±3.0 62
Interrupted sinus
825.2 102 72.5 45.1 62.3 29
PVC 766.3 33 62.7 35.6 56.9 18
11 67 M PVC 28 Post PVC/sinus
549.4 35 140.6 40.9 29.1 37 27.4±5.2 …
Interrupted sinus
736.0 78 149.0 48.6 32.6 12
PVC 703.5 56 110.7 19.4 17.5 13
(Continued )
by guest on July 10, 2018http://circep.ahajournals.org/
Dow
nloaded from

6 Contijoch et al Beat-to-Beat LV Function During PVCs
occurring sequentially. The loading volume for the post-PVC sinus contraction (94.4 mL) decreased relative to normal sinus beats (126.8 mL). The post-PVC contraction resulted in a decrease in EF (34.6% versus 42.6%). Furthermore, the PVC did not result in substantial SV (14.0 mL). As a result, inter-polated PVCs resulted in a decreased SV not only in the PVC beat but also in the post-PVC beats.
Subjects 9 to 15 and subject 5 prior to ablation had a vari-ety of patterns, including periods of bigeminy and trigeminy, as well as PVCs late in diastole. The different arrhythmia patterns resulted in different numbers of beat types being observed, which are also shown in Table 1.
After normalizing the SV and EF to each subject’s sinus or interrupted sinus beats, both variables were tested and found to be normally distributed. There were statistically significant differences in SV (P<0.0001) and EF (P<0.0001) between PVC and non-PVC beats. Differences between non-PVC beats (sinus, interrupted sinus, and post-PVC sinus) were not significant (SV, P=0.30; EF, P=0.51).
In 5 subjects, clinical echocardiograms were performed prior to CMR examination. The echo-derived EF was assessed using the biplane method and is shown in Table 1. When com-pared with non-PVC contractions from real-time CMR, the values show close agreement (P=0.84; R2=0.986; coefficient of variation=5.8%).
PVC SV and TimingTo further understand the relationship of PVC timing with SV produced by the PVCs, we plotted the SV of the PVC (nor-malized to the SV observed during sinus contractions in that subject) versus loading duration of PVC (normalized by the loading duration of sinus beats in the same subject) as shown in Figure 7. The SV of PVC correlated poorly to the timing in the cardiac cycle (linear fit: slope=0.27; y intercept=23.6; R2=0.03; P=0.552).
Interobserver and Intraobserver ReproducibilityThe reproducibility results are shown in Table 2. Pearson coef-ficient values were high for both cardiac phases and intraob-server and interobserver measurements.
DiscussionIn this work, we have demonstrated a technique, which com-bines a 2D real-time magnetic resonance imaging technique and simultaneous ECG logging to quantify ventricular vol-umes. This technique allowed us to characterize different PVCs by volume and compare them with other beats in the same subject, which revealed differential SV and contribu-tion to cardiac output. In subjects with similar PVC frequen-cies, the hemodynamic effect of PVCs occurring in different patterns can be significantly different. In addition, we have
12 19 M PVC 25 Sinus 711.1 58 171.2 64.8 37.9 30 34.5±11.0 …
Post-PVC sinus
1103.0 55 149.3 68.6 45.9 22
Interrupted sinus
739.8 36 166.8 62.8 37.7 23
PVC 450.8 8 124.4 18.4 14.8 21
13 56 F PVC 24 Sinus 970.6 12 104.9 56.7 54.1 44 54.9±5.9 …
Post-PVC sinus
1552.2 11 108.3 75.3 69.5 10
Interrupted sinus
970.6 111 122.4 66.6 54.4 15
PVC 448.0 15 73.6 35.1 47.7 14
14 90 M PVC 14 Post PVC/sinus
1106.2 14 126.6 65.1 51.4 69 47.4±11.9 52
Interrupted sinus
936.9 98 127.1 65.5 51.5 9
PVC 565.6 19 66.9 7.8 11.6 9
15 27 F PVC 13 Post PVC/sinus
1292.5 18 87.2 49.0 56.2 64 50.8±14.5 …
Interrupted sinus
977.7 207 99.2 57.5 58.0 12
PVC 599.8 130 63.2 8.7 13.8 12
EF indicates ejection fraction; F, female; M, male; PVC, premature ventricular complexes; and SV, stroke volume.
Table 1. Continued
Patient No.
Patient Information
Beat Type
Loading Beat
Duration, ms
Beat Observations
Volumetric Measures
Beat Frequency,
%
Temporal Average EF, %
Echo-Derived EF, %Age Sex
Arrhythmia Type
PVC Prevalence,
% Vmax
, mL SV, mL EF, %
by guest on July 10, 2018http://circep.ahajournals.org/
Dow
nloaded from

7 Contijoch et al Beat-to-Beat LV Function During PVCs
reported that PVCs can potentially lower subsequent sinus loading volume rather than augmenting it.
Assessment of LV FunctionThere is currently no standard noninvasive method to assess the volumes and functions of PVCs in addition to sinus con-tractions. In echocardiography, which has been used as the standard in evaluating patients with suspected PVC-induced cardiomyopathy, PVCs are ignored in situations other than bigeminy (in which case sinus beats and PVC beats are aver-aged).13 Our method correlates closely with echocardiography in assessing the non-PVC beats.
Among the 15 subjects, if we consider the LV function to be represented by the normal depolarization beats, includ-ing sinus, interrupted sinus, and post-PVC sinus beats, then subjects 6, 7, 9, 10, 13, and 15 would have normal function. Their burden of PVCs measured by PVC frequency was not significantly different from the remaining subjects with abnor-mal LVEF (Wilcoxon signed-rank test, P=0.23). If we instead consider the average EF of all beats as the representation of LV function, only subjects 9 and 10 would have normal func-tion. These 2 subjects had high burdens of PVCs (35% and 33%) but they were the 2 latest occurring PVCs (675 and 766 ms after the previous R-wave, respectively). These PVCs produced SVs that were similar to sinus beats, which limited the hemodynamic effect of the PVCs. The PVC contribu-tion to hemodynamics coupled with PVC frequency may be
more important than frequency alone. For example, subject 6 had a PVC prevalence of 40% to 50%, but all the PVCs pro-duced considerable SV, whereas subject 7 had a prevalence of 33% with PVCs that produced little SV. It is believed that PVC-induced cardiomyopathy develops in a time-dependent fashion where the cumulative burden over time may play an important role.14 Future longitudinal work examining the effect of hemodynamics and frequency is needed.
It has long been recognized that PVC burden is only one of the many factors contributing to impairment of LV systolic function in PVC-induced cardiomyopathy. PVC interpolation has been identified as an additional indepen-dent predictor, but the hemodynamic mechanism has not been elucidated.15 In 1 subject with interpolated PVCs, we observed the SVs of both the PVC and the post-PVC contraction being impaired. This has not been previously reported, and the implication of this finding would need to be investigated in a larger sample.
Previously, it has been reported that PVCs with coupling intervals ≤600 ms have a lower mean LVEF,16 but a recent study suggests that a longer coupling interval leads to more dyssynchronous contraction.17 Our study has shown a poor correlation between the coupling intervals of the PVC and the SV produced. This might be because of the heterogene-ity of our subject population, including key factors, such as the origin of the PVC, the degree of dyssynchrony associ-ated with the PVC contraction, and the degree of underlying
Beat Percent (%)
Vol
ume
(mL)
0
5
10
15
20
25
Slice Volumes
Beat Percent (%)
Vol
ume
(mL)
0
50
100
150
200Global Volume
Beat Percent (%)
Vol
ume
(mL)
5
10
15
20
25Slice Volumes
Beat Percent (%)
Vol
ume
(mL)
0
50
100
150
200Global Volume
Beat Duration (ms) 0 1000 2000Lo
adin
g B
eat D
urat
ion
(ms)
0
500
1000
1500
2000CB
D
A
Beat Percent (%)
Vol
ume
(mL)
5
10
15
20
Slice Volumes
Beat Percent (%)
Vol
ume
(mL)
0
50
100
150
200Global Volume E
Figure 5. Left ventricular function of a subject with trigeminy. Three types of beats (post–premature ventricular complex (PVC) sinus, inter-rupted sinus, and PVC) can be observed in the ECG (A). This leads to 3 distinct clusters and varying global volume measurements (B–E). Global volume measurements are found in Table 1 (patient 7).
by guest on July 10, 2018http://circep.ahajournals.org/
Dow
nloaded from
8 Contijoch et al Beat-to-Beat LV Function During PVCs
cardiomyopathy. Future studies are needed to further examine this relationship using this technique.
Clinical Relevance of the TechniqueA variety of mechanisms have been proposed for PVC-induced cardiomyopathy, including hemodynamic impair-ment, alterations in the heart rate, vascular autonomic dysregulation, increased oxygen consumption, ventricular dyssynchrony, tachycardia-induced cardiomyopathy, or alterations in calcium and ionic currents,1,18 but the underly-ing cause of PVC-induced cardiomyopathy remains unclear. Animal pacing models have also been used to better under-stand the myocardial dysfunction caused by PVCs.19,20 These models have found changes in global LV dimensions and function after 2 to 4 weeks of pacing with bigeminy that were programmed with a short coupling interval. These animal models suggest that PVCs can cause a reversible cardiomy-opathy in structurally normal hearts, but the question of what
differentiates benign PVCs and myopathy-causing PVCs remains unanswered.
Our approach may allow us to understand the hemo-dynamic features of PVCs better as the patients with the same frequencies might have a different hemodynamic pro-file of the PVCs. In addition, this technique may allow for improved patient selection for PVC ablations as eliminat-ing low-SV PVCs might be more beneficial. Finally, some patients with frequent PVCs and preserved EF may have a subclinical cardiomyopathy as demonstrated by abnormal radial strain,21 which has been recently corroborated in ani-mal models.22 Our approach may provide another means to identify subclinical cardiomyopathy, which might lead to earlier initiation of care and avoid the development of an overt cardiomyopathy.
To understand the hemodynamics of other arrhythmias, such as atrial fibrillation, pacing models of otherwise healthy, instrumented animals have been previously developed.23–26
Beat Percent (%)
Vol
ume
(mL)
10
15
20
25
30
Slice Volumes
Beat Percent (%)
Vol
ume
(mL)
0
50
100
150
200Global Volume
Beat Percent (%)
Vol
ume
(mL)
10
15
20
25
30
Slice Volumes
Beat Percent (%)
Vol
ume
(mL)
0
50
100
150
200Global Volume
Beat Duration (ms) 0 1000 2000 L
oadi
ng B
eat D
urat
ion
(ms)
0
500
1000
1500
2000CB
D
A
Beat Percent (%)
Vol
ume
(mL)
10
15
20
25
30
Slice Volumes
Beat Percent (%)
Vol
ume
(mL)
0
50
100
150
200Global Volume E
Beat Percent (%)
Vol
ume
(mL)
10
15
20
25
Slice Volumes
Beat Percent (%)
Vol
ume
(mL)
0
50
100
150
200Global Volume F
Figure 6. Left ventricular function with interpolated premature ventricular complexes (PVCs). The ECG (A) and 2-dimensional plot (B) depict 4 beat types: sinus rhythm (C), post-PVC sinus (D), interrupted sinus (E), and the interpolated PVC contractions (F). Global volume quantification suggests that interpolated PVCs affect post-PVC loading and do not result in substantial stroke volume. Global volume measurements are found in Table 1 (patient 8).
by guest on July 10, 2018http://circep.ahajournals.org/
Dow
nloaded from

9 Contijoch et al Beat-to-Beat LV Function During PVCs
Our technique allows for evaluation of patients without the need for instrumentation as the ECG system, and the imag-ing can be used to obtain both timing and hemodynamic information.
We only observed 30% of subjects who had increased (>5%) EF after ectopic contractions, whereas previous work describes substantial postextrasystolic potentiation. This dis-crepancy may be because of different patient population or measurement techniques.
Advantages Over Current TechniquesThe 2D real-time imaging method we used combines non-Cartesian k-space sampling and an iterative SENSE-based image reconstruction technique to improve the image qual-ity (by reducing undersampling artifacts) and spatiotemporal resolution when compared with conventional real-time acqui-sitions. This allows for accurate estimation of slice and global volumes in sinus rhythm patients when compared with stan-dard cine acquisitions.5,6
In the patients with infrequent PVCs, our approach pro-vided arrhythmia rejection similar to clinical CMR acquisi-tions where only the predominant contraction mode was quantified. However, our approach is more robust as con-ventional arrhythmia rejection can fail in several ways. First, conventional arrhythmia rejection uses the RR duration to categorize beats in real time and may have variable suc-cess depending on the ectopic morphology and frequency. Second, if the RR duration acceptance window is too small, a high rejection rate will lead to prolonged breathholds and the potential for respiratory motion corruption. Third, not all
PVCs may be reliably detected by the vector ECG because depolarizations can sometimes resemble a T wave. Using the real-time imaging technique, our approach is not sensitive to any of these failure modes.
LimitationsFirst, the entire heart is acquired with a slice-by-slice 2D real-time imaging technique. In patients with infrequent PVCs, PVCs might not occur at all slice positions, which limits the quantification of rare PVCs. In these instances, quantita-tive values are similar to those obtained using conventional cine CMR with arrhythmia rejection. Longer scans in these patients could allow for analysis of these infrequent PVCs. Furthermore, patients with multiple PVC morphologies (mul-tiple coupling intervals) result in a higher number of clusters and will require prolonged scans to capture all of the different beat morphologies.
A second limitation of this study is the potential effect of respiratory motion on measured cardiac function. We performed the real-time acquisition during free respiration to minimize the overall acquisition time. We did not use a respiratory window because it would reduce the number of observed beats and would compromise our ability to observe multiple beat types across slice locations. However, the potential effect of respiratory motion is likely small because large variations were not present in the slice volume curves (as shown in Figures 3–6). In addition, recent publications indicate that the effect of respiratory position on LV volume quantification is negligible potentially because of a predomi-nant in-plane as opposed to through-plane motion.27 However, changes in intrathoracic pressure will affect cardiac loading, and therefore, imaging during breathholds or selection of images based on respiratory motion could be used in future studies to minimize this effect.
A third limitation is that our approach may combine data acquired from different PVC beats, which occur with similar coupling intervals and PVC duration. Additional refinements to the technique are necessary to subdivide these clusters into unique PVC types.
In addition, our approach does not include retrospective reconstruction of motion corrected data, compressed sens-ing reconstructions, or low-rank image reconstruction, which have been recently proposed to further improve spatiotem-poral resolution and image quality.28–31 These techniques are complementary to the method described here, and combina-tion of those methods with this approach may allow further acceleration and improved image quality.
ConclusionsWe have presented a novel CMR-based method to assess LV function, including PVCs in subjects with ventricular ectopy, which provides volumetric assessment of multiple beat types. This method revealed that different ectopic patterns might contribute differently to hemodynamics. Our findings allowed for accurate interrogation of the LV function dur-ing PVCs in each individual patient and may provide new insights into PVC-induced cardiomyopathy and symptoms associated with PVCs.
Normalized Loading Duration0 50 100
Nor
mal
ized
Str
oke
Vol
ume
0
20
40
60
80
100
Figure 7. Normalized stroke volume vs normalized loading dura-tion. For patients with ectopic contractions, the normalized stroke volume (SV; 100, SVPVC/SVsinus) was plotted as a function of normalized loading duration (100, RRi–1,PVC/RRi–1,sinus). Linear fit: slope=0.27, y intercept=23.6, R2=0.03, and P=0.552. PVC indi-cates premature ventricular complex.
Table 2. Intraobserver and Interobserver Variability in Measurement of Slice Vmax and Vmin
Cardiac Phase
Intraobserver Interobserver
CoV, %Pearson
Coefficient CoV, %Pearson
Coefficient
Vmax
6.5 0.982 6.4 0.982
Vmin
8.0 0.988 11.1 0.978
CoV indicates coefficient of variation.
by guest on July 10, 2018http://circep.ahajournals.org/
Dow
nloaded from

10 Contijoch et al Beat-to-Beat LV Function During PVCs
Sources of FundingThis study was supported by grants from National Institutes of Health (F31-HL120580, R00-HL108157, R01-EB014346, R01-HL103723, R01-HL63954, T32-HL007954, and T32-EB009384) and Cardiovascular Medical Research and Education Fund (Philadelphia, PA).
DisclosuresNone.
References 1. Cha Y-M, Lee GK, Klarich KW, Grogan M. Premature ventricular con-
traction-induced cardiomyopathy: a treatable condition. Circ Arrhythm Electrophysiol. 2012;5:229–236.
2. Chia JM, Fischer SE, Wickline SA, Lorenz CH. Performance of QRS de-tection for cardiac magnetic resonance imaging with a novel vectorcardio-graphic triggering method. J Magn Reson Imaging. 2000;12:678–688.
3. Kühl HP, Spuentrup E, Wall A, Franke A, Schröder J, Heussen N, Hanrath P, Günther RW, Buecker A. Assessment of myocardial func-tion with interactive non-breath-hold real-time MR imaging: comparison with echocardiography and breath-hold Cine MR imaging. Radiology. 2004;231:198–207. doi: 10.1148/radiol.2311021237.
4. Bauer RW, Radtke I, Block KT, Larson MC, Kerl JM, Hammerstingl R, Graf TG, Vogl TJ, Zhang S. True real-time cardiac MRI in free breathing without ECG synchronization using a novel sequence with radial k-space sampling and balanced SSFP contrast mode. Int J Cardiovasc Imaging. 2013;29:1059–1067. doi: 10.1007/s10554-013-0183-0.
5. Witschey WR, Contijoch F, McGarvey JR, Ferrari VA, Hansen MS, Lee ME, Takebayashi S, Aoki C, Chirinos JA, Yushkevich PA, Gorman JH 3rd, Pilla JJ, Gorman RC. Real-time magnetic resonance imaging technique for determining left ventricle pressure-volume loops. Ann Thorac Surg. 2014;97:1597–1603. doi: 10.1016/j.athoracsur.2014.01.010.
6. Contijoch F, Witschey WR, Rogers K, Rears H, Hansen M, Yushkevich P, Gorman J 3rd, Gorman RC, Han Y. User-initialized active contour seg-mentation and golden-angle real-time cardiovascular magnetic resonance enable accurate assessment of LV function in patients with sinus rhythm and arrhythmias. J Cardiovasc Magn Reson. 2015;17:37. doi: 10.1186/s12968-015-0146-9.
7. Pruessmann KP, Weiger M, Börnert P, Boesiger P. Advances in sensi-tivity encoding with arbitrary k-space trajectories. Magn Reson Med. 2001;46:638–651.
8. Sørensen TS, Atkinson D, Schaeffter T, Hansen MS. Real-time recon-struction of sensitivity encoded radial magnetic resonance imaging using a graphics processing unit. IEEE Trans Med Imaging. 2009;28:1974–1985. doi: 10.1109/TMI.2009.2027118.
9. Hansen MS, Sørensen TS. Gadgetron: an open source framework for medical image reconstruction. Magn Reson Med. 2013;69:1768–1776. doi: 10.1002/mrm.24389.
10. Dimick RN, Hedlund LW, Herfkens RJ, Fram EK, Utz J. Optimizing elec-trocardiograph electrode placement for cardiac-gated magnetic resonance imaging. Invest Radiol. 1987;22:17–22.
11. Pan J, Tompkins WJ. A real-time QRS detection algorithm. IEEE Trans Biomed Eng. 1985;32:230–236.
12. Bacharach SL, Bonow RO, Green MV. Comparison of fixed and variable temporal resolution methods for creating gated cardiac blood-pool image sequences. J Nucl Med. 1990;31:38–42.
13. Del Carpio Munoz F, Syed FF, Noheria A, Cha YM, Friedman PA, Hammill SC, Munger TM, Venkatachalam KL, Shen WK, Packer DL, Asirvatham SJ. Characteristics of premature ventricular com-plexes as correlates of reduced left ventricular systolic function: study of the burden, duration, coupling interval, morphology and site of origin of PVCs. J Cardiovasc Electrophysiol. 2011;22:791–798. doi: 10.1111/j.1540-8167.2011.02021.x.
14. Yarlagadda RK, Iwai S, Stein KM, Markowitz SM, Shah BK, Cheung JW, Tan V, Lerman BB, Mittal S. Reversal of cardiomyopathy in patients with repetitive monomorphic ventricular ectopy originating from the right ventricular outflow tract. Circulation. 2005;112:1092–1097. doi: 10.1161/CIRCULATIONAHA.105.546432.
15. Olgun H, Yokokawa M, Baman T, Kim HM, Armstrong W, Good E, Chugh A, Pelosi F Jr, Crawford T, Oral H, Morady F, Bogun F. The role of inter-polation in PVC-induced cardiomyopathy. Heart Rhythm. 2011;8:1046–1049. doi: 10.1016/j.hrthm.2011.02.034.
16. Sun Y, Blom NA, Yu Y, Ma P, Wang Y, Han X, Swenne CA, van der Wall EE. The influence of premature ventricular contractions on left ventricular function in asymptomatic children without structural heart disease: an echocardiographic evaluation. Int J Cardiovasc Imaging. 2003;19:295–299.
17. Potfay J, Kaszala K, Tan AY, Sima AP, Gorcsan J 3rd, Ellenbogen KA, Huizar JF. Abnormal left ventricular mechanics of ventricular ectopic beats: insights into origin and coupling interval in premature ventricu-lar contraction-induced cardiomyopathy. Circ Arrhythm Electrophysiol. 2015;8:1194–1200. doi: 10.1161/CIRCEP.115.003047.
18. Wang Y, Eltit JM, Kaszala K, Tan A, Jiang M, Zhang M, Tseng GN, Huizar JF. Cellular mechanism of premature ventricular contraction-induced cardiomyopathy. Heart Rhythm. 2014;11:2064–2072. doi: 10.1016/j.hrthm.2014.07.022.
19. Akoum NW, Daccarett M, Wasmund SL, Hamdan MH. An animal model for ectopy-induced cardiomyopathy. Pacing Clin Electrophysiol. 2011;34:291–295. doi: 10.1111/j.1540-8159.2010.02947.x.
20. Huizar JF, Kaszala K, Potfay J, Minisi AJ, Lesnefsky EJ, Abbate A, Mezzaroma E, Chen Q, Kukreja RC, Hoke NN, Thacker LR 2nd, Ellenbogen KA, Wood MA. Left ventricular systolic dysfunction induced by ventricular ectopy: a novel model for premature ventricular contrac-tion-induced cardiomyopathy. Circ Arrhythm Electrophysiol. 2011;4:543–549. doi: 10.1161/CIRCEP.111.962381.
21. Wijnmaalen AP, Delgado V, Schalij MJ, van Huls van Taxis CF, Holman ER, Bax JJ, Zeppenfeld K. Beneficial effects of catheter ablation on left ventricular and right ventricular function in patients with frequent pre-mature ventricular contractions and preserved ejection fraction. Heart. 2010;96:1275–1280. doi: 10.1136/hrt.2009.188722.
22. Tan AY, Hu YL, Potfay J, Kaszala K, Howren M, Sima AP, Shultz M, Koneru JN, Ellenbogen KA, Huizar JF. Impact of ventricular ecto-pic burden in a premature ventricular contraction-induced cardiomy-opathy animal model. Heart Rhythm. 2016;13:755–761. doi: 10.1016/j.hrthm.2015.11.016.
23. Takada H, Takeuchi S, Ando K, Kaito A, Yoshida S. Experimental studies on myocardial contractility and hemodynamics in extrasystoles. Jpn Circ J. 1970;34:419–430.
24. Yamaguchi H, Takaki M, Ito H, Tachibana H, Lee S, Suga H. Pressure-interval relationship characterizes left ventricular irregular beat con-tractilities and their mean level during atrial fibrillation. Jpn J Physiol. 1997;47:101–110.
25. Suzuki S, Araki J, Morita T, Mohri S, Mikane T, Yamaguchi H, Sano S, Ohe T, Hirakawa M, Suga H. Ventricular contractility in atrial fibrillation is predictable by mechanical restitution and potentiation. Am J Physiol. 1998;275(5 Pt 2):H1513–H1519.
26. Tabata T, Grimm RA, Greenberg NL, Agler DA, Mowrey KA, Wallick DW, Zhang Y, Zhuang S, Mazgalev TN, Thomas JD. Assessment of LV systolic function in atrial fibrillation using an index of preceding cardiac cycles. Am J Physiol Heart Circ Physiol. 2001;281:H573–H580.
27. Hamlet SM, Wehner GJ, Suever JD, Powell D, Haggerty CM, Jing L, Zhong X, Epstein FH, Fornwalt BK. Effect of variable breath-hold posi-tions during cardiac magnetic resonance on measures of left ventricular mechanics. J Cardiovasc Magn Reson. 2014;16:P78–P78.
28. Hansen MS, Sørensen TS, Arai AE, Kellman P. Retrospective reconstruc-tion of high temporal resolution cine images from real-time MRI using iterative motion correction. Magn Reson Med. 2012;68:741–750. doi: 10.1002/mrm.23284.
29. Feng L, Grimm R, Block KT, Chandarana H, Kim S, Xu J, Axel L, Sodickson DK, Otazo R. Golden-angle radial sparse parallel MRI: com-bination of compressed sensing, parallel imaging, and golden-angle radial sampling for fast and flexible dynamic volumetric MRI. Magn Reson Med. 2014;72:707–717. doi: 10.1002/mrm.24980.
30. Otazo R, Candès E, Sodickson DK. Low-rank and sparse matrix decom-position for accelerated DCE-MRI with background and contrast separa-tion. ISMRM. 2012;218:4248.
31. Lustig M, Donoho D, Pauly JM. Sparse MRI: the application of com-pressed sensing for rapid MR imaging. Magn Reson Med. 2007;58:1182–1195. doi: 10.1002/mrm.21391.
by guest on July 10, 2018http://circep.ahajournals.org/
Dow
nloaded from

Marchlinski, Walter R.T. Witschey and Yuchi HanGorman III, Robert C. Gorman, Paul Yushkevich, Erica S. Zado, Gregory E. Supple, Francis E. Francisco Contijoch, Kelly Rogers, Hannah Rears, Mohammed Shahid, Peter Kellman, Joseph
Reveals Variable HemodynamicsQuantification of Left Ventricular Function With Premature Ventricular Complexes
Print ISSN: 1941-3149. Online ISSN: 1941-3084 Copyright © 2016 American Heart Association, Inc. All rights reserved.
Avenue, Dallas, TX 75231is published by the American Heart Association, 7272 GreenvilleCirculation: Arrhythmia and Electrophysiology
doi: 10.1161/CIRCEP.115.0035202016;9:Circ Arrhythm Electrophysiol.
http://circep.ahajournals.org/content/9/4/e003520World Wide Web at:
The online version of this article, along with updated information and services, is located on the
http://circep.ahajournals.org//subscriptions/
is online at: Circulation: Arrhythmia and Electrophysiology Information about subscribing to Subscriptions:
http://www.lww.com/reprints Information about reprints can be found online at: Reprints:
document. Answer
Permissions and Rights Question andunder Services. Further information about this process is available in thepermission is being requested is located, click Request Permissions in the middle column of the Web pageClearance Center, not the Editorial Office. Once the online version of the published article for which
can be obtained via RightsLink, a service of the CopyrightCirculation: Arrhythmia and Electrophysiologyin Requests for permissions to reproduce figures, tables, or portions of articles originally publishedPermissions:
by guest on July 10, 2018http://circep.ahajournals.org/
Dow
nloaded from