quant 2019
TRANSCRIPT
Q U A N T A N N U A L R E P O R T 2 0 1 9
1
Q U A N T A N N U A L R E P O R T
2 0 1 9
Q U A N T A N N U A L R E P O R T 2 0 1 9
2
Q U A N T A N N U A L R E P O R T
2 0 1 9
TABLE OF CONTENTS
03
04
07
09
14
16
17
20
25
27
29
34
38
71
CEO’s Letter
Introduction to Quant
Strategy to create value
Market & Service Offering
Productivity & Digitalization
Safety
Sustainable Quant
Segments
Corporate Governance Report
Management Report
Group financial statements
Parent Company financial statements
Notes
Auditor’s report
Q U A N T A N N U A L R E P O R T 2 0 1 9
3
Q U A N T A N N U A L R E P O R T
2 0 1 9
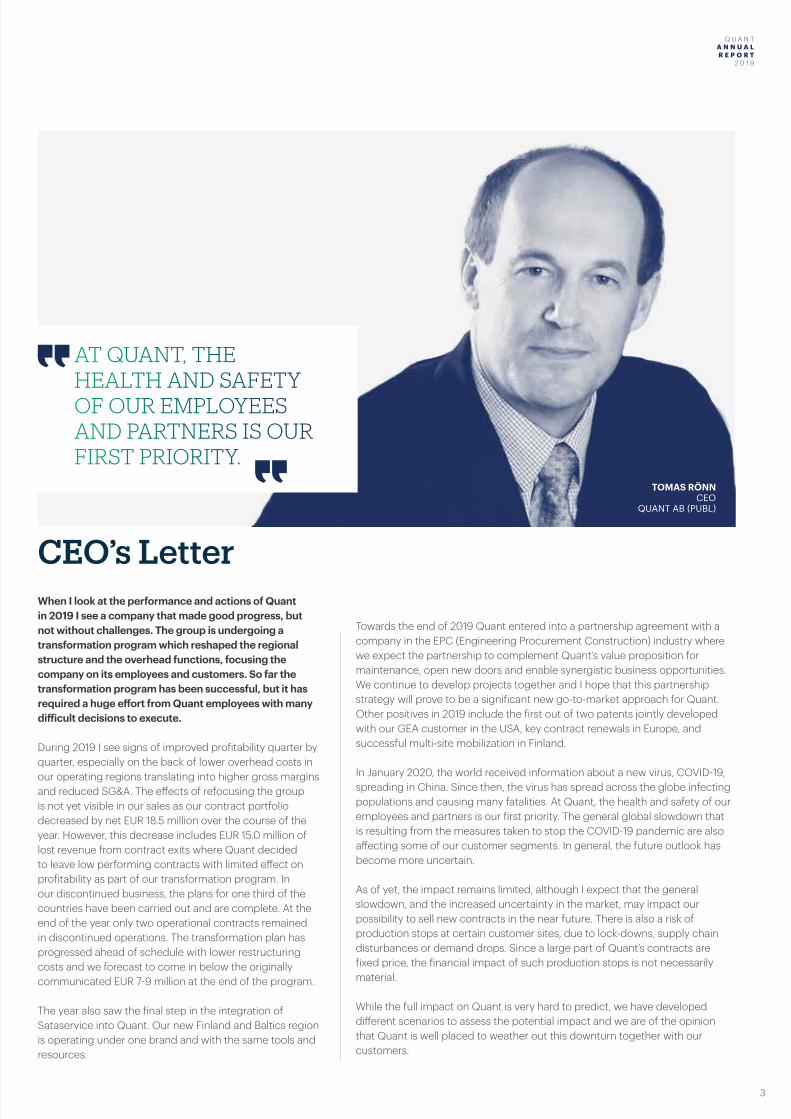
CEO’s LetterWhen I look at the performance and actions of Quant in 2019 I see a company that made good progress, but not without challenges. The group is undergoing a transformation program which reshaped the regional structure and the overhead functions, focusing the company on its employees and customers. So far the transformation program has been successful, but it has required a huge effort from Quant employees with many difficult decisions to execute.
During 2019 I see signs of improved profitability quarter by quarter, especially on the back of lower overhead costs in our operating regions translating into higher gross margins and reduced SG&A. The effects of refocusing the group is not yet visible in our sales as our contract portfolio decreased by net EUR 18.5 million over the course of the year. However, this decrease includes EUR 15.0 million of lost revenue from contract exits where Quant decided to leave low performing contracts with limited effect on profitability as part of our transformation program. In our discontinued business, the plans for one third of the countries have been carried out and are complete. At the end of the year only two operational contracts remained in discontinued operations. The transformation plan has progressed ahead of schedule with lower restructuring costs and we forecast to come in below the originally communicated EUR 7-9 million at the end of the program. The year also saw the final step in the integration of Sataservice into Quant. Our new Finland and Baltics region is operating under one brand and with the same tools and resources.
TOMAS RÖNNCEO
QUANT AB (PUBL)
Towards the end of 2019 Quant entered into a partnership agreement with a company in the EPC (Engineering Procurement Construction) industry where we expect the partnership to complement Quant’s value proposition for maintenance, open new doors and enable synergistic business opportunities. We continue to develop projects together and I hope that this partnership strategy will prove to be a significant new go-to-market approach for Quant. Other positives in 2019 include the first out of two patents jointly developed with our GEA customer in the USA, key contract renewals in Europe, and successful multi-site mobilization in Finland. In January 2020, the world received information about a new virus, COVID-19, spreading in China. Since then, the virus has spread across the globe infecting populations and causing many fatalities. At Quant, the health and safety of our employees and partners is our first priority. The general global slowdown that is resulting from the measures taken to stop the COVID-19 pandemic are also affecting some of our customer segments. In general, the future outlook has become more uncertain. As of yet, the impact remains limited, although I expect that the general slowdown, and the increased uncertainty in the market, may impact our possibility to sell new contracts in the near future. There is also a risk of production stops at certain customer sites, due to lock-downs, supply chain disturbances or demand drops. Since a large part of Quant’s contracts are fixed price, the financial impact of such production stops is not necessarily material. While the full impact on Quant is very hard to predict, we have developed different scenarios to assess the potential impact and we are of the opinion that Quant is well placed to weather out this downturn together with our customers.
AT QUANT, THE HEALTH AND SAFETY OF OUR EMPLOYEES AND PARTNERS IS OUR FIRST PRIORITY.
Q U A N T A N N U A L R E P O R T 2 0 1 9
4
Q U A N T A N N U A L R E P O R T
2 0 1 9
Introduction to Quant We realize the full potential of
maintenance
At Quant we deliver world-class industrial maintenance services to our customers, safely and professionally. We believe our customers deserve excellence in safety, service delivery, cost efficiency, plant performance and innovative solutions.
With advanced capabilities, people empowerment and collaboration, we help our customers to realize the full potential of industrial maintenance.
We believe the key to our success is motivated, trained, and empowered people. We believe that every day is an opportunity to improve.
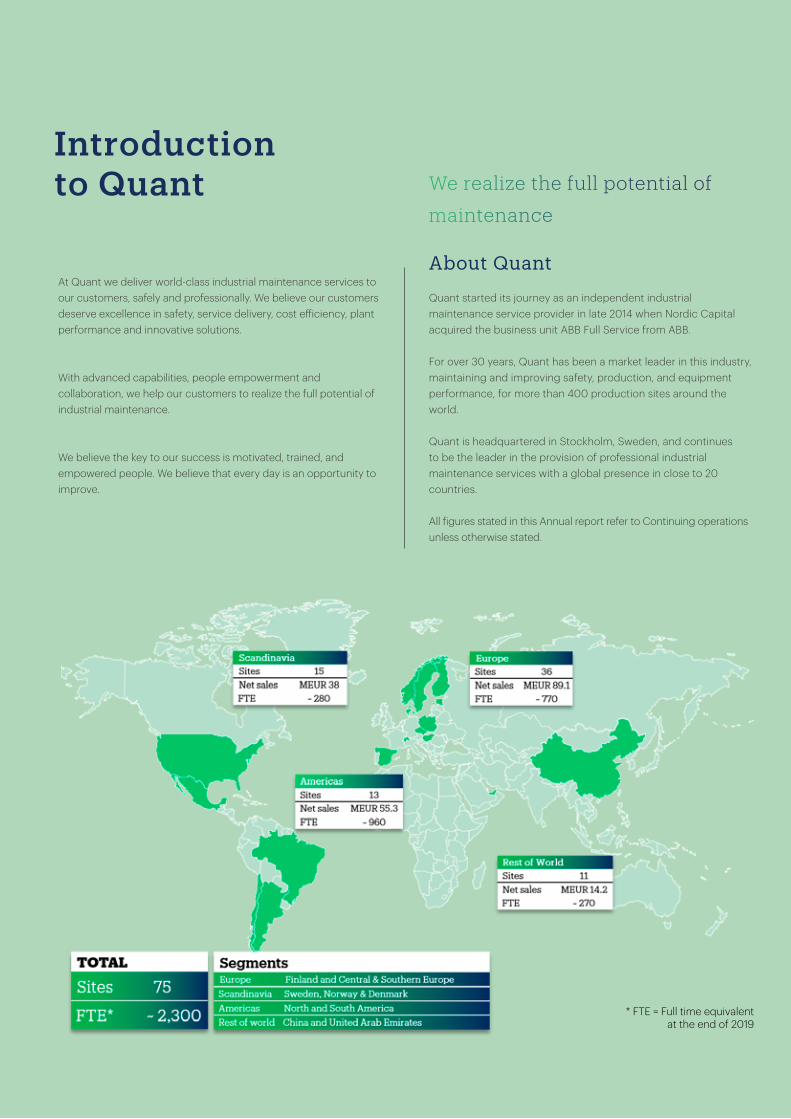
Quant started its journey as an independent industrial maintenance service provider in late 2014 when Nordic Capital acquired the business unit ABB Full Service from ABB.
For over 30 years, Quant has been a market leader in this industry, maintaining and improving safety, production, and equipment performance, for more than 400 production sites around the world.
Quant is headquartered in Stockholm, Sweden, and continues to be the leader in the provision of professional industrial maintenance services with a global presence in close to 20 countries.
All figures stated in this Annual report refer to Continuing operations unless otherwise stated.
About Quant
* FTE = Full time equivalent at the end of 2019
Q U A N T A N N U A L R E P O R T 2 0 1 9
5
Q U A N T A N N U A L R E P O R T
2 0 1 9
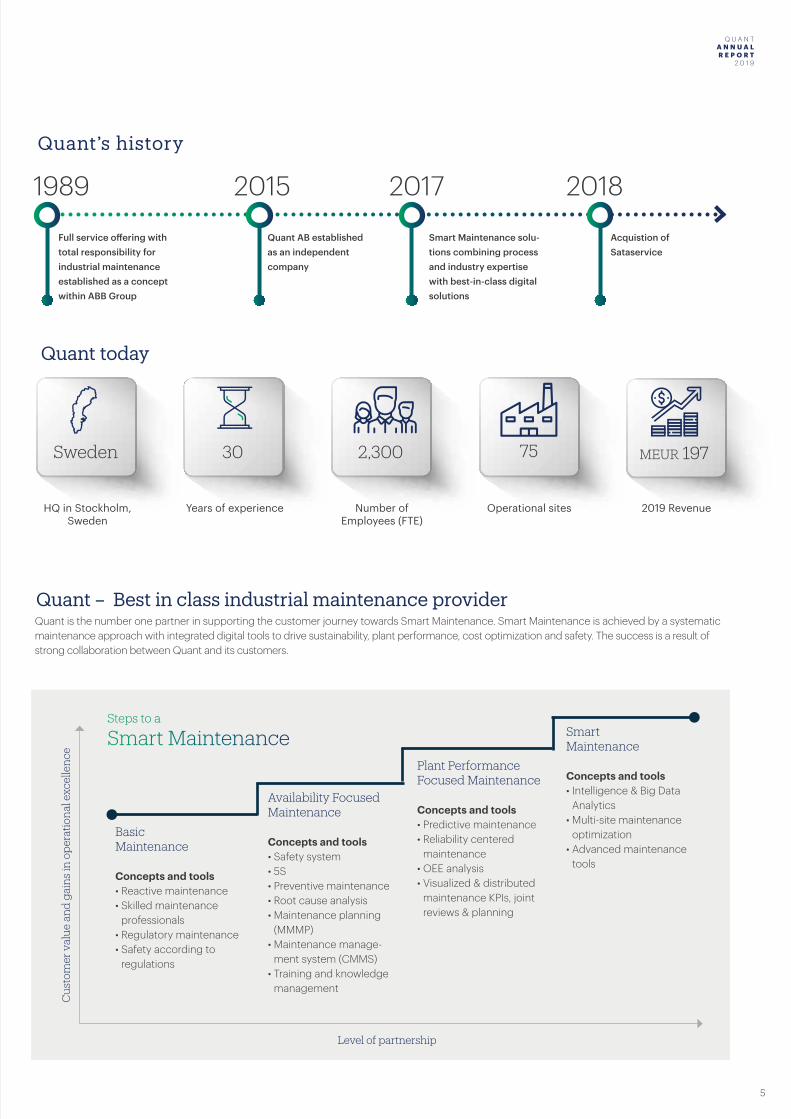
Steps to a
Smart Maintenance
Cus
tom
er v
alue
and
gai
ns
in o
per
atio
nal
exc
elle
nce
Level of partnership
Basic Maintenance Concepts and tools• Reactive maintenance• Skilled maintenance
professionals• Regulatory maintenance• Safety according to
regulations
Availability Focused Maintenance
Concepts and tools• Safety system • 5S• Preventive maintenance• Root cause analysis• Maintenance planning
(MMMP)• Maintenance manage-
ment system (CMMS)• Training and knowledge
management
Plant Performance Focused Maintenance
Concepts and tools• Predictive maintenance• Reliability centered
maintenance• OEE analysis• Visualized & distributed
maintenance KPIs, joint reviews & planning
Smart Maintenance
Concepts and tools• Intelligence & Big Data
Analytics• Multi-site maintenance
optimization• Advanced maintenance
tools
Quant – Best in class industrial maintenance providerQuant is the number one partner in supporting the customer journey towards Smart Maintenance. Smart Maintenance is achieved by a systematic maintenance approach with integrated digital tools to drive sustainability, plant performance, cost optimization and safety. The success is a result of strong collaboration between Quant and its customers.
1989 20172015
Full service offering with total responsibility for industrial maintenance established as a concept within ABB Group
Quant AB established as an independent company
Smart Maintenance solu-tions combining process and industry expertise with best-in-class digital solutions
Quant’s history
2018
Acquistion of Sataservice
Quant today
30 2,300 75Sweden
Years of experience Number of Employees (FTE)
Operational sitesHQ in Stockholm, Sweden
MEUR 197
2019 Revenue
Q U A N T A N N U A L R E P O R T 2 0 1 9
6
Q U A N T A N N U A L R E P O R T
2 0 1 9
Net sales in 2019 increased to EUR 196.6 million from EUR 177.8 million prior year due to the consolidation of Sataservice from August 2018. Or-ganic growth, excluding the Sataservice acquisition, currency impact and other non-recurring adjustments, decreased by 2.8%. Adjusted EBITDA for 2019 was EUR 14.0 million, up from EUR 11.4 million prior year due to better performance in all regions and savings due to the transformation program, partly offset with the loss of certain contracts.
Quant had 2,289 number of employees (FTE) in its continued operations at 31 December 2019, down from 2,737 employees prior year. In Decem-ber 2019 Tomas Rönn was appointed Quant’s CEO.
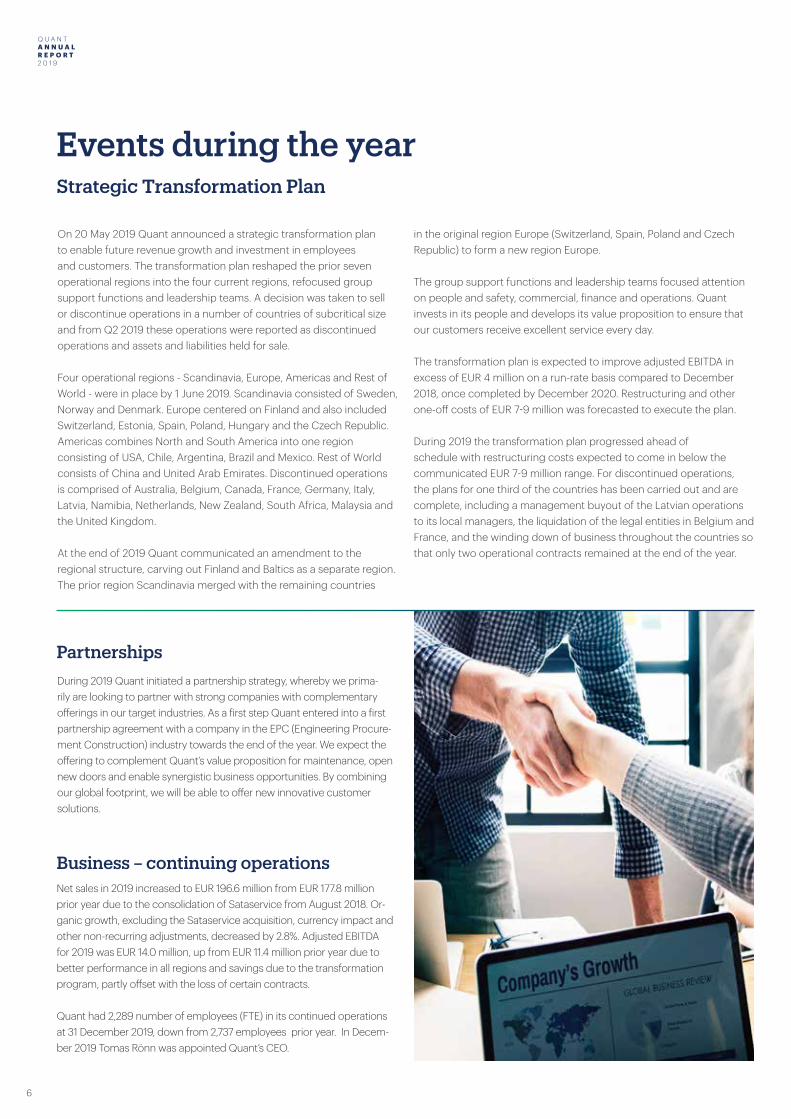
During 2019 Quant initiated a partnership strategy, whereby we prima-rily are looking to partner with strong companies with complementary offerings in our target industries. As a first step Quant entered into a first partnership agreement with a company in the EPC (Engineering Procure-ment Construction) industry towards the end of the year. We expect the offering to complement Quant’s value proposition for maintenance, open new doors and enable synergistic business opportunities. By combining our global footprint, we will be able to offer new innovative customer solutions.
Strategic Transformation Plan
Business – continuing operations
Partnerships
Events during the year
On 20 May 2019 Quant announced a strategic transformation plan to enable future revenue growth and investment in employees and customers. The transformation plan reshaped the prior seven operational regions into the four current regions, refocused group support functions and leadership teams. A decision was taken to sell or discontinue operations in a number of countries of subcritical size and from Q2 2019 these operations were reported as discontinued operations and assets and liabilities held for sale. Four operational regions - Scandinavia, Europe, Americas and Rest of World - were in place by 1 June 2019. Scandinavia consisted of Sweden, Norway and Denmark. Europe centered on Finland and also included Switzerland, Estonia, Spain, Poland, Hungary and the Czech Republic. Americas combines North and South America into one region consisting of USA, Chile, Argentina, Brazil and Mexico. Rest of World consists of China and United Arab Emirates. Discontinued operations is comprised of Australia, Belgium, Canada, France, Germany, Italy, Latvia, Namibia, Netherlands, New Zealand, South Africa, Malaysia and the United Kingdom.
At the end of 2019 Quant communicated an amendment to the regional structure, carving out Finland and Baltics as a separate region. The prior region Scandinavia merged with the remaining countries
in the original region Europe (Switzerland, Spain, Poland and Czech Republic) to form a new region Europe.
The group support functions and leadership teams focused attention on people and safety, commercial, finance and operations. Quant invests in its people and develops its value proposition to ensure that our customers receive excellent service every day.
The transformation plan is expected to improve adjusted EBITDA in excess of EUR 4 million on a run-rate basis compared to December 2018, once completed by December 2020. Restructuring and other one-off costs of EUR 7-9 million was forecasted to execute the plan.
During 2019 the transformation plan progressed ahead of schedule with restructuring costs expected to come in below the communicated EUR 7-9 million range. For discontinued operations, the plans for one third of the countries has been carried out and are complete, including a management buyout of the Latvian operations to its local managers, the liquidation of the legal entities in Belgium and France, and the winding down of business throughout the countries so that only two operational contracts remained at the end of the year.
Q U A N T A N N U A L R E P O R T 2 0 1 9
7
Q U A N T A N N U A L R E P O R T
2 0 1 9
For 30 years, Quant has been the leading maintenance partner for companies in a large variety of sectors. Maintenance in its core is all about improving production efficiency by maintaining and improving fixed assets, processes and tools. Good maintenance increases the value and expected lifetime of production equipment. An efficient maintenance strategy and execution improves our customers’ productivity due to less down time.
Quant’s business strategy enables the group’s vision to become the global leader in realizing the full potential of maintenance. The business strategy is built on Quant’s three core values.
Strategy to Create Value
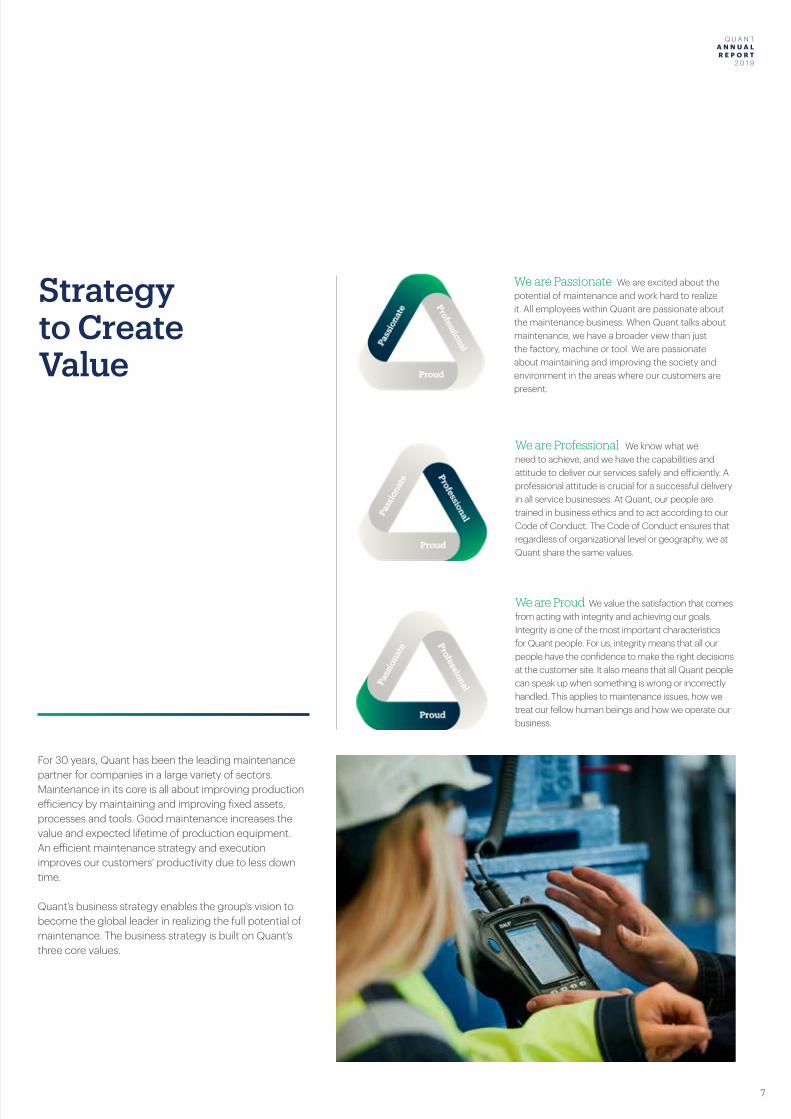
We are Passionate We are excited about the potential of maintenance and work hard to realize it. All employees within Quant are passionate about the maintenance business. When Quant talks about maintenance, we have a broader view than just the factory, machine or tool. We are passionate about maintaining and improving the society and environment in the areas where our customers are present.
We are Professional We know what we need to achieve, and we have the capabilities and attitude to deliver our services safely and efficiently. A professional attitude is crucial for a successful delivery in all service businesses. At Quant, our people are trained in business ethics and to act according to our Code of Conduct. The Code of Conduct ensures that regardless of organizational level or geography, we at Quant share the same values.
We are Proud We value the satisfaction that comes from acting with integrity and achieving our goals. Integrity is one of the most important characteristics for Quant people. For us, integrity means that all our people have the confidence to make the right decisions at the customer site. It also means that all Quant people can speak up when something is wrong or incorrectly handled. This applies to maintenance issues, how we treat our fellow human beings and how we operate our business.
Q U A N T A N N U A L R E P O R T 2 0 1 9
8
Q U A N T A N N U A L R E P O R T
2 0 1 9
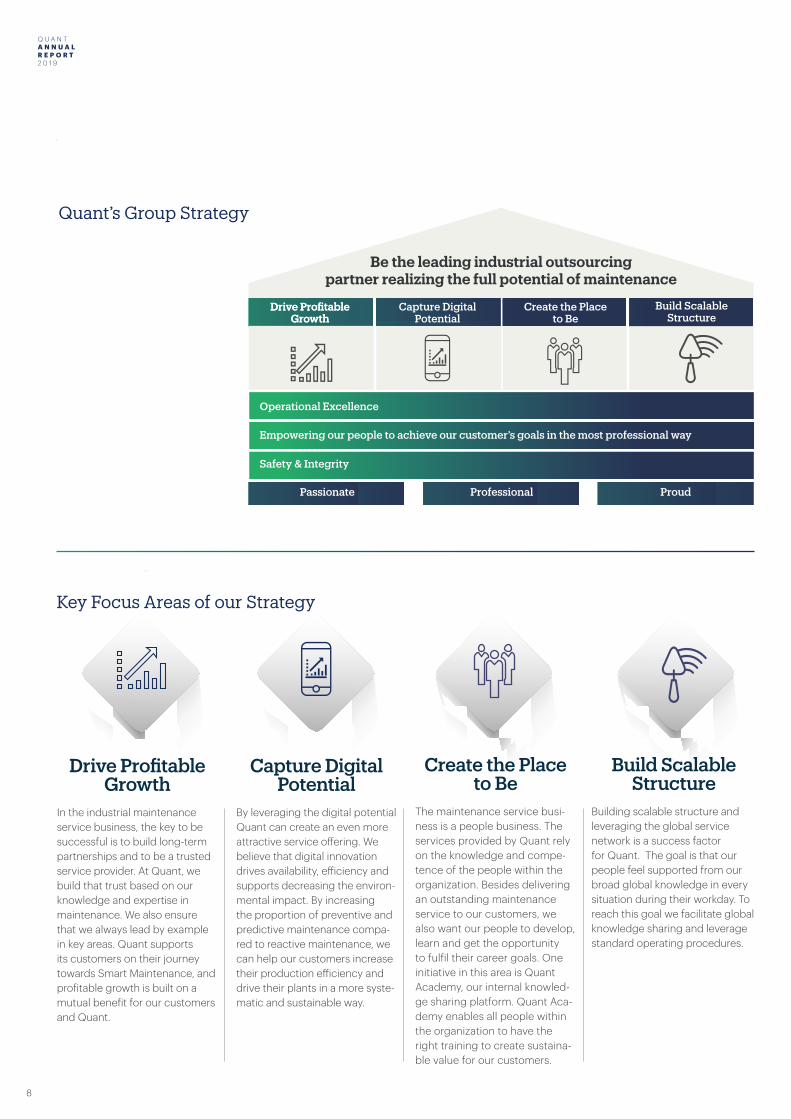
Key Focus Areas of our Strategy
Drive Profitable Growth
In the industrial maintenance service business, the key to be successful is to build long-term partnerships and to be a trusted service provider. At Quant, we build that trust based on our knowledge and expertise in maintenance. We also ensure that we always lead by example in key areas. Quant supports its customers on their journey towards Smart Maintenance, and profitable growth is built on a mutual benefit for our customers and Quant.
Build Scalable Structure
Building scalable structure and leveraging the global service network is a success factor for Quant. The goal is that our people feel supported from our broad global knowledge in every situation during their workday. To reach this goal we facilitate global knowledge sharing and leverage standard operating procedures.
Capture Digital Potential
By leveraging the digital potential Quant can create an even more attractive service offering. We believe that digital innovation drives availability, efficiency and supports decreasing the environ-mental impact. By increasing the proportion of preventive and predictive maintenance compa-red to reactive maintenance, we can help our customers increase their production efficiency and drive their plants in a more syste-matic and sustainable way.
Create the Place to Be
The maintenance service busi-ness is a people business. The services provided by Quant rely on the knowledge and compe-tence of the people within the organization. Besides delivering an outstanding maintenance service to our customers, we also want our people to develop, learn and get the opportunity to fulfil their career goals. One initiative in this area is Quant Academy, our internal knowled-ge sharing platform. Quant Aca-demy enables all people within the organization to have the right training to create sustaina-ble value for our customers.
Quant’s Group Strategy
Be the leading industrial outsourcing partner realizing the full potential of maintenance
Drive ProfitableGrowth
Capture Digital Potential
Create the Place to Be
Build ScalableStructure
Safety & Integrity
Operational Excellence
Empowering our people to achieve our customer’s goals in the most professional way
Passionate Professional Proud
Drive Profitable Growth
Q U A N T A N N U A L R E P O R T 2 0 1 9
9
Q U A N T A N N U A L R E P O R T
2 0 1 9
Quant’s primary service offering is to provide full-scale industrial main-tenance management services for which Quant assumes full responsi-bility for the entire management function of a customer’s maintenance activities for a dedicated plant. Full responsibility means that Quant is in charge of management, engineering, planning and execution of maintenance at our customers’ sites.
Since its inception, Quant has continuously developed its business model to become a premium maintenance collaboration partner for its customers working with them in a true partnership model. Quant’s value proposition ensures better performance for customers at an optimized cost structure by turning the customer’s maintenance function into a profit contributor as opposed to a cost center. This in turn generates true operational excellence at the contracted sites.
The business’ maintenance solutions allow customers to focus their attention, efforts, and investments on their core businesses such as product development, operations, and sales, rather than on mainte-nance. Quant’s service concept is designed to generate value in four areas; safety, cost optimization, productivity improvement, and energy efficiency.
Quant enters into long-term, performance-based agreements with its customers, in which Quant commits to maintaining the production equipment and improving safety, performance, reliability and energy efficiency of an entire plant on the basis of agreed and pre-determined performance objectives.
General introduction to Market & Service Offering
We see a trend that sophisticated services such as maintenance and asset management, reliability and energy efficiency improvements will be sourced from maintenance specialists in the same way as facility services have been sourced from external service providers for several years. With its clear focus on value-added maintenance services, Qu-ant is ideally positioned to benefit from the development in the global maintenance market.
Plant maintenance services is the relevant market segment for Quant which forms part of the overall industrial services market. The mainte-nance market segment is characterized by a high level of fragmenta-tion, with a large number of providers focusing on specific equipment types, industries or regions. The market is expected to undergo conso-lidation in the future and grow gradually while the customers’ buying patterns are developing.
Quant’s service offering falls into the value-added services market seg-ment. The provision of value-added services can be characterized by a higher degree of complexity. It requires more skillful and experienced personnel, as well as specialized processes, tools and methodologies.
The main players in the market are: i) System, equipment and component suppliers (OEMs) carrying out
maintenance for their own and third-party equipment
ii) Engineering, procurement and construction (EPC) companies pro-viding maintenance for their installed base and equipment installed by third-parties
iii) Local third-party service providers
Quant provides its services to all industries, with special focus on discrete manufacturing, pulp & paper, food & beverages, chemicals & petrochemicals, minerals & mining, and metals.
Market & Sales
Quant is a global leading industrial maintenance service provider. As a pioneer, developer and implementer of bundled maintenance service, Quant holds a leading market position in the global industrial maintenance mar-ket. The business currently manages 75 sites, generating EUR 196.6 million in net sales in 2019.
Quant’s strategy is to become the undisputed market leader and partner of choice for performance based, val-ue-adding industrial maintenance services, attracting multiple end-markets globally. Quant will be the global driver for realizing the full potential of maintenance.

Q U A N T A N N U A L R E P O R T 2 0 1 9
10
Q U A N T A N N U A L R E P O R T
2 0 1 9
Chemicals & Petrochemicals
DiscreteManufacturing
Food &Beverage
Metals Mining &Minerals
Oil &Gas
Pulp &Paper
Service Stations
Utilities
Quant serves a diversified global customer base, maintaining long-term relationships with its major customers. Quant operated at 75 sites at the end of the year, in close to 20 countri-es, serving more than 45 customers.
Q U A N T A N N U A L R E P O R T 2 0 1 9
11
Q U A N T A N N U A L R E P O R T
2 0 1 9
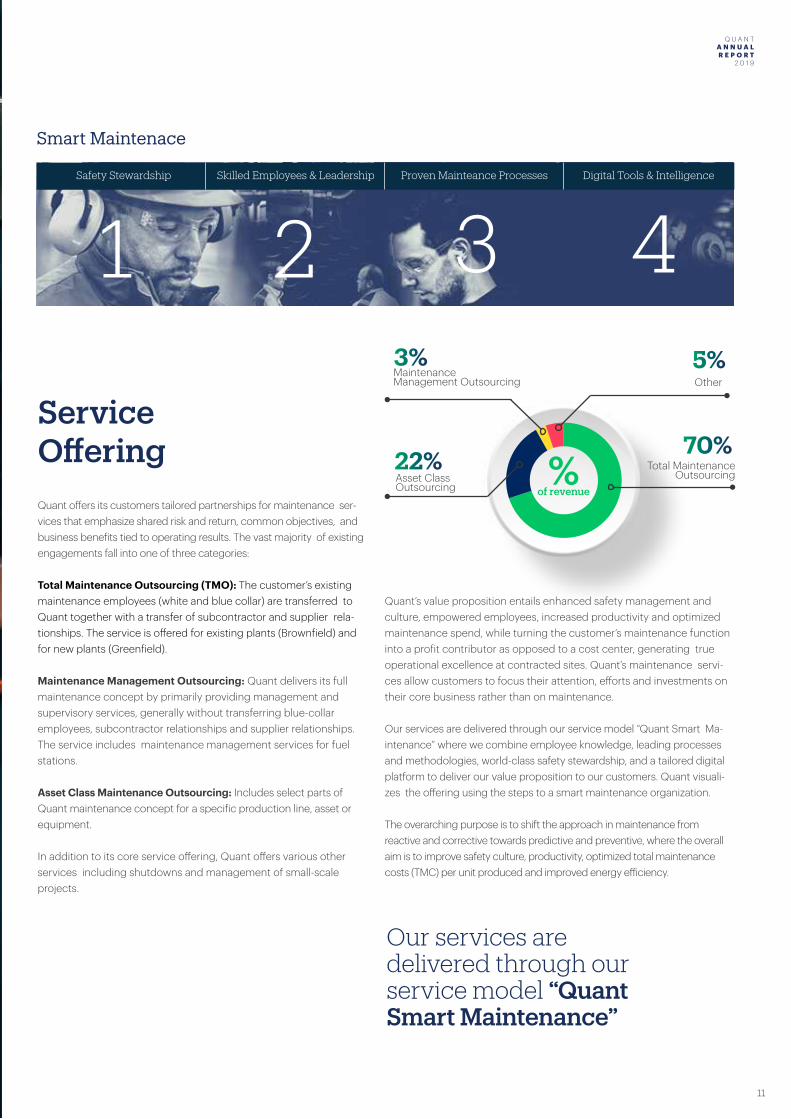
Quant offers its customers tailored partnerships for maintenance ser-vices that emphasize shared risk and return, common objectives, and business benefits tied to operating results. The vast majority of existing engagements fall into one of three categories:
Total Maintenance Outsourcing (TMO): The customer’s existing maintenance employees (white and blue collar) are transferred to Quant together with a transfer of subcontractor and supplier rela-tionships. The service is offered for existing plants (Brownfield) and for new plants (Greenfield).
Maintenance Management Outsourcing: Quant delivers its full maintenance concept by primarily providing management and supervisory services, generally without transferring blue-collar employees, subcontractor relationships and supplier relationships. The service includes maintenance management services for fuel stations.
Asset Class Maintenance Outsourcing: Includes select parts of Quant maintenance concept for a specific production line, asset or equipment.
In addition to its core service offering, Quant offers various other services including shutdowns and management of small-scale projects.
Smart Maintenace
1 2 3 4Safety Stewardship Skilled Employees & Leadership Proven Mainteance Processes Digital Tools & Intelligence
Our services are delivered through our service model “Quant Smart Maintenance”
ServiceOffering
3%
22%70%
5%MaintenanceManagement Outsourcing
Asset ClassOutsourcing
Total MaintenanceOutsourcing
Other
%of revenue
Quant’s value proposition entails enhanced safety management and culture, empowered employees, increased productivity and optimized maintenance spend, while turning the customer’s maintenance function into a profit contributor as opposed to a cost center, generating true operational excellence at contracted sites. Quant’s maintenance servi-ces allow customers to focus their attention, efforts and investments on their core business rather than on maintenance.
Our services are delivered through our service model “Quant Smart Ma-intenance” where we combine employee knowledge, leading processes and methodologies, world-class safety stewardship, and a tailored digital platform to deliver our value proposition to our customers. Quant visuali-zes the offering using the steps to a smart maintenance organization.
The overarching purpose is to shift the approach in maintenance from reactive and corrective towards predictive and preventive, where the overall aim is to improve safety culture, productivity, optimized total maintenance costs (TMC) per unit produced and improved energy efficiency.
Q U A N T A N N U A L R E P O R T 2 0 1 9
12
Q U A N T A N N U A L R E P O R T
2 0 1 9
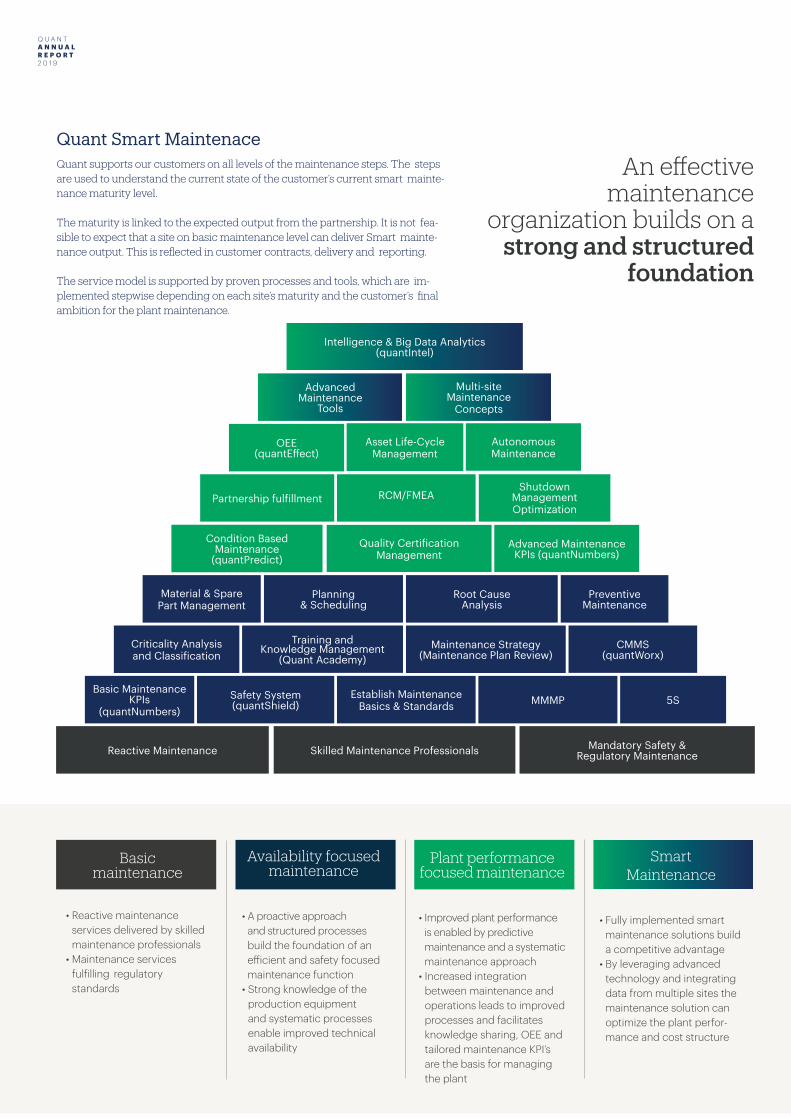
Smart Maintenance
• Fully implemented smart maintenance solutions build a competitive advantage
• By leveraging advanced technology and integrating data from multiple sites the maintenance solution can optimize the plant perfor-mance and cost structure
Basic maintenance
• Reactive maintenance services delivered by skilled maintenance professionals
• Maintenance services fulfilling regulatory standards
Availability focused maintenance
• A proactive approach and structured processes build the foundation of an efficient and safety focused maintenance function
• Strong knowledge of the production equipment and systematic processes enable improved technical availability
Plant performance focused maintenance
• Improved plant performance is enabled by predictive maintenance and a systematic maintenance approach
• Increased integration between maintenance and operations leads to improved processes and facilitates knowledge sharing, OEE and tailored maintenance KPI’s are the basis for managing the plant
Reactive Maintenance Skilled Maintenance Professionals Mandatory Safety & Regulatory Maintenance
Basic Maintenance KPIs
(quantNumbers)Safety System (quantShield)
Establish Maintenance Basics & Standards MMMP 5S
Criticality Analysis and Classification
Training and Knowledge Management
(Quant Academy)Maintenance Strategy
(Maintenance Plan Review)CMMS
(quantWorx)
Material & Spare Part Management
Planning & Scheduling
Root Cause Analysis
Preventive Maintenance
Quality Certification Management
Advanced Maintenance KPIs (quantNumbers)
Condition Based Maintenance
(quantPredict)
Partnership fulfillmentShutdown
Management Optimization
RCM/FMEA
OEE(quantEffect)
Autonomous Maintenance
Asset Life-Cycle Management
Multi-site Maintenance
Concepts
Advanced Maintenance
Tools
Intelligence & Big Data Analytics(quantIntel)
Quant supports our customers on all levels of the maintenance steps. The steps are used to understand the current state of the customer’s current smart mainte-nance maturity level.
The maturity is linked to the expected output from the partnership. It is not fea-sible to expect that a site on basic maintenance level can deliver Smart mainte-nance output. This is reflected in customer contracts, delivery and reporting.
The service model is supported by proven processes and tools, which are im-plemented stepwise depending on each site’s maturity and the customer’s final ambition for the plant maintenance.
An effective maintenance
organization builds on a strong and structured
foundation
Quant Smart Maintenace
Q U A N T A N N U A L R E P O R T 2 0 1 9
13
Q U A N T A N N U A L R E P O R T
2 0 1 9
Q U A N T A N N U A L R E P O R T 2 0 1 9
14
Q U A N T A N N U A L R E P O R T
2 0 1 9
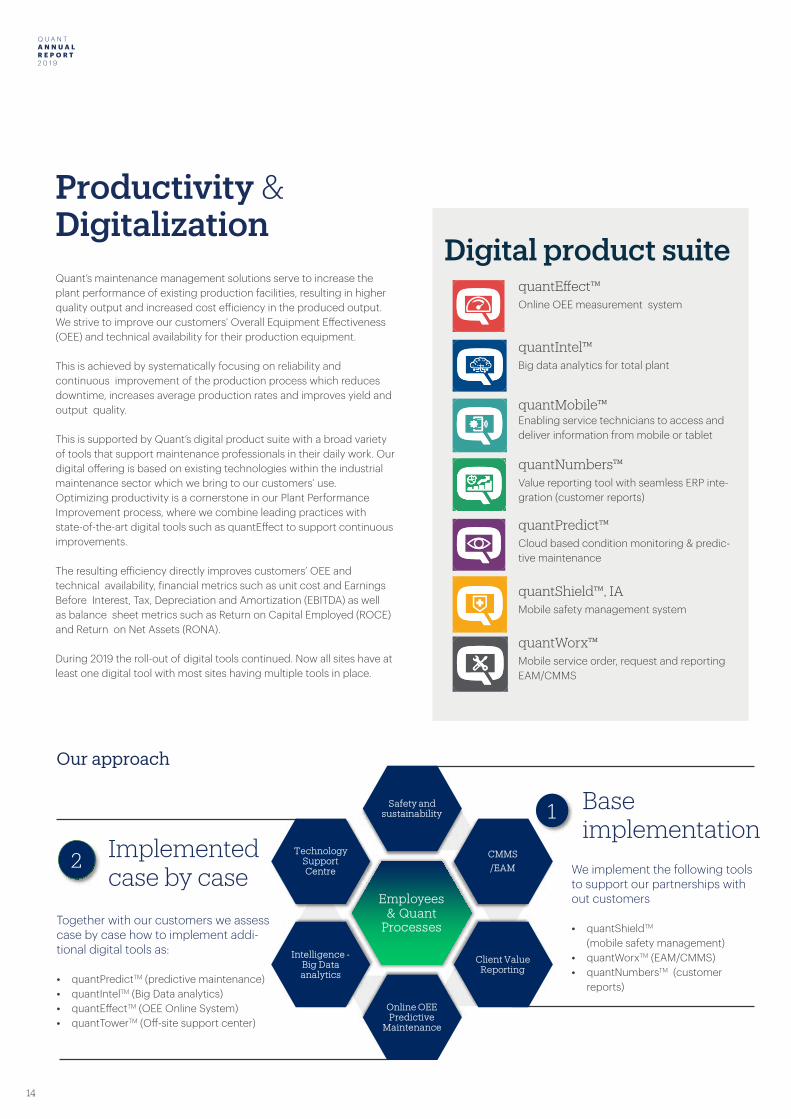
Quant’s maintenance management solutions serve to increase the plant performance of existing production facilities, resulting in higher quality output and increased cost efficiency in the produced output. We strive to improve our customers’ Overall Equipment Effectiveness (OEE) and technical availability for their production equipment.
This is achieved by systematically focusing on reliability and continuous improvement of the production process which reduces downtime, increases average production rates and improves yield and output quality.
This is supported by Quant’s digital product suite with a broad variety of tools that support maintenance professionals in their daily work. Our digital offering is based on existing technologies within the industrial maintenance sector which we bring to our customers’ use.Optimizing productivity is a cornerstone in our Plant Performance Improvement process, where we combine leading practices withstate-of-the-art digital tools such as quantEffect to support continuous improvements.
The resulting efficiency directly improves customers’ OEE and technical availability, financial metrics such as unit cost and Earnings Before Interest, Tax, Depreciation and Amortization (EBITDA) as well as balance sheet metrics such as Return on Capital Employed (ROCE) and Return on Net Assets (RONA).
During 2019 the roll-out of digital tools continued. Now all sites have at least one digital tool with most sites having multiple tools in place.
Productivity & Digitalization
quantEffect™ Online OEE measurement system
quantIntel™ Big data analytics for total plant
quantMobile™ Enabling service technicians to access and deliver information from mobile or tablet
quantNumbers™ Value reporting tool with seamless ERP inte-gration (customer reports)
quantPredict™ Cloud based condition monitoring & predic-tive maintenance
quantShield™, IA Mobile safety management system
quantWorx™ Mobile service order, request and reporting EAM/CMMS
Digital product suite
Our approach
1
2
Base implementation
Implemented case by case
Together with our customers we assess case by case how to implement addi-tional digital tools as:
• quantPredictTM (predictive maintenance)• quantIntelTM (Big Data analytics)• quantEffectTM (OEE Online System)• quantTowerTM (Off-site support center)
We implement the following tools to support our partnerships with out customers
• quantShieldTM (mobile safety management)
• quantWorxTM (EAM/CMMS)• quantNumbersTM (customer
reports)
Employees & Quant
Processes
Safety and sustainability
CMMS/EAM
Client Value Reporting
Online OEE Predictive
Maintenance
Intelligence -Big Data analytics
Technology Support Centre
Q U A N T A N N U A L R E P O R T 2 0 1 9
15
Q U A N T A N N U A L R E P O R T
2 0 1 9
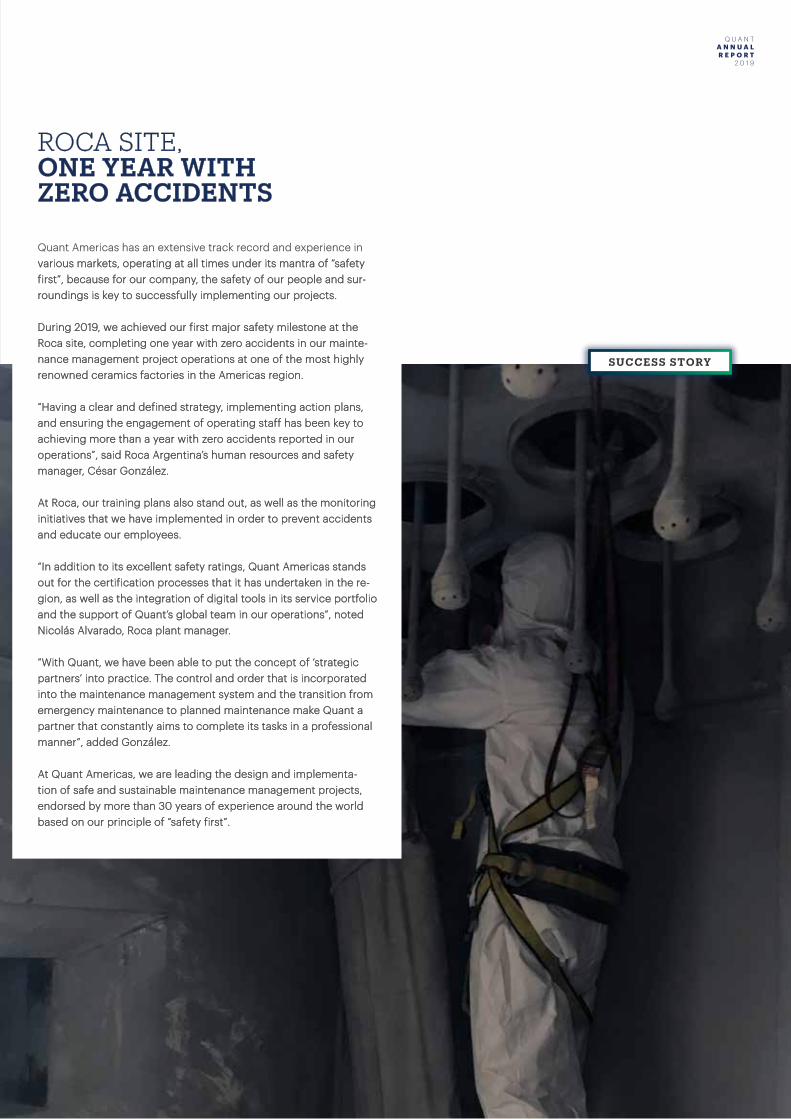
ROCA SITE, ROCA SITE, ONE YEAR WITH ONE YEAR WITH ZERO ACCIDENTSZERO ACCIDENTS
Quant Americas has an extensive track record and experience in Quant Americas has an extensive track record and experience in various markets, operating at all times under its mantra of “safety various markets, operating at all times under its mantra of “safety first”, because for our company, the safety of our people and sur-first”, because for our company, the safety of our people and sur-roundings is key to successfully implementing our projects.roundings is key to successfully implementing our projects.
During 2019, we achieved our first major safety milestone at the During 2019, we achieved our first major safety milestone at the Roca site, completing one year with zero accidents in our mainte-Roca site, completing one year with zero accidents in our mainte-nance management project operations at one of the most highly nance management project operations at one of the most highly renowned ceramics factories in the Americas region.renowned ceramics factories in the Americas region.
“Having a clear and defined strategy, implementing action plans, “Having a clear and defined strategy, implementing action plans, and ensuring the engagement of operating staff has been key to and ensuring the engagement of operating staff has been key to achieving more than a year with zero accidents reported in our achieving more than a year with zero accidents reported in our operations”, said Roca Argentina’s human resources and safety operations”, said Roca Argentina’s human resources and safety manager, César González.manager, César González.
At Roca, our training plans also stand out, as well as the monitoring At Roca, our training plans also stand out, as well as the monitoring initiatives that we have implemented in order to prevent accidents initiatives that we have implemented in order to prevent accidents and educate our employees. and educate our employees.
“In addition to its excellent safety ratings, Quant Americas stands “In addition to its excellent safety ratings, Quant Americas stands out for the certification processes that it has undertaken in the re-out for the certification processes that it has undertaken in the re-gion, as well as the integration of digital tools in its service portfolio gion, as well as the integration of digital tools in its service portfolio and the support of Quant’s global team in our operations”, noted and the support of Quant’s global team in our operations”, noted Nicolás Alvarado, Roca plant manager. Nicolás Alvarado, Roca plant manager.
“With Quant, we have been able to put the concept of ‘strategic “With Quant, we have been able to put the concept of ‘strategic partners’ into practice. The control and order that is incorporated partners’ into practice. The control and order that is incorporated into the maintenance management system and the transition from into the maintenance management system and the transition from emergency maintenance to planned maintenance make Quant a emergency maintenance to planned maintenance make Quant a partner that constantly aims to complete its tasks in a professional partner that constantly aims to complete its tasks in a professional manner”, added González.manner”, added González.
At Quant Americas, we are leading the design and implementa-At Quant Americas, we are leading the design and implementa-tion of safe and sustainable maintenance management projects, tion of safe and sustainable maintenance management projects, endorsed by more than 30 years of experience around the world endorsed by more than 30 years of experience around the world based on our principle of “safety first”.based on our principle of “safety first”.
SUC C ESS STOR I ESSUC C ESS STORY
Q U A N T A N N U A L R E P O R T 2 0 1 9
16
Q U A N T A N N U A L R E P O R T
2 0 1 9
Safety – Our choice
Safety information for several years is now available in the system and several safety campaigns have been triggered based on com-mon events and/or observed hazards/risks.Reports from quantShield are used in customer, management, and shop floor meetings to share and learn. Quant safety KPIs are continuously measured, and trends are turned into improvement programs and initiatives.
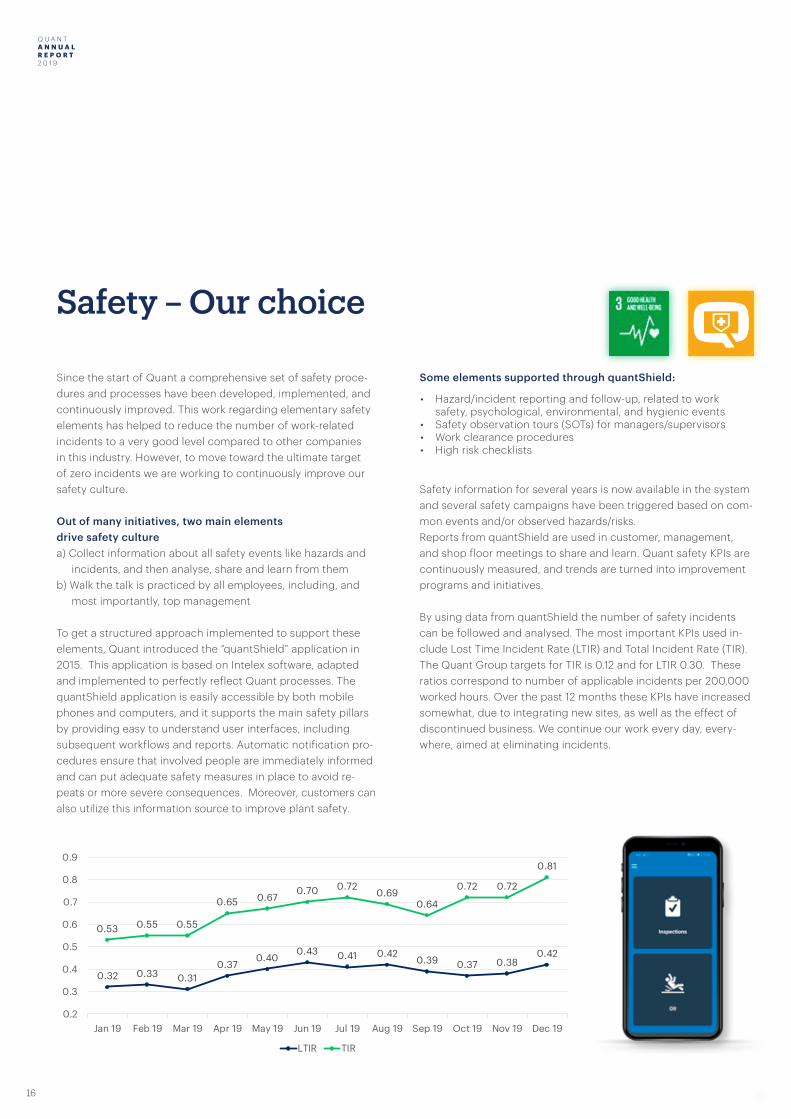
By using data from quantShield the number of safety incidents can be followed and analysed. The most important KPIs used in-clude Lost Time Incident Rate (LTIR) and Total Incident Rate (TIR). The Quant Group targets for TIR is 0.12 and for LTIR 0.30. These ratios correspond to number of applicable incidents per 200,000 worked hours. Over the past 12 months these KPIs have increased somewhat, due to integrating new sites, as well as the effect of discontinued business. We continue our work every day, every-where, aimed at eliminating incidents.
Since the start of Quant a comprehensive set of safety proce-dures and processes have been developed, implemented, and continuously improved. This work regarding elementary safety elements has helped to reduce the number of work-related incidents to a very good level compared to other companies in this industry. However, to move toward the ultimate target of zero incidents we are working to continuously improve our safety culture.
Out of many initiatives, two main elements drive safety culturea) Collect information about all safety events like hazards and
incidents, and then analyse, share and learn from them b) Walk the talk is practiced by all employees, including, and
most importantly, top management
To get a structured approach implemented to support these elements, Quant introduced the ”quantShield” application in 2015. This application is based on Intelex software, adapted and implemented to perfectly reflect Quant processes. The quantShield application is easily accessible by both mobile phones and computers, and it supports the main safety pillars by providing easy to understand user interfaces, including subsequent workflows and reports. Automatic notification pro-cedures ensure that involved people are immediately informed and can put adequate safety measures in place to avoid re-peats or more severe consequences. Moreover, customers can also utilize this information source to improve plant safety.
• Hazard/incident reporting and follow-up, related to work safety, psychological, environmental, and hygienic events
• Safety observation tours (SOTs) for managers/supervisors• Work clearance procedures• High risk checklists
Some elements supported through quantShield:
0.32 0.33 0.310.37
0.400.43 0.41 0.42
0.39 0.37 0.380.42
0.53 0.55 0.55
0.65 0.670.70 0.72
0.690.64
0.72 0.72
0.81
0.2
0.3
0.4
0.5
0.6
0.7
0.8
0.9
Jan 19 Feb 19 Mar 19 Apr 19 May 19 Jun 19 Jul 19 Aug 19 Sep 19 Oct 19 Nov 19 Dec 19
LTIR TIR
Q U A N T A N N U A L R E P O R T 2 0 1 9
17
Q U A N T A N N U A L R E P O R T
2 0 1 9
Sustainable QuantSustainability is an essential part of Quant’s service offering. This means that sustainability is considered in processes, meth-ods and policies. It is the way to conduct business.
Our approach combines years of experience, skills and knowledge of our employees with proven maintenance processes and digital tools for our customers’ benefit. Each plant and factory is unique, but with a consistent implementation of maintenance processes, methods and tools, it is possible to continuously improve opera-tional, safety, environmental and financial performance.We have close partnerships with our customers, some spanning over 20 years. These partnerships enable us to work closely together and to make long-term plans for plant improvement and sustainable solutions. This includes building a safety culture for the site for all stakeholders and improving production efficiency through preventive maintenance and systematic elimination of breakdowns.
People are at the core of our businessOur business relies on our professional employees. We actively work to maintain and develop our employees’ skills and know-how. Our learning platform Quant Academy offers a range of training sessions and programs for the employees, while graduates and trainees bring us fresh thoughts and knowledge from their schools and universities. In each of our countries we have built relation-ships with local educators to ensure compliance to local require-ments and to update our staff with the latest industry standards. We maintain a flat organizational structure and encourage dialogue and participation of employees in improvement of our processes and systems. This ensures that we find sustainable solutions for our customers’ plants.
Reliability as a site core process contributes to sustainabilityUnderstanding how the plant operates is key to a reliability main-tenance approach. To increase the reliability of the plant’s opera-tions, we review everything from maintenance history to current maintenance operations. Based on the review a maintenance plan is developed to support the customer journey towards improved technical availability, productivity and energy efficiency. A struc-tured reliability maintenance approach helps our customers extend the lifetime of their plants and equipment. The planned mainte-nance contributes to cost and resource efficiency by implement-ing efficient ways of managing daily maintenance tasks, optimizing inventory management and support in planning operations for
longer uptime. The reliability maintenance approach contributes with a holistic view of the factory, enabling earlier observations of leaks and optimized lubrication routines that result in reduced environmental impact.
Plant performance improvement through digitalizationQuant’s maintenance solutions improve plant performance of existing production facilities, resulting in higher quality output and increased cost efficiency in the produced output. We strive to improve our customers Overall Equipment Efficiency (OEE) and Technical Availability for their production equipment. This is achieved by systematically focusing on reliability and con-tinuous improvement of the production process, which reduces downtime, increases average production rates and improves yield and output quality. This is supported by Quant’s digital product suite with a broad variety of tools that support the maintenance professionals in their daily work. Our digital offering is based on ex-isting technologies within the industrial maintenance sector which we bring to our customers’ use.Optimizing productivity is a cornerstone in our Plant Performance Improvement process, where we combine leading practices with state-of-the-art digital tools such as quantEffect to support con-tinuous improvements. The resulting efficiency directly impacts customers’ OEE and Technical Availability, financial metrics such as Unit cost and EBITDA (Earnings Before Interest, Tax, Depreciation and Amortization) as well as balance sheet metrics such as Return on Capital Employed (ROCE) and Return on Net Assets (RONA).
Quality operations through standardized approachSeveral of Quant’s subsidiaries hold ISO certifications. The entire Quant group follows policies such as our Code of Conduct, Occu-pational Health and Safety policy, Environmental policy and Quality policy. In addition to these we maintain process descriptions and use methods of internal audit as one of our ways to ensure we have an efficient and sustainable business. Besides providing inputs for improvement at sites, the internal audit and assessment process contributes to the overall development of our operational model, organization and strategy.
Q U A N T A N N U A L R E P O R T 2 0 1 9
18
Q U A N T A N N U A L R E P O R T
2 0 1 9
The Sustainability Development Goals (STGs) are a collection of seventeen global goals set by the United Nations General Assembly.
They are considered the point of departure to achieve a better and more sustainable future for the world’s inhabitants.
The STGs are meant to address the global challenges that are putting our world at risk. These challenges are related to poverty, hunger, gender equality, good health and well-being, reduced in-equalities, decent work, economic growth and responsible production, and consumption.
Safety and Environmental Excellence High Business Ethics Quality Culture
Sustainable Quant (Safety, Integrity, Quality, Enviroment)
How a company operates in relation to ethical, social, environmental and economic aspects is a very important matter. At Quant, sustainability is considered in all that we do: how we design our services, how we engage suppliers, how we assess risks and opportunities and how we interact in the communities where we operate. At Quant, we have defined a process which corresponds to some of the key areas of our sustainability approach: Occupational Health and Safety, Envi-ronment, Integrity and Business Ethics, and Quality. Our process is aligned with UN Sustainable Development Goals and the UN Principles.
Q U A N T A N N U A L R E P O R T 2 0 1 9
19
Q U A N T A N N U A L R E P O R T
2 0 1 9
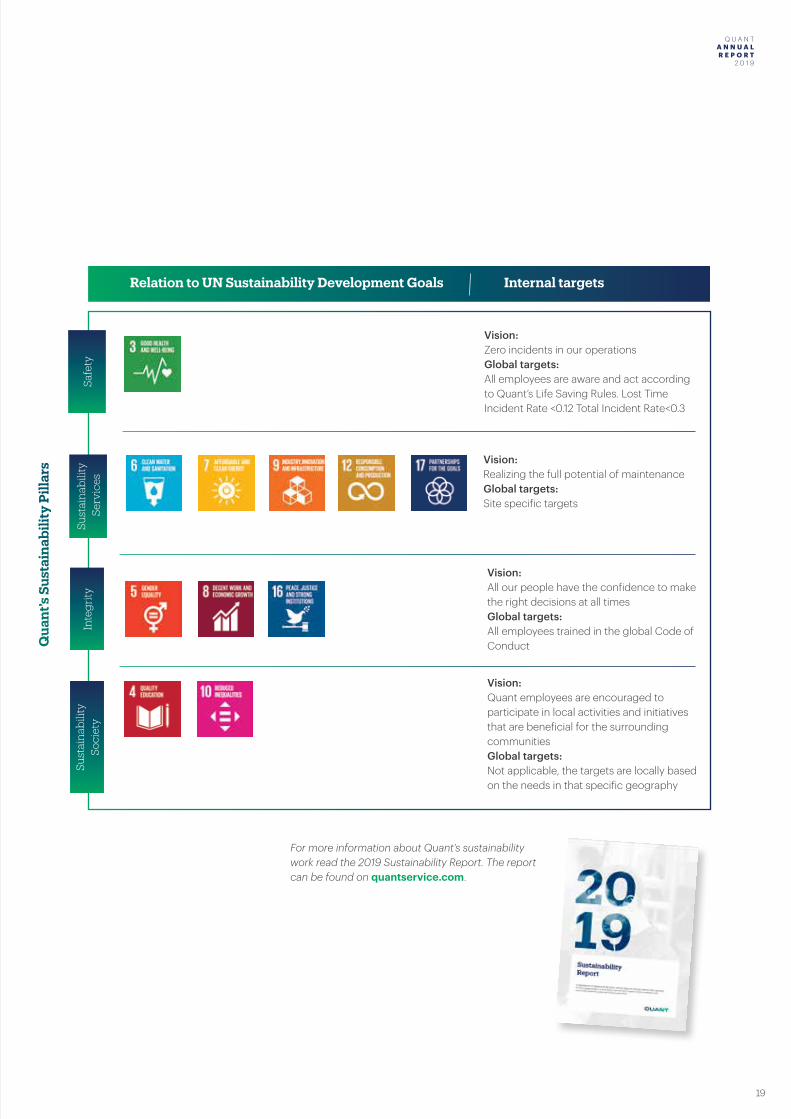
Internal targetsRelation to UN Sustainability Development Goals
Qua
nt’s
Sus
tain
abili
ty P
illar
s
Vision: Zero incidents in our operationsGlobal targets:All employees are aware and act according to Quant’s Life Saving Rules. Lost Time Incident Rate <0.12 Total Incident Rate<0.3
Vision:Realizing the full potential of maintenanceGlobal targets:Site specific targets
Vision:All our people have the confidence to make the right decisions at all timesGlobal targets:All employees trained in the global Code of Conduct
Vision:Quant employees are encouraged to participate in local activities and initiatives that are beneficial for the surrounding communitiesGlobal targets:Not applicable, the targets are locally based on the needs in that specific geography
Inte
grity
Safe
tySu
stai
nab
ility
Ser
vice
sSu
stai
nab
ility
So
ciet
y
For more information about Quant’s sustainability work read the 2019 Sustainability Report. The report can be found on quantservice.com.
Q U A N T A N N U A L R E P O R T 2 0 1 9
20
Q U A N T A N N U A L R E P O R T
2 0 1 9
Segments
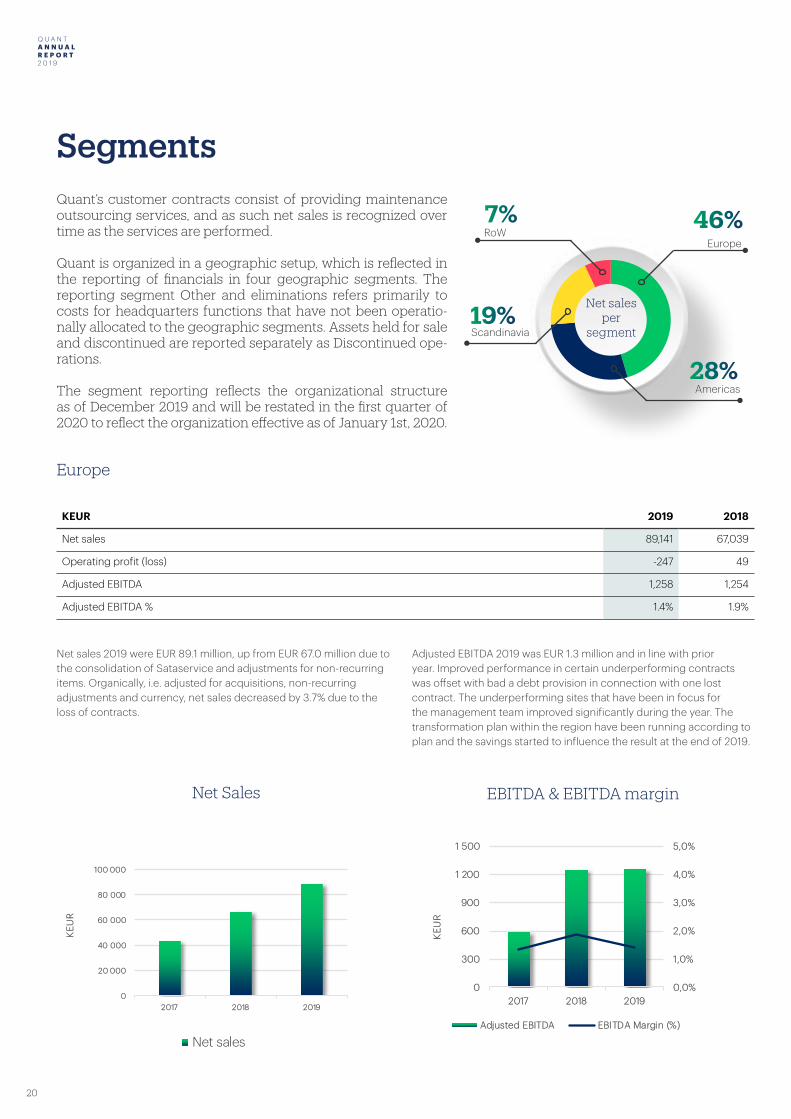
KEUR 2019 2018
Net sales 89,141 67,039
Operating profit (loss) -247 49
Adjusted EBITDA 1,258 1,254
Adjusted EBITDA % 1.4% 1.9%
Net sales 2019 were EUR 89.1 million, up from EUR 67.0 million due to the consolidation of Sataservice and adjustments for non-recurring items. Organically, i.e. adjusted for acquisitions, non-recurring adjustments and currency, net sales decreased by 3.7% due to the loss of contracts.
Adjusted EBITDA 2019 was EUR 1.3 million and in line with prior year. Improved performance in certain underperforming contracts was offset with bad a debt provision in connection with one lost contract. The underperforming sites that have been in focus for the management team improved significantly during the year. The transformation plan within the region have been running according to plan and the savings started to influence the result at the end of 2019.
Europe
Net Sales EBITDA & EBITDA margin
Net sales per
segment
Quant’s customer contracts consist of providing maintenance outsourcing services, and as such net sales is recognized over time as the services are performed.
Quant is organized in a geographic setup, which is reflected in the reporting of financials in four geographic segments. The reporting segment Other and eliminations refers primarily to costs for headquarters functions that have not been operatio-nally allocated to the geographic segments. Assets held for sale and discontinued are reported separately as Discontinued ope-rations.
The segment reporting reflects the organizational structure as of December 2019 and will be restated in the first quarter of 2020 to reflect the organization effective as of January 1st, 2020.
0
20 000
40 000
60 000
80 000
100 000
2017 2018 2019
KEU
R
Net sales
0,0%
1,0%
2,0%
3,0%
4,0%
5,0%
0
300
600
900
1 200
1 500
2017 2018 2019
KEU
R
Adjusted EBITDA EBITDA Margin (%)
7%
19%
28%
46%RoW
Scandinavia
Americas
Europe
Q U A N T A N N U A L R E P O R T 2 0 1 9
21
Q U A N T A N N U A L R E P O R T
2 0 1 9
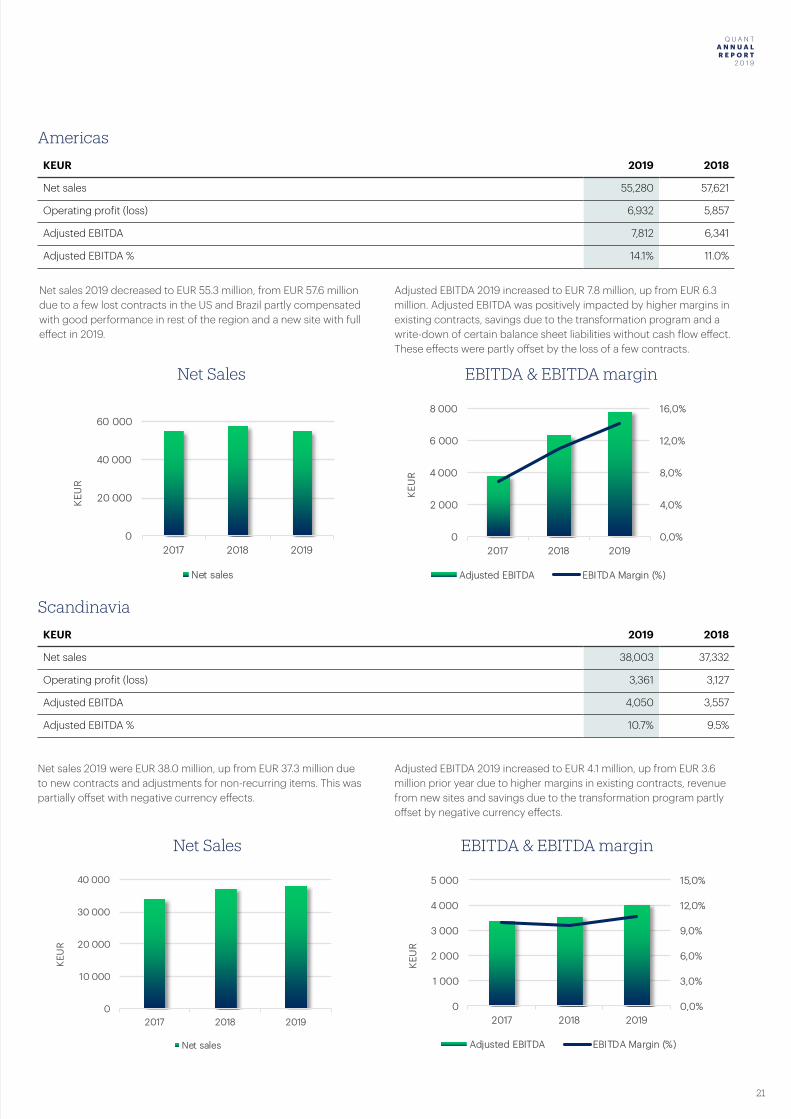
KEUR 2019 2018
Net sales 55,280 57,621
Operating profit (loss) 6,932 5,857
Adjusted EBITDA 7,812 6,341
Adjusted EBITDA % 14.1% 11.0%
Net Sales
Net Sales
EBITDA & EBITDA margin
EBITDA & EBITDA margin
Net sales 2019 decreased to EUR 55.3 million, from EUR 57.6 million due to a few lost contracts in the US and Brazil partly compensated with good performance in rest of the region and a new site with full effect in 2019.
Adjusted EBITDA 2019 increased to EUR 7.8 million, up from EUR 6.3 million. Adjusted EBITDA was positively impacted by higher margins in existing contracts, savings due to the transformation program and a write-down of certain balance sheet liabilities without cash flow effect. These effects were partly offset by the loss of a few contracts.
Net sales 2019 were EUR 38.0 million, up from EUR 37.3 million due to new contracts and adjustments for non-recurring items. This was partially offset with negative currency effects.
Adjusted EBITDA 2019 increased to EUR 4.1 million, up from EUR 3.6 million prior year due to higher margins in existing contracts, revenue from new sites and savings due to the transformation program partly offset by negative currency effects.
Americas
Scandinavia
KEUR 2019 2018
Net sales 38,003 37,332
Operating profit (loss) 3,361 3,127
Adjusted EBITDA 4,050 3,557
Adjusted EBITDA % 10.7% 9.5%
0
20 000
40 000
60 000
2017 2018 2019
KEU
R
Net sales
0,0%
4,0%
8,0%
12,0%
16,0%
0
2 000
4 000
6 000
8 000
2017 2018 2019
KEU
R
Adjusted EBITDA EBITDA Margin (%)
0
10 000
20 000
30 000
40 000
2017 2018 2019
KEU
R
Net sales
0,0%
3,0%
6,0%
9,0%
12,0%
15,0%
0
1 000
2 000
3 000
4 000
5 000
2017 2018 2019
KEU
R
Adjusted EBITDA EBITDA Margin (%)
Q U A N T A N N U A L R E P O R T 2 0 1 9
22
Q U A N T A N N U A L R E P O R T
2 0 1 9
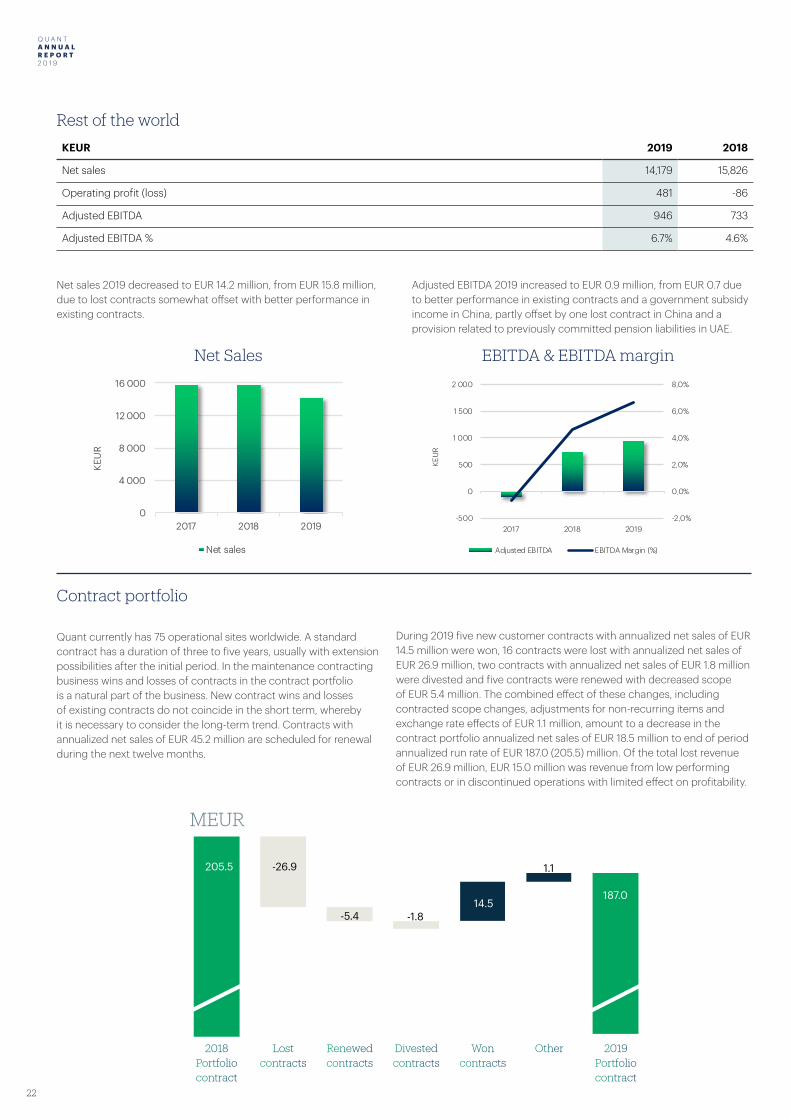
Net sales 2019 decreased to EUR 14.2 million, from EUR 15.8 million, due to lost contracts somewhat offset with better performance in existing contracts.
Adjusted EBITDA 2019 increased to EUR 0.9 million, from EUR 0.7 due to better performance in existing contracts and a government subsidy income in China, partly offset by one lost contract in China and a provision related to previously committed pension liabilities in UAE.
Quant currently has 75 operational sites worldwide. A standard contract has a duration of three to five years, usually with extension possibilities after the initial period. In the maintenance contracting business wins and losses of contracts in the contract portfolio is a natural part of the business. New contract wins and losses of existing contracts do not coincide in the short term, whereby it is necessary to consider the long-term trend. Contracts with annualized net sales of EUR 45.2 million are scheduled for renewal during the next twelve months.
Rest of the world
Contract portfolio
KEUR 2019 2018
Net sales 14,179 15,826
Operating profit (loss) 481 -86
Adjusted EBITDA 946 733
Adjusted EBITDA % 6.7% 4.6%
During 2019 five new customer contracts with annualized net sales of EUR 14.5 million were won, 16 contracts were lost with annualized net sales of EUR 26.9 million, two contracts with annualized net sales of EUR 1.8 million were divested and five contracts were renewed with decreased scope of EUR 5.4 million. The combined effect of these changes, including contracted scope changes, adjustments for non-recurring items and exchange rate effects of EUR 1.1 million, amount to a decrease in the contract portfolio annualized net sales of EUR 18.5 million to end of period annualized run rate of EUR 187.0 (205.5) million. Of the total lost revenue of EUR 26.9 million, EUR 15.0 million was revenue from low performing contracts or in discontinued operations with limited effect on profitability.
2018Portfolio contract
Lostcontracts
Renewed contracts
Woncontracts
Divested contracts
Other 2019Portfolio contract
205.5
14.5187.0
-26.9
-5.4 -1.8
1.1
MEUR
Net Sales EBITDA & EBITDA margin
0
4 000
8 000
12 000
16 000
2017 2018 2019
KEU
R
Net sales
-2,0%
0,0%
2,0%
4,0%
6,0%
8,0%
-500
0
500
1 000
1 500
2 000
2017 2018 2019
KEU
R
Adjusted EBITDA EBITDA Margin (%)
Q U A N T A N N U A L R E P O R T 2 0 1 9
23
Q U A N T A N N U A L R E P O R T
2 0 1 9
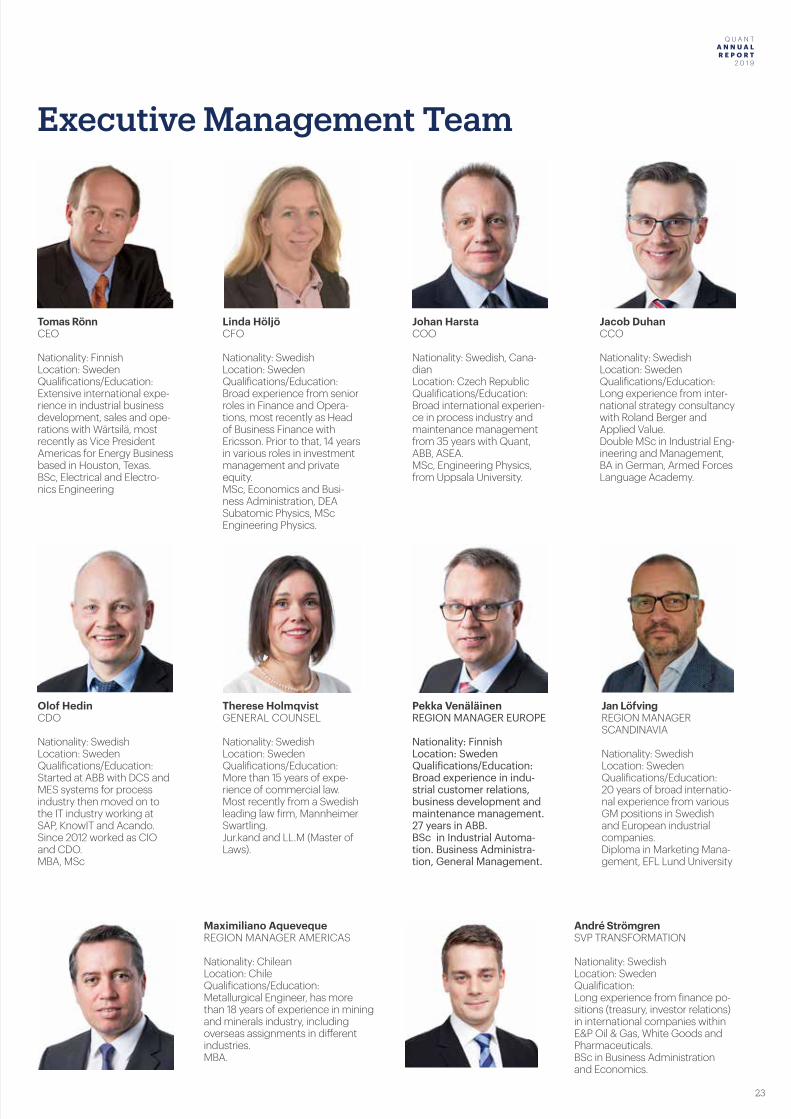
Tomas RönnCEO
Nationality: FinnishLocation: SwedenQualifications/Education:Extensive international expe-rience in industrial business development, sales and ope-rations with Wärtsilä, most recently as Vice President Americas for Energy Business based in Houston, Texas.BSc, Electrical and Electro-nics Engineering
Linda HöljöCFO
Nationality: SwedishLocation: SwedenQualifications/Education:Broad experience from senior roles in Finance and Opera-tions, most recently as Head of Business Finance with Ericsson. Prior to that, 14 years in various roles in investment management and private equity.MSc, Economics and Busi-ness Administration, DEA Subatomic Physics, MSc Engineering Physics.
Therese HolmqvistGENERAL COUNSEL
Nationality: SwedishLocation: SwedenQualifications/Education: More than 15 years of expe-rience of commercial law. Most recently from a Swedish leading law firm, Mannheimer Swartling.Jur.kand and LL.M (Master of Laws).
Johan HarstaCOO
Nationality: Swedish, Cana-dianLocation: Czech RepublicQualifications/Education:Broad international experien-ce in process industry and maintenance management from 35 years with Quant, ABB, ASEA.MSc, Engineering Physics, from Uppsala University.
André StrömgrenSVP TRANSFORMATION
Nationality: SwedishLocation: SwedenQualification: Long experience from finance po-sitions (treasury, investor relations) in international companies within E&P Oil & Gas, White Goods and Pharmaceuticals.BSc in Business Administration and Economics.
Jan LöfvingREGION MANAGER SCANDINAVIA
Nationality: SwedishLocation: SwedenQualifications/Education:20 years of broad internatio-nal experience from various GM positions in Swedish and European industrial companies.Diploma in Marketing Mana-gement, EFL Lund University
Jacob DuhanCCO
Nationality: SwedishLocation: SwedenQualifications/Education:Long experience from inter-national strategy consultancy with Roland Berger and Applied Value.Double MSc in Industrial Eng-ineering and Management, BA in German, Armed Forces Language Academy.
Olof HedinCDO
Nationality: SwedishLocation: SwedenQualifications/Education: Started at ABB with DCS and MES systems for process industry then moved on to the IT industry working at SAP, KnowIT and Acando. Since 2012 worked as CIO and CDO.MBA, MSc
Maximiliano AquevequeREGION MANAGER AMERICAS
Nationality: ChileanLocation: ChileQualifications/Education:Metallurgical Engineer, has more than 18 years of experience in mining and minerals industry, including overseas assignments in different industries.MBA.
Pekka VenäläinenREGION MANAGER EUROPE
Nationality: FinnishLocation: SwedenQualifications/Education:Broad experience in indu-strial customer relations, business development and maintenance management. 27 years in ABB.BSc in Industrial Automa-tion. Business Administra-tion, General Management.
Executive Management Team

Q U A N T A N N U A L R E P O R T 2 0 1 9
24
Q U A N T A N N U A L R E P O R T
2 0 1 9
The board of directors
Mikael NorinSwitzerland
Has been a member of the board of the Company since 2015 and is also the chairman of the board. He is currently the chief exe-cutive officer of Cavotec SA.
BSc in Business Administra-tion and Economics, Lund University.
Olof Faxander Sweden
Has been a member of the board of the Company since 2017.He currently serves as Vice Chairman Acino AG and board member Resman AS. MSc in Engineering, Swedish Royal Institute of Technology, B A Economics, Stockholm University.
Per Hallius Sweden
He currently serves as a chairman of Nefab Group AB and Consilium Safety Topco AB, vice chairman of Ruukki Construction Oy and board member of Munters Group AB.
MBA, Harvard Business School, MSc in Economics and Business Administra-tion, Stockholm School of Economics.
Casper LercheGermany
Has been a member of the board of the Company since 2018.
MSc in Finance and Accoun-ting, Copenhagen Business School.
Jörgen BergqvistSweden
Has been, as employeerepresentative, a member ofthe board of the Companysince 2015.
Six years experience in Procurements & Purchase, 20 years at ABB Power Trans-formers.
Henrik SandréusSweden
Has been a member of the board of the Company since 2019.
MSc in Industrial Engineering and Management, Linköping Institute of Technology.
Q U A N T A N N U A L R E P O R T 2 0 1 9
25
Q U A N T A N N U A L R E P O R T
2 0 1 9
External governance systems The external governance systems that constitute the framework for corporate governance at Quant consist primarily of the Swedish Com-panies Act, the Swedish Annual Accounts Act, the Luxemburg Stock exchange rules and regulations, as well as other applicable regulations and relevant legislation.
Internal governance systems The Articles of Association adopted by the shareholders, the Quant Charter of the Board of Directors adopted by the Board, the instructions for the CEO and the instructions for the Board Committees constitute the key internal governance systems. In addition to this, the Group has a number of policies and instructions with rules and principles for the Group’s operations and employees, for example, the Code of Condu-ct, Anti-Bribery Manual, Competition Manual, Data Protection Manual, Trade Sanction Manual, Whistleblowing Policy, Financial policy and the Insider Policy.
Quant Articles of Association Quant Articles of Association were adopted at an Extraordinary Gene-ral Meeting on November 28, 2017, and were registered at the Swedish Companies Registration Office on the same date. In Quant’s Articles of Association, there is no limitation on how many votes each sharehol-der can represent at a general meeting. On the Annual General Meeting (AGM), the shareholders’ elect the board of directors. Between AGMs, Extraordinary General Meetings can be held to elect new board mem-bers. Any General Meeting will be summoned at least 2 (two) and no more than 6 (six) weeks before the meeting, including for changes of the Articles of Association. Summoning is made by post. There is no outstanding delegation to the board to issue or acquire own shares.
Shareholders Quant’s shares are privately held. All shares are of the same type and have equal rights in every respect. Quant AB is owned by Cidron FS Holding AB. The group’s parent company is Cidron FS Top Holding AB, which owns 100% of the shares in Cidron FS Holding AB. The ultimate beneficial owner of Cidron FS Top Holding AB is Nordic Capital Fund VIII.
Internal control of the financial reportingThe Board of Directors is responsible for establishing fundamental rules and guidelines for internal control. The Finance and Audit Committee (the ”Committee”) is appointed by the Company’s Board of Directors, with the task of preparing matters relating to finance and audit, mo-nitoring the work of the auditors and the Company’s internal control systems, monitoring the current risks (Operational, Legal / Regulatory / Policy and Financial), follow-up of external audits and the Company’s financial information, reviewing and approving the Company’s quarterly reports for Q1 and Q3, reviewing integrity cases and other issues the Board assigns the Committee to prepare. The Board of Directors and the finance and audit committee interact directly with the external auditors.
The Board of Directors is overall responsible for establishing fundamen-tal rules and guidelines, and the CEO is specifically responsible for the effectiveness, implementation and supervision of monitoring of the in-ternal control environment within the Group. The CFO is responsible for the effectiveness of the internal control environment within the Group. At a local level, the regional managers and regional controllers are re-sponsible for the internal control.
Financial reporting competenciesThe Group Management Team and local management teams ensure that the company has employees with the right competency in all key (financial) positions and that there are procedures in place to ensure that employees in key (financial) positions have the requisite knowledge and skills.
Reporting routinesThe financial reporting should provide sufficient, up-to-date and reliable information of a financial and non-financial nature. As far as possible, management reporting is directly linked to the financial reporting and to the consolidation tool.
Local management and accounting teams report their financial results and KPIs monthly and in accordance with the Group’s accounting and reporting policies. This reporting is the basis for Quant’s internal and external reporting and serves as a basis for legal and business reviews. The business reviews, in the form of monthly financial and operational reviews, are carried out according to a structure in which sales, ear-nings, cash flow and other key measures and trends of importance to the Group are compiled and form a basis for analysis and actions by the management and controllers at different levels. Other important and group-wide components of the reporting routines are the annual budgeting process, the quarterly forecasting, and the weekly cash flow forecast process.
To ensure the efficiency of internal control over financial reporting, re-views are carried out by the Board, the audit committee, the CEO, the Group Management Team, the central finance and treasury team and the Group’s various subsidiaries. Every month, financial reports are re-viewed against budget and development compared to previous periods and risks related to the financial reporting are assessed.
Basis for financial reporting risk assessment• Existence; reported assets and liabilities exist on the reporting date.• Completeness; all transactions during the reporting period are
recorded and reported.• Rights and obligations; Assets are the rights of the organization and
the liabilities are its obligations as of a given date.• Valuation and allocation; all items in the financial reporting are
reported in conformity with IFRS principles and are correctly calculated and summarized and appropriately recorded.
• Presentation and disclosure; items in the financial reports are properly described, sorted and classified.
Quant AB (Quant, or “the Company”) is a Swedish public company, with privately held shares, and a senior and a junior bond listed on Bourse de Luxembourg (the Luxemburg Stock Exchange). Corporate governance is primarily regulated by the Swedish Companies Act and other Swedish legislation and by Rules and Regulations of the Luxemburg Stock Exchange.
Quant AB Corporate Governance Report
Q U A N T A N N U A L R E P O R T 2 0 1 9
26
Q U A N T A N N U A L R E P O R T
2 0 1 9
Engagement and responsibilityIt is the board of directors who is responsible for the corporate governance statement for the year 2019 (the financial year 2019) on page 25 and that it has been prepared in accordance with the Annual Accounts Act.
The scope of the auditOur examination has been conducted in accordance with FAR’s auditing standard RevU 16 The auditor’s examination of the corporate governance statement. This means that our examination of the corporate governance statement is different and substantially less in scope than an audit conducted in accordance with International Standards on Auditing and generally accepted auditing standards in Sweden. We believe that the examination has provided us with sufficient basis for our opinions.
OpinionsA corporate governance statement has been prepared. Disclosures in accordance with chapter 6 section 6 the second paragraph points 2-6 the Annual Accounts Act and chapter 7 section 31 the second paragraph the same law are consistent with the annual accounts and the consolidated accounts and are in accordance with the Annual Accounts Act.
Stockholm, April 29, 2020
Öhrlings PricewaterhouseCoopers AB
Nicklas KullbergAuthorized Public Accountant
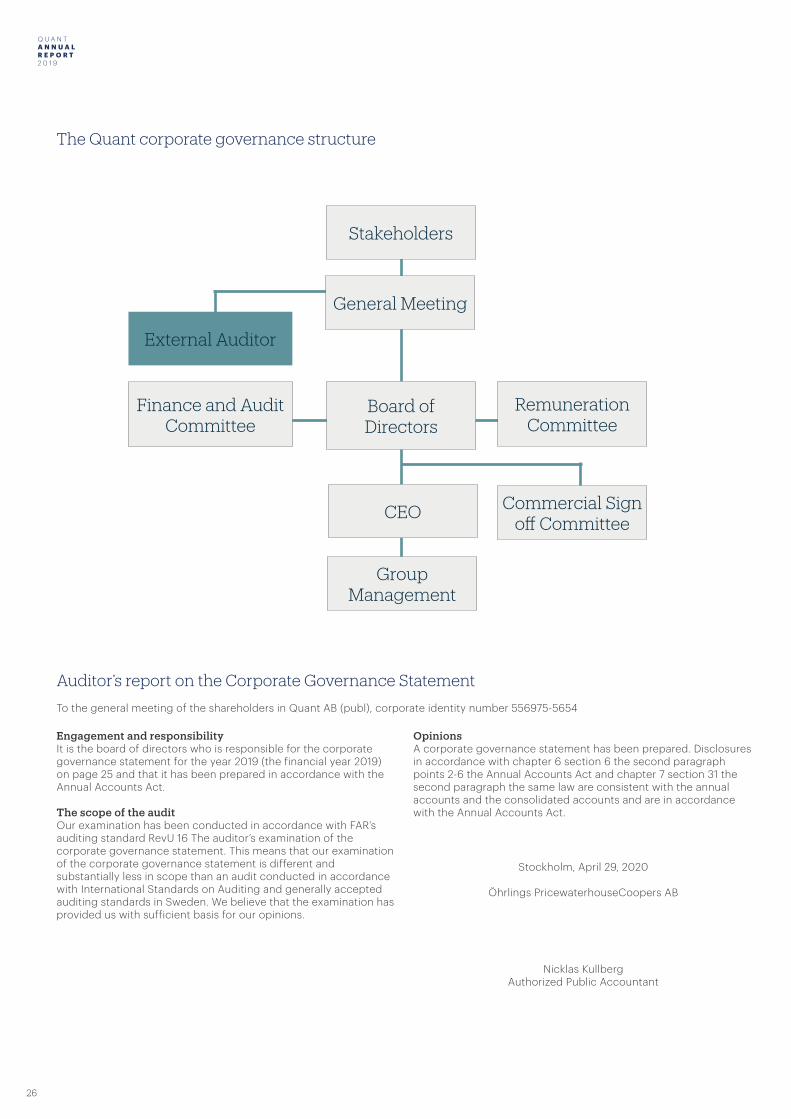
Stakeholders
General Meeting
Board of Directors
RemunerationCommittee
Commercial Sign off Committee
Finance and Audit Committee
External Auditor
CEO
GroupManagement
The Quant corporate governance structure
Auditor’s report on the Corporate Governance Statement
To the general meeting of the shareholders in Quant AB (publ), corporate identity number 556975-5654
Q U A N T A N N U A L R E P O R T 2 0 1 9
27
Q U A N T A N N U A L R E P O R T
2 0 1 9
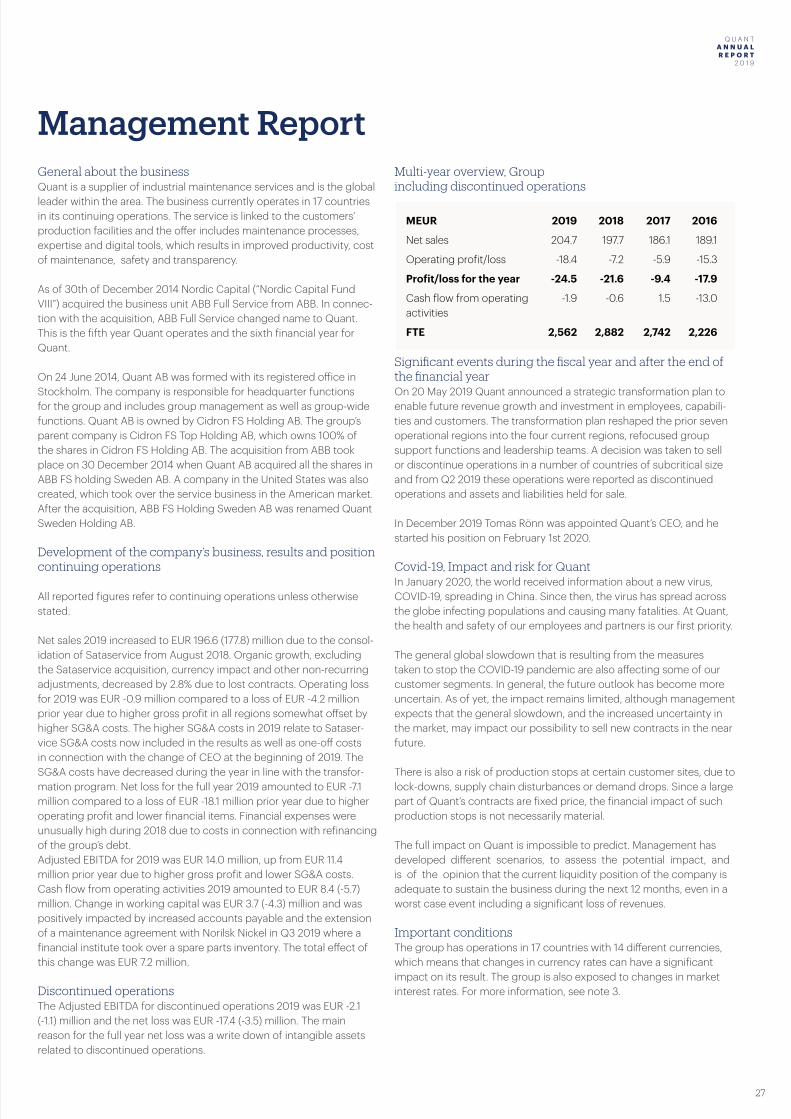
Management ReportGeneral about the businessQuant is a supplier of industrial maintenance services and is the global leader within the area. The business currently operates in 17 countries in its continuing operations. The service is linked to the customers’ production facilities and the offer includes maintenance processes, expertise and digital tools, which results in improved productivity, cost of maintenance, safety and transparency.
As of 30th of December 2014 Nordic Capital (“Nordic Capital Fund VIII”) acquired the business unit ABB Full Service from ABB. In connec-tion with the acquisition, ABB Full Service changed name to Quant. This is the fifth year Quant operates and the sixth financial year for Quant.
On 24 June 2014, Quant AB was formed with its registered office in Stockholm. The company is responsible for headquarter functions for the group and includes group management as well as group-wide functions. Quant AB is owned by Cidron FS Holding AB. The group’s parent company is Cidron FS Top Holding AB, which owns 100% of the shares in Cidron FS Holding AB. The acquisition from ABB took place on 30 December 2014 when Quant AB acquired all the shares in ABB FS holding Sweden AB. A company in the United States was also created, which took over the service business in the American market. After the acquisition, ABB FS Holding Sweden AB was renamed Quant Sweden Holding AB.
Development of the company’s business, results and position continuing operations
All reported figures refer to continuing operations unless otherwise stated.
Net sales 2019 increased to EUR 196.6 (177.8) million due to the consol-idation of Sataservice from August 2018. Organic growth, excluding the Sataservice acquisition, currency impact and other non-recurring adjustments, decreased by 2.8% due to lost contracts. Operating loss for 2019 was EUR -0.9 million compared to a loss of EUR -4.2 million prior year due to higher gross profit in all regions somewhat offset by higher SG&A costs. The higher SG&A costs in 2019 relate to Sataser-vice SG&A costs now included in the results as well as one-off costs in connection with the change of CEO at the beginning of 2019. The SG&A costs have decreased during the year in line with the transfor-mation program. Net loss for the full year 2019 amounted to EUR -7.1 million compared to a loss of EUR -18.1 million prior year due to higher operating profit and lower financial items. Financial expenses were unusually high during 2018 due to costs in connection with refinancing of the group’s debt.Adjusted EBITDA for 2019 was EUR 14.0 million, up from EUR 11.4 million prior year due to higher gross profit and lower SG&A costs. Cash flow from operating activities 2019 amounted to EUR 8.4 (-5.7) million. Change in working capital was EUR 3.7 (-4.3) million and was positively impacted by increased accounts payable and the extension of a maintenance agreement with Norilsk Nickel in Q3 2019 where a financial institute took over a spare parts inventory. The total effect of this change was EUR 7.2 million.
Discontinued operationsThe Adjusted EBITDA for discontinued operations 2019 was EUR -2.1 (-1.1) million and the net loss was EUR -17.4 (-3.5) million. The main reason for the full year net loss was a write down of intangible assets related to discontinued operations.
Multi-year overview, Group including discontinued operations
Significant events during the fiscal year and after the end of the financial yearOn 20 May 2019 Quant announced a strategic transformation plan to enable future revenue growth and investment in employees, capabili-ties and customers. The transformation plan reshaped the prior seven operational regions into the four current regions, refocused group support functions and leadership teams. A decision was taken to sell or discontinue operations in a number of countries of subcritical size and from Q2 2019 these operations were reported as discontinued operations and assets and liabilities held for sale.
In December 2019 Tomas Rönn was appointed Quant’s CEO, and he started his position on February 1st 2020.
Covid-19, Impact and risk for Quant In January 2020, the world received information about a new virus, COVID-19, spreading in China. Since then, the virus has spread across the globe infecting populations and causing many fatalities. At Quant, the health and safety of our employees and partners is our first priority.
The general global slowdown that is resulting from the measures taken to stop the COVID-19 pandemic are also affecting some of our customer segments. In general, the future outlook has become more uncertain. As of yet, the impact remains limited, although management expects that the general slowdown, and the increased uncertainty in the market, may impact our possibility to sell new contracts in the near future.
There is also a risk of production stops at certain customer sites, due to lock-downs, supply chain disturbances or demand drops. Since a large part of Quant’s contracts are fixed price, the financial impact of such production stops is not necessarily material.
The full impact on Quant is impossible to predict. Management has developed different scenarios, to assess the potential impact, and is of the opinion that the current liquidity position of the company is adequate to sustain the business during the next 12 months, even in a worst case event including a significant loss of revenues.
Important conditionsThe group has operations in 17 countries with 14 different currencies, which means that changes in currency rates can have a significant impact on its result. The group is also exposed to changes in market interest rates. For more information, see note 3.
MEUR 2019 2018 2017 2016
Net sales 204.7 197.7 186.1 189.1
Operating profit/loss -18.4 -7.2 -5.9 -15.3
Profit/loss for the year -24.5 -21.6 -9.4 -17.9
Cash flow from operating activities
-1.9 -0.6 1.5 -13.0
FTE 2,562 2,882 2,742 2,226
Q U A N T A N N U A L R E P O R T 2 0 1 9
28
Q U A N T A N N U A L R E P O R T
2 0 1 9
Expected future development and important risks and uncer-tainty factors Global economic and market risksThe Group’s business is highly dependent on its customers’ demand for its services and their ability and willingness to meet their payment obligations under existing contracts in a timely manner, and accordingly its revenues are to a large extent dependent on the strength of the markets its custom-ers are engaged in. While the Group’s customer base is spread across a number of different global markets and a diversified set of product mar-kets, it is ultimately dependent on the macro-economic factors including the global economic situation which is outside the Group’s control.
Operational risksThe operational risks in Quant’s business is primarily attributable to con-tractual commitments in customer contracts for responsibility and service performance. Quant performs its services in an environment where customers place high demands on safety when performing the service to ensure minimal negative impact on employees, environment and busi-ness process. Since Quant’s services are mainly performed by personnel, there is a risk that injuries and damages may occur due to negligence or other lack of performance of the service. Quant does its outmost to mini-mize the occurrence of these types of risks through, inter alia, risk analysis, training, certification, follow-up of performance of service, and through careful contract management with clear liability limits.
As a maintenance services business, the Group is highly dependent on re-taining its customer portfolio as well as its ability to attract new customers on a regular basis in order to secure both short and long-term profitability. The Group currently faces competition from both global and local pro-viders of maintenance services and is also facing the risk of its customers choosing to in-source the services provided. The loss of larger contracts or a loss of a number of less significant contracts would have a significant impact on the Group’s profitability. Any demobilization from a customer site is required to be managed in an organized manner that allows for exit costs to be minimized and, unless lost contracts are replaced by new contracts, that the group’s operations are adjusted to reduced earnings. To manage the risk of loss of contract Quant is ensuring value-add for the customer by, for instance, maintaining motivated and well-trained person-nel, a continuous development of services and processes and an active customer relationship dialogue.
Quant has a number of pricing models in its contracts, including fixed price contracts and cost-plus pricing models. While the Group has compiled an extensive qualitative and quantitative database of industry benchmarks over recent decades, resulting in a robust pricing process, if the total effective maintenance costs are above the agreed fixed price lev-el, if cost increases occur despite price indexation in customer contracts, or if price pressures hinders Quant from applying a profit margin which it considers satisfactory in order to win a contract, it could have a negative impact on the Group’s operations and financial position.
A large portion of the Group’s risk of cost overruns, which significantly impact the profitability of contracts, arise at the start-up and/or termi-nation stages of a contract, or in periods of site shut-down during the contract term. To manage this risk Quant has well-defined processes and procedures for these key parts of the contract life, as well as operational, financial and legal risk reviews of contracts before entering into new contract relationships.
The group operates in a relatively specialized business, and the potential departures of key persons and the ability to attract qualified personnel is crucial for the group’s success.
DigitalizationIn an increasingly digitalized world, one of the Group’s main focus areas in order to ensure long-term success and profitability is to stay ahead of technological advances and to offer cutting-edge technology as part of its services. While the Group currently offers advanced technological solu-tions to customers, the pace of advances in technology is increasing, and any failure by the Group to keep up with such advances may result in not being able to offer the most up to date technology, and/or to fall behind the products and services offered by its competitors.
Disputes and litigationsThe group regularly reviews significant outstanding claims and disputes to determine the need for provisions. Among the factors considered in such an assessment are the type of litigation or summons, the amount of any damages, the development of the case, perceptions of legal and other advisers, experience from similar cases, and decisions of Group manage-ment regarding the Group’s actions concerning these claims or disputes. Estimates do not necessarily reflect the outcome of pending litigation, and differences between outcome and estimate may significantly affect the company’s financial position and have an unfavorable impact on operating income and liquidity.
Financial risksFinancial risks mainly consist of currency, interest rate and financing risks. The continued development of the global economy, including interest rate and currency risk, is an uncertainty factor for earnings performance. A more detailed description of Quant’s financial risks and how the group manage these risks is found in note 3.
Insurable risksUsage of insurance is governed by central guidelines. These include professional indemnity and product liability, property, disruption, trans-port, crime, CEO and board responsibilities and liability insurance for employment-related requirements. Most insurance policies are managed centrally by the Group.
Use of financial instrumentsFinancial instruments derive from interest-bearing borrowing from bank and currency hedging of intercompany loans. As of 31 December 2019, no currency swaps hedging intercompany loans were outstand-ing. The derivatives are included in the balance sheet under other liabilities and amount to EUR 0 (1) thousand.
Permit or notification required under the Environmental CodeThe Group does not operate a business that requires any permit or notification.
Proposed appropriation of non-restricted equityNon-restricted equity in the parent company at the disposal of the Annual General Meeting:
Retained earnings 89,525
Loss of the year -21,768
Total 67,758
The board of Directors and the CEO propose this amount be appropriated as follows:
Amount carried forward 67,758
For further information regarding the company’s profit and financial position, information can be found in the income statement, statement of financial position and cash flow statement.
Q U A N T A N N U A L R E P O R T 2 0 1 9
29
Q U A N T A N N U A L R E P O R T
2 0 1 9
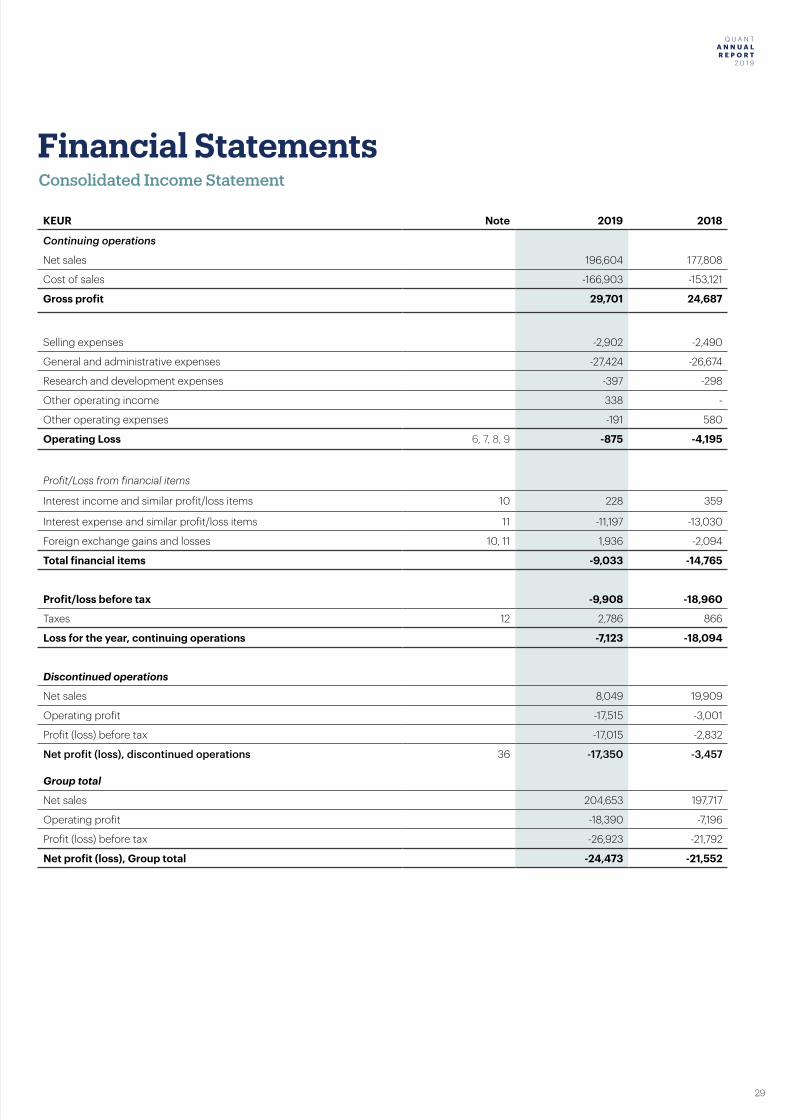
KEUR Note 2019 2018
Continuing operations
Net sales 196,604 177,808
Cost of sales -166,903 -153,121
Gross profit 29,701 24,687
Selling expenses -2,902 -2,490
General and administrative expenses -27,424 -26,674
Research and development expenses -397 -298
Other operating income 338 -
Other operating expenses -191 580
Operating Loss 6, 7, 8, 9 -875 -4,195
Profit/Loss from financial items
Interest income and similar profit/loss items 10 228 359
Interest expense and similar profit/loss items 11 -11,197 -13,030
Foreign exchange gains and losses 10, 11 1,936 -2,094
Total financial items -9,033 -14,765
Profit/loss before tax -9,908 -18,960
Taxes 12 2,786 866
Loss for the year, continuing operations -7,123 -18,094
Discontinued operations
Net sales 8,049 19,909
Operating profit -17,515 -3,001
Profit (loss) before tax -17,015 -2,832
Net profit (loss), discontinued operations 36 -17,350 -3,457
Group total
Net sales 204,653 197,717
Operating profit -18,390 -7,196
Profit (loss) before tax -26,923 -21,792
Net profit (loss), Group total -24,473 -21,552
Consolidated Income Statement
Financial Statements
Q U A N T A N N U A L R E P O R T 2 0 1 9
30
Q U A N T A N N U A L R E P O R T
2 0 1 9
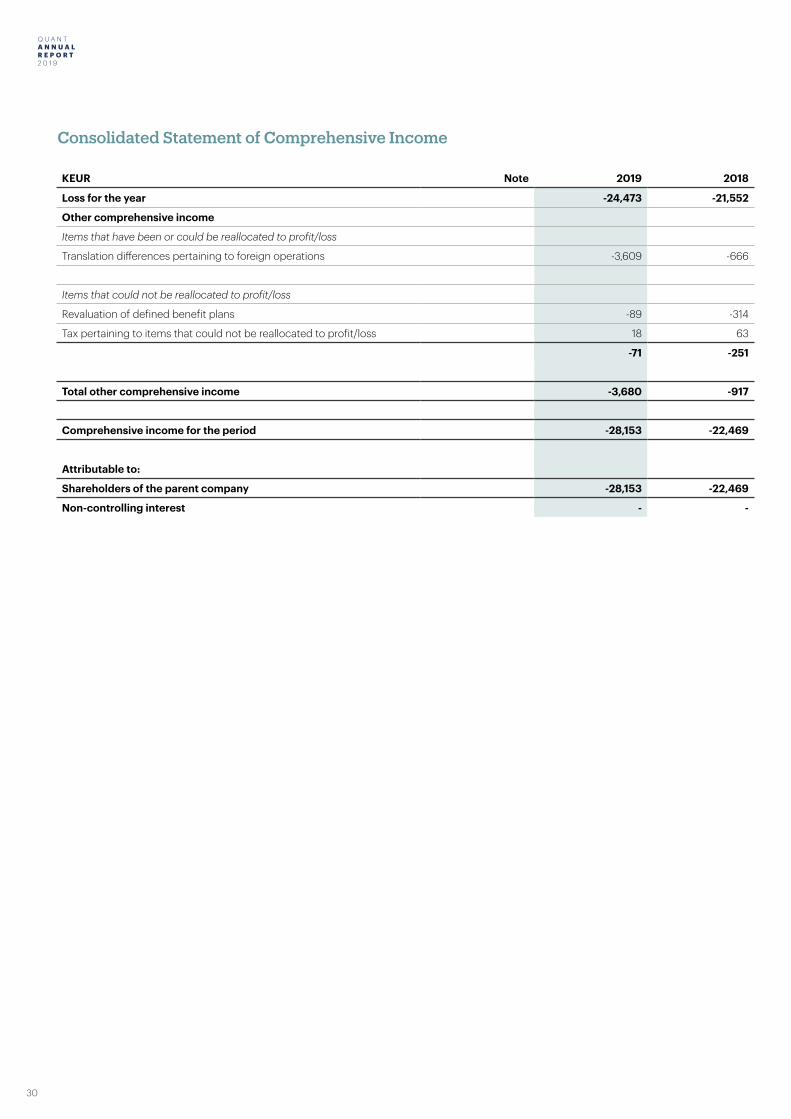
Consolidated Statement of Comprehensive Income
KEUR Note 2019 2018
Loss for the year -24,473 -21,552
Other comprehensive income
Items that have been or could be reallocated to profit/loss
Translation differences pertaining to foreign operations -3,609 -666
Items that could not be reallocated to profit/loss
Revaluation of defined benefit plans -89 -314
Tax pertaining to items that could not be reallocated to profit/loss 18 63
-71 -251
Total other comprehensive income -3,680 -917
Comprehensive income for the period -28,153 -22,469
Attributable to:
Shareholders of the parent company -28,153 -22,469
Non-controlling interest - -
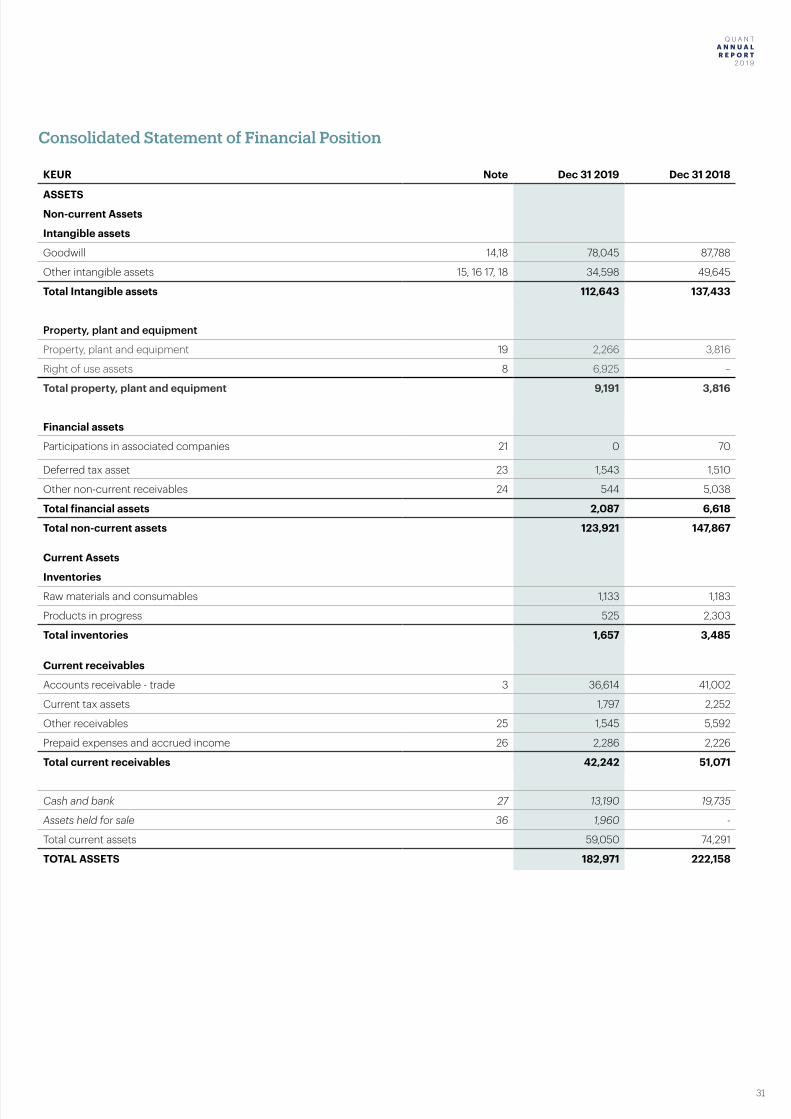
Q U A N T A N N U A L R E P O R T 2 0 1 9
31
Q U A N T A N N U A L R E P O R T
2 0 1 9
Consolidated Statement of Financial Position
KEUR Note Dec 31 2019 Dec 31 2018
ASSETS
Non-current Assets
Intangible assets
Goodwill 14,18 78,045 87,788
Other intangible assets 15, 16 17, 18 34,598 49,645
Total Intangible assets 112,643 137,433
Property, plant and equipment
Property, plant and equipment 19 2,266 3,816
Right of use assets 8 6,925 –
Total property, plant and equipment 9,191 3,816
Financial assets
Participations in associated companies 21 0 70
Deferred tax asset 23 1,543 1,510
Other non-current receivables 24 544 5,038
Total financial assets 2,087 6,618
Total non-current assets 123,921 147,867
Current Assets
Inventories
Raw materials and consumables 1,133 1,183
Products in progress 525 2,303
Total inventories 1,657 3,485
Current receivables
Accounts receivable - trade 3 36,614 41,002
Current tax assets 1,797 2,252
Other receivables 25 1,545 5,592
Prepaid expenses and accrued income 26 2,286 2,226
Total current receivables 42,242 51,071
Cash and bank 27 13,190 19,735
Assets held for sale 36 1,960 -
Total current assets 59,050 74,291
TOTAL ASSETS 182,971 222,158
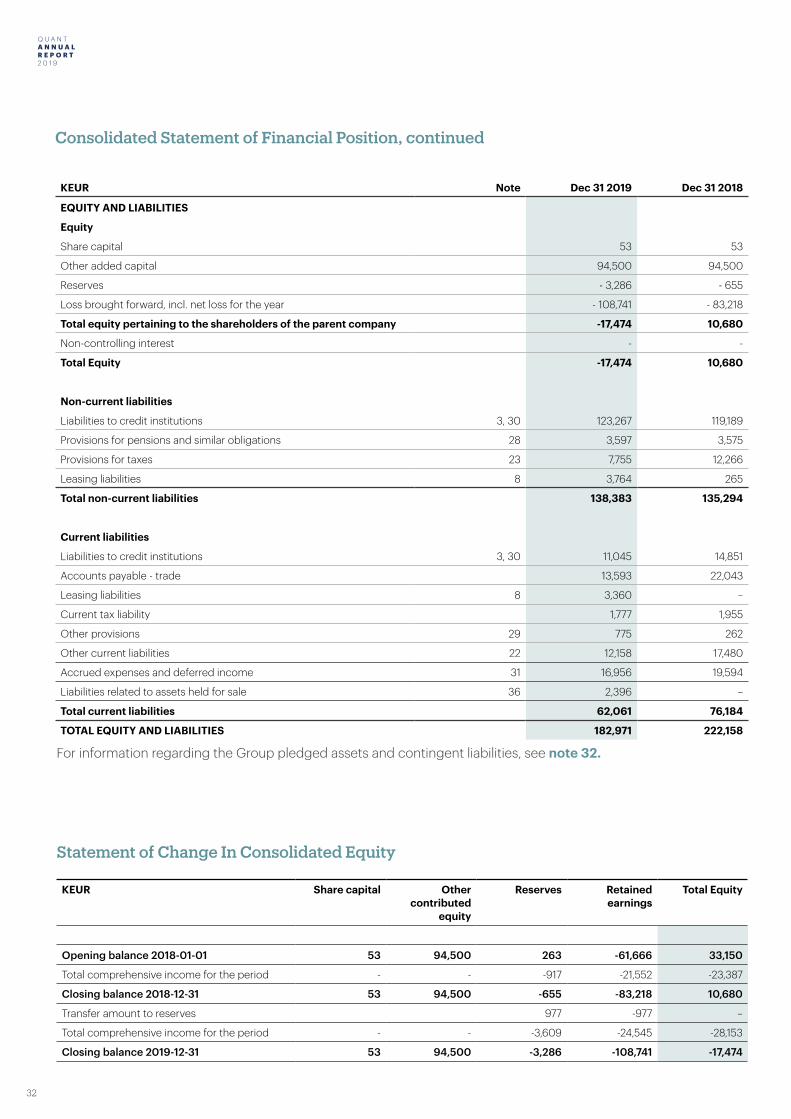
Q U A N T A N N U A L R E P O R T 2 0 1 9
32
Q U A N T A N N U A L R E P O R T
2 0 1 9
Consolidated Statement of Financial Position, continued
KEUR Note Dec 31 2019 Dec 31 2018
EQUITY AND LIABILITIES
Equity
Share capital 53 53
Other added capital 94,500 94,500
Reserves - 3,286 - 655
Loss brought forward, incl. net loss for the year - 108,741 - 83,218
Total equity pertaining to the shareholders of the parent company -17,474 10,680
Non-controlling interest - -
Total Equity -17,474 10,680
Non-current liabilities
Liabilities to credit institutions 3, 30 123,267 119,189
Provisions for pensions and similar obligations 28 3,597 3,575
Provisions for taxes 23 7,755 12,266
Leasing liabilities 8 3,764 265
Total non-current liabilities 138,383 135,294
Current liabilities
Liabilities to credit institutions 3, 30 11,045 14,851
Accounts payable - trade 13,593 22,043
Leasing liabilities 8 3,360 –
Current tax liability 1,777 1,955
Other provisions 29 775 262
Other current liabilities 22 12,158 17,480
Accrued expenses and deferred income 31 16,956 19,594
Liabilities related to assets held for sale 36 2,396 –
Total current liabilities 62,061 76,184
TOTAL EQUITY AND LIABILITIES 182,971 222,158
For information regarding the Group pledged assets and contingent liabilities, see note 32.
KEUR Share capital Other contributed
equity
Reserves Retained earnings
Total Equity
Opening balance 2018-01-01 53 94,500 263 -61,666 33,150
Total comprehensive income for the period - - -917 -21,552 -23,387
Closing balance 2018-12-31 53 94,500 -655 -83,218 10,680
Transfer amount to reserves 977 -977 –
Total comprehensive income for the period - - -3,609 -24,545 -28,153
Closing balance 2019-12-31 53 94,500 -3,286 -108,741 -17,474
Statement of Change In Consolidated Equity
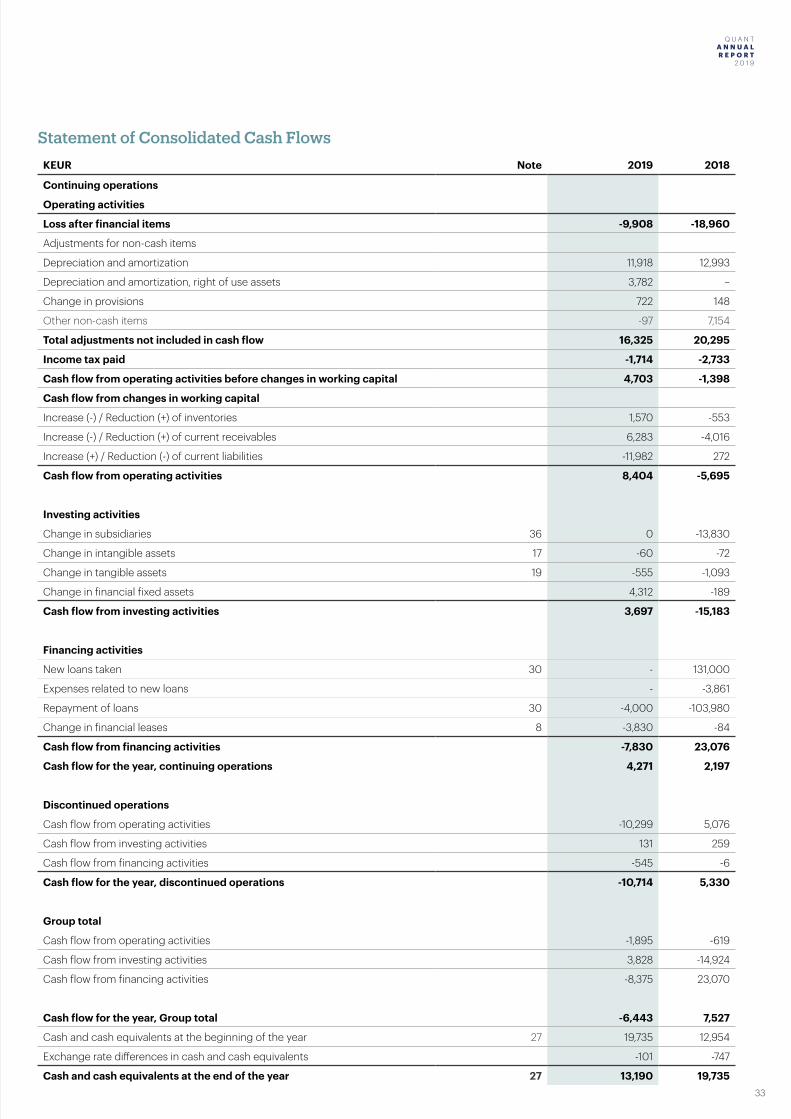
Q U A N T A N N U A L R E P O R T 2 0 1 9
33
Q U A N T A N N U A L R E P O R T
2 0 1 9
Statement of Consolidated Cash FlowsKEUR Note 2019 2018
Continuing operations
Operating activities
Loss after financial items -9,908 -18,960
Adjustments for non-cash items
Depreciation and amortization 11,918 12,993
Depreciation and amortization, right of use assets 3,782 –
Change in provisions 722 148
Other non-cash items -97 7,154
Total adjustments not included in cash flow 16,325 20,295
Income tax paid -1,714 -2,733
Cash flow from operating activities before changes in working capital 4,703 -1,398
Cash flow from changes in working capital
Increase (-) / Reduction (+) of inventories 1,570 -553
Increase (-) / Reduction (+) of current receivables 6,283 -4,016
Increase (+) / Reduction (-) of current liabilities -11,982 272
Cash flow from operating activities 8,404 -5,695
Investing activities
Change in subsidiaries 36 0 -13,830
Change in intangible assets 17 -60 -72
Change in tangible assets 19 -555 -1,093
Change in financial fixed assets 4,312 -189
Cash flow from investing activities 3,697 -15,183
Financing activities
New loans taken 30 - 131,000
Expenses related to new loans - -3,861
Repayment of loans 30 -4,000 -103,980
Change in financial leases 8 -3,830 -84
Cash flow from financing activities -7,830 23,076
Cash flow for the year, continuing operations 4,271 2,197
Discontinued operations
Cash flow from operating activities -10,299 5,076
Cash flow from investing activities 131 259
Cash flow from financing activities -545 -6
Cash flow for the year, discontinued operations -10,714 5,330
Group total
Cash flow from operating activities -1,895 -619
Cash flow from investing activities 3,828 -14,924
Cash flow from financing activities -8,375 23,070
Cash flow for the year, Group total -6,443 7,527
Cash and cash equivalents at the beginning of the year 27 19,735 12,954
Exchange rate differences in cash and cash equivalents -101 -747
Cash and cash equivalents at the end of the year 27 13,190 19,735
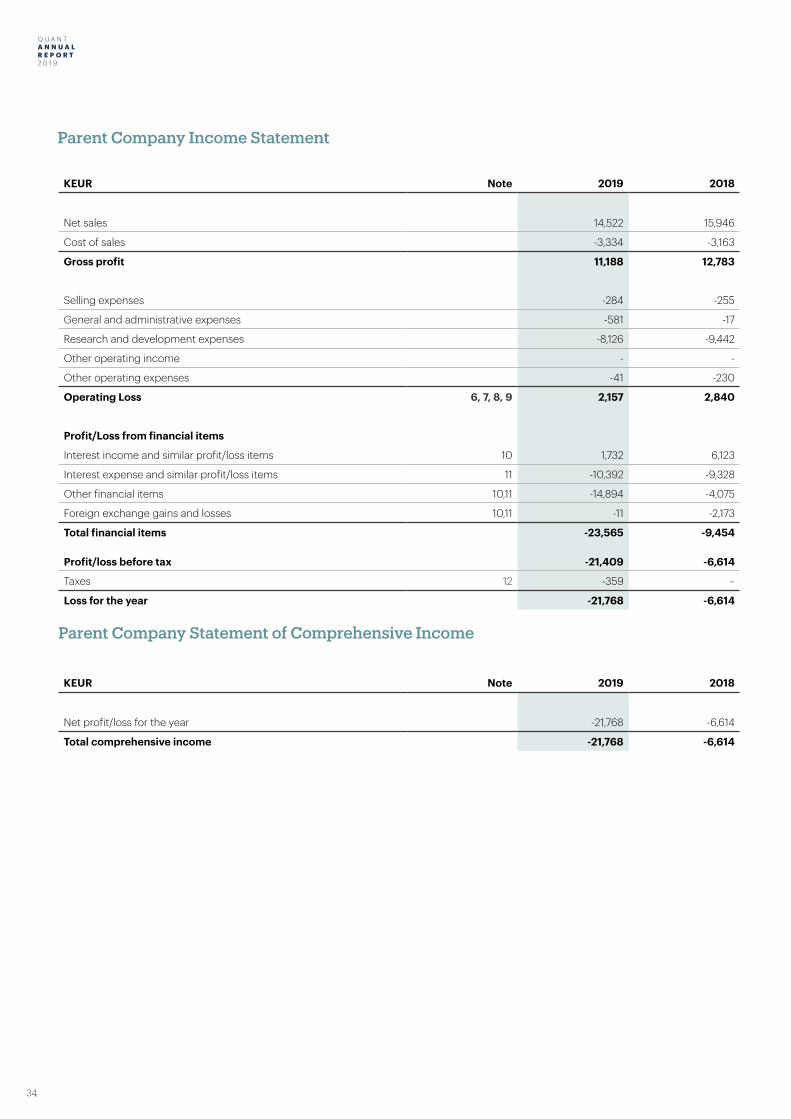
Q U A N T A N N U A L R E P O R T 2 0 1 9
34
Q U A N T A N N U A L R E P O R T
2 0 1 9
Parent Company Income Statement
KEUR Note 2019 2018
Net sales 14,522 15,946
Cost of sales -3,334 -3,163
Gross profit 11,188 12,783
Selling expenses -284 -255
General and administrative expenses -581 -17
Research and development expenses -8,126 -9,442
Other operating income - -
Other operating expenses -41 -230
Operating Loss 6, 7, 8, 9 2,157 2,840
Profit/Loss from financial items
Interest income and similar profit/loss items 10 1,732 6,123
Interest expense and similar profit/loss items 11 -10,392 -9,328
Other financial items 10,11 -14,894 -4,075
Foreign exchange gains and losses 10,11 -11 -2,173
Total financial items -23,565 -9,454
Profit/loss before tax -21,409 -6,614
Taxes 12 -359 –
Loss for the year -21,768 -6,614
Parent Company Statement of Comprehensive Income
KEUR Note 2019 2018
Net profit/loss for the year -21,768 -6,614
Total comprehensive income -21,768 -6,614
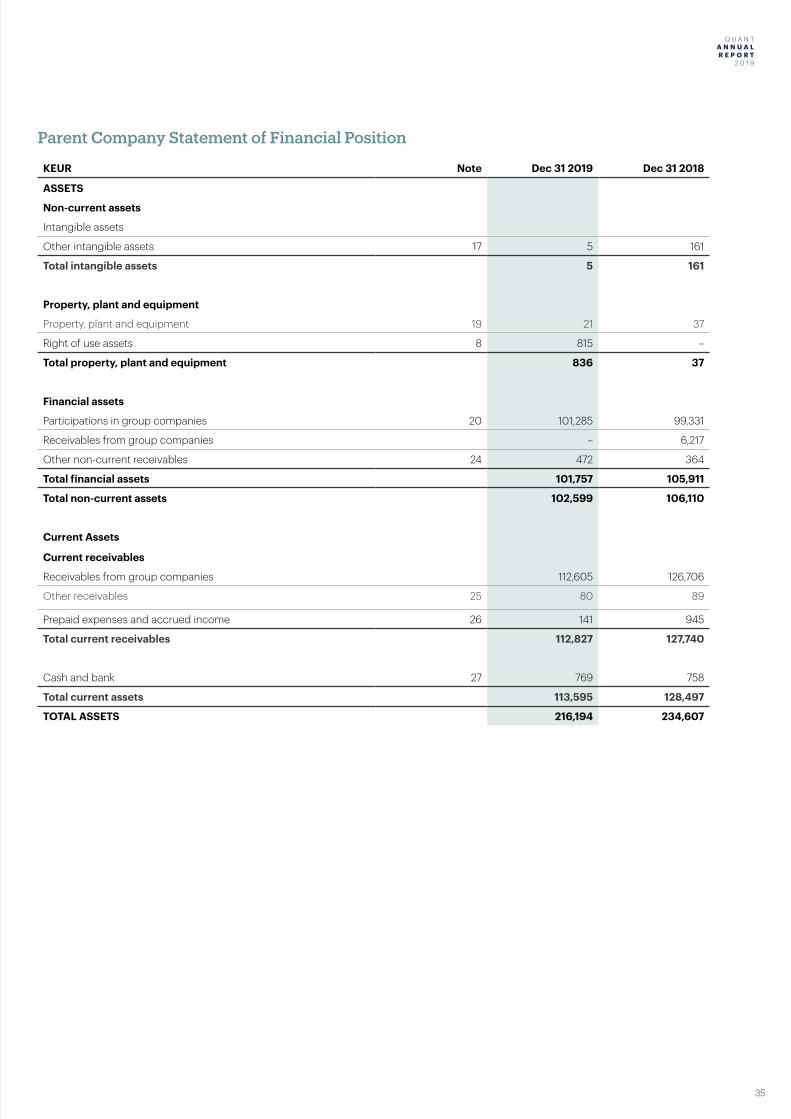
Q U A N T A N N U A L R E P O R T 2 0 1 9
35
Q U A N T A N N U A L R E P O R T
2 0 1 9
Parent Company Statement of Financial Position
KEUR Note Dec 31 2019 Dec 31 2018
ASSETS
Non-current assets
Intangible assets
Other intangible assets 17 5 161
Total intangible assets 5 161
Property, plant and equipment
Property, plant and equipment 19 21 37
Right of use assets 8 815 –
Total property, plant and equipment 836 37
Financial assets
Participations in group companies 20 101,285 99,331
Receivables from group companies – 6,217
Other non-current receivables 24 472 364
Total financial assets 101,757 105,911
Total non-current assets 102,599 106,110
Current Assets
Current receivables
Receivables from group companies 112,605 126,706
Other receivables 25 80 89
Prepaid expenses and accrued income 26 141 945
Total current receivables 112,827 127,740
Cash and bank 27 769 758
Total current assets 113,595 128,497
TOTAL ASSETS 216,194 234,607
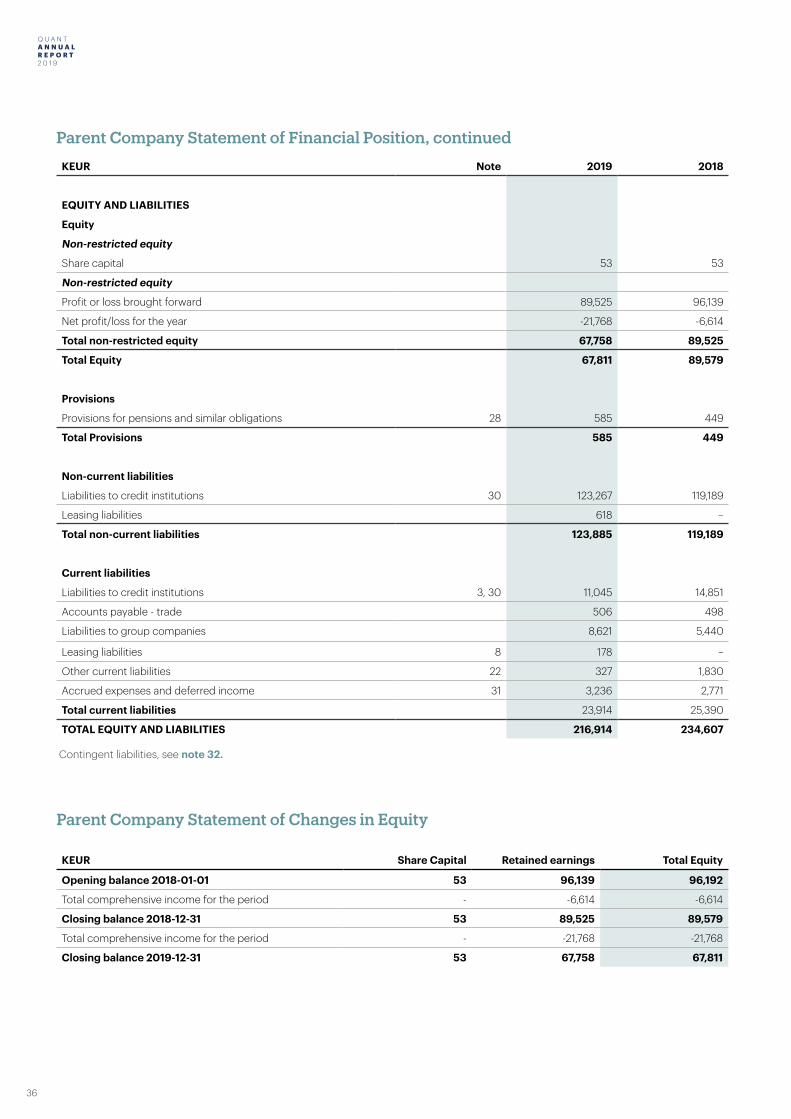
Q U A N T A N N U A L R E P O R T 2 0 1 9
36
Q U A N T A N N U A L R E P O R T
2 0 1 9
Parent Company Statement of Financial Position, continued
KEUR Note 2019 2018
EQUITY AND LIABILITIES
Equity
Non-restricted equity
Share capital 53 53
Non-restricted equity
Profit or loss brought forward 89,525 96,139
Net profit/loss for the year -21,768 -6,614
Total non-restricted equity 67,758 89,525
Total Equity 67,811 89,579
Provisions
Provisions for pensions and similar obligations 28 585 449
Total Provisions 585 449
Non-current liabilities
Liabilities to credit institutions 30 123,267 119,189
Leasing liabilities 618 –
Total non-current liabilities 123,885 119,189
Current liabilities
Liabilities to credit institutions 3, 30 11,045 14,851
Accounts payable - trade 506 498
Liabilities to group companies 8,621 5,440
Leasing liabilities 8 178 –
Other current liabilities 22 327 1,830
Accrued expenses and deferred income 31 3,236 2,771
Total current liabilities 23,914 25,390
TOTAL EQUITY AND LIABILITIES 216,914 234,607
Contingent liabilities, see note 32.
KEUR Share Capital Retained earnings Total Equity
Opening balance 2018-01-01 53 96,139 96,192
Total comprehensive income for the period - -6,614 -6,614
Closing balance 2018-12-31 53 89,525 89,579
Total comprehensive income for the period - -21,768 -21,768
Closing balance 2019-12-31 53 67,758 67,811
Parent Company Statement of Changes in Equity
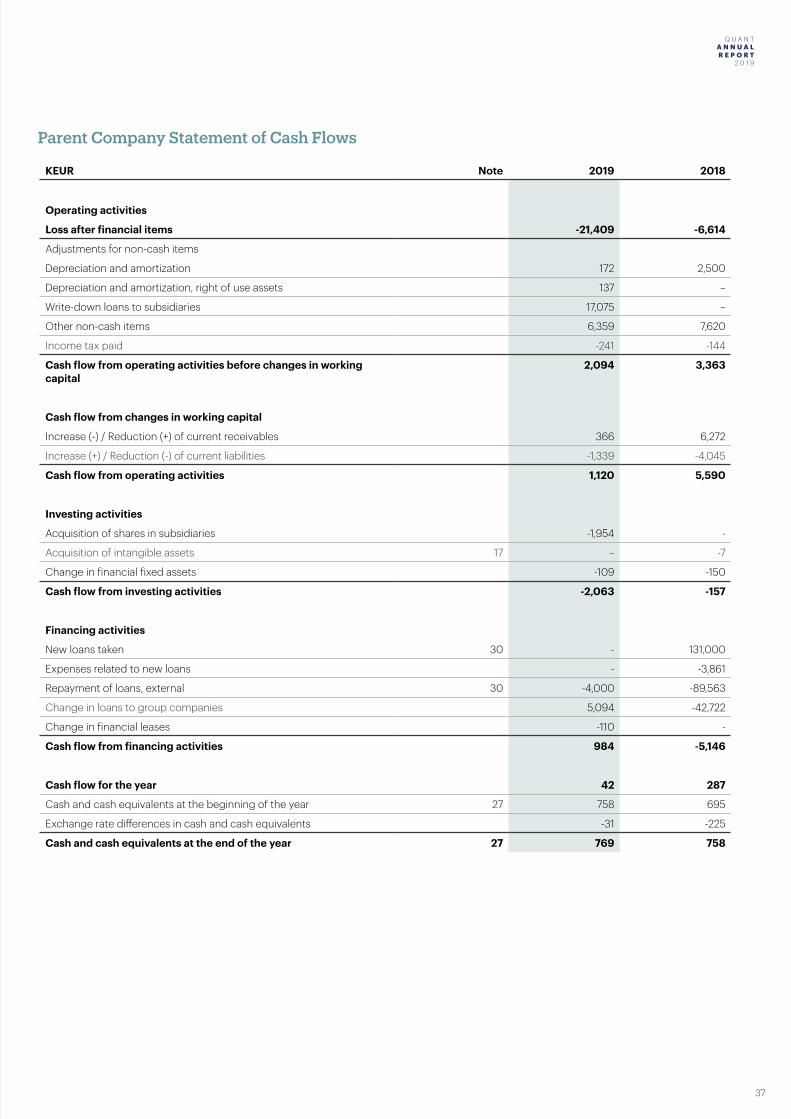
Q U A N T A N N U A L R E P O R T 2 0 1 9
37
Q U A N T A N N U A L R E P O R T
2 0 1 9
Parent Company Statement of Cash Flows
KEUR Note 2019 2018
Operating activities
Loss after financial items -21,409 -6,614
Adjustments for non-cash items
Depreciation and amortization 172 2,500
Depreciation and amortization, right of use assets 137 –
Write-down loans to subsidiaries 17,075 –
Other non-cash items 6,359 7,620
Income tax paid -241 -144
Cash flow from operating activities before changes in working capital
2,094 3,363
Cash flow from changes in working capital
Increase (-) / Reduction (+) of current receivables 366 6,272
Increase (+) / Reduction (-) of current liabilities -1,339 -4,045
Cash flow from operating activities 1,120 5,590
Investing activities
Acquisition of shares in subsidiaries -1,954 -
Acquisition of intangible assets 17 – -7
Change in financial fixed assets -109 -150
Cash flow from investing activities -2,063 -157
Financing activities
New loans taken 30 - 131,000
Expenses related to new loans - -3,861
Repayment of loans, external 30 -4,000 -89,563
Change in loans to group companies 5,094 -42,722
Change in financial leases -110 -
Cash flow from financing activities 984 -5,146
Cash flow for the year 42 287
Cash and cash equivalents at the beginning of the year 27 758 695
Exchange rate differences in cash and cash equivalents -31 -225
Cash and cash equivalents at the end of the year 27 769 758
Q U A N T A N N U A L R E P O R T 2 0 1 9
38
Q U A N T A N N U A L R E P O R T
2 0 1 9
NotesNote 1. Accounting principles
The parent company, Quant AB (publ), Swedish corporate ID no.556975-5654 is a limited liability company registered in Sweden, having its registered office at the address: St Göransgatan 66, 112 33 Stockholm. Since Feb 7, 2019 Quant AB (publ) has its bonds registered on the EU regulated market of the Luxembourg Stock Exchange.
Quant AB is a wholly-owned subsidiary of Cidron FS Holding AB, org no 556968-8905 with its registered office in Stockholm. Cidron FS Holding AB is part of a group of companies in which Cidron FS Top Holding AB, org no 556985-2287, based in Stockholm, reports consolidated financial statements for the largest group.
The consolidated financial statements have been prepared in accordance with EU-approved International Financial Reporting Standards (IFRS) issued by the International Accounting Standards Board (IASB). In addition, the Group applies the Swedish Financial Reporting Board’s recommendation RFR 1 supplementary account-ing regulations for corporate conglomerates, which specifies the supplements to IFRS required pursuant to the stipulations of the Swedish Annual Accounts Act.
The parent company applies the same accounting principles as the group except in the cases listed below under the section “Parent Company Accounting Principles”.
The Annual Report was approved for issue by the Board of Direc-tors and the CEO on April 29, 2020. The Balance Sheets and In-come Statements will be subject to approval by the Annual General Meeting on April 29, 2020.
Basis for appraisal applied when establishing the financial statementsAssets, provisions and liabilities have been valued at acquisition values unless otherwise stated below.
Functional currency and reporting currencyThe functional currency of the parent company is the Euro (EUR), which is also the reporting currency for the parent company and the Group. This means that the financial statements are presented in Euro. Unless otherwise stated, all amounts are rounded to the nearest thousand (EUR thousand). Amounts in parentheses refer to the previous year. Income statement items refer to the period Jan-uary 1 – December 31, while balance sheet items refer to December 31.
Assessments and estimates in the financial state-mentsTo prepare the financial statements in accordance with IFRS requires management to make assessments and estimates and to make assumptions that affect the application of accounting prin-ciples and the reported amounts of assets, liabilities, income and expenses. The actual outcome may deviate from these estimates and assessments.
The estimates and assumptions are reviewed regularly. Changes to estimates are reported in the period in which the change is made if the change only affected this period, or in the period the change is made and future periods if the change affects both the current period and future periods.
Disclosures of such IFRS standards or interpreta-tions that have entered into force in 2019 IFRS 16 LeasesThe Group applies IFRS 16 Leases as of January 1, 2019. For lessees, the standard eliminates the classification of leases as either oper-ating or financial, as required by IAS 17, and instead introduces a single lease accounting model. Applying that model, the lessee is required to recognize
(a) assets and liabilities for all leases with a term of more than 12 months, unless the underlying asset is of low value; and
(b) depreciation of leased assets separately from interest on lease liability in the income statement
Quant’s lease portfolio is comprised of operational leases for offices and for vehicles required to perform maintenance servic-es. Quant has applied the modified retrospective method for the transition to IFRS 16 on January 1, 2019, meaning that Quant has not recalculated the financial statements for 2018. The lease liability is the sum of the present value of all future payments until lease end date. The practical expedient to set the Right of Use Asset (before adjustments for any prepayments) equal to the lease liability has been applied for the transition. The rate for discounting the lease payments is Quant’s marginal borrowing rate for each country of operation. The practical expedient for definition of a lease has been applied, meaning that all components within a lease has been considered as a lease component. The short-term lease exception and the asset of low value exception has also been applied.
The opening balance at 1 January 2019 of the lease liability and the Right of Use Assets is EUR 11.7 million for current lease contracts. The covenants for the Group’s debt obligations have been de-fined excluding the impact of IFRS 16 on key ratios. Therefore, the introduction of IFRS 16 will not affect the Group’s ability to meet its covenants.
Disclosure of such IFRS standards or interpreta-tions that have not yet entered into forceNo other changes to accounting standards with future application are considered to have any material effect on the consolidated accounts.
ClassificationThe classification of fixed assets and non-current liabilities consists substantially of amounts that are expected to be recovered or paid more than 12 months from the balance sheet date. Current assets and current liabilities consist substantially of amounts that are expected to be recovered or paid within 12 months of the balance sheet date.
Consolidation principles and business combina-tions
SubsidiariesSubsidiaries are companies that are under a controlling influence from Quant AB. Controlling influence exists if Quant AB has power over the investee company, is exposed to, or has the right to, variable returns from its engagement with the company and can use its influence over the investment to influence the return. When assessing whether a controlling influence exists, potential voting shares are taken into account and if de facto control exists.
Subsidiaries are reported according to the acquisition method. The method implies that the acquisition of a subsidiary is regarded as a transaction whereby the group indirectly acquires the subsidiary’s assets and assumes its liabilities. In the acquisition analysis, the fair value of the acquisition date is determined by the identifia-ble assets and liabilities assumed, as well as any non-controlling interest. Transaction expenditure, with the exception of transaction expenditure relating to the issue of equity instruments or debt instruments, that arises is reported directly in profit or loss for the year. In the case of business combinations where transferred remu-neration, possible non-controlling interest and value of previously owned share (in the case of incremental acquisitions) exceed the fair value of acquired assets and assumed liabilities that is recog-nized separately, the difference is recognized as goodwill. When the difference is negative, so-called acquisition at low price, this is reported directly in profit or loss for the year.
Q U A N T A N N U A L R E P O R T 2 0 1 9
39
Q U A N T A N N U A L R E P O R T
2 0 1 9
Contingent consideration is reported at fair value at the time of acquisition. Where the contingent consideration is classified as an equity instrument, no revaluation and regulation is made within equity. For other contingent considerations, these are revalued at each reporting date and the change is reported in profit or loss for the year.In cases where the acquisition does not relate to 100% of the sub-sidiary, non-controlling interest is acquired. There are two options for reporting non-controlling interests. These two options are to report non-controlling interest in net proportional assets or that non-controlling interests are recognized at fair value, which means that non-controlling interests have share in goodwill. The choice between the different options to report non-controlling interests can be made depending on the acquisition.
AssociatesAssociates are companies over which the group has a significant, but not a controlling, influence over the operational and finan-cial management, usually through shareholdings between 20% and 50% of the voting rights. From the moment the significant influence is received, participations in associated companies are reported in accordance with the equity method in the consolidated financial statements. The equity method implies that the value of the shares in associated companies reported in the group corre-sponds to the group’s share in the associated companies’ equity as well as group goodwill and any remaining values is reported in group surplus and deficit values. The group’s share of associated companies’ profit/loss adjusted for possible depreciation, impair-ment losses and dissolutions of acquired surplus and deficit values are reported as “participation in the result of associates”. These share splits decreased with dividends received from associated companies represent the main change in the carrying amount of participations in associates. The group’s share of other comprehen-sive income in associated companies is reported on a separate line in the group’s other comprehensive income.
Any difference in the acquisition between the acquisition value of the holding and the investor’s share of the fair value net of the identifiable assets and liabilities of the associate is reported ac-cording to the same principles as in the acquisition of subsidiaries.
Transaction expenditure, with the exception of transaction expenditure relating to the issue of equity instruments or debt instruments, which arises is included in the acquisition value. When the group’s share of reported losses in the associated company exceeds the carrying amount of the group’s shares, the value of the shares is reduced to zero. Offsetting of losses is also effected against non-collateral long-term financial transactions, which are, in their economic sense, part of the investor’s net investment in the associated company. Continued losses are not reported unless the group has provided guarantees to cover the losses incurred by the associated company. The equity method is applied up to the time when the significant influence ceases.
Transactions eliminated on consolidationIntercompany receivables and liabilities, income or expenses and unrealized gains or losses arising from intra-group transactions between business units are eliminated in full when the consoli-dated financial statements are prepared. Unrealized gains arising from transactions with associates are eliminated to the extent that corresponds to the group’s ownership interest in the company. Un-realized losses are eliminated in the same way as unrealized gains, but only to the extent that there is no impairment.
Foreign currency
Transactions in foreign currencyTransactions in foreign currency are translated into the functional currency at the exchange rate prevailing on the transaction date. Functional currency is the currency of the primary economic environments in which the companies conduct their business. Monetary assets and liabilities denominated in foreign currency are converted into functional currency at the balance sheet date and
exchange rate differences are recognized. Exchange rate differenc-es arising from translation are reported in profit or loss for the year. Non-monetary assets and liabilities that are reported at historical acquisition values are translated with the exchange rate at the transaction. Non-monetary assets and liabilities that are recognized at fair value are translated into the functional currency at the rate prevailing at the time of measurement at fair value.
Financial statements of foreign operationsAssets and liabilities in foreign operations, including goodwill and other group surplus and discount values, are translated from entity functional currency to the group’s reporting currency, euro, at the exchange rate prevailing on balance sheet date. Income and expenses in a foreign operation are translated into euro at an average rate that is an approximation of the exchange rates prevailing at the time of the respective transaction. Translation differences arising from currency translation of foreign operations are recognized in other comprehensive income and accumulate in a separate component of equity, the term “translation reserve”. When controlling influence or significant influence ceases for a foreign operation, they are realized in the operations related to ac-cumulated translation differences, which are reclassified from the translation reserve in equity to the profit/loss for the year. Where disposal occurs but controlling influence remains, the proportional share of accumulated translation differences from the conversion reserve is transferred to non-controlling interests. In the case of disposal of parts of associates, but significant influence remains, the proportionate share of the translation differences is reclassified to profit for the year.
RevenueThe Group began to apply the new accounting standard IFRS 15 Revenue from Contracts with Customers on January 1 2018. Quant is a supplier of industrial maintenance services whose customers are comprised of industrial facilities such as production factories, pulp and paper mills and mining operations to name a few. Our contracts with customers are commitments to provide services over the period of time specified in the contract. Therefore, our revenues are recognized over the time during which the services are rendered. In some cases, invoices are not sent in the same period as the service delivered which then results in accrued or deferred revenue.
LeasingLeasing policies applied from 1 January 2019When entering an agreement an assessment is made as to whether the agreement is a lease or contains a lease. If the agreement transfers the right for a determined period to control the use of an identified asset the Group recognizes a right-of-use asset and associated liability. Initially the liability is valued at the present value of the remaining lease payments for the estimated lease period, using the value of lease payments discounted at Quant’s marginal borrowing rate for each country of operation. Right-of-use assets are initially valued at the value of the liability plus lease payments paid upon or before the start date, plus any initial direct payments. Such right-of-use asset is depreciated on a straight-line basis over the term of the lease. The term of the lease comprises the non-cancellable period plus additional periods in the agreement if it is deemed at the start date reasonably certain these will be used. No right-of-use asset or lease liability is recognized for leases with a term of 12 months or less or with underlying assets of low value. Lease payments for such leases are recognized as a cost on a straight-line basis over the term of the lease.
Leasing policies applied up until 31 December 2018Expenses relating to operational leasing agreements were re-ported in the income statement on a straight-line basis over the lease term. Benefits received in connection with the signing of an agreement were reported in income statement as a reduction in the leasing charges linearly over the term of the leasing contract. Variable fees are expensed in the periods they arise.
Q U A N T A N N U A L R E P O R T 2 0 1 9
40
Q U A N T A N N U A L R E P O R T
2 0 1 9
Financial income and expensesFinancial income consists of interest income on invested funds and gain on the change in value of financial assets valued at fair value through profit or loss.
Interest income on financial instruments is reported according to the effective interest method (see below). Dividend income is recognized when the right to receive dividends is determined. The result of the disposal of a financial instrument is recognized when the risks and benefits associated with ownership of the instrument are transferred to the buyer and the group no longer has control over the instrument.
Financial expenses consist of interest expenses on loans, the effect of the dissolution of the present value calculation of provisions, loss on changes in value of financial assets valued at fair value through profit or loss, impairment of financial assets and such loss-es on hedging instruments reported in profit or loss for the year. Borrowing costs are recognized in profit or loss using the effective interest method, except to the extent that they are directly attribut-able to the purchase, construction or production of assets that take a significant amount of time to complete for their intended use or sales, in which case they are included in the acquisition value of the assets.
The effective interest rate is the interest rate discounting the estimated future cash receipts and disbursements for the expect-ed maturity of the financial assets or liabilities of the net carrying amount of the asset or liability. The calculation includes all fees paid or received by the contracting parties that are part of the effective interest rate, transaction costs and all other surplus or deficit rates.
TaxesIncome taxes consist of current tax and deferred tax. Income taxes are reported in the income statement except where the underlying transaction is recognized in other comprehensive income or in eq-uity, whereby the related tax effect is recognized in other compre-hensive income or equity.
Current tax is tax that is to be paid or received in the current year, based on the tax rates enacted or substantively enacted at the end of the reporting period, including adjustments of current tax in respect of prior periods.
Deferred tax is calculated using the balance sheet method on the basis of temporary differences between the carrying amounts and the tax values of assets and liabilities. Temporary differences are not taken into consideration that occurred when goodwill was first recognized, nor for the difference arising from the initial recogni-tion of assets and liabilities that are not business combinations that at the time of the transaction do not affect either the accounting taxable profit or loss. Furthermore, temporary differences attribut-able to shares in subsidiaries and associates that are not expected to be reversed in the foreseeable future are also not considered. The valuation of deferred tax is based on how the underlying assets or liabilities are expected to be realized or settled. Deferred tax is calculated by applying the tax rates and tax rules adopted or adopted in practice decided at the reporting date.
Deferred tax assets relating to deductible temporary differences and loss carryforwards are recognized only to the extent that it is probable that they will be utilised. The value of deferred tax assets is reduced when it is no longer deemed likely that they can be utilised.
Any additional income tax arising from dividends is recognized at the same time as the dividend is recognized as a liability.
Financial instrumentsFinancial instruments are any form of contract that gives rise to a financial asset in a company and a financial liability or an equity instrument of another company.
Recognition in and deletion from the statement of financial position A financial asset or financial liability is included in the statement of financial position when the company becomes a party under the contractual terms of the instrument. A claim is raised when the company has performed, and a contractual obligation exists for the counterparty to pay, even if the invoice has not yet been sent. Accounts receivable are included in the statement of financial position when the invoice has been sent. Debt is raised when the counterparty has performed, and contractual obligation exists to pay, even if the invoice has not yet been received. Accounts paya-ble are entered when the invoice is received.
A financial asset is removed from the statement of financial position when the rights in the agreement are realized, expired or the company loses control of them. The same applies to parts of financial assets. A financial liability is removed from the statement of financial position when the contractual obligation is fulfilled or otherwise extinguished. The same applies to parts of financial liabilities.
A financial asset and a financial liability are offset and reported with a net amount in the statement of financial position only when there is a legal right to offset the amounts and that there is an intention to regulate the items with a net amount or to simultaneously realize the asset and settle the debt.
Acquisitions and divestments of financial assets are reported on the trade date. The business day constitutes the date on which the company commits to acquire or divest the asset.
Classification and valuationThe classification of financial instruments are in the following categories: (a) Financial assets valued at fair value through profit or loss, (b) Loan receivables and trade receivables, (c) Financial instruments held to maturity, (d) Financial available-for-sale assets and (e) Other financial liabilities. The classification depends on the purpose for which the instruments were acquired. The manage-ment determines the initial accounts and reconsiders this decision at each reporting date. All financial instruments are reported from the business day.
Classification and measurement of financial assets and liabilities (a) Financial assets valued at fair value through profit or loss. This category has two sub-groups: financial assets held for trading and those which from the outset are attributable to the category valued at fair value through profit or loss for the year. A financial asset is classified in this category if it has been acquired mainly for the purpose of being sold shortly or if this classification is deter-mined by management. Derivative instruments are also categorized as holdings for trading if they are not identified as hedges. Assets in this category are classified as current assets if they are either held for trading or are expected to be realized within 12 months of the balance sheet date.
(b) Loans receivable and Accounts receivableLoan receivables and trade receivables are non-derivative financial assets with fixed or determinable payments that are not quoted on an active market. Characteristically, they arise when the group provides money, goods or services directly to a customer without the intention of trading the resulting receivable. They are included in current assets, except for items with a due date more than 12 months after the balance sheet date, which are classified as fixed assets. Quant’s liquid funds, accounts receivable, accrued income and certain other receivables are included in this category.
(c) Financial assets held to maturityFinancial assets held to maturity are non-derivative financial assets
Q U A N T A N N U A L R E P O R T 2 0 1 9
41
Q U A N T A N N U A L R E P O R T
2 0 1 9
with fixed or determinable payments and fixed maturities for which the group’s management has the intention and ability to retain to maturity. Quant has no financial instruments classified in this category.
(d) Available-for-sale financial assetsFinancial assets not classified in any other category such as shares and participations in both listed and non-listed companies. Quant has no financial instruments classified in this category.
(e) Other financial liabilitiesFinancial liabilities that are not held for trading. Quants borrowing, accounts payable and certain accrued expenses are included in this category.
Liquid fundsLiquid funds consist of cash and immediately available balances of banks and corresponding institutions and short- term liquid invest-ments with a maturity from the acquisition date of less than three months, which are subject to only insignificant risk of fluctuation.
Recognition and measurement of financial instrumentsFinancial assets not recognized at fair value (Loan receivables and trade receivables) are non-derivative financial assets with fixed or determinable payments that are not quoted in an active market. These assets are measured at amortized cost which is determined based on the effective interest rate calculated on the date of acqui-sition. Assets with short maturities are not discounted.
Accounts receivable are recognized at the amount which is expect-ed to be received, i.e. after the deduction of bad debts, assessed individually. Impairment losses on accounts receivable are recog-nized in operating expenses.
Other receivables are classified as non-current receivables if the holding period is longer than one year and if they are shorter than other receivables. A provision for credit losses is made when there are strong indications that the group will not be able to obtain the amounts stated in the original terms of the claims.
Other financial liabilities are reported at amortized cost based on the effective interest method. The acquisition value is the fair value at the time of acquisition. For borrowing, this amount received is reduced for any transaction costs. Accounts payable have a short expected term and are valued without discounting to their nominal amount.
Any gains or losses arising in connection with the disposal of finan-cial instruments or the repurchase of loan liabilities are recognized in items within profit or loss for the year.
Offsetting of financial instrumentsFinancial assets and liabilities are offset against each other and net-ted in the consolidated financial statements in cases where Quant has agreed with the counterparty that the assets and liabilities are to be settled net.
Financial derivative instrumentsFinancial derivatives are initially reported at acquisition value in the statement of financial position, and subsequently at the prevailing market value on the following balance sheet dates. The method of accounting for the resulting gain or loss varies depending on the nature of the hedged interest. Quant’s financial instruments are presented in more detail in note 22.
When a derivative contract is entered into, it is classified as either (1) fair value hedge of a recognized asset or liability (real value hedging), (2) Hedging of a planned transaction or a definitive commitment (cash flow hedge), (3) hedging of a net investment in a foreign company or (4) as a derivative instrument that does not qualify for hedge accounting.
Changes in the market value of derivatives classified as, and qualify
for, fair value hedging and can be determined objectively are re-ported in items within the year’s profit, together with any changes in the market value of the asset or liability that the hedge relates to.
Changes in the fair value of derivatives that are classified as, and qualify for, cash flow hedges and can be determined objectively, are immediately transferred to profit or loss for the year.
Certain derivative transactions do not meet the requirements for hedge accounting in accordance with IFRS although they are fi-nancially justified in accordance with the group’s risk management policy. Changes in the market value of such non-qualifying hedging transactions are recognized immediately in items within profit or loss. This type of transaction occurs in the group.
Quant does not hedge net investments in foreign subsidiaries.
Accumulated translation differencesTranslation differences relating to investments in foreign opera-tions are reported as translation reserves in shareholders’ equity. In the case of sales of foreign operations, accumulated translation differences attributable to divested foreign operations are reported as part of the consolidated result of the divestments.
Property, plant and equipmentProperty, plant and equipment are reported in the group at cost less accumulated depreciation and any impairment losses. The cost includes the purchase price and expenditure directly attribut-able to the asset to bring it into place and in condition to be used in accordance with the purpose of the acquisition. Accounting principles for depreciation are shown below.
Borrowing costs that are directly attributable to the purchase, con-struction or production of assets that take a significant amount of time to complete for their intended use or sale are included in the acquisition value.
Additional expenditureAdditional expenditure is added to the acquisition value only if it is probable that the future economic benefits associated with the as-set will be realized and the cost can be calculated reliably. All other additional expenditure is recognized as an expense in the period in which it arises.
An additional expense is added to the acquisition value if the expenditure relates to the exchange of identified components or parts thereof. Even where new components have been created, the expenditure is added to the acquisition value. Any values of replaced components, or parts of components, not written off are decommissioned and expensed in connection with the exchange. Repairs are expensed continuously.
Depreciation PrinciplesDepreciation is linear over the estimated useful life of the asset.
USEFUL LIFE
IT and office equipment 3-5 years
Machinery and other technical facilities 3-15 years
Intangible assets
GoodwillGoodwill is valued at acquisition value less any accumulated impairment losses. Goodwill is allocated to cash- generating units and is tested at least annually for impairment. Goodwill incurred in the acquisition of associates is included in the carrying amount of participations in associates.
Q U A N T A N N U A L R E P O R T 2 0 1 9
42
Q U A N T A N N U A L R E P O R T
2 0 1 9
Other intangible assetsOther intangible assets acquired by the group consist of client contracts, customer relationships and computer systems and are reported at cost less accumulated amortization (see below) and any impairment losses.
Costs incurred for internally generated goodwill and internally gen-erated trademarks are reported in profit or loss for the year when the cost arises.
Additional expenditureAdditional expenditure on capitalized intangible assets is recog-nized as an asset in the statement of financial position only when they increase the future economic benefits for the specific asset to which they relate. All other expenditure expensed when they arise.
AmortizationAmortization is reported in the income statement on a straight-line basis over the estimated useful lives of intangible assets, unless such useful lives are unquantifiable. The useful life periods are reviewed at least annually. Amortization is recognized as a whole as administrative expenses. Goodwill and other intangible assets with an indefinite useful life or which are not yet ready for use are tested annually for impairment as well as at any point in time when there is an indication that the asset in question has decreased in value. Intangible assets with nondescript useful lives are depreciated from the time they are available for use. The estimated useful life periods are:
USEFUL LIFE
Customer contract 7 years
Customer relations 11 years
IT Licenses 3 years
Software 3-5 years
ImpairmentThe group’s reported assets are assessed at the end of each report-ing period to assess whether there is an indication of an impair-ment requirement. IAS 36 applies to impairment of assets other than financial assets, that are accounted for under IFRS 9 Financial instruments and is described in the Financial Instruments section above.
Write-down of tangible and intangible assets and participations in associated companiesIf there is an indication of impairment, the asset’s recoverable amount is calculated (see below). For goodwill, other intangible assets with indefinite useful lives and intangible assets that are not yet ready for use, the recoverable amount is calculated annually. If it is not possible to determine essentially independent cash flows to an individual asset, and its fair value minus the cost of selling costs cannot be used, the assets are grouped when assessing impairment at the lowest level where it is possible to identify essen-tially independent cash flows – a so-called cash-generating unit.
An impairment loss is recognized when the carrying amount of an asset or a cash-generating unit (group of units) exceeds the recoverable value. An impairment loss is recognized as an expense in profit or loss.
The recoverable amount is the highest of fair value minus selling costs and value in use. In calculating the value, future cash flows are discounted by a discount factor taking into account the risk-free interest rate and the risks associated with the specific asset.
Reversal of impairment lossesAn impairment loss on assets included in the scope of IAS 36 is re-versed if there is both an indication that the impairment no longer exists and there has been a change in the assumptions that formed
the basis for the calculation of the recoverable value. However, impairment of goodwill is never reversed. A reversal is only made to the extent that the carrying amount of the asset after reversal does not exceed the carrying amount that would have been recognized, less depreciation, where applicable, if no impairment was made.
Write-downs of loan receivables and accounts receivables that are recognized at amortized cost are reversed if the earlier reasons for impairment are no longer present and full payment from the customer is expected to be received.
InventoryInventories are valued at the lower of cost and net realizable value. The cost of inventories is calculated by applying the first-in, first-out (FIFO) method and includes expenditure incurred in the acqui-sition of the inventory assets and transporting them to their current location and condition.
Net realizable value is the estimated selling price in the ordinary course of business, after deduction of estimated costs for comple-tion and for the purpose of obtaining a sale.
Payment of capital to the ownersDividends are recognized as a liability after the Annual General Meeting approves the dividend.
Employee BenefitsShort-term remunerationsShort-term employee benefits are calculated without discounting and are recognized as an expense when the related services are received.
A provision is recognized for the expected cost of profit-sharing and bonus payments when the group has an existing legal or con-structive obligation to make such payments as a result of services received from employees and the obligation can be calculated reliably.
Defined contribution pension plansThe plans in which the company’s obligation is limited to the fees that the company has undertaken to pay is classified as a de-fined-contribution pension plan. In such a case, the amount of the employee’s pension depends on the fees paid by the company to the plan or to an insurance company and the return on capital provided by the contributions. Consequently, it is the employee who bears the actuarial risk (that the compensation is lower than expected) and the investment risk (that the assets invested will be insufficient to provide the expected benefits). The company’s obligations for contributions to defined contribution plans are recognized as an expense in the profit or loss for the year as they are earned by the employees carrying out services to the company over a period of time.
Defined benefit pension plansDefined benefit plans are other post-employment benefit plans than defined contribution plans. The group’s net obligation for defined benefit plans is calculated separately for each plan by estimating the future remuneration that employees earned through their employment in both current and previous periods; This compensation is discounted to a present value. The discount rate is the interest rate on the balance sheet date of an investment grade corporate bond, including mortgage bonds, with a maturity corresponding to the group’s pension obligations. When there is no viable market for such corporate bonds, the market rate is instead used on government bonds with a corresponding maturity. The calculation is performed by a qualified actuary, using the Projected Unit Credit Method. Furthermore, the fair value of any plan assets is calculated as of the reporting date.
The group’s net obligation comprises the present value of the obligation, minus the fair value of the plan assets adjusted for any asset constraints.
Q U A N T A N N U A L R E P O R T 2 0 1 9
43
Q U A N T A N N U A L R E P O R T
2 0 1 9
Interest expense/revenue net of the defined benefit obligation/asset is reported in profit or loss for the year during net financial items. Net interest income is based on the interest that arises when discounting the net obligation, i.e. interest on the obligation, plan assets and interest on the effect of any asset constraints. Other components are reported in operating income.
Revaluation effects consist of actuarial gains and losses, difference between the actual return on management assets and the amount included in net interest income and any changes in the effects of asset restrictions (excluding interest Included in net interest income). The revaluation effects are recognized in other compre-hensive income.
When the calculation results in an asset for the group, the carrying amount of the asset is limited to the lower of the surplus in the plan and the asset restriction calculated using the discount rate. The asset restriction is the present value of the future economic benefits in the form of reduced future fees or cash refunds. For the calculation of the present value of future refunds or payments, any requirements for minimum funding are taken into account.
Changes or curtailments of a defined benefit plan are recognized at the earliest of the following dates: A) when the change in the plan or reduction occurs or (b) when the entity reports related re-structuring costs and termination benefits. The changes/reductions are reported directly in profit or loss for the year.
The special payroll tax is part of the actuarial assumptions and is therefore accounted for as part of the net obligation/asset. The part of the special payroll tax that is calculated on the basis of the safeguarding law of a legal person is recognized for reasons of simplification as accrued expense instead of as part of the net obligation/asset.
Return tax is reported on an ongoing basis in profit or loss for the period in which the tax relates and is thus not included in the lia-bility calculation. In the case of funded plans, the tax is charged on the return on plan assets and is recognized in other comprehensive income. In unfunded or partly unfunded plans, the tax is charged to net profit for the year.
Other long-term remunerationsThe group’s net obligation for other long-term benefits, other than pensions, amounts to the value of future benefits that employees have earned as compensation for the services they have per-formed in the current and previous periods. The compensation is discounted to a present value and the fair value of any plan assets is deducted. The discount rate is determined on the same basis as for defined benefit pension plans. The calculation is done with the so-called “projected unit credit method”. Any actuarial gains or losses are recognized in the income for the year in the period in which they arise.
Termination benefitsA cost of remuneration in connection with redundancies is recog-nized at first when the company can no longer withdraw the offer to the employees or when the company recognizes restructuring costs. The benefits that are expected to be settled after 12 months are reported at its present value. Benefits that are not expected to be settled entirely within twelve months are reported according to long-term benefits.
ProvisionsA provision differs from other debts in that there is uncertainty about the period of payment or the amount to regulate the provi-sion. A provision is recognized in the statement of financial position when there is an existing legal or constructive obligation as a result of a past even, and it is probable that an outflow of financial resources will be required to regulate the obligation and a reliable estimate of the amount can be made.
Provisions are made with the amount that is the best estimate of what is required to settle the existing obligation at the balance sheet date. Where the effect of when payment is made is material, provisions are calculated by discounting the expected future cash flow at a pre-tax rate that reflects current market assessments of the time value of money and, if applicable, the risks associated with the debt.
A provision for restructuring is recognized when the Group has adopted a comprehensive and formal restructuring plan, and the restructuring has either been started or published. No provisions are made for future operating expenses.
Discontinued operationsTo qualify as Discontinued operations, an entity or operational segment of the Quant Group must be classified as held for sale or be part of a plan to dispose of the entity or operational segment. In May of 2019 Quant has taken the decision to sell or discontinue operations in a number of countries and these are reported as Dis-continued operations in the Statement of Consolidated Compre-hensive Income and Statement of Consolidated Cash Flows with historical comparisons. The Consolidated Statement of Financial Position reports Assets and liabilities for Discontinued operations in the current year, with no historical comparisons. For further infor-mation see Consolidated financial statements and notes.
Contingent liabilitiesA contingent liability is recognized when there is a possible commitment arising from past events and whose existence is confirmed only by one or more uncertain future events outside the group’s control or when there is a commitment that is not recog-nized as a liability or provision because it is not probable that an outflow of resources will be required or cannot be calculated with sufficient reliability.
Earnings per shareCalculation of earnings per share is based on consolidated profit or loss for the period attributable to shareholders of the parent and on the weighted average number of outstanding shares during the period. The Group does not have any employees share plans or other type of share program that would cause a dilutive effect on ordinary shares. Therefore, Earnings per share after dilution is not calculated.
Parent Company Accounting PoliciesThe parent company has prepared its annual report in accordance with the Swedish Annual Accounts Act (1995:1554) and the Swedish Financial Reporting Board’s recommendation RFR 2 Accounting for legal entities. Statements issued by the Swedish Financial Report-ing Board for listed companies are also applied. RFR 2 means that the parent company in the annual report of the legal entity shall apply all IFRS and statements adopted by the EU as far as possible within the framework of the Annual Accounts Act, the Security Law and with regard to the relationship between accounting and taxa-tion. The recommendation specifies the exceptions and additions to IFRS which should be made.
Differences between the group’s and the parent company’s accounting policiesThe differences between the group’s and the parent company’s accounting principles are shown below. The accounting principles for the parent company described below have been applied con-sistently to all periods presented in the parent company’s financial statements.
Classification and presentation formsThe income statement and statement of financial position are for the parent company in accordance with the annual Accounts Act schedule, while the statement of income and other comprehen-sive income, the statement of changes in equity and the cash flow analysis is based on IAS 1 Presentation of Financial statements and IAS 7 Statement of Cashflows.
Q U A N T A N N U A L R E P O R T 2 0 1 9
44
Q U A N T A N N U A L R E P O R T
2 0 1 9
The differences with the group’s reports that are made in the parent company’s income statement and statement of financial position consist mainly of accounting for financial income and ex-penses, fixed assets, equity and the existence of provisions as own heading in the statement of financial position.
SubsidiariesShares in subsidiaries are reported in the parent company accord-ing to the cost method. This means that transaction expenses are included in the carrying amount of investments in subsidiaries. In the consolidated financial statements, transaction expenses attrib-utable to subsidiaries are reported directly in the result when these are incurred.
Financial instrumentsAs a result of the relationship between accounting and taxation, the rules on financial instruments is not applied in the parent com-pany as a legal entity.
In the parent company, financial fixed assets are valued at cost less any impairment losses and financial current assets according to the lowest value principle. The acquisition value of interest-bearing instruments is adjusted for the accrued difference between what was initially paid, after deduction of transaction costs, and the amount paid on the due date (premium or discount).
Anticipated dividendsAnticipated dividends from subsidiaries are reported in cases where the parent company has the right to decide on the size of the dividend and the parent company has decided on the size of the dividend before the parent company publishes its financial statements.
Tangible fixed AssetsTangible fixed assets in the parent company are reported at cost less accumulated depreciation and any impairment losses in the same way as for the group but with additions for any write-ups.
Leased assetsThe new policies on leases, in accordance with IFRS 16, that went into effect on 1 January 2019 and which the Group complies with, are applied also by the parent company.
Group contributionsGroup contributions are reported as financial appropriation.
Note 2. Estimates and assessments
The estimates and assessments that Quant’s management and Board of Directors mentioned below are those that are deemed most important to obtain an understanding of Quant’s financial reporting. The information is limited to areas that are essential, taking into account the degree of impact and underlying security. Estimates and assessments are based on historical experience and assumptions that management and the Board of Directors consider reasonable under the relevant circumstances. Drawn conclusions form the basis of the carrying amounts of assets and liabilities, where these cannot be determined by information from other sources. Actual outcome may differ from these through estimates and assessments.
Customer contractsQuant’s source of revenues consists mostly of fixed price contracts but also current hourly price contracts. Performance is assessed in relation to the terms of the contract. In order to determine the amounts to be recognized and whether reservations for losses is to be made, the total contract costs are assessed and the proportion of the contract that has been completed.
Pension obligationsWithin the group, defined benefit pension plans have significant commitments for future benefits to current and former staff. To carry out the calculation of the pension liability, actuarial assump-tions are of great importance for the outcome of the calculation. The assessments mainly concern the discount rate on commit-ments and expected return on plan assets, but also assumptions about the rate of wage increases, staff turnover and estimated life expectancy. A reduced discount rate increases the reported pen-sion liability. The actual outcome may deviate from the accounts in the case where the assumptions applied have been shown to be incorrect.
Intangible assetsIntangible assets mainly refer to goodwill, customer contracts and customer relations. Goodwill with an indefinite life expectancy is not subject to annual depreciation. Insofar as the underlying activ-ities develop negatively, an impairment loss may arise. An impair-ment test is carried out annually mainly based on the value of use, with assumptions about sales development, profit margins, current investments, changes in working capital and more.
Note 3. Financial risk management framework
Through its operations, Quant is exposed to a number of different financial risks: market risk (primarily currency risk and interest rate risk), financing risk, credit risk and liquidity risk. Financial risks arise when refinancing and credit risks as well as changes in interest rates and exchange rates affect the group’s earnings, cash flow and value.
Quant has a central treasury function whose overall objective is to act as the group’s internal bank, to provide a cost-effective and sta-ble financing of the group, manage interest rate and currency risks and ensure effective liquidity management for the group. Treasury identifies, evaluates and mitigates financial risks in close co-opera-tion with the group’s operating units.
Quant has a finance policy approved by the Board whose purpose is to limit the financial risks that Quant is exposed to and determine how financial risks are to be controlled and managed. The financial policy is revised annually. Risk management and financing activities are reported continuously to management and the Board of Direc-tors. The Board reviews and decides on strategies for managing financial risks as summarized below.
Market risk
Currency riskQuant’s operations are conducted in countries all over the world. The group is thereby exposed to currency risks, both through transactions in foreign currencies and through the translation of income statements and balance sheets into euro. Quant’s assets are contracts for the outsourcing of industrial maintenance, which generate revenues and costs mainly in CLP, EUR, SEK and USD but there is also exposure in other currencies. Changes in exchange rates in the aforementioned non-euro currencies thus entail chang-es in Quant’s operating profit.
Sensitivity analysis exchange rate risk Assuming that the currencies, significant for Quant’s earnings and cash flow, are weakened by 10% against the group’s functional currency, the group’s EBITDA is affected by 10% (8%). The corre-sponding effect on external borrowing in non-functional currency amounts to 0% (0%).
Q U A N T A N N U A L R E P O R T 2 0 1 9
45
Q U A N T A N N U A L R E P O R T
2 0 1 9
Transaction exposureThe group is exposed to different types of currency risks. Transac-tion exposure is derived from the group’s sales and purchases in foreign currencies. These currency risks consist partly of the risk of fluctuations in the value of accounts receivable or accounts paya-ble, and the currency risk in expected and contracted cash flows.
Quant’s operations are largely local in the countries where the group is active. This means that the transaction exposure risk is limited for the group. Quant’s finance policy stipulates no minimum for currency hedging of transaction exposure. At the end of the year Quant had no transaction exposure derivatives outstanding. The group’s treasury function evaluates the ongoing transaction exposure risk and proposes hedging strategies.
Translation exposuresCurrency risks are also found in the translation of foreign subsid-iaries’ assets and liabilities to the parent company’s functional currency. Quant’s exposure to translation risk arises because a large proportion of the subsidiaries have a functional currency that deviates from the accounting currency of the group. In accordance with the financial policy, Quant had not hedged the translation exposure at the end of the financial year.
Financial currency exposureThe group is also exposed to currency risks with respect to payment flows for loans and investments in foreign currency. In accordance with the finance policy, the goal is to limit currency effects on financial investments and loans. Group companies lend and deposit liquidity internally in the local currency of the respec-tive borrowers to the extent possible, depending on the local currency regulations and/or the convertibility of the currencies. The net exposure of financial assets and liabilities is centralized to the parent company and currency is hedged according to the group’s finance policy. At the end of the period, Quant had financial hedge derivatives outstanding at a nominal value of EUR 0.0 (0.9) million.
Interest rate riskInterest rate risk is the risk that market rates fluctuate in such a way that Quant’s net interest expense develops negatively. The effect on the group’s result of a change in interest rates depends on the fixation periods of the loans and investments and the current share of fixed and variable interest rates. Since the group does not hold any significant interest-bearing assets, in addition to bank bal-ances, the group’s income from operating activities is essentially independent of changes in market interest rates. Quant is exposed to interest rate risk through interest-bearing borrowing, which is one of the group’s sources of finance in addition to equity and cash flow from operating activities. Interest-bearing borrowing consists mainly of centrally agreed bonds, which run on fixed interest rates. In order to limit interest rate risk, Quant has the policy option of concluding interest rate derivatives in order to reduce the effects of future interest fluctuations by changing parts of variable interest rates at a fixed rate. On December 31, 2019 there were no such interest rate derivative outstanding.
The average fixation period for the group’s borrowings (excluding external and shareholder loans) at the end of 2019 was 3.0 (3.9) years. On the basis of interest rate exposure as of December 31, 2019, a change in market interest rates of one percentage point would affect the group’s net financial items by EUR +/- 0.0 (0.0) million. The simulation assumes a parallel shift of all interest rate curves and does not take into account any currency and maturity differences.
Credit riskThe credit risk on financial assets, such as liquid assets and trading in financial instruments, is limited to credit risk for the banks where the group has bank accounts, and with which the group trades in financial instruments. The group’s liquidity is concentrated, accord-ing to the finance policy, to the parent company and banks with a high rating. The liquidity that remains in the group companies within Quant is usually spread evenly across companies and thus evenly spread on different banks in different geographical areas.
Liquidity risk and financing riskLiquidity risk is defined as the risk that Quant cannot fulfil its obli-gations to pay debts on time or at a reasonable cost. The group’s capital management aims to create a balance between equity and loan financing so that financing of operations is secured at a reasonable cost of capital. The aim is to finance growth and normal investments with own generated cash flow as far as possible. Risks are managed centrally for the entire group by the central treasury function. The group’s goal is to always have sufficient funds in available liquidity and unused loan facilities, a so-called liquidity reserve, to cover 45 days of the group’s disbursement needs. Li-quidity is monitored continuously to meet expected disbursement needs.
Refinancing is defined as the risk that financing or refinancing is difficult or costly to obtain. Quant has access to funding through the money market and the Board of Directors continuously moni-tors and evaluates the group’s financing and refinancing possibili-ties over time.
Financial covenantsThe group’s bonds and its bank facility contain financial commit-ments, so called covenants, where the group has committed to maintain financial ratios. The bond agreements contain covenants where the group’s borrowing against the result does not exceed certain ratios. These covenants are measured only under certain circumstances. The working capital facility contains covenants where drawn working capital facility loans against the group’s re-sults may not exceed certain ratios and which are measured quar-terly in connection with the quarterly report. The bond and facility agreements are also restrictive in relation to, inter alia, borrowings, the establishment of security or guarantees, acquisitions and sales of companies.
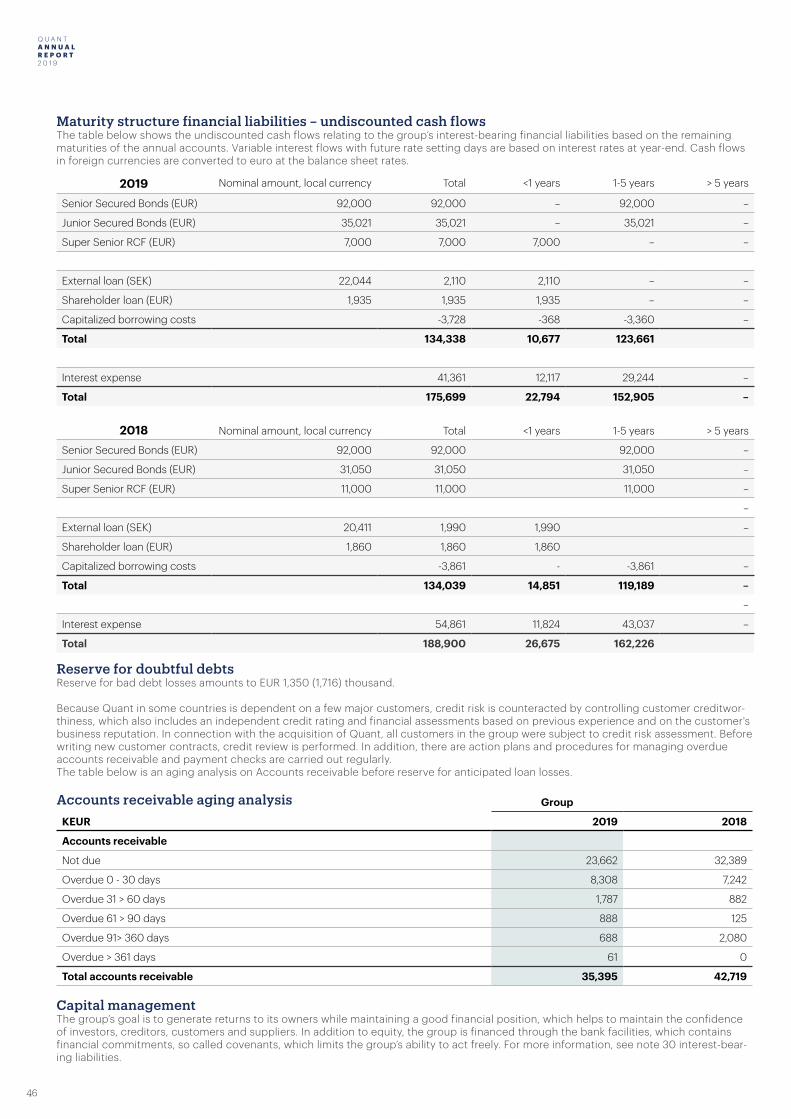
Q U A N T A N N U A L R E P O R T 2 0 1 9
46
Q U A N T A N N U A L R E P O R T
2 0 1 9
2019 Nominal amount, local currency Total <1 years 1-5 years > 5 years
Senior Secured Bonds (EUR) 92,000 92,000 – 92,000 –
Junior Secured Bonds (EUR) 35,021 35,021 – 35,021 –
Super Senior RCF (EUR) 7,000 7,000 7,000 – –
External loan (SEK) 22,044 2,110 2,110 – –
Shareholder loan (EUR) 1,935 1,935 1,935 – –
Capitalized borrowing costs -3,728 -368 -3,360 –
Total 134,338 10,677 123,661
Interest expense 41,361 12,117 29,244 –
Total 175,699 22,794 152,905 –
2018 Nominal amount, local currency Total <1 years 1-5 years > 5 years
Senior Secured Bonds (EUR) 92,000 92,000 92,000 –
Junior Secured Bonds (EUR) 31,050 31,050 31,050 –
Super Senior RCF (EUR) 11,000 11,000 11,000 –
–
External loan (SEK) 20,411 1,990 1,990 –
Shareholder loan (EUR) 1,860 1,860 1,860
Capitalized borrowing costs -3,861 - -3,861 –
Total 134,039 14,851 119,189 –
–
Interest expense 54,861 11,824 43,037 –
Total 188,900 26,675 162,226
Maturity structure financial liabilities – undiscounted cash flowsThe table below shows the undiscounted cash flows relating to the group’s interest-bearing financial liabilities based on the remaining maturities of the annual accounts. Variable interest flows with future rate setting days are based on interest rates at year-end. Cash flows in foreign currencies are converted to euro at the balance sheet rates.
Reserve for doubtful debtsReserve for bad debt losses amounts to EUR 1,350 (1,716) thousand.
Because Quant in some countries is dependent on a few major customers, credit risk is counteracted by controlling customer creditwor-thiness, which also includes an independent credit rating and financial assessments based on previous experience and on the customer's business reputation. In connection with the acquisition of Quant, all customers in the group were subject to credit risk assessment. Before writing new customer contracts, credit review is performed. In addition, there are action plans and procedures for managing overdue accounts receivable and payment checks are carried out regularly.The table below is an aging analysis on Accounts receivable before reserve for anticipated loan losses.
Accounts receivable aging analysis Group
KEUR 2019 2018
Accounts receivable
Not due 23,662 32,389
Overdue 0 - 30 days 8,308 7,242
Overdue 31 > 60 days 1,787 882
Overdue 61 > 90 days 888 125
Overdue 91> 360 days 688 2,080
Overdue > 361 days 61 0
Total accounts receivable 35,395 42,719
Capital managementThe group’s goal is to generate returns to its owners while maintaining a good financial position, which helps to maintain the confidence of investors, creditors, customers and suppliers. In addition to equity, the group is financed through the bank facilities, which contains financial commitments, so called covenants, which limits the group’s ability to act freely. For more information, see note 30 interest-bear-ing liabilities.
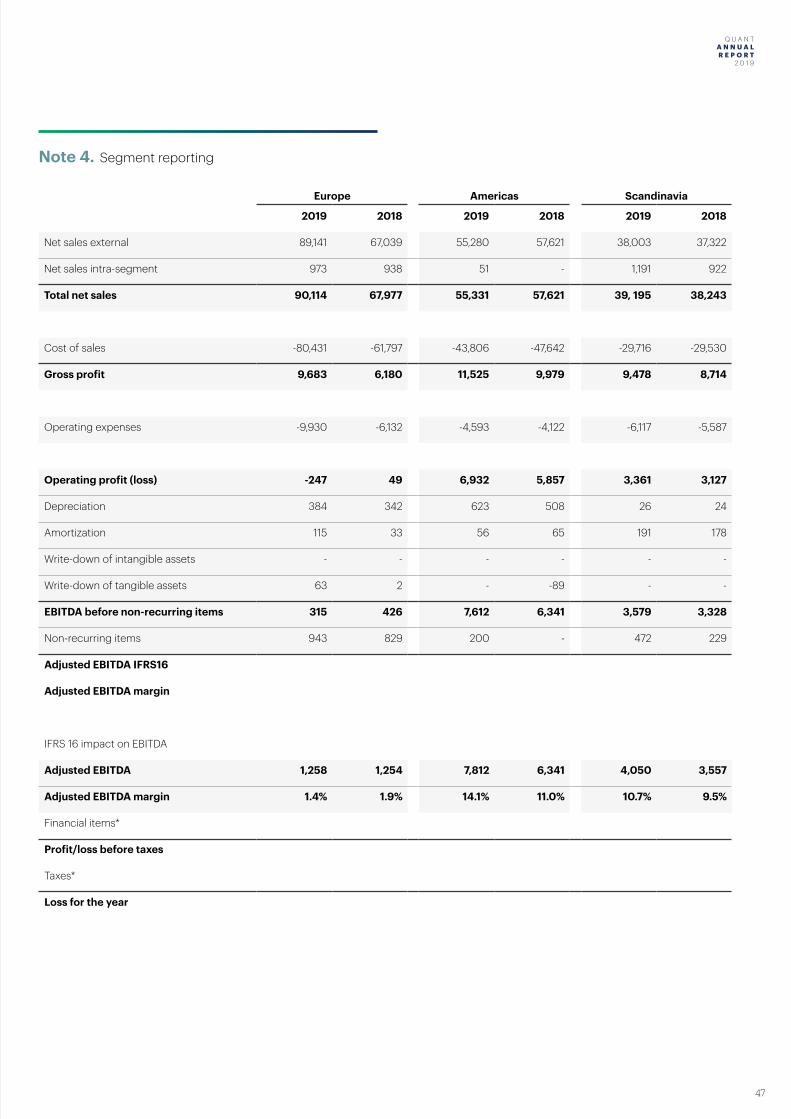
Q U A N T A N N U A L R E P O R T 2 0 1 9
47
Q U A N T A N N U A L R E P O R T
2 0 1 9
Note 4. Segment reporting
Europe Americas Scandinavia
2019 2018 2019 2018 2019 2018
Net sales external 89,141 67,039 55,280 57,621 38,003 37,322
Net sales intra-segment 973 938 51 - 1,191 922
Total net sales 90,114 67,977 55,331 57,621 39, 195 38,243
Cost of sales -80,431 -61,797 -43,806 -47,642 -29,716 -29,530
Gross profit 9,683 6,180 11,525 9,979 9,478 8,714
Operating expenses -9,930 -6,132 -4,593 -4,122 -6,117 -5,587
Operating profit (loss) -247 49 6,932 5,857 3,361 3,127
Depreciation 384 342 623 508 26 24
Amortization 115 33 56 65 191 178
Write-down of intangible assets - - - - - -
Write-down of tangible assets 63 2 - -89 - -
EBITDA before non-recurring items 315 426 7,612 6,341 3,579 3,328
Non-recurring items 943 829 200 - 472 229
Adjusted EBITDA IFRS16
Adjusted EBITDA margin
IFRS 16 impact on EBITDA
Adjusted EBITDA 1,258 1,254 7,812 6,341 4,050 3,557
Adjusted EBITDA margin 1.4% 1.9% 14.1% 11.0% 10.7% 9.5%
Financial items*
Profit/loss before taxes
Taxes*
Loss for the year
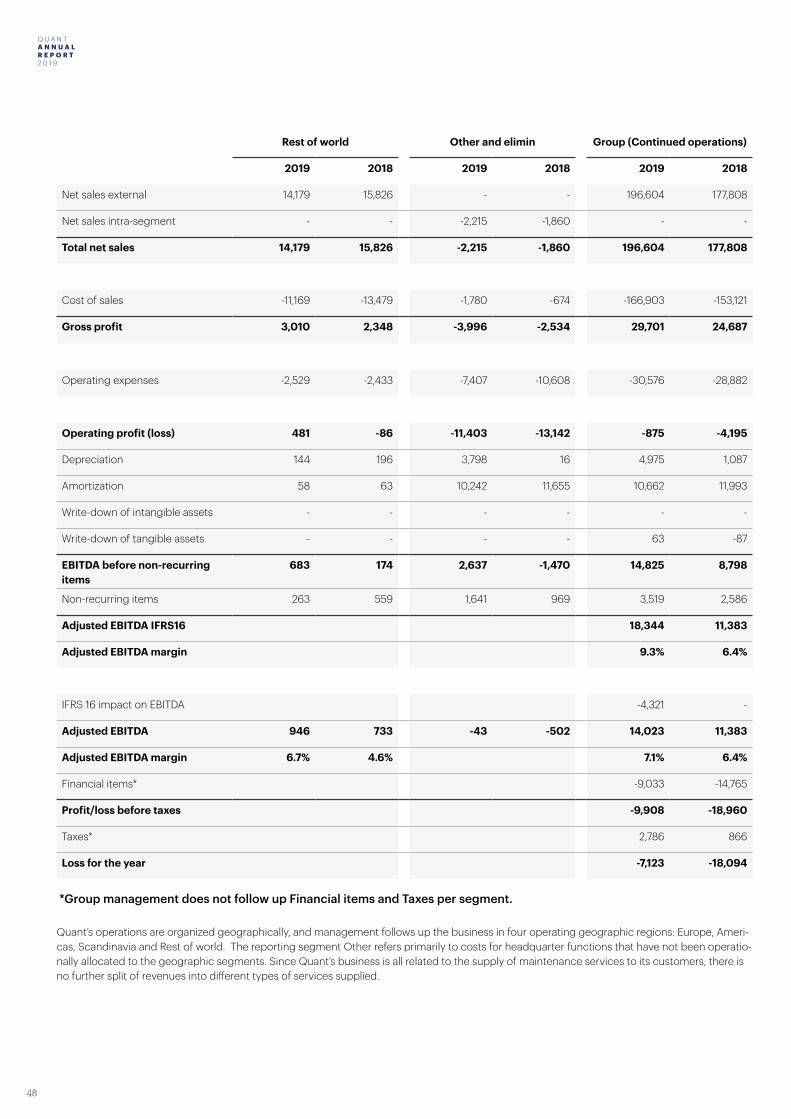
Q U A N T A N N U A L R E P O R T 2 0 1 9
48
Q U A N T A N N U A L R E P O R T
2 0 1 9
Quant’s operations are organized geographically, and management follows up the business in four operating geographic regions: Europe, Ameri-cas, Scandinavia and Rest of world. The reporting segment Other refers primarily to costs for headquarter functions that have not been operatio-nally allocated to the geographic segments. Since Quant’s business is all related to the supply of maintenance services to its customers, there is no further split of revenues into different types of services supplied.
Rest of world Other and elimin Group (Continued operations)
2019 2018 2019 2018 2019 2018
Net sales external 14,179 15,826 - - 196,604 177,808
Net sales intra-segment - - -2,215 -1,860 - -
Total net sales 14,179 15,826 -2,215 -1,860 196,604 177,808
Cost of sales -11,169 -13,479 -1,780 -674 -166,903 -153,121
Gross profit 3,010 2,348 -3,996 -2,534 29,701 24,687
Operating expenses -2,529 -2,433 -7,407 -10,608 -30,576 -28,882
Operating profit (loss) 481 -86 -11,403 -13,142 -875 -4,195
Depreciation 144 196 3,798 16 4,975 1,087
Amortization 58 63 10,242 11,655 10,662 11,993
Write-down of intangible assets - - - - - -
Write-down of tangible assets - - - - 63 -87
EBITDA before non-recurring items
683 174 2,637 -1,470 14,825 8,798
Non-recurring items 263 559 1,641 969 3,519 2,586
Adjusted EBITDA IFRS16 18,344 11,383
Adjusted EBITDA margin 9.3% 6.4%
IFRS 16 impact on EBITDA -4,321 -
Adjusted EBITDA 946 733 -43 -502 14,023 11,383
Adjusted EBITDA margin 6.7% 4.6% 7.1% 6.4%
Financial items* -9,033 -14,765
Profit/loss before taxes -9,908 -18,960
Taxes* 2,786 866
Loss for the year -7,123 -18,094
*Group management does not follow up Financial items and Taxes per segment.
Q U A N T A N N U A L R E P O R T 2 0 1 9
49
Q U A N T A N N U A L R E P O R T
2 0 1 9
Note 5. Revenue
From 1 January 2018 the Group complies with the new revenue recognition standard IFRS 15 Revenue from Contracts with Cus-tomers. The new standard has not produced any material effect on the financial statements except for the additional disclosure requirements. In our contracts with our customers we commit to performing maintenance and managerial services over an agreed upon period of time and revenue is recognized over the period of time during which these services are rendered.
Within certain contracts Quant performs services in the form of management of subcontractors, spare parts and repair compo-nents. This type of inventory passes through Quant’s ownership with no profit generated on this type of transaction. Consequently, Quant does not recognize this inventory turnover as a separate revenue category and only recognizes the revenue generated from the managerial services rendered to the customer.
Contract Assets and Contract LiabilitiesQuant typically invoices customers in the same period as the service is performed. The revenue is thus recognized in the same period as the invoicing occurs, resulting in limited Contract assets. In some cases, however, invoicing happens in a subsequent period to when the service is performed, resulting in a contract asset. This is recorded as Accrued income in the balance sheet (see note 26). In some instances, Quant invoices the customer in advance of per-forming the service, resulting in Contract liabilities. This is recorded as Deferred income in the balance sheet (see note 31).
In addition, some contracts are invoiced at a monthly fixed price but have substantial variation during the year in fulfilment of the related performance obligations. This results in either contract assets or contract liabilities during the year but has an immaterial impact on the year-end result.
Order backlog (Unfulfilled performance obliga-tions)Quant’s customer contracts mainly consist of multi-year contracts, where the customer may or may not have the possibility to termi-nate prematurely. To give an accurate view of the order backlog, it is management’s view that a better representation than the aggre-gate value of all contract revenue is the Contract portfolio. Quant’s definition of contract portfolio is the annualized value of current customer contracts, adjusted for
• Signed new contracts, included at date of contract signing, irrespective of start date
• Terminated contracts, excluded at date of formal notification, irrespective of end date
• Changes formally agreed with the customers of existing con-tracts, included at date of agreement. This includes changes due to renewals of contracts or other reasons
At 31 December 2019, Quant’s contract portfolio was EUR 187.0 (205.5) million
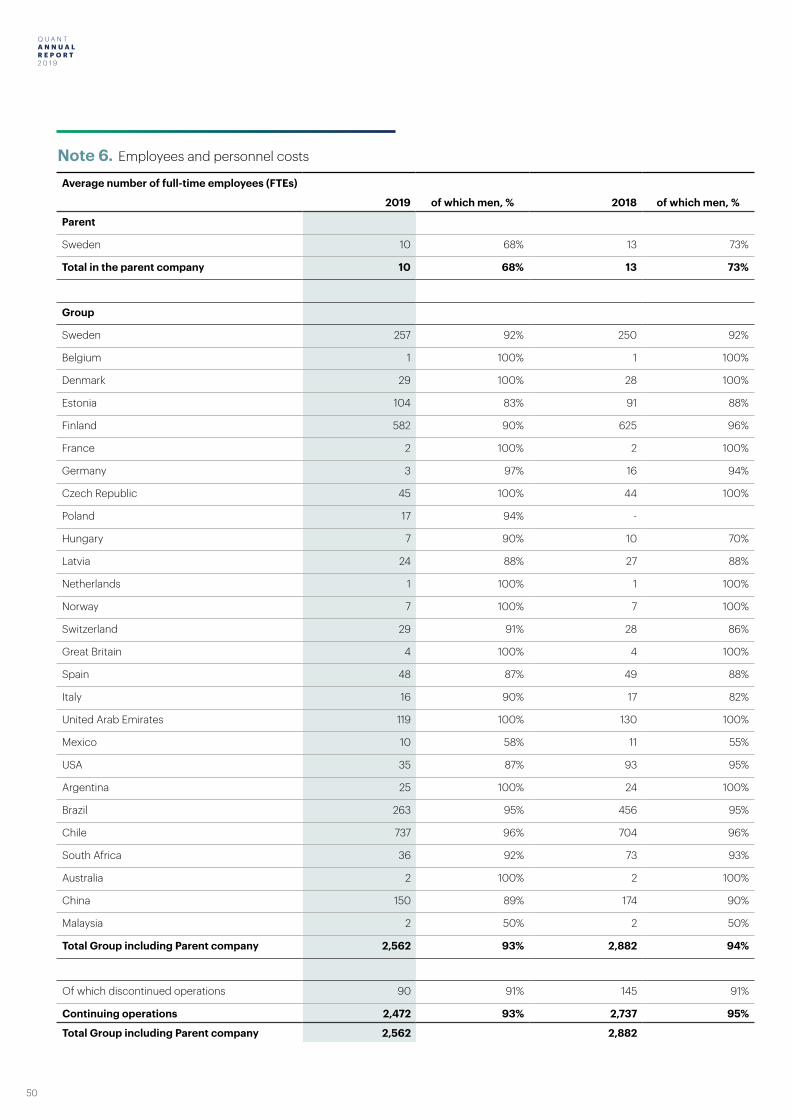
Q U A N T A N N U A L R E P O R T 2 0 1 9
50
Q U A N T A N N U A L R E P O R T
2 0 1 9
Note 6. Employees and personnel costs
Average number of full-time employees (FTEs)
2019 of which men, % 2018 of which men, %
Parent
Sweden 10 68% 13 73%
Total in the parent company 10 68% 13 73%
Group
Sweden 257 92% 250 92%
Belgium 1 100% 1 100%
Denmark 29 100% 28 100%
Estonia 104 83% 91 88%
Finland 582 90% 625 96%
France 2 100% 2 100%
Germany 3 97% 16 94%
Czech Republic 45 100% 44 100%
Poland 17 94% -
Hungary 7 90% 10 70%
Latvia 24 88% 27 88%
Netherlands 1 100% 1 100%
Norway 7 100% 7 100%
Switzerland 29 91% 28 86%
Great Britain 4 100% 4 100%
Spain 48 87% 49 88%
Italy 16 90% 17 82%
United Arab Emirates 119 100% 130 100%
Mexico 10 58% 11 55%
USA 35 87% 93 95%
Argentina 25 100% 24 100%
Brazil 263 95% 456 95%
Chile 737 96% 704 96%
South Africa 36 92% 73 93%
Australia 2 100% 2 100%
China 150 89% 174 90%
Malaysia 2 50% 2 50%
Total Group including Parent company 2,562 93% 2,882 94%
Of which discontinued operations 90 91% 145 91%
Continuing operations 2,472 93% 2,737 95%
Total Group including Parent company 2,562 2,882
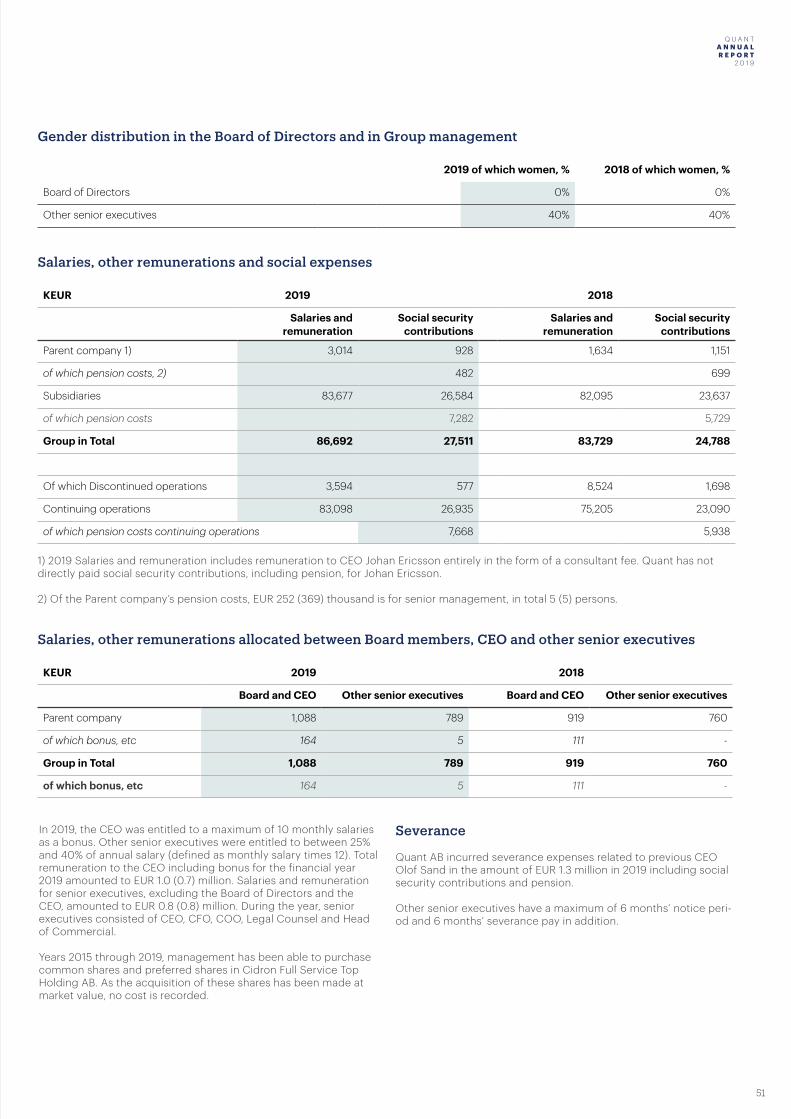
Q U A N T A N N U A L R E P O R T 2 0 1 9
51
Q U A N T A N N U A L R E P O R T
2 0 1 9
Gender distribution in the Board of Directors and in Group management
2019 of which women, % 2018 of which women, %
Board of Directors 0% 0%
Other senior executives 40% 40%
Salaries, other remunerations and social expenses
KEUR 2019 2018
Salaries and remuneration
Social security contributions
Salaries and remuneration
Social security contributions
Parent company 1) 3,014 928 1,634 1,151
of which pension costs, 2) 482 699
Subsidiaries 83,677 26,584 82,095 23,637
of which pension costs 7,282 5,729
Group in Total 86,692 27,511 83,729 24,788
Of which Discontinued operations 3,594 577 8,524 1,698
Continuing operations 83,098 26,935 75,205 23,090
of which pension costs continuing operations 7,668 5,938
1) 2019 Salaries and remuneration includes remuneration to CEO Johan Ericsson entirely in the form of a consultant fee. Quant has not directly paid social security contributions, including pension, for Johan Ericsson.
2) Of the Parent company’s pension costs, EUR 252 (369) thousand is for senior management, in total 5 (5) persons.
Salaries, other remunerations allocated between Board members, CEO and other senior executives
KEUR 2019 2018
Board and CEO Other senior executives Board and CEO Other senior executives
Parent company 1,088 789 919 760
of which bonus, etc 164 5 111 -
Group in Total 1,088 789 919 760
of which bonus, etc 164 5 111 -
In 2019, the CEO was entitled to a maximum of 10 monthly salaries as a bonus. Other senior executives were entitled to between 25% and 40% of annual salary (defined as monthly salary times 12). Total remuneration to the CEO including bonus for the financial year 2019 amounted to EUR 1.0 (0.7) million. Salaries and remuneration for senior executives, excluding the Board of Directors and the CEO, amounted to EUR 0.8 (0.8) million. During the year, senior executives consisted of CEO, CFO, COO, Legal Counsel and Head of Commercial.
Years 2015 through 2019, management has been able to purchase common shares and preferred shares in Cidron Full Service Top Holding AB. As the acquisition of these shares has been made at market value, no cost is recorded.
Severance Quant AB incurred severance expenses related to previous CEO Olof Sand in the amount of EUR 1.3 million in 2019 including social security contributions and pension.
Other senior executives have a maximum of 6 months’ notice peri-od and 6 months’ severance pay in addition.
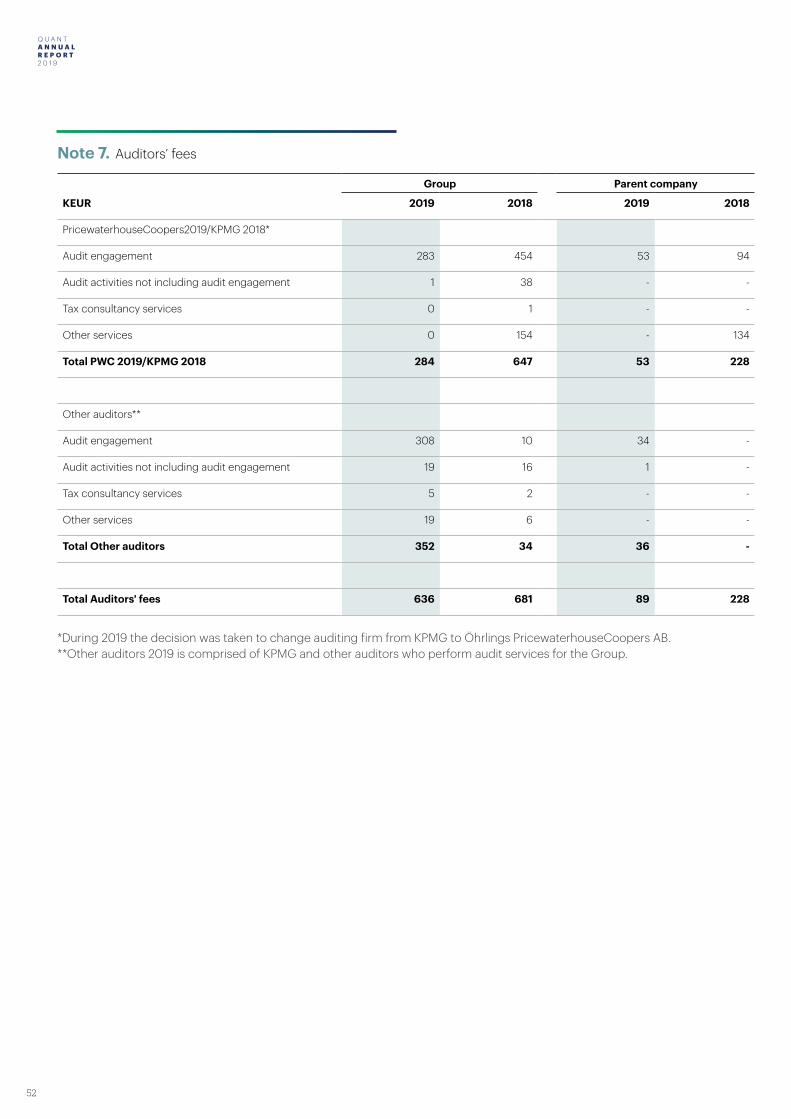
Q U A N T A N N U A L R E P O R T 2 0 1 9
52
Q U A N T A N N U A L R E P O R T
2 0 1 9
Note 7. Auditors’ fees
Group Parent company
KEUR 2019 2018 2019 2018
PricewaterhouseCoopers2019/KPMG 2018*
Audit engagement 283 454 53 94
Audit activities not including audit engagement 1 38 - -
Tax consultancy services 0 1 - -
Other services 0 154 - 134
Total PWC 2019/KPMG 2018 284 647 53 228
Other auditors**
Audit engagement 308 10 34 -
Audit activities not including audit engagement 19 16 1 -
Tax consultancy services 5 2 - -
Other services 19 6 - -
Total Other auditors 352 34 36 -
Total Auditors' fees 636 681 89 228
*During 2019 the decision was taken to change auditing firm from KPMG to Öhrlings PricewaterhouseCoopers AB.**Other auditors 2019 is comprised of KPMG and other auditors who perform audit services for the Group.
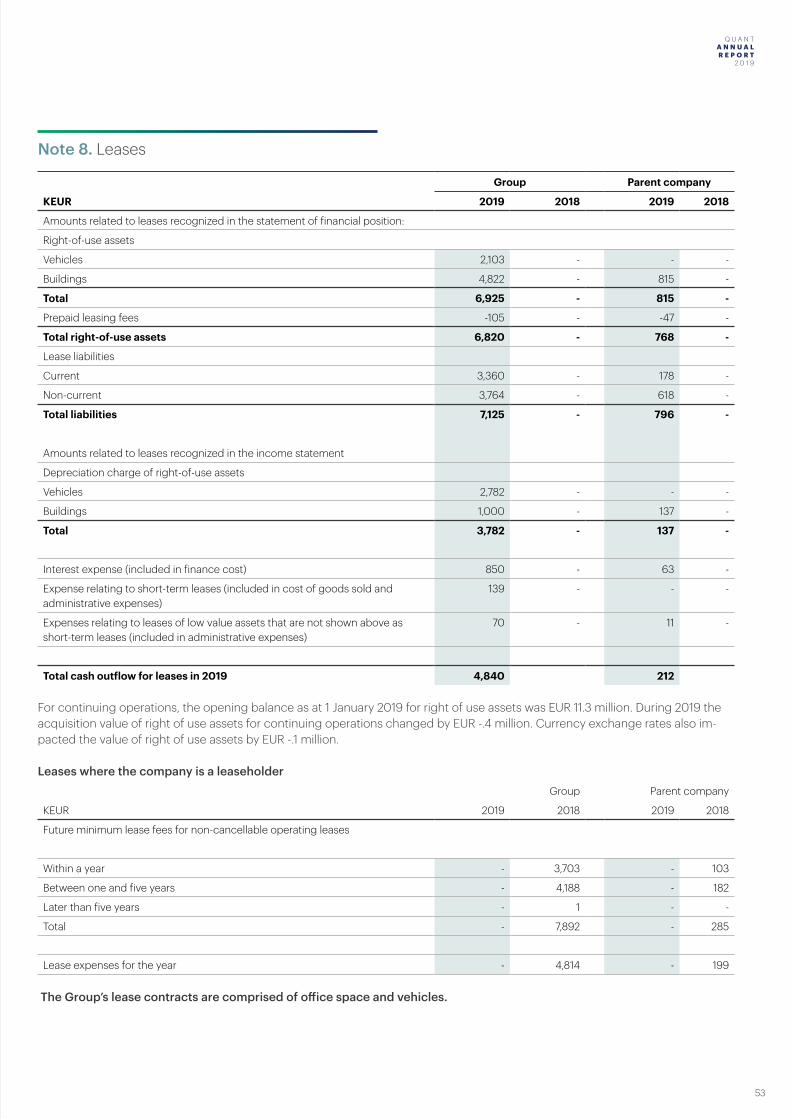
Q U A N T A N N U A L R E P O R T 2 0 1 9
53
Q U A N T A N N U A L R E P O R T
2 0 1 9
Note 8. Leases
Group Parent company
KEUR 2019 2018 2019 2018
Amounts related to leases recognized in the statement of financial position:
Right-of-use assets
Vehicles 2,103 - - -
Buildings 4,822 - 815 -
Total 6,925 - 815 -
Prepaid leasing fees -105 - -47 -
Total right-of-use assets 6,820 - 768 -
Lease liabilities
Current 3,360 - 178 -
Non-current 3,764 - 618 -
Total liabilities 7,125 - 796 -
Amounts related to leases recognized in the income statement
Depreciation charge of right-of-use assets
Vehicles 2,782 - - -
Buildings 1,000 - 137 -
Total 3,782 - 137 -
Interest expense (included in finance cost) 850 - 63 -
Expense relating to short-term leases (included in cost of goods sold and administrative expenses)
139 - - -
Expenses relating to leases of low value assets that are not shown above as short-term leases (included in administrative expenses)
70 - 11 -
Total cash outflow for leases in 2019 4,840 212 For continuing operations, the opening balance as at 1 January 2019 for right of use assets was EUR 11.3 million. During 2019 the acquisition value of right of use assets for continuing operations changed by EUR -.4 million. Currency exchange rates also im-pacted the value of right of use assets by EUR -.1 million.
Leases where the company is a leaseholderGroup Parent company
KEUR 2019 2018 2019 2018
Future minimum lease fees for non-cancellable operating leases
Within a year - 3,703 - 103
Between one and five years - 4,188 - 182
Later than five years - 1 - -
Total - 7,892 - 285
Lease expenses for the year - 4,814 - 199
The Group’s lease contracts are comprised of office space and vehicles.
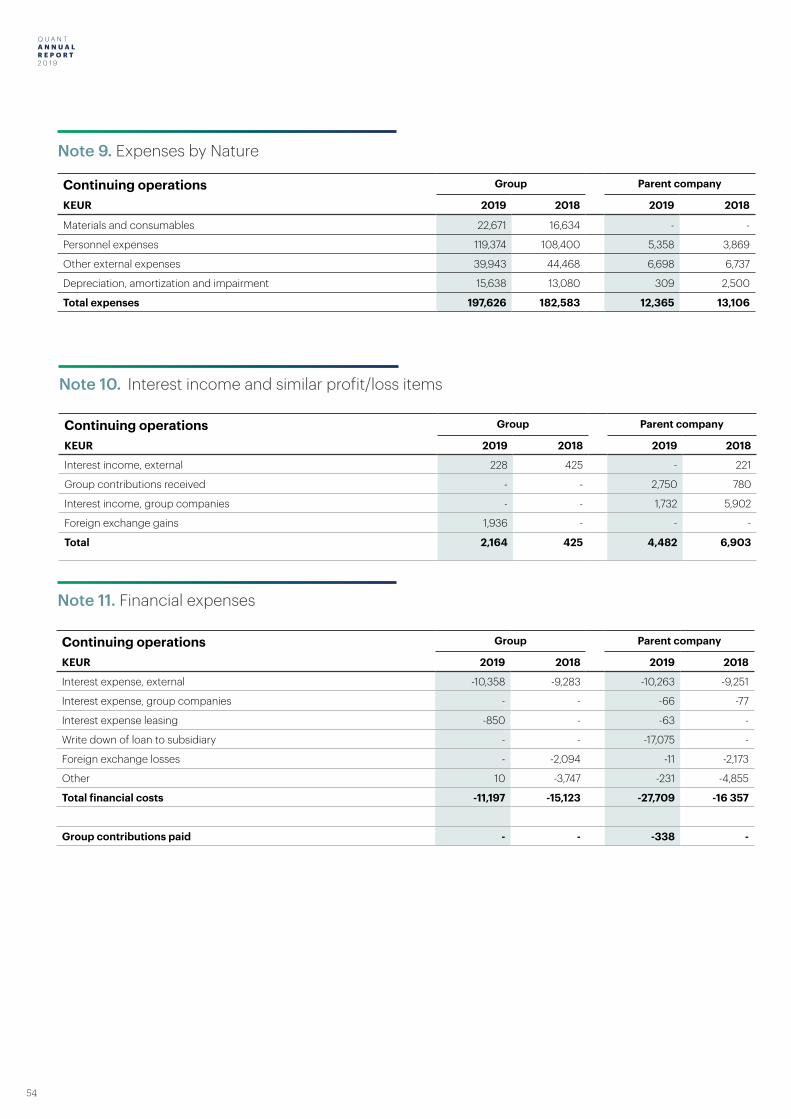
Q U A N T A N N U A L R E P O R T 2 0 1 9
54
Q U A N T A N N U A L R E P O R T
2 0 1 9
Note 9. Expenses by Nature
Note 11. Financial expenses
Continuing operations Group Parent company
KEUR 2019 2018 2019 2018
Materials and consumables 22,671 16,634 - -
Personnel expenses 119,374 108,400 5,358 3,869
Other external expenses 39,943 44,468 6,698 6,737
Depreciation, amortization and impairment 15,638 13,080 309 2,500
Total expenses 197,626 182,583 12,365 13,106
Note 10. Interest income and similar profit/loss items
Continuing operations Group Parent company
KEUR 2019 2018 2019 2018
Interest income, external 228 425 - 221
Group contributions received - - 2,750 780
Interest income, group companies - - 1,732 5,902
Foreign exchange gains 1,936 - - -
Total 2,164 425 4,482 6,903
Continuing operations Group Parent company
KEUR 2019 2018 2019 2018
Interest expense, external -10,358 -9,283 -10,263 -9,251
Interest expense, group companies - - -66 -77
Interest expense leasing -850 - -63 -
Write down of loan to subsidiary - - -17,075 -
Foreign exchange losses - -2,094 -11 -2,173
Other 10 -3,747 -231 -4,855
Total financial costs -11,197 -15,123 -27,709 -16 357
Group contributions paid - - -338 -
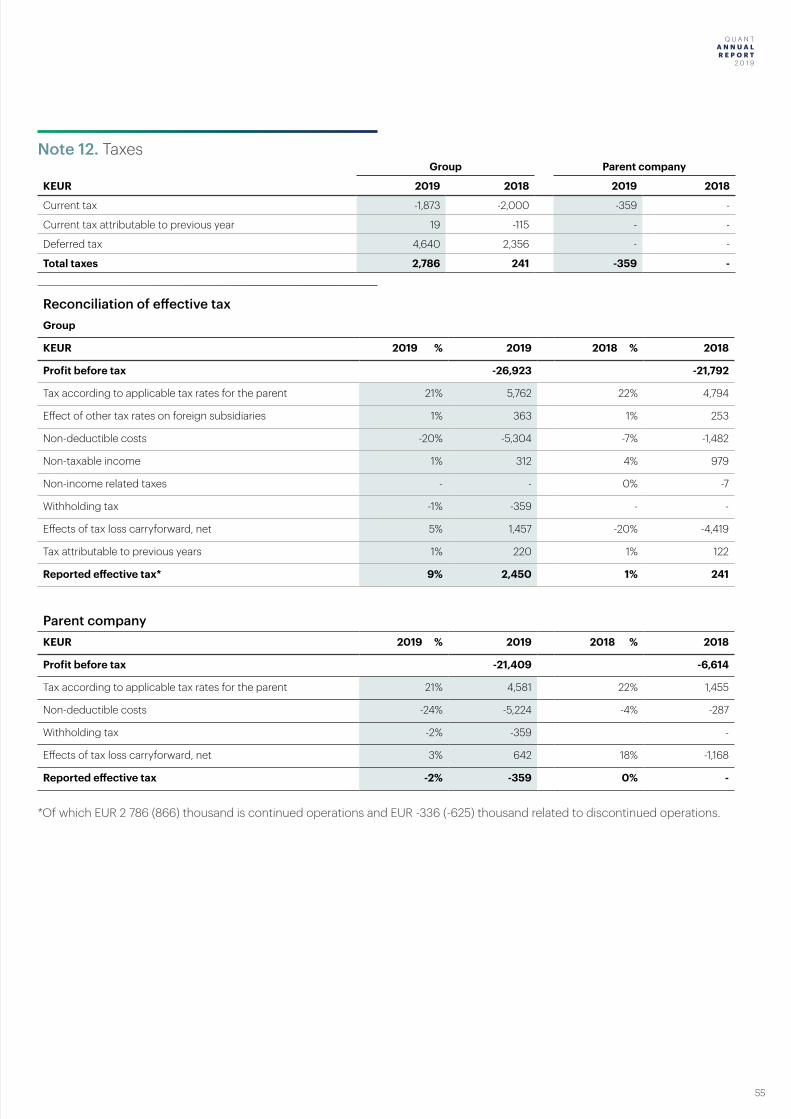
Q U A N T A N N U A L R E P O R T 2 0 1 9
55
Q U A N T A N N U A L R E P O R T
2 0 1 9
Group Parent company
KEUR 2019 2018 2019 2018
Current tax -1,873 -2,000 -359 -
Current tax attributable to previous year 19 -115 - -
Deferred tax 4,640 2,356 - -
Total taxes 2,786 241 -359 -
Reconciliation of effective taxGroup
KEUR 2019 % 2019 2018 % 2018
Profit before tax -26,923 -21,792
Tax according to applicable tax rates for the parent 21% 5,762 22% 4,794
Effect of other tax rates on foreign subsidiaries 1% 363 1% 253
Non-deductible costs -20% -5,304 -7% -1,482
Non-taxable income 1% 312 4% 979
Non-income related taxes - - 0% -7
Withholding tax -1% -359 - -
Effects of tax loss carryforward, net 5% 1,457 -20% -4,419
Tax attributable to previous years 1% 220 1% 122
Reported effective tax* 9% 2,450 1% 241
Parent companyKEUR 2019 % 2019 2018 % 2018
Profit before tax -21,409 -6,614
Tax according to applicable tax rates for the parent 21% 4,581 22% 1,455
Non-deductible costs -24% -5,224 -4% -287
Withholding tax -2% -359 -
Effects of tax loss carryforward, net 3% 642 18% -1,168
Reported effective tax -2% -359 0% -
*Of which EUR 2 786 (866) thousand is continued operations and EUR -336 (-625) thousand related to discontinued operations.
Note 12. Taxes
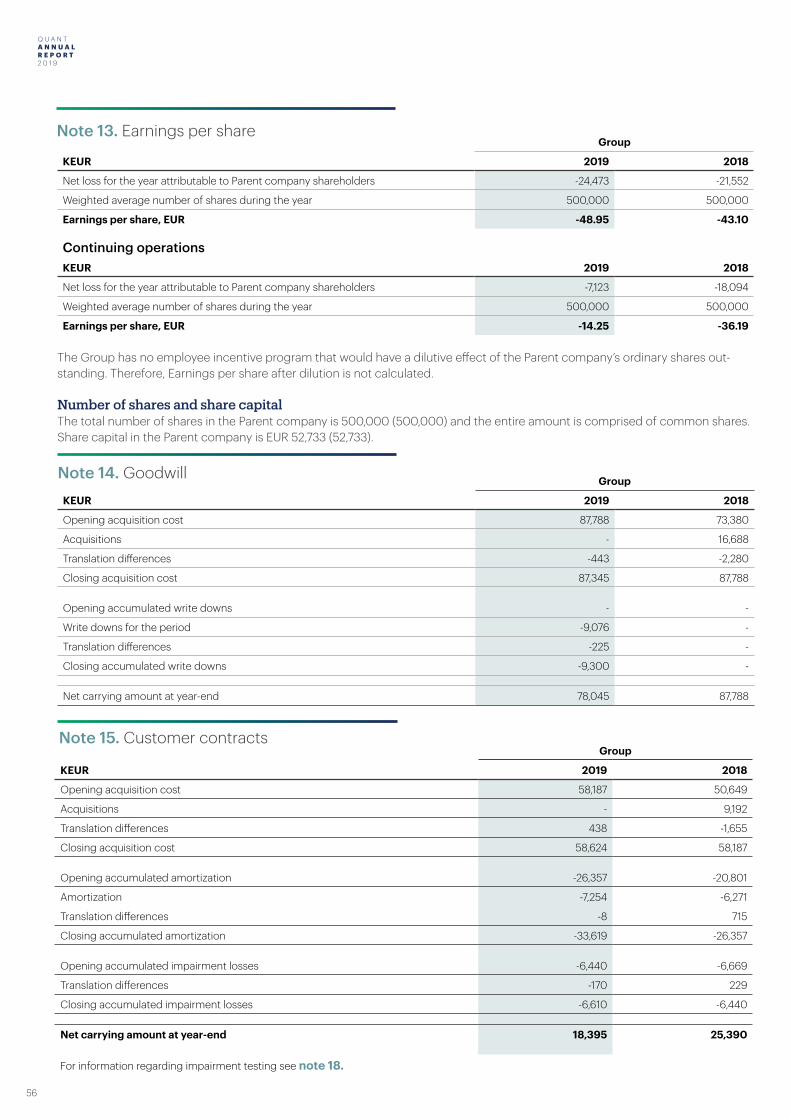
Q U A N T A N N U A L R E P O R T 2 0 1 9
56
Q U A N T A N N U A L R E P O R T
2 0 1 9
Note 13. Earnings per share
Note 14. Goodwill
Note 15. Customer contracts
Group
KEUR 2019 2018
Net loss for the year attributable to Parent company shareholders -24,473 -21,552
Weighted average number of shares during the year 500,000 500,000
Earnings per share, EUR -48.95 -43.10
Continuing operationsKEUR 2019 2018
Net loss for the year attributable to Parent company shareholders -7,123 -18,094
Weighted average number of shares during the year 500,000 500,000
Earnings per share, EUR -14.25 -36.19
The Group has no employee incentive program that would have a dilutive effect of the Parent company’s ordinary shares out-standing. Therefore, Earnings per share after dilution is not calculated. Number of shares and share capital The total number of shares in the Parent company is 500,000 (500,000) and the entire amount is comprised of common shares.Share capital in the Parent company is EUR 52,733 (52,733).
Group
KEUR 2019 2018
Opening acquisition cost 87,788 73,380
Acquisitions - 16,688
Translation differences -443 -2,280
Closing acquisition cost 87,345 87,788
Opening accumulated write downs - -
Write downs for the period -9,076 -
Translation differences -225 -
Closing accumulated write downs -9,300 -
Net carrying amount at year-end 78,045 87,788
Group
KEUR 2019 2018
Opening acquisition cost 58,187 50,649
Acquisitions - 9,192
Translation differences 438 -1,655
Closing acquisition cost 58,624 58,187
Opening accumulated amortization -26,357 -20,801
Amortization -7,254 -6,271
Translation differences -8 715
Closing accumulated amortization -33,619 -26,357
Opening accumulated impairment losses -6,440 -6,669
Translation differences -170 229
Closing accumulated impairment losses -6,610 -6,440
Net carrying amount at year-end 18,395 25,390
For information regarding impairment testing see note 18.
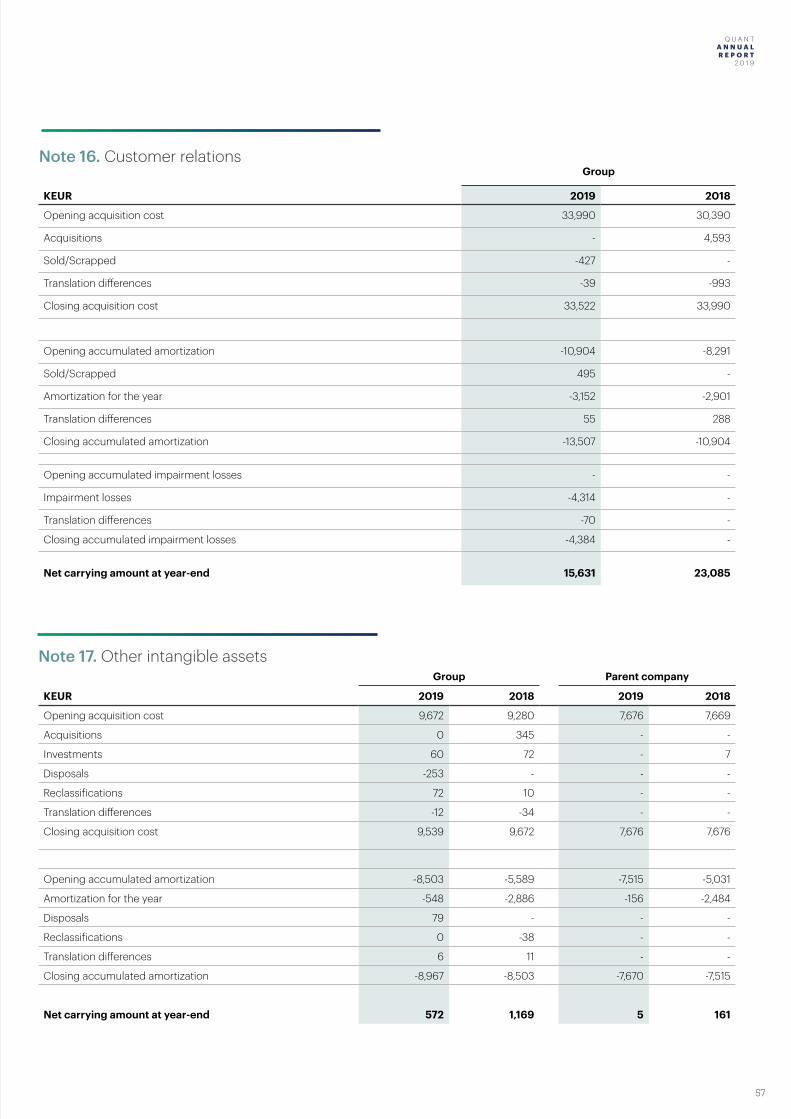
Q U A N T A N N U A L R E P O R T 2 0 1 9
57
Q U A N T A N N U A L R E P O R T
2 0 1 9
Group
KEUR 2019 2018
Opening acquisition cost 33,990 30,390
Acquisitions - 4,593
Sold/Scrapped -427 -
Translation differences -39 -993
Closing acquisition cost 33,522 33,990
Opening accumulated amortization -10,904 -8,291
Sold/Scrapped 495 -
Amortization for the year -3,152 -2,901
Translation differences 55 288
Closing accumulated amortization -13,507 -10,904
Opening accumulated impairment losses - -
Impairment losses -4,314 -
Translation differences -70 -
Closing accumulated impairment losses -4,384 -
Net carrying amount at year-end 15,631 23,085
Group Parent company
KEUR 2019 2018 2019 2018
Opening acquisition cost 9,672 9,280 7,676 7,669
Acquisitions 0 345 - -
Investments 60 72 - 7
Disposals -253 - - -
Reclassifications 72 10 - -
Translation differences -12 -34 - -
Closing acquisition cost 9,539 9,672 7,676 7,676
Opening accumulated amortization -8,503 -5,589 -7,515 -5,031
Amortization for the year -548 -2,886 -156 -2,484
Disposals 79 - - -
Reclassifications 0 -38 - -
Translation differences 6 11 - -
Closing accumulated amortization -8,967 -8,503 -7,670 -7,515
Net carrying amount at year-end 572 1,169 5 161
Note 16. Customer relations
Note 17. Other intangible assets
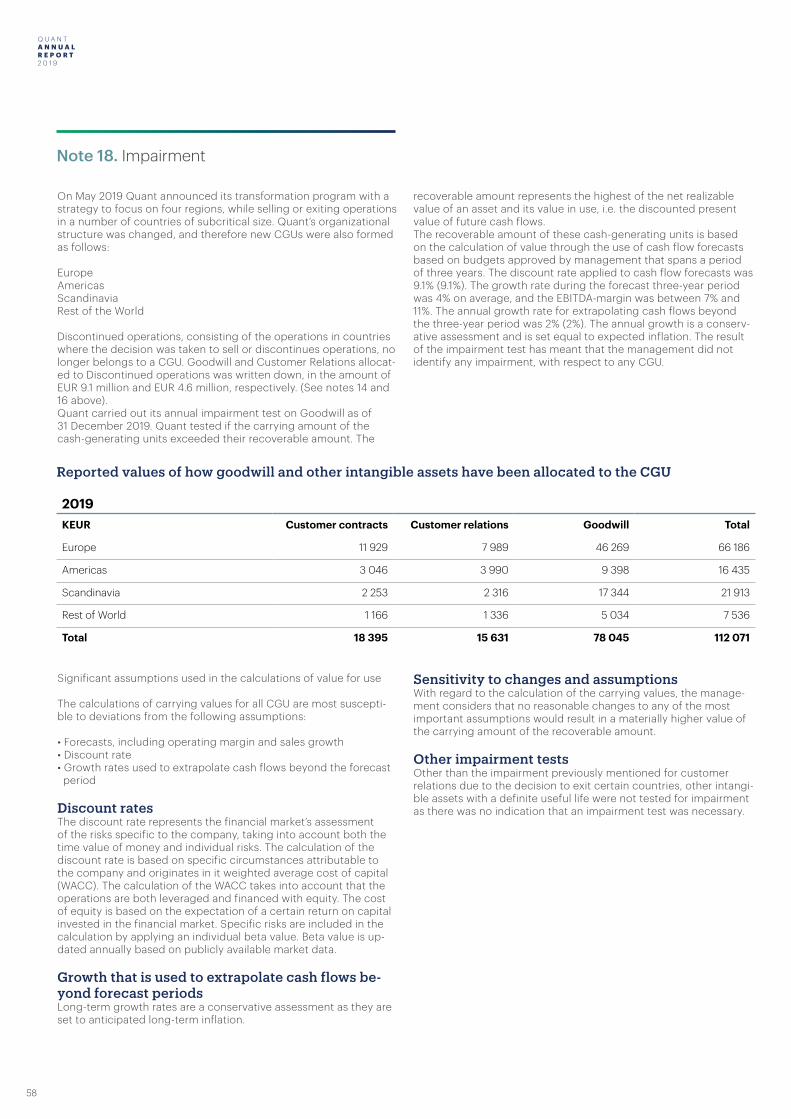
Q U A N T A N N U A L R E P O R T 2 0 1 9
58
Q U A N T A N N U A L R E P O R T
2 0 1 9
On May 2019 Quant announced its transformation program with a strategy to focus on four regions, while selling or exiting operations in a number of countries of subcritical size. Quant’s organizational structure was changed, and therefore new CGUs were also formed as follows:
EuropeAmericasScandinaviaRest of the World
Discontinued operations, consisting of the operations in countries where the decision was taken to sell or discontinues operations, no longer belongs to a CGU. Goodwill and Customer Relations allocat-ed to Discontinued operations was written down, in the amount of EUR 9.1 million and EUR 4.6 million, respectively. (See notes 14 and 16 above).Quant carried out its annual impairment test on Goodwill as of 31 December 2019. Quant tested if the carrying amount of the cash-generating units exceeded their recoverable amount. The
recoverable amount represents the highest of the net realizable value of an asset and its value in use, i.e. the discounted present value of future cash flows.The recoverable amount of these cash-generating units is based on the calculation of value through the use of cash flow forecasts based on budgets approved by management that spans a period of three years. The discount rate applied to cash flow forecasts was 9.1% (9.1%). The growth rate during the forecast three-year period was 4% on average, and the EBITDA-margin was between 7% and 11%. The annual growth rate for extrapolating cash flows beyond the three-year period was 2% (2%). The annual growth is a conserv-ative assessment and is set equal to expected inflation. The result of the impairment test has meant that the management did not identify any impairment, with respect to any CGU.
Reported values of how goodwill and other intangible assets have been allocated to the CGU
2019KEUR Customer contracts Customer relations Goodwill Total
Europe 11 929 7 989 46 269 66 186
Americas 3 046 3 990 9 398 16 435
Scandinavia 2 253 2 316 17 344 21 913
Rest of World 1 166 1 336 5 034 7 536
Total 18 395 15 631 78 045 112 071
Significant assumptions used in the calculations of value for use
The calculations of carrying values for all CGU are most suscepti-ble to deviations from the following assumptions:
• Forecasts, including operating margin and sales growth• Discount rate• Growth rates used to extrapolate cash flows beyond the forecast period
Discount ratesThe discount rate represents the financial market’s assessment of the risks specific to the company, taking into account both the time value of money and individual risks. The calculation of the discount rate is based on specific circumstances attributable to the company and originates in it weighted average cost of capital (WACC). The calculation of the WACC takes into account that the operations are both leveraged and financed with equity. The cost of equity is based on the expectation of a certain return on capital invested in the financial market. Specific risks are included in the calculation by applying an individual beta value. Beta value is up-dated annually based on publicly available market data.
Growth that is used to extrapolate cash flows be-yond forecast periodsLong-term growth rates are a conservative assessment as they are set to anticipated long-term inflation.
Sensitivity to changes and assumptionsWith regard to the calculation of the carrying values, the manage-ment considers that no reasonable changes to any of the most important assumptions would result in a materially higher value of the carrying amount of the recoverable amount.
Other impairment testsOther than the impairment previously mentioned for customer relations due to the decision to exit certain countries, other intangi-ble assets with a definite useful life were not tested for impairment as there was no indication that an impairment test was necessary.
Note 18. Impairment
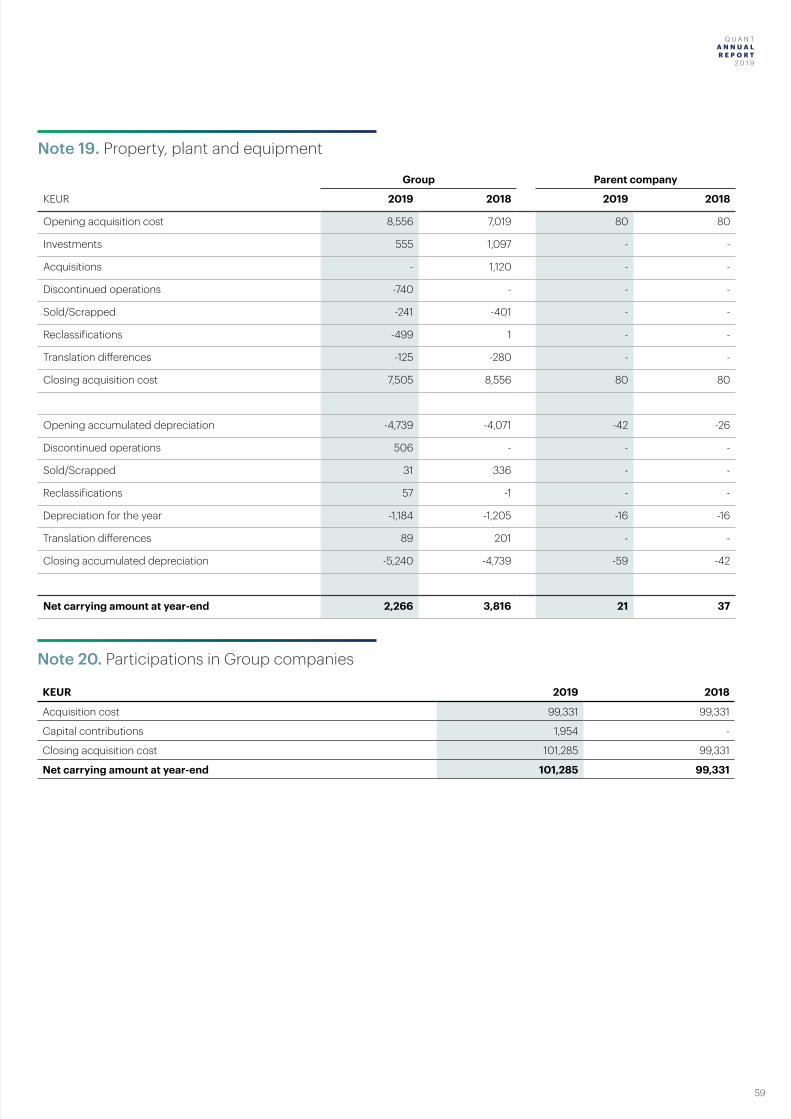
Q U A N T A N N U A L R E P O R T 2 0 1 9
59
Q U A N T A N N U A L R E P O R T
2 0 1 9
Note 19. Property, plant and equipment
Note 20. Participations in Group companies
Group Parent company
KEUR 2019 2018 2019 2018
Opening acquisition cost 8,556 7,019 80 80
Investments 555 1,097 - -
Acquisitions - 1,120 - -
Discontinued operations -740 - - -
Sold/Scrapped -241 -401 - -
Reclassifications -499 1 - -
Translation differences -125 -280 - -
Closing acquisition cost 7,505 8,556 80 80
Opening accumulated depreciation -4,739 -4,071 -42 -26
Discontinued operations 506 - - -
Sold/Scrapped 31 336 - -
Reclassifications 57 -1 - -
Depreciation for the year -1,184 -1,205 -16 -16
Translation differences 89 201 - -
Closing accumulated depreciation -5,240 -4,739 -59 -42
Net carrying amount at year-end 2,266 3,816 21 37
KEUR 2019 2018
Acquisition cost 99,331 99,331
Capital contributions 1,954 -
Closing acquisition cost 101,285 99,331
Net carrying amount at year-end 101,285 99,331
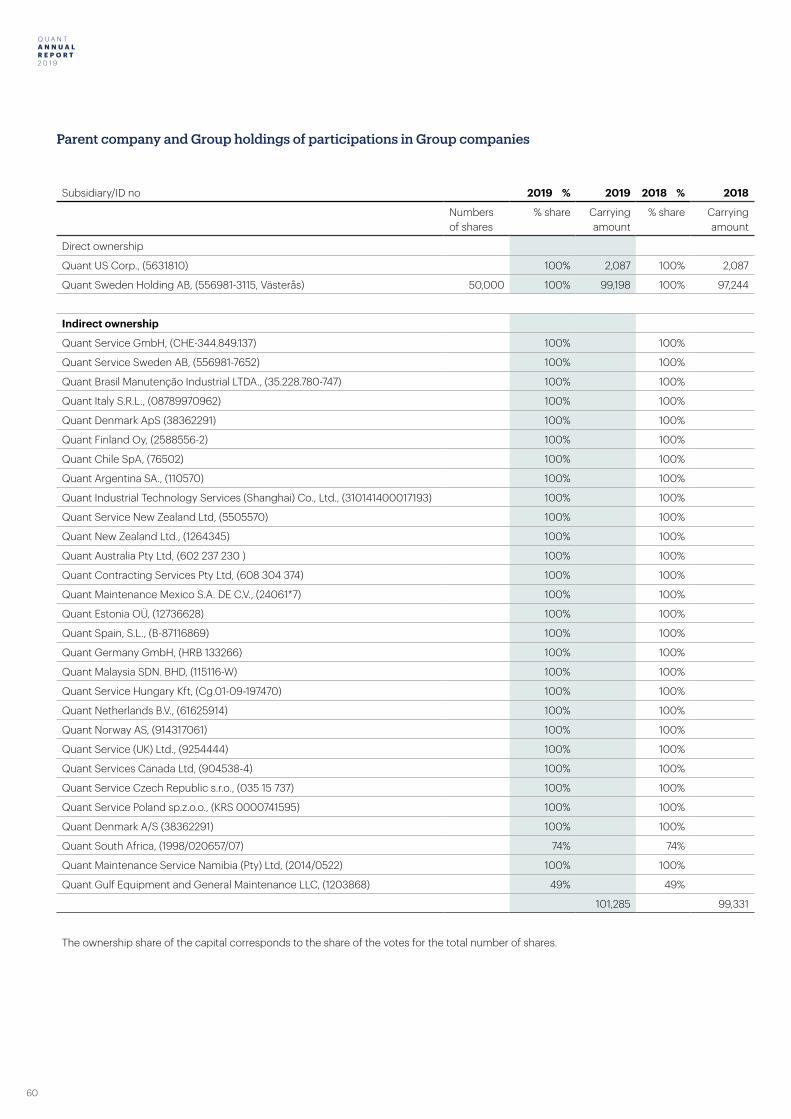
Q U A N T A N N U A L R E P O R T 2 0 1 9
60
Q U A N T A N N U A L R E P O R T
2 0 1 9
Parent company and Group holdings of participations in Group companies
Subsidiary/ID no 2019 % 2019 2018 % 2018
Numbers of shares
% share Carrying amount
% share Carrying amount
Direct ownership
Quant US Corp., (5631810) 100% 2,087 100% 2,087
Quant Sweden Holding AB, (556981-3115, Västerås) 50,000 100% 99,198 100% 97,244
Indirect ownership
Quant Service GmbH, (CHE-344.849.137) 100% 100%
Quant Service Sweden AB, (556981-7652) 100% 100%
Quant Brasil Manutenção Industrial LTDA., (35.228.780-747) 100% 100%
Quant Italy S.R.L., (08789970962) 100% 100%
Quant Denmark ApS (38362291) 100% 100%
Quant Finland Oy, (2588556-2) 100% 100%
Quant Chile SpA, (76502) 100% 100%
Quant Argentina SA., (110570) 100% 100%
Quant Industrial Technology Services (Shanghai) Co., Ltd., (310141400017193) 100% 100%
Quant Service New Zealand Ltd, (5505570) 100% 100%
Quant New Zealand Ltd., (1264345) 100% 100%
Quant Australia Pty Ltd, (602 237 230 ) 100% 100%
Quant Contracting Services Pty Ltd, (608 304 374) 100% 100%
Quant Maintenance Mexico S.A. DE C.V., (24061*7) 100% 100%
Quant Estonia OÜ, (12736628) 100% 100%
Quant Spain, S.L., (B-87116869) 100% 100%
Quant Germany GmbH, (HRB 133266) 100% 100%
Quant Malaysia SDN. BHD, (115116-W) 100% 100%
Quant Service Hungary Kft, (Cg.01-09-197470) 100% 100%
Quant Netherlands B.V., (61625914) 100% 100%
Quant Norway AS, (914317061) 100% 100%
Quant Service (UK) Ltd., (9254444) 100% 100%
Quant Services Canada Ltd, (904538-4) 100% 100%
Quant Service Czech Republic s.r.o., (035 15 737) 100% 100%
Quant Service Poland sp.z.o.o., (KRS 0000741595) 100% 100%
Quant Denmark A/S (38362291) 100% 100%
Quant South Africa, (1998/020657/07) 74% 74%
Quant Maintenance Service Namibia (Pty) Ltd, (2014/0522) 100% 100%
Quant Gulf Equipment and General Maintenance LLC, (1203868) 49% 49%
101,285 99,331
The ownership share of the capital corresponds to the share of the votes for the total number of shares.
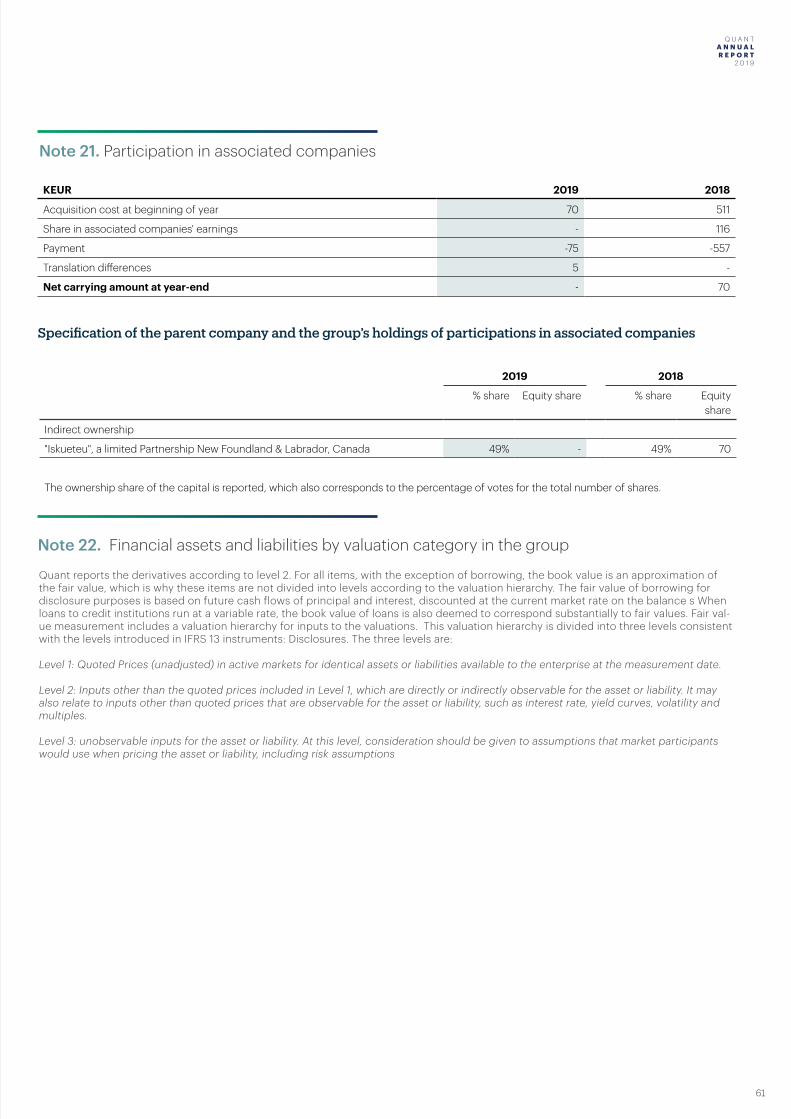
Q U A N T A N N U A L R E P O R T 2 0 1 9
61
Q U A N T A N N U A L R E P O R T
2 0 1 9
Note 21. Participation in associated companies
Quant reports the derivatives according to level 2. For all items, with the exception of borrowing, the book value is an approximation of the fair value, which is why these items are not divided into levels according to the valuation hierarchy. The fair value of borrowing for disclosure purposes is based on future cash flows of principal and interest, discounted at the current market rate on the balance s When loans to credit institutions run at a variable rate, the book value of loans is also deemed to correspond substantially to fair values. Fair val-ue measurement includes a valuation hierarchy for inputs to the valuations. This valuation hierarchy is divided into three levels consistent with the levels introduced in IFRS 13 instruments: Disclosures. The three levels are:
Level 1: Quoted Prices (unadjusted) in active markets for identical assets or liabilities available to the enterprise at the measurement date.
Level 2: Inputs other than the quoted prices included in Level 1, which are directly or indirectly observable for the asset or liability. It may also relate to inputs other than quoted prices that are observable for the asset or liability, such as interest rate, yield curves, volatility and multiples.
Level 3: unobservable inputs for the asset or liability. At this level, consideration should be given to assumptions that market participants would use when pricing the asset or liability, including risk assumptions
KEUR 2019 2018
Acquisition cost at beginning of year 70 511
Share in associated companies' earnings - 116
Payment -75 -557
Translation differences 5 -
Net carrying amount at year-end - 70
Specification of the parent company and the group’s holdings of participations in associated companies
2019 2018
% share Equity share % share Equity share
Indirect ownership
"Iskueteu", a limited Partnership New Foundland & Labrador, Canada 49% - 49% 70
The ownership share of the capital is reported, which also corresponds to the percentage of votes for the total number of shares.
Note 22. Financial assets and liabilities by valuation category in the group
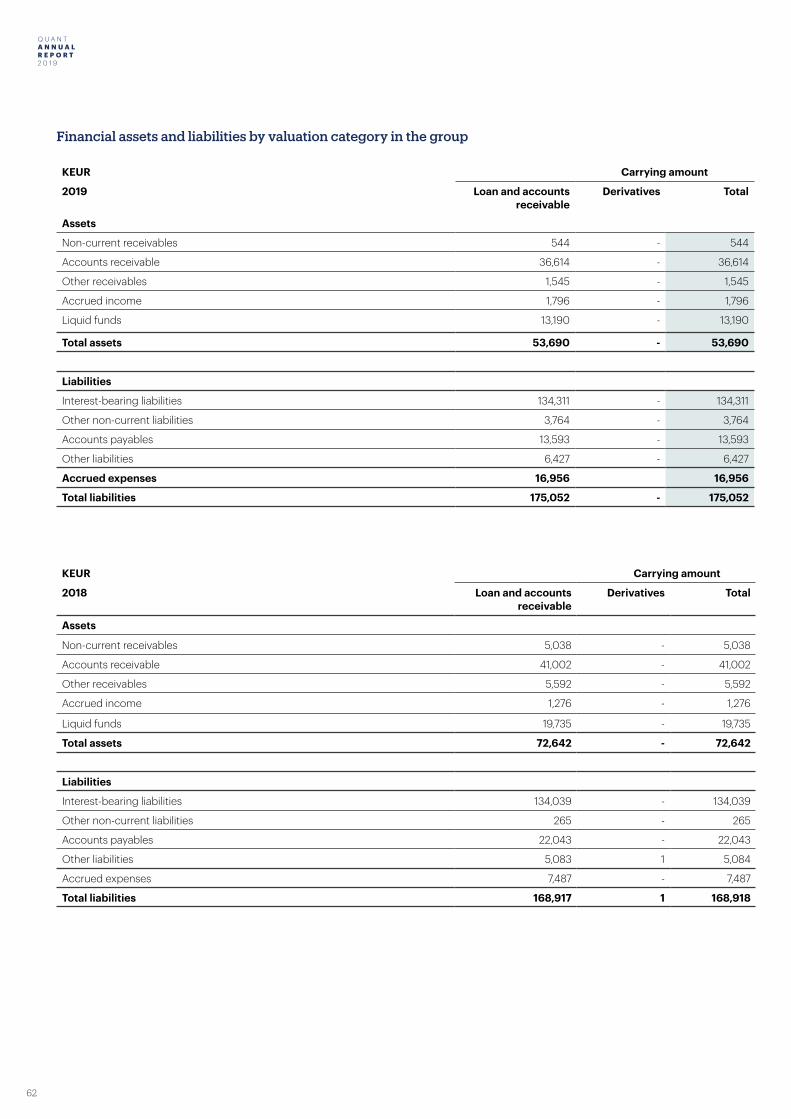
Q U A N T A N N U A L R E P O R T 2 0 1 9
62
Q U A N T A N N U A L R E P O R T
2 0 1 9
Financial assets and liabilities by valuation category in the group
KEUR Carrying amount
2019 Loan and accounts receivable
Derivatives Total
Assets
Non-current receivables 544 - 544
Accounts receivable 36,614 - 36,614
Other receivables 1,545 - 1,545
Accrued income 1,796 - 1,796
Liquid funds 13,190 - 13,190
Total assets 53,690 - 53,690
Liabilities
Interest-bearing liabilities 134,311 - 134,311
Other non-current liabilities 3,764 - 3,764
Accounts payables 13,593 - 13,593
Other liabilities 6,427 - 6,427
Accrued expenses 16,956 16,956
Total liabilities 175,052 - 175,052
KEUR Carrying amount
2018 Loan and accounts receivable
Derivatives Total
Assets
Non-current receivables 5,038 - 5,038
Accounts receivable 41,002 - 41,002
Other receivables 5,592 - 5,592
Accrued income 1,276 - 1,276
Liquid funds 19,735 - 19,735
Total assets 72,642 - 72,642
Liabilities
Interest-bearing liabilities 134,039 - 134,039
Other non-current liabilities 265 - 265
Accounts payables 22,043 - 22,043
Other liabilities 5,083 1 5,084
Accrued expenses 7,487 - 7,487
Total liabilities 168,917 1 168,918
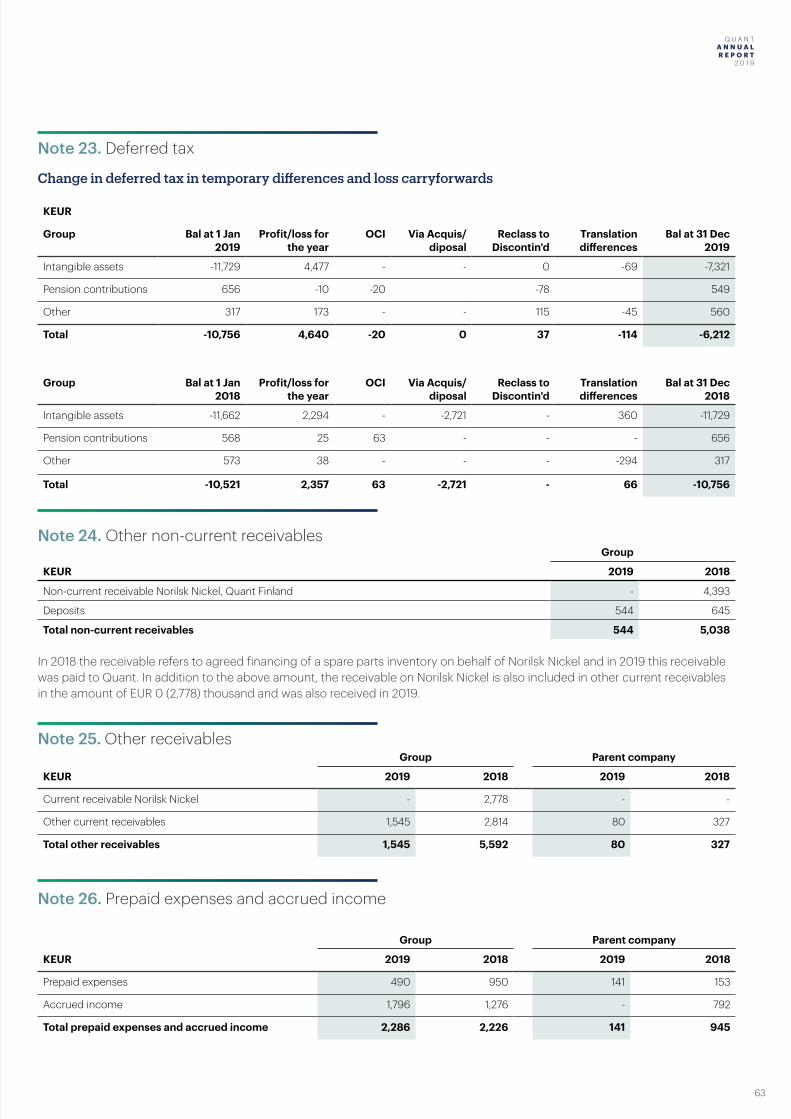
Q U A N T A N N U A L R E P O R T 2 0 1 9
63
Q U A N T A N N U A L R E P O R T
2 0 1 9
Note 23. Deferred tax
Change in deferred tax in temporary differences and loss carryforwards
Note 24. Other non-current receivables
Note 25. Other receivables
Note 26. Prepaid expenses and accrued income
KEUR
Group Bal at 1 Jan 2019
Profit/loss for the year
OCI Via Acquis/diposal
Reclass to Discontin'd
Translation differences
Bal at 31 Dec 2019
Intangible assets -11,729 4,477 - - 0 -69 -7,321
Pension contributions 656 -10 -20 -78 549
Other 317 173 - - 115 -45 560
Total -10,756 4,640 -20 0 37 -114 -6,212
Group Bal at 1 Jan 2018
Profit/loss for the year
OCI Via Acquis/diposal
Reclass to Discontin'd
Translation differences
Bal at 31 Dec 2018
Intangible assets -11,662 2,294 - -2,721 - 360 -11,729
Pension contributions 568 25 63 - - - 656
Other 573 38 - - - -294 317
Total -10,521 2,357 63 -2,721 - 66 -10,756
Group
KEUR 2019 2018
Non-current receivable Norilsk Nickel, Quant Finland - 4,393
Deposits 544 645
Total non-current receivables 544 5,038
In 2018 the receivable refers to agreed financing of a spare parts inventory on behalf of Norilsk Nickel and in 2019 this receivable was paid to Quant. In addition to the above amount, the receivable on Norilsk Nickel is also included in other current receivables in the amount of EUR 0 (2,778) thousand and was also received in 2019.
Group Parent company
KEUR 2019 2018 2019 2018
Current receivable Norilsk Nickel - 2,778 - -
Other current receivables 1,545 2,814 80 327
Total other receivables 1,545 5,592 80 327
Group Parent company
KEUR 2019 2018 2019 2018
Prepaid expenses 490 950 141 153
Accrued income 1,796 1,276 - 792
Total prepaid expenses and accrued income 2,286 2,226 141 945
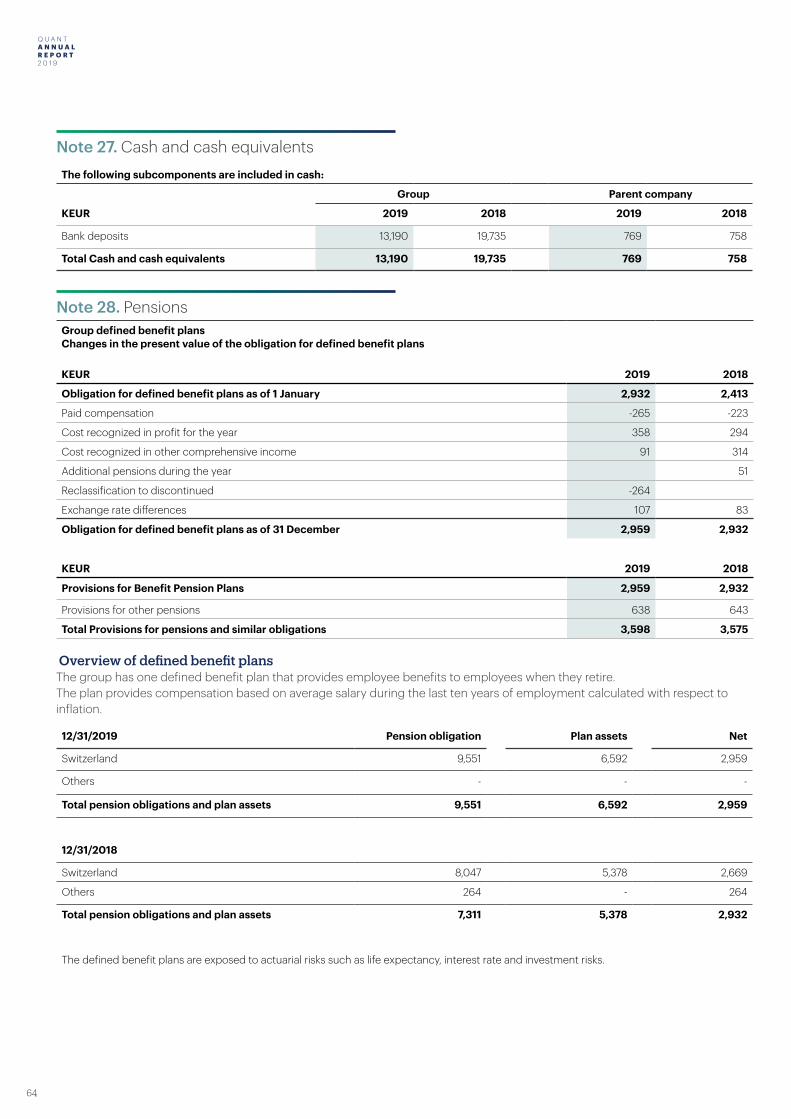
Q U A N T A N N U A L R E P O R T 2 0 1 9
64
Q U A N T A N N U A L R E P O R T
2 0 1 9
Note 27. Cash and cash equivalents
Note 28. Pensions
The following subcomponents are included in cash:
Group Parent company
KEUR 2019 2018 2019 2018
Bank deposits 13,190 19,735 769 758
Total Cash and cash equivalents 13,190 19,735 769 758
Group defined benefit plans Changes in the present value of the obligation for defined benefit plans
KEUR 2019 2018
Obligation for defined benefit plans as of 1 January 2,932 2,413
Paid compensation -265 -223
Cost recognized in profit for the year 358 294
Cost recognized in other comprehensive income 91 314
Additional pensions during the year 51
Reclassification to discontinued -264
Exchange rate differences 107 83
Obligation for defined benefit plans as of 31 December 2,959 2,932
KEUR 2019 2018
Provisions for Benefit Pension Plans 2,959 2,932
Provisions for other pensions 638 643
Total Provisions for pensions and similar obligations 3,598 3,575
Overview of defined benefit plansThe group has one defined benefit plan that provides employee benefits to employees when they retire.The plan provides compensation based on average salary during the last ten years of employment calculated with respect to inflation.
12/31/2019 Pension obligation Plan assets Net
Switzerland 9,551 6,592 2,959
Others - - -
Total pension obligations and plan assets 9,551 6,592 2,959
12/31/2018
Switzerland 8,047 5,378 2,669
Others 264 - 264
Total pension obligations and plan assets 7,311 5,378 2,932
The defined benefit plans are exposed to actuarial risks such as life expectancy, interest rate and investment risks.
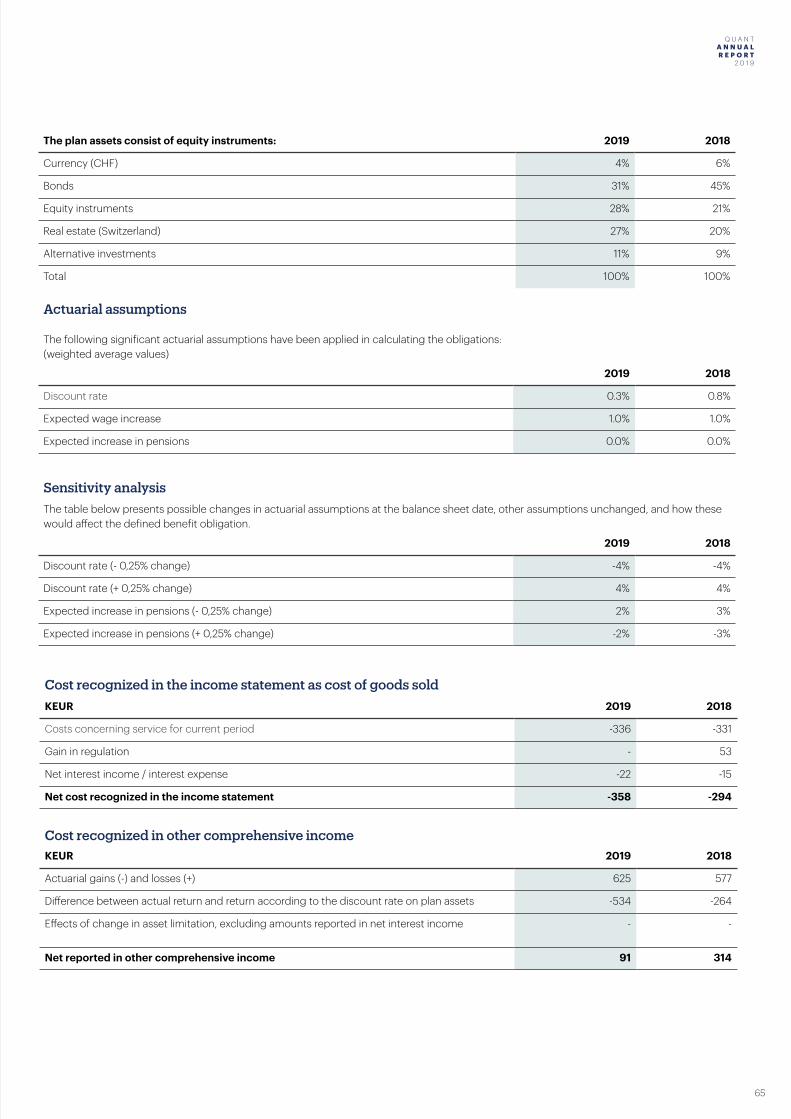
Q U A N T A N N U A L R E P O R T 2 0 1 9
65
Q U A N T A N N U A L R E P O R T
2 0 1 9
The plan assets consist of equity instruments: 2019 2018
Currency (CHF) 4% 6%
Bonds 31% 45%
Equity instruments 28% 21%
Real estate (Switzerland) 27% 20%
Alternative investments 11% 9%
Total 100% 100%
Actuarial assumptions
The following significant actuarial assumptions have been applied in calculating the obligations: (weighted average values)
2019 2018
Discount rate 0.3% 0.8%
Expected wage increase 1.0% 1.0%
Expected increase in pensions 0.0% 0.0%
Sensitivity analysisThe table below presents possible changes in actuarial assumptions at the balance sheet date, other assumptions unchanged, and how these would affect the defined benefit obligation.
2019 2018
Discount rate (- 0,25% change) -4% -4%
Discount rate (+ 0,25% change) 4% 4%
Expected increase in pensions (- 0,25% change) 2% 3%
Expected increase in pensions (+ 0,25% change) -2% -3%
Cost recognized in the income statement as cost of goods soldKEUR 2019 2018
Costs concerning service for current period -336 -331
Gain in regulation - 53
Net interest income / interest expense -22 -15
Net cost recognized in the income statement -358 -294
Cost recognized in other comprehensive incomeKEUR 2019 2018
Actuarial gains (-) and losses (+) 625 577
Difference between actual return and return according to the discount rate on plan assets -534 -264
Effects of change in asset limitation, excluding amounts reported in net interest income - -
Net reported in other comprehensive income 91 314
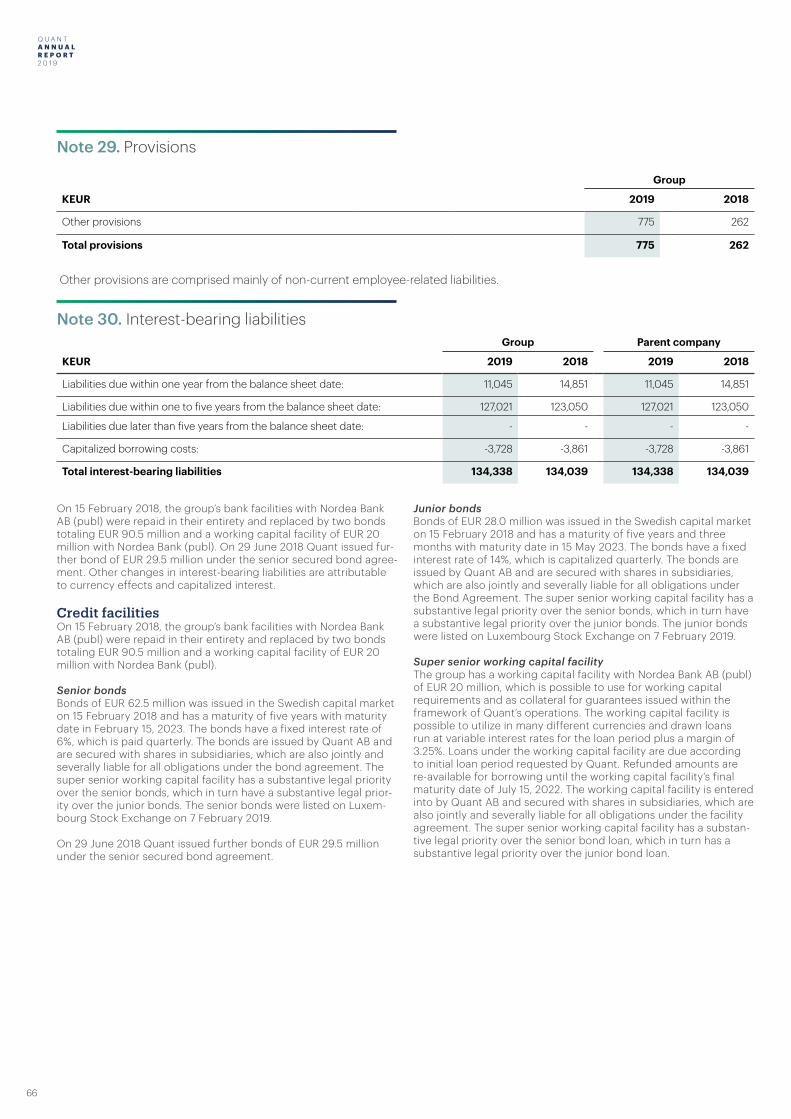
Q U A N T A N N U A L R E P O R T 2 0 1 9
66
Q U A N T A N N U A L R E P O R T
2 0 1 9
Group
KEUR 2019 2018
Other provisions 775 262
Total provisions 775 262
Other provisions are comprised mainly of non-current employee-related liabilities.
Note 29. Provisions
Note 30. Interest-bearing liabilitiesGroup Parent company
KEUR 2019 2018 2019 2018
Liabilities due within one year from the balance sheet date: 11,045 14,851 11,045 14,851
Liabilities due within one to five years from the balance sheet date: 127,021 123,050 127,021 123,050
Liabilities due later than five years from the balance sheet date: - - - -
Capitalized borrowing costs: -3,728 -3,861 -3,728 -3,861
Total interest-bearing liabilities 134,338 134,039 134,338 134,039
On 15 February 2018, the group’s bank facilities with Nordea Bank AB (publ) were repaid in their entirety and replaced by two bonds totaling EUR 90.5 million and a working capital facility of EUR 20 million with Nordea Bank (publ). On 29 June 2018 Quant issued fur-ther bond of EUR 29.5 million under the senior secured bond agree-ment. Other changes in interest-bearing liabilities are attributable to currency effects and capitalized interest.
Credit facilitiesOn 15 February 2018, the group’s bank facilities with Nordea Bank AB (publ) were repaid in their entirety and replaced by two bonds totaling EUR 90.5 million and a working capital facility of EUR 20 million with Nordea Bank (publ).
Senior bondsBonds of EUR 62.5 million was issued in the Swedish capital market on 15 February 2018 and has a maturity of five years with maturity date in February 15, 2023. The bonds have a fixed interest rate of 6%, which is paid quarterly. The bonds are issued by Quant AB and are secured with shares in subsidiaries, which are also jointly and severally liable for all obligations under the bond agreement. The super senior working capital facility has a substantive legal priority over the senior bonds, which in turn have a substantive legal prior-ity over the junior bonds. The senior bonds were listed on Luxem-bourg Stock Exchange on 7 February 2019.
On 29 June 2018 Quant issued further bonds of EUR 29.5 million under the senior secured bond agreement.
Junior bondsBonds of EUR 28.0 million was issued in the Swedish capital market on 15 February 2018 and has a maturity of five years and three months with maturity date in 15 May 2023. The bonds have a fixed interest rate of 14%, which is capitalized quarterly. The bonds are issued by Quant AB and are secured with shares in subsidiaries, which are also jointly and severally liable for all obligations under the Bond Agreement. The super senior working capital facility has a substantive legal priority over the senior bonds, which in turn have a substantive legal priority over the junior bonds. The junior bonds were listed on Luxembourg Stock Exchange on 7 February 2019.
Super senior working capital facilityThe group has a working capital facility with Nordea Bank AB (publ) of EUR 20 million, which is possible to use for working capital requirements and as collateral for guarantees issued within the framework of Quant’s operations. The working capital facility is possible to utilize in many different currencies and drawn loans run at variable interest rates for the loan period plus a margin of 3.25%. Loans under the working capital facility are due according to initial loan period requested by Quant. Refunded amounts are re-available for borrowing until the working capital facility’s final maturity date of July 15, 2022. The working capital facility is entered into by Quant AB and secured with shares in subsidiaries, which are also jointly and severally liable for all obligations under the facility agreement. The super senior working capital facility has a substan-tive legal priority over the senior bond loan, which in turn has a substantive legal priority over the junior bond loan.
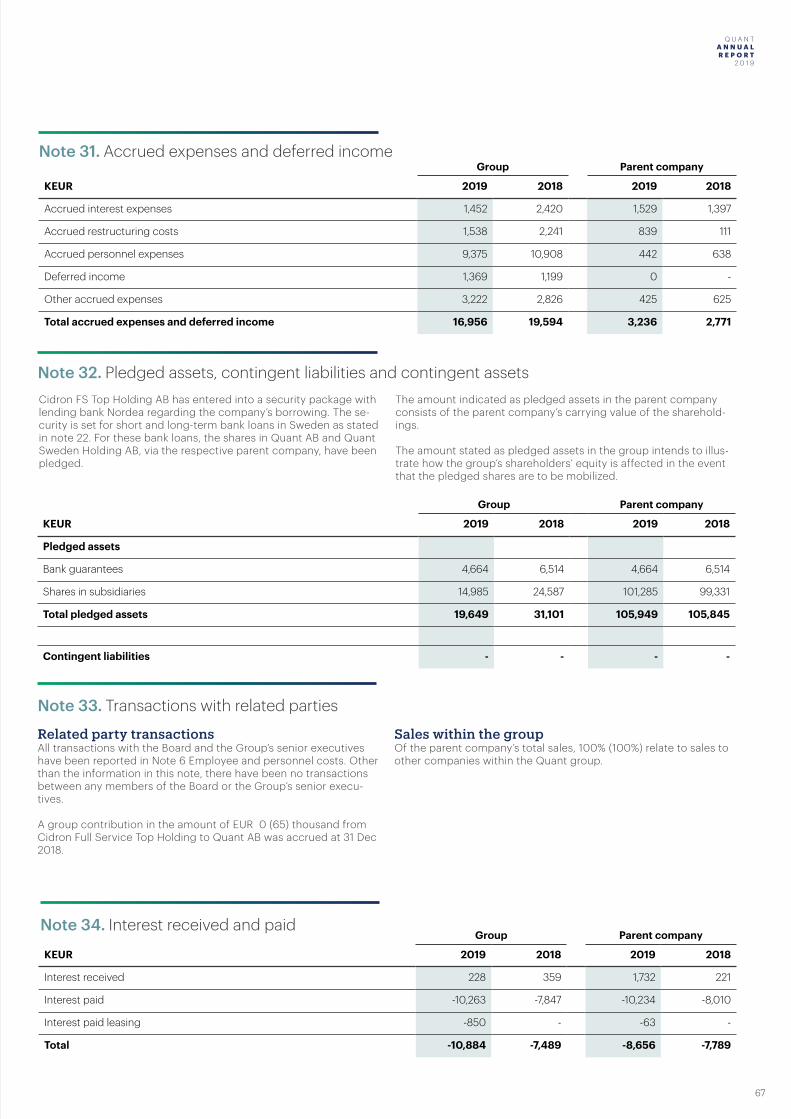
Q U A N T A N N U A L R E P O R T 2 0 1 9
67
Q U A N T A N N U A L R E P O R T
2 0 1 9
Note 31. Accrued expenses and deferred income
Note 32. Pledged assets, contingent liabilities and contingent assets
Note 33. Transactions with related parties
Note 34. Interest received and paid
Cidron FS Top Holding AB has entered into a security package with lending bank Nordea regarding the company’s borrowing. The se-curity is set for short and long-term bank loans in Sweden as stated in note 22. For these bank loans, the shares in Quant AB and Quant Sweden Holding AB, via the respective parent company, have been pledged.
The amount indicated as pledged assets in the parent company consists of the parent company’s carrying value of the sharehold-ings.
The amount stated as pledged assets in the group intends to illus-trate how the group’s shareholders’ equity is affected in the event that the pledged shares are to be mobilized.
Related party transactionsAll transactions with the Board and the Group’s senior executives have been reported in Note 6 Employee and personnel costs. Other than the information in this note, there have been no transactions between any members of the Board or the Group’s senior execu-tives.
A group contribution in the amount of EUR 0 (65) thousand from Cidron Full Service Top Holding to Quant AB was accrued at 31 Dec 2018.
Sales within the groupOf the parent company’s total sales, 100% (100%) relate to sales to other companies within the Quant group.
Group Parent company
KEUR 2019 2018 2019 2018
Accrued interest expenses 1,452 2,420 1,529 1,397
Accrued restructuring costs 1,538 2,241 839 111
Accrued personnel expenses 9,375 10,908 442 638
Deferred income 1,369 1,199 0 -
Other accrued expenses 3,222 2,826 425 625
Total accrued expenses and deferred income 16,956 19,594 3,236 2,771
Group Parent company
KEUR 2019 2018 2019 2018
Pledged assets
Bank guarantees 4,664 6,514 4,664 6,514
Shares in subsidiaries 14,985 24,587 101,285 99,331
Total pledged assets 19,649 31,101 105,949 105,845
Contingent liabilities - - - -
Group Parent company
KEUR 2019 2018 2019 2018
Interest received 228 359 1,732 221
Interest paid -10,263 -7,847 -10,234 -8,010
Interest paid leasing -850 - -63 -
Total -10,884 -7,489 -8,656 -7,789
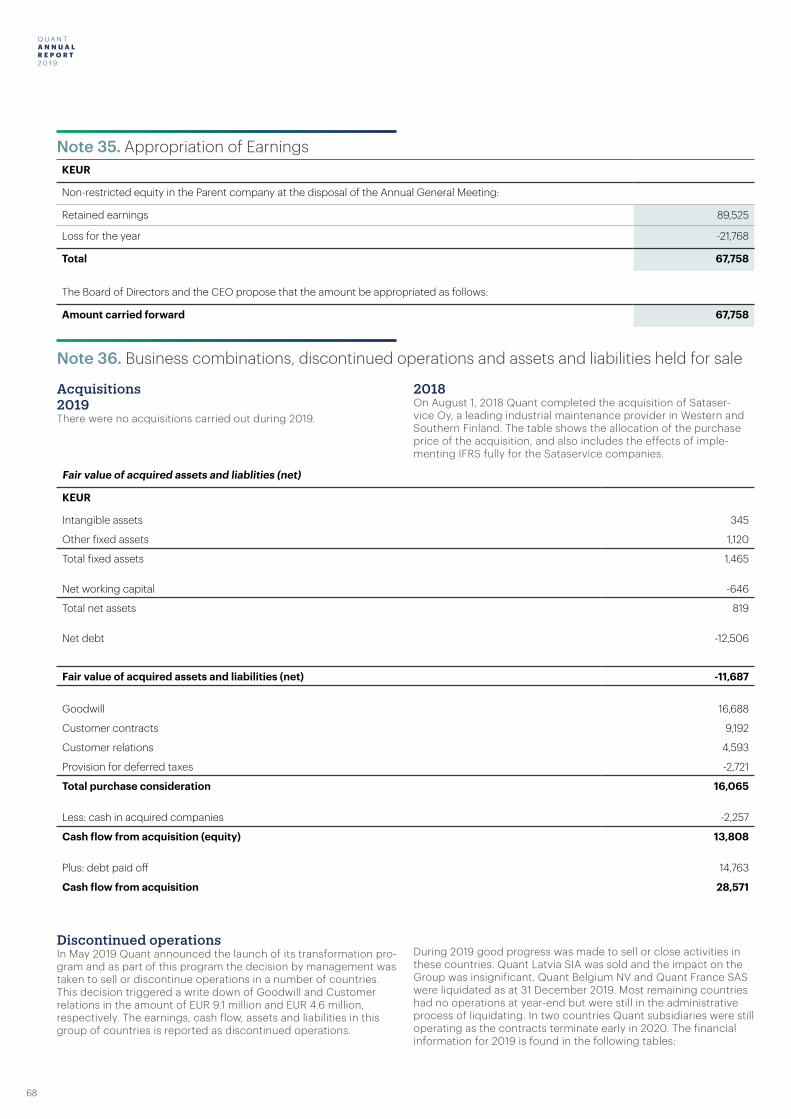
Q U A N T A N N U A L R E P O R T 2 0 1 9
68
Q U A N T A N N U A L R E P O R T
2 0 1 9
Note 35. Appropriation of Earnings
Note 36. Business combinations, discontinued operations and assets and liabilities held for sale
KEUR
Non-restricted equity in the Parent company at the disposal of the Annual General Meeting:
Retained earnings 89,525
Loss for the year -21,768
Total 67,758
The Board of Directors and the CEO propose that the amount be appropriated as follows:
Amount carried forward 67,758
Acquisitions2019There were no acquisitions carried out during 2019.
2018On August 1, 2018 Quant completed the acquisition of Sataser-vice Oy, a leading industrial maintenance provider in Western and Southern Finland. The table shows the allocation of the purchase price of the acquisition, and also includes the effects of imple-menting IFRS fully for the Sataservice companies.
Fair value of acquired assets and liablities (net)
KEUR
Intangible assets 345
Other fixed assets 1,120
Total fixed assets 1,465
Net working capital -646
Total net assets 819
Net debt -12,506
Fair value of acquired assets and liabilities (net) -11,687
Goodwill 16,688
Customer contracts 9,192
Customer relations 4,593
Provision for deferred taxes -2,721
Total purchase consideration 16,065
Less: cash in acquired companies -2,257
Cash flow from acquisition (equity) 13,808
Plus: debt paid off 14,763
Cash flow from acquisition 28,571
Discontinued operationsIn May 2019 Quant announced the launch of its transformation pro-gram and as part of this program the decision by management was taken to sell or discontinue operations in a number of countries. This decision triggered a write down of Goodwill and Customer relations in the amount of EUR 9.1 million and EUR 4.6 million, respectively. The earnings, cash flow, assets and liabilities in this group of countries is reported as discontinued operations.
During 2019 good progress was made to sell or close activities in these countries. Quant Latvia SIA was sold and the impact on the Group was insignificant. Quant Belgium NV and Quant France SAS were liquidated as at 31 December 2019. Most remaining countries had no operations at year-end but were still in the administrative process of liquidating. In two countries Quant subsidiaries were still operating as the contracts terminate early in 2020. The financial information for 2019 is found in the following tables:
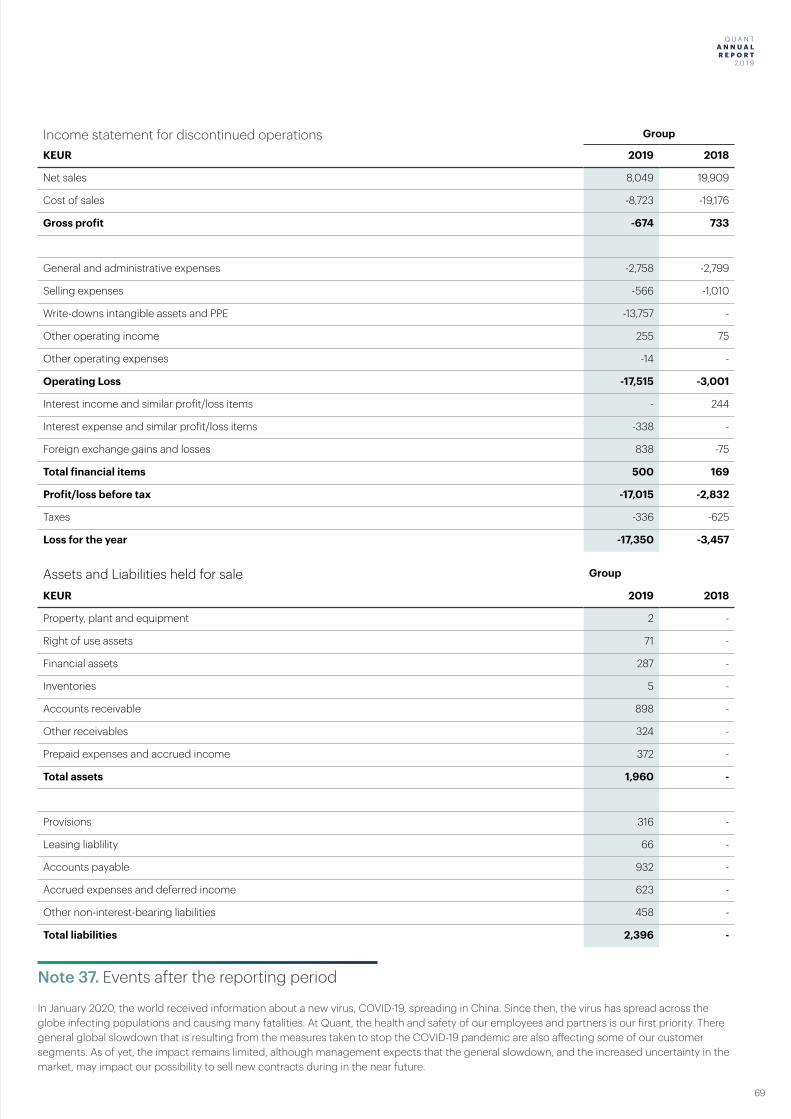
Q U A N T A N N U A L R E P O R T 2 0 1 9
69
Q U A N T A N N U A L R E P O R T
2 0 1 9
Note 37. Events after the reporting period
In January 2020, the world received information about a new virus, COVID-19, spreading in China. Since then, the virus has spread across the globe infecting populations and causing many fatalities. At Quant, the health and safety of our employees and partners is our first priority. There general global slowdown that is resulting from the measures taken to stop the COVID-19 pandemic are also affecting some of our customer segments. As of yet, the impact remains limited, although management expects that the general slowdown, and the increased uncertainty in the market, may impact our possibility to sell new contracts during in the near future.
Income statement for discontinued operations Group
KEUR 2019 2018
Net sales 8,049 19,909
Cost of sales -8,723 -19,176
Gross profit -674 733
General and administrative expenses -2,758 -2,799
Selling expenses -566 -1,010
Write-downs intangible assets and PPE -13,757 -
Other operating income 255 75
Other operating expenses -14 -
Operating Loss -17,515 -3,001
Interest income and similar profit/loss items - 244
Interest expense and similar profit/loss items -338 -
Foreign exchange gains and losses 838 -75
Total financial items 500 169
Profit/loss before tax -17,015 -2,832
Taxes -336 -625
Loss for the year -17,350 -3,457
Assets and Liabilities held for sale Group
KEUR 2019 2018
Property, plant and equipment 2 -
Right of use assets 71 -
Financial assets 287 -
Inventories 5 -
Accounts receivable 898 -
Other receivables 324 -
Prepaid expenses and accrued income 372 -
Total assets 1,960 -
Provisions 316 -
Leasing liablility 66 -
Accounts payable 932 -
Accrued expenses and deferred income 623 -
Other non-interest-bearing liabilities 458 -
Total liabilities 2,396 -
Q U A N T A N N U A L R E P O R T 2 0 1 9
70
Q U A N T A N N U A L R E P O R T
2 0 1 9
Quant AB556975-5654
Stockholm, April 29, 2020
The Management Report, financial statements and notes are a translation from the Swedish original.
The undersigned declare that the consolidated accounts and annual report were prepared in accordance with IFRS, as approved by the EU, and with generally accept-ed accounting practices, and give a fair presentation of the position and performance of the Group and the company, and that the Group administration report and
the company’s administration report give a fair review of the progress of the Group’s and the company’s opera-tions, position and performance, as well as describing the material risks and uncertainty factors to which the companies that are members of the Group are exposed.
Mikael NorinChairman of theboard
Per HalliusBoard member
Olof FaxanderBoard member
Henrik SandréusBoard member
Jörgen BergqvistBoard member
Casper LercheBoard member
Tomas RönnCEO
Our audit report has been submitted, April 29, 2020
Öhrlings PricewaterhouseCoopers AB
Niklas KullbergAuthorized Public Accountant
Signatures
Q U A N T A N N U A L R E P O R T 2 0 1 9
71
Q U A N T A N N U A L R E P O R T
2 0 1 9
To the general meeting of the shareholders of Quant AB (publ), corporate identity number 556975-5654
Report on the annual accounts and consolidated accounts
OpinionsWe have audited the annual accounts and consolidated accounts of Quant AB (publ) for the year 2019. The annual accounts and consolidated accounts of the company are included on pages 27-70 in this document.
In our opinion, the annual accounts have been prepared in accordance with the Annual Accounts Act and present fairly, in all material respects, the financial position of parent company and the group as of 31 December 2019 and its financial performance and cash flow for the year then ended in accordance with the Annual Accounts Act. The consolidated accounts have been prepared in accordance with the Annual Accounts Act and present fairly, in all material respects, the financial position of the group as of 31 December 2019 and their financial performance and cash flow for the year then ended in accordance with International Financial Reporting Standards (IFRS), as adopted by the EU, and the Annual Accounts Act. The statutory administration report is consistent with the other parts of the annual accounts and consolidated accounts.
We therefore recommend that the general meeting of shareholders adopts the income statement and the statement of financial position for the parent company and the group.
Our opinions in this report on the annual accounts and consolidated accounts are consistent with the content of the additional report that has been submitted to the parent company’s audit committee in accordance with the Audit Regulation (537/2014) Article 11.
Basis for OpinionsWe conducted our audit in accordance with International Standards on Auditing (ISA) and generally accepted auditing standards in Sweden. Our responsibilities under those standards are further described in the Auditor’s Responsibilities section. We are independent of the parent company and the group in accordance with professional ethics for accountants in Sweden and have otherwise fulfilled our ethical responsibilities in accordance with these requirements. This includes that, based on the best of our knowledge and belief, no prohibited services referred to in the Audit Regulation (537/2014) Article 5.1 have been provided to the audited company or, where applicable, its parent company or its controlled companies within the EU.
We believe that the audit evidence we have obtained is sufficient and appropriate to provide a basis for our opinions.
Other matterThe audit of the annual accounts and consolidated accounts for year 2018 was performed by another auditor who submitted an auditor´s report dated 29 April 2019, with unmodified opinions in the Report on the annual accounts and consolidated accounts.
Our audit approach
Audit scopeWe designed our audit by determining materiality and assessing the risks of material misstatement in the consolidated financial statements. In particular, we considered where management made subjective judgements; for example, in respect of significant accounting estimates that involved making assumptions and considering future events that are inherently uncertain. As in all of our audits, we also addressed the risk of management override
of internal controls, including among other matters consideration of whether there was evidence of bias that represented a risk of material misstatement due to fraud.
We tailored the scope of our audit in order to perform sufficient work to enable us to provide an opinion on the consolidated financial statements as a whole, taking into account the structure of the Group, the accounting processes and controls, and the industry in which the group operates.
In addition to the parent company, Quant AB, the Group Audit has included the operating companies in Sweden, Chile, Finland, Brazil, China, Switzerland and the United Arab Emirates.
MaterialityThe scope of our audit was influenced by our application of materiality. An audit is designed to obtain reasonable assurance whether the financial statements are free from material misstatement. Misstatements may arise due to fraud or error. They are considered material if individually or in aggregate, they could reasonably be expected to influence the economic decisions of users taken on the basis of the consolidated financial statements.
Based on our professional judgement, we determined certain quantitative thresholds for materiality, including the overall group materiality for the consolidated financial statements as a whole as set out in the table below. These, together with qualitative considerations, helped us to determine the scope of our audit and the nature, timing and extent of our audit procedures and to evaluate the effect of misstatements, both individually and in aggregate on the financial statements as a whole.
Key audit mattersKey audit matters of the audit are those matters that, in our professional judgment, were of most significance in our audit of the annual accounts and consolidated accounts of the current period. These matters were addressed in the context of our audit of, and in forming our opinion thereon, the annual accounts and consolidated accounts as a whole, but we do not provide a separate opinion on these matters.
Auditor’s Report(Translation from the Swedish original)
Q U A N T A N N U A L R E P O R T 2 0 1 9
72
Q U A N T A N N U A L R E P O R T
2 0 1 9
Other Information than the annual accounts and consolidated accountsThe other information is the responsibility of the Board of Directors and the Managing Director. The other information consists of an extended description of the Group’s operations in 2019 and can be found on pages 1-26 in this document.
Our opinion on the annual accounts and consolidated accounts does not cover this other information and we do not express any form of assurance conclusion regarding this other information.
In connection with our audit of the annual accounts and consolidated accounts, our responsibility is to read the information identified above and consider whether the information is materially inconsistent with the annual accounts and consolidated accounts. In this procedure we also take into account our knowledge otherwise obtained in the audit and assess whether the information otherwise appears to be materially misstated.
If we, based on the work performed concerning this information, conclude that there is a material misstatement of this other information, we are required to report that fact. We have nothing to report in this regard.
Key audit matter How our audit addressed the key audit matter
Recognition of revenue from the sale of maintenance and repair services at the right amount and in the right period.
The Group’s revenues are mainly related to multi-year customer contracts with manufacturing companies where Quant pro-vides maintenance and repair services for customers’ produc-tion facilities. The contracts are mainly of standard nature and contain either one main performance obligation for main-tenance work, or several performance obligations, which in addition to maintenance work also includes eg additional work or sales of spare parts. Pricing can be both fixed and variable. In some cases, the contracts have a fixed price combined with certain variable parts such as bonuses based on agreed KPIs. In these cases, management’s calculations and assumptions form the basis for revenue recognition. For multi-year fixed-price contracts, revenue is recognized evenly over the life of the contract. Invoicing normally occurs in the month in which the services are performed. In cases where invoicing differs from worked-up revenue for the period, accrued revenue or prepaid income is reported to the extent that the invoiced amount differs from the worked-up revenue. As a result of manual calculations and assumptions being made in the accounts, combined with the fact that the revenue flow is significant, we have assessed the revenue as an important area in the audit. For accounting principles regarding the Group’s revenues, we refer to Note 1 in the annual report for 2019.
How our audit addressed the key audit matter
We have focused a significant part of our audit on evaluating Quant’s principles for revenue recognition. We have done this, among other things, by performing the following audit proce-dures:
• Analysis of revenue during the year compared to the previous year.
• Reviewed a selection of major contracts against the contract terms and Quant’s guidelines for assessing revenue recognition.
• On a sample basis, tested that revenue is reported in the correct period and at the correct amount.
• Reviewed credit notes after the end of the financial year.• Evaluated Quant’s accounting principles and the notes
provided.
The performed audit procedures have not identified any signifi-cant observations related to this area.
Impairment testing of acquisition-related surplus values and goodwill
In the consolidated balance sheet, acquisition-related surplus values and goodwill are reported at a value of 112 643 KEUR. Goodwill and acquisition-related surplus values correspond to the difference between the value of net assets and the purchase price paid in an acquisition. Unlike other assets, there is no amortization of goodwill, which is tested annually for impairment or when there is an indication of impairment. Other acquisition-related surplus values are amortized over the estimated useful life. When the company management exam-ines cash-generating units for impairment, the reported values are compared with the estimated recoverable amount. If the recoverable amount is substantially lower than the reported value, the asset is written down to its estimated recoverable value. The recoverable amount is determined by calculating the asset’s value in use. When calculating the value in use, compa-ny management must make assumptions about future growth and margin development. Future events and new information may change these assessments and estimates, and it is there-fore particularly important for the management to continuously evaluate whether the value of the acquisition-related intangible assets can be justified taking into account the assumptions made.
How our audit addressed the key audit matter
In our audit, we have focused on management´s assessment of impairment and the identified surplus values. We have, among other things, performed the following procedures:
• Evaluated Quant’s process for testing acquisition-related surplus values and goodwill for impairment.
• With the support of PwC’s internal valuation specialists, eval-uated the reasonableness of the discount rate used.
• Evaluated the reasonableness of assumptions made and conducted sensitivity analyzes for changed assumptions.
• Evaluated management’s forecasting ability by comparing previously made forecasts against actual outcomes.
• Based on materiality, confirmed that sufficient note informa-tion is provided in the annual report.
The performed audit procedures have not identified any signifi-cant observations related to this area.
Q U A N T A N N U A L R E P O R T 2 0 1 9
73
Q U A N T A N N U A L R E P O R T
2 0 1 9
Stockholm, April 29, 2020
Öhrlings PricewaterhouseCoopers AB
Nicklas KullbergAuthorized Public Accountant
Responsibilities of the Board of Director’s and the Managing DirectorThe Board of Directors and the Managing Director are responsible for the preparation of the annual accounts and consolidated accounts and that they give a fair presentation in accordance with the Annual Accounts Act and, concerning the consolidated accounts, in accordance with IFRS as adopted by the EU. The Board of Directors and the Managing Director are also responsible for such internal control as they determine is necessary to enable the preparation of annual accounts and consolidated accounts that are free from material misstatement, whether due to fraud or error.
In preparing the annual accounts and consolidated accounts, The Board of Directors and the Managing Director are responsible for the assessment of the company’s and the group’s ability to continue as a going concern. They disclose, as applicable, matters related to going concern and using the going concern basis of accounting. The going concern basis of accounting is however not applied if the Board of Directors and the Managing Director intend to liquidate the company, to cease operations, or has no realistic alternative but to do so.
The Audit Committee shall, without prejudice to the Board of Director’s responsibilities and tasks in general, among other things oversee the company’s financial reporting process.
Auditor’s responsibilityOur objectives are to obtain reasonable assurance about whether the annual accounts and consolidated accounts as a whole are free from material misstatement, whether due to fraud or error, and to issue an auditor’s report that includes our opinions. Reasonable assurance is a high level of assurance but is not a guarantee that an audit conducted in accordance with ISAs and generally accepted auditing standards in Sweden will always detect a material misstatement when it exists. Misstatements can arise from fraud or error and are considered material if, individually or in the aggregate, they could reasonably be expected to influence the economic decisions of users taken on the basis of these annual accounts and consolidated accounts.
A further description of our responsibility for the audit of the annual accounts and consolidated accounts is available on Revisorsinspektionen’s website: www.revisorsinspektionen.se/revisornsansvar. This description is part of the auditor´s report.
Report on other legal and regulatory requirements
OpinionsIn addition to our audit of the annual accounts and consolidated accounts, we have also audited the administration of the Board of Director’s and the Managing Director of Quant AB (publ) for the year 2019 and the proposed appropriations of the company’s profit or loss.We recommend to the general meeting of shareholders that the profit be appropriated in accordance with the proposal in the statutory administration report and that the members of the Board of Director’s and the Managing Director be discharged from liability for the financial year.
Basis for OpinionsWe conducted the audit in accordance with generally accepted auditing standards in Sweden. Our responsibilities under those standards are further described in the Auditor’s Responsibilities section. We are independent of the parent company and the group in accordance with professional ethics for accountants in Sweden and have otherwise fulfilled our ethical responsibilities in accordance with these requirements.
We believe that the audit evidence we have obtained is sufficient and appropriate to provide a basis for our opinions.
Responsibilities of the Board of Director’s and the Managing DirectorThe Board of Directors is responsible for the proposal for appropriations of the company’s profit or loss. At the proposal of a dividend, this includes an assessment of whether the dividend is justifiable considering the requirements which the company’s and the group’s type of operations, size and risks place on the size of the parent company’s and the group’ equity, consolidation requirements, liquidity and position in general.
The Board of Directors is responsible for the company’s organization and the administration of the company’s affairs. This includes among other things continuous assessment of the company’s and the group’s financial situation and ensuring that the company´s organization is designed so that the accounting, management of assets and the company’s financial affairs otherwise are controlled in a reassuring manner. The Managing Director shall manage the ongoing administration according to the Board of Directors’ guidelines and instructions and among other matters take measures that are necessary to fulfill the company’s accounting in accordance with law and handle the management of assets in a reassuring manner.
Auditor’s responsibilityOur objective concerning the audit of the administration, and thereby our opinion about discharge from liability, is to obtain audit evidence to assess with a reasonable degree of assurance whether any member of the Board of Directors or the Managing Director in any material respect:
• has undertaken any action or been guilty of any omission which can give rise to liability to the company, or
• in any other way has acted in contravention of the Companies Act, the Annual Accounts Act or the Articles of Association.
Our objective concerning the audit of the proposed appropriations of the company’s profit or loss, and thereby our opinion about this, is to assess with reasonable degree of assurance whether the proposal is in accordance with the Companies Act.
Reasonable assurance is a high level of assurance, but is not a guarantee that an audit conducted in accordance with generally accepted auditing standards in Sweden will always detect actions or omissions that can give rise to liability to the company, or that the proposed appropriations of the company’s profit or loss are not in accordance with the Companies Act.A further description of our responsibility for the audit of the administration is available on Revisorsinspektionen’s website: www.revisorsinspektionen.se/revisornsansvar. This description is part of the auditor’s report.Öhrlings PricewaterhouseCoopers AB, Torsgatan 21, was appointed auditor of Quant AB (publ) by the general meeting of the shareholders on the 5 november 2019 and has been the company’s auditor since the 5 november 2019.