quand les gaz de roche mère bouleversent la donne: impacts
TRANSCRIPT
Quand les gaz de roche mère bouleversent la donne: impacts économiques sur le gaz européen.Yoann Desgrange et Xavier Dran

Summary State of the art:
What is unconventional gas?
History of the shale gas development
Global reserve estimations
Development of shale gas in Europe: Challenges
Opportunities
Case studies
Europe gas supply: Demand and current import streams
Impact of the development of shale gas in the rest of the world
Consequences on the evolution of the supply mix
2

State of the art- What is unconventional gas?
- History of shale gas development- Global reserve estimations
3

What is unconventional gas?4
Different types of unconventional gas:
Source: Total 2014

What is unconventional gas?5
Main differences with conventional gas: Underground fracking and horizontal drilling
Well lifetime
Well flow rate
Well price
Typical production rate of gas wells over time
0%
10%
20%
30%
40%
50%
60%
70%
80%
90%
100%
1 6 11 16 21 24 25 26 27 28 29 30
Well flow rate
Indicative time (years)
shale gas
conventionnalgas

Exploitation6
Well construction (Vertical and horizontal drilling)
Perforations in the production casing
Hydraulic Fracturing (around15,000 m3 of water)
90.0%
9.5%0,5%
Volumetric composition of a fracture fluid
Water
Sand
Chemicals
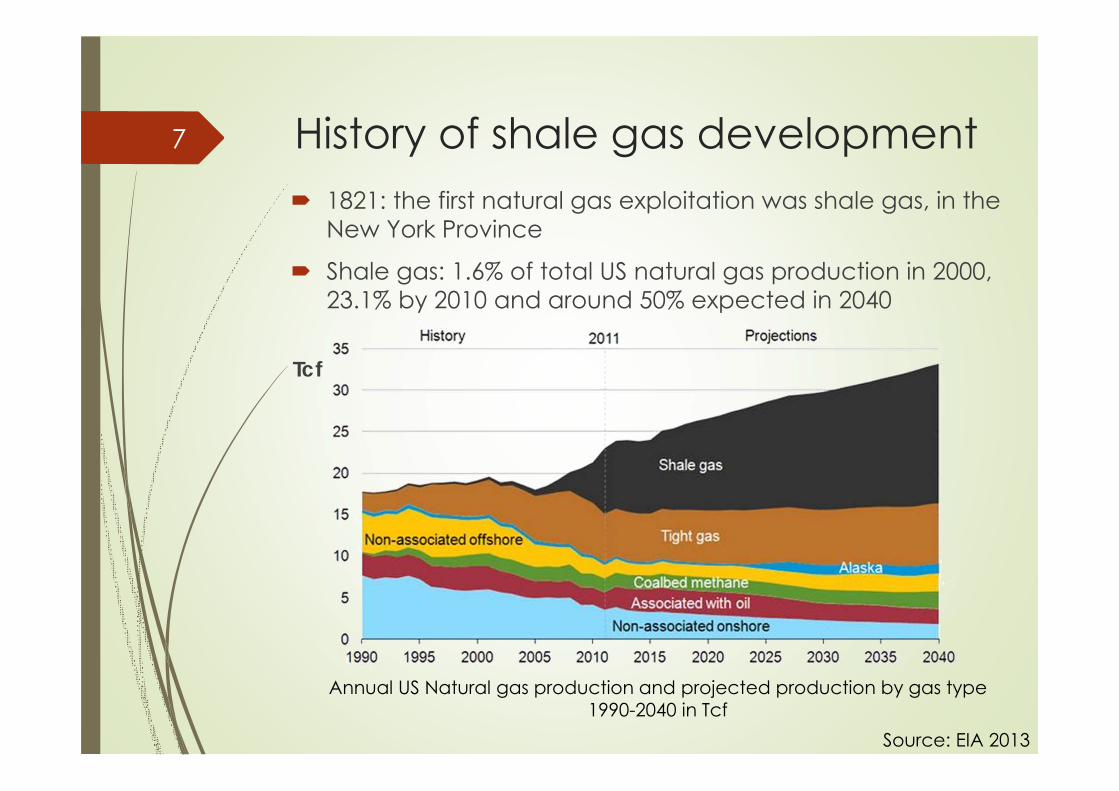
History of shale gas development7
Annual US Natural gas production and projected production by gas type 1990-2040 in Tcf
1821: the first natural gas exploitation was shale gas, in the New York Province
Shale gas: 1.6% of total US natural gas production in 2000, 23.1% by 2010 and around 50% expected in 2040
Tcf
Source: EIA 2013
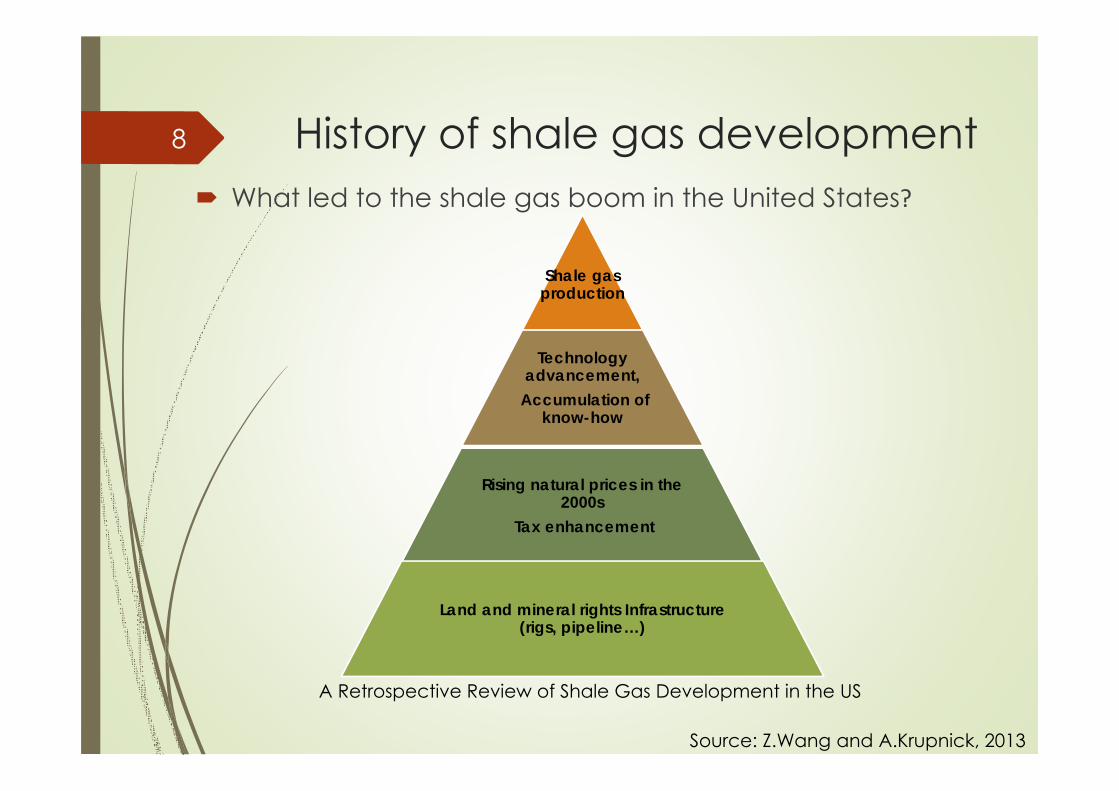
History of shale gas development8
Shale gasproduction
Technologyadvancement,
Accumulation of know-how
Rising natural prices in the 2000s
Tax enhancement
Land and mineral rights Infrastructure (rigs, pipeline…)
What led to the shale gas boom in the United States?
A Retrospective Review of Shale Gas Development in the US
Source: Z.Wang and A.Krupnick, 2013

Resources and reserves9
EIA: a single data source…
Large uncertainties inside North America (EIA/ARI)
Large uncertainties outside North America Lack of exploration, especially in Europe
Proved/Probable reserves: gas recovery factor: 20 to 40%
Source: European Commission, 2012
Unconventional gas reserves estimates
Development of shale gas in Europe- Challenges- Opportunities- Case studies
10

Challenges Mining law
In the US: ownership of the land induces ownership of the underground resources Usually, 12-20% of the earnings go to the landowner
Strong incentive for the owners
In European countries: resources belong to the state Need for state approval
Exploration seen as the threat by the owner
Higher density Higher land costs
Industrial externalities become sensitive issues
(noise, truck traffic)
11
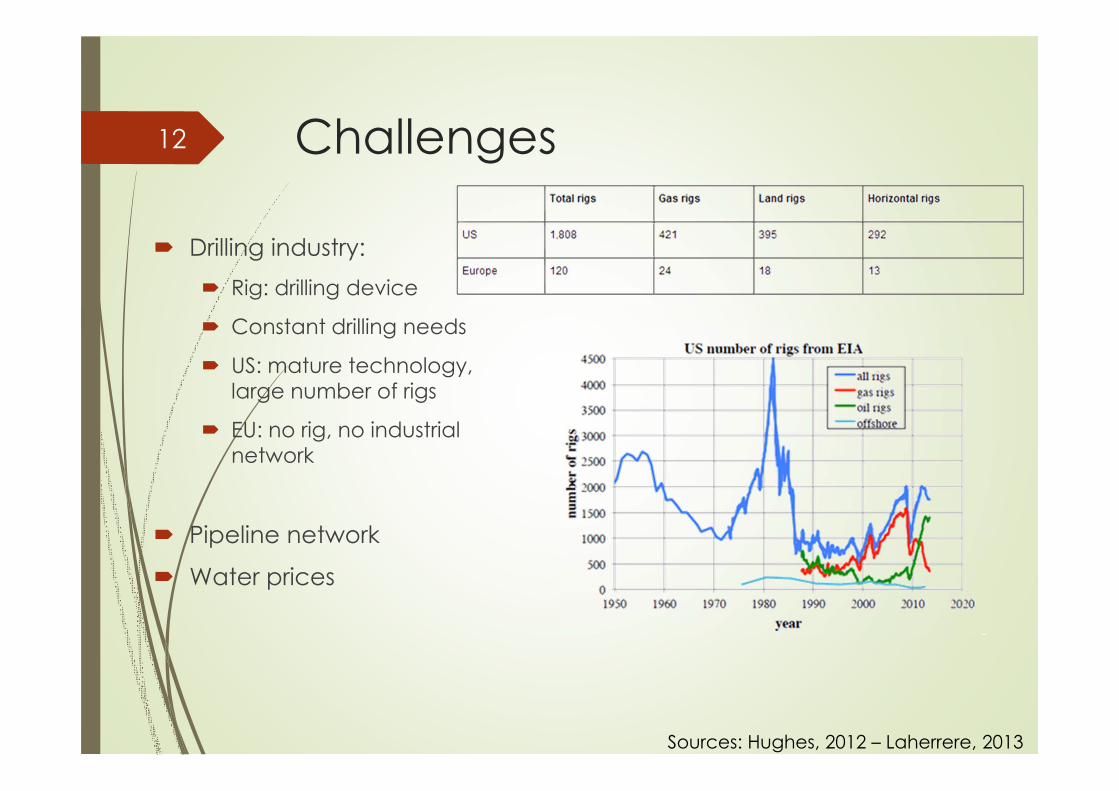
Challenges
Drilling industry: Rig: drilling device
Constant drilling needs
US: mature technology, large number of rigs
EU: no rig, no industrial network
Pipeline network
Water prices
12
Sources: Hughes, 2012 – Laherrere, 2013
Challenges Environmental concerns
The following risks are noteworthy: Water management in the fracking process Potential seismic risks Inconveniences to the public (constant drilling activity in
populated areas) Greenhouse gas and chemicals
Local resistance Fracking outlawed in several countries (France…)
13

Opportunities Alleged important potential in some European
countries:
14
Shale gas reserves and costs
Source: Medlock, Myers Jaffe and Hartley, 2011

Opportunities Political reasons: independence from oil-exporting
countries
Competitiveness issue for the European industry
Energy-intensive industries moving away (to the US…)
Securing energy supply
Recurring activities in unconventional gas prospection, exploration and production
Improvement of the trade balance
15

Consequences Higher well price expected in Europe
At least 10 M$, vs 5-6 M$ in the US
16
Source : Boston Consulting Group, 2010 - INSEAD, 2013

Case studies - Poland European pioneer
Strong political support
2011 reserves assumption: 5.3 Tm3
Lublin, Baltic and Danish-Polish basins
2012: divided by 10
Likely to be increased again
Exxon Mobil exited
Drilling price in Poland: 11M$/well (Schlumberger)
17
Shale gas reserves in Poland
Source: Polish shale gas, 2012

Case studies – France & UK
France UK
Estimated reserves, in TM3 3.9 0.96
Political support -- ++
18
Barnett Shales,
USAParisian bassin,
FranceBowlandShale, UK
Well cost (depth 2500m, horizontal drain 1000m, 10 drills contract)
3M$ 6M$ -
Fracking cost 2M$ 4M$ -Fracking duration (days) 6 10 -Total cost (M$) 5-6 10 8-11Break even price ($/mmbtu) 5-6 10 7-12Spot gas price ($/mmbtu) 4-5 8-11 8-11
Sources: EIA, 2013 – Bauquis, 2013 - Bloomberg Finance L.P, 2013

Europe gas supply- Demand and current import streams;
- Impact of the development of shale gas in the restof the world;
- Consequences on the evolution of the supply mix.
19

European gas demand The evolution of gas demand:
471 Gm3 in 2011 (10.7% less than in 2010)
Still, 1% annual growth until 2020
Share of gas in the EU energy mix: 25% → 30% (2030)
The longer term evolution depends on the viability of CCS
20
Sources: Direction générale de l’énergie et du climat, 2011 – Teusch, 2012 – ENTSOG, 2013
2020
+1 % / year
Today : 25 %
: 30 %Gas demand
Gas in the EU mix
2030

Import streams New projects:
South stream from Russia to Italy (63 Gm3/year for Europe)
South Corridor to exploit Shah Deniz II (10 Gm3/year for Europe)
21
Sources: Direction générale de l’énergie et du climat, 2011 – BP, 2013 – ENTSOG, 2013
Today
Imports EU imports: 330 Gm3 (today) →540 Gm3 (2035)
Local shale gas production: not a game changer
150 Gm3/year LNG potential (2012) → x2 or 3 by 2020
Full use deemed unlikely: 2,5 times more re-gaseification capacity than
liquefaction capacity globally
More competitive and flexible
22
Sources: Direction générale de l’énergie et du climat, 2011 – Teusch, 2012
LNG
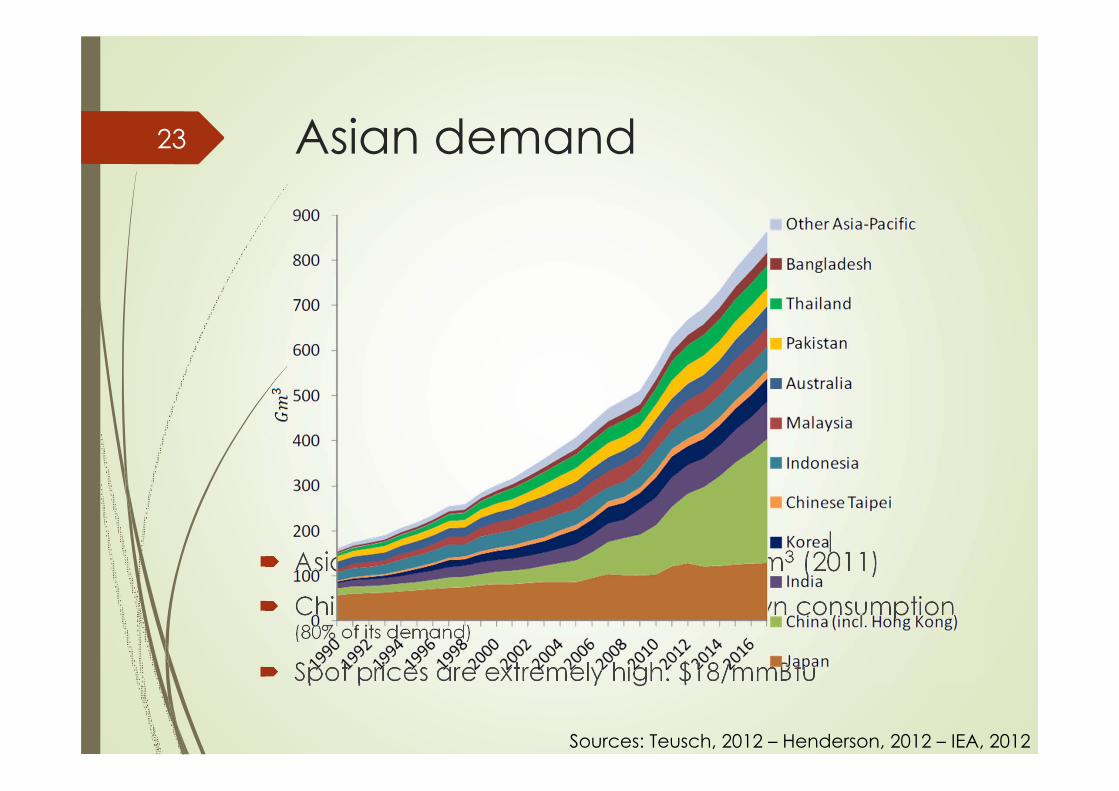
Asian demand
Asia imports: 19 Gm3 (2000) → 112 Gm3 (2011) Chinese shale gas production for its own consumption
(80% of its demand)
Spot prices are extremely high: $18/mmBtu
23
Sources: Teusch, 2012 – Henderson, 2012 – IEA, 2012

Australian and NA production
Australia → Asia
Canada → Asia: Reserves in British Columbia
Massive Asian investments
US → both Asia and Europe: Terminals in the Gulf of Mexico (Sabine Pass)
24
Sources: Henderson, 2012 – Teusch, 2012 – FERC, 2013
Australia Canada USExports
(Gm3/year) 120 27 34

Focus on the US25
Sources: Henderson, 2012 – Teusch, 2012 – Deloitte Centre for Energy Solution, 2012
[$/mmBtu] Henry hub spot price
Liquifaction and regaseification Transport Final costs Region
spot prices Margins
Asia3.5 + 3.35
+ 3.00 9.85 18 8.15
Europe + 1.35 8.10 11 2.90
• Henry hub spot price : 3.5 $/mmBtu
[$/mmBtu] Henry hub breakeven price
Liquifaction and regaseification Transport Final costs Region
spot prices Margins
Asia6 + 3.35
+ 3.00 12.35 18 5.65
Europe + 1.35 10.60 11 0.40
• Henry hub break even price : 6 $/mmBtu
[$/mmBtu] Henry hub spot price
Liquifaction and regaseification Transport Final costs Region
spot prices Margins
Asia3.5 + 3.35
+ 3.00 9.85 18 8.15
Europe + 1.35 8.10 11 2.90
[$/mmBtu] Henry hub breakeven price
Liquifaction and regaseification Transport Final costs Region
spot prices Margins
Asia6 + 3.35
+ 3.00 12.35 18 5.65Europe + 1.35 10.60 11 0.40
Impact of the US self-sufficiency Still, US shift will affect Europe
New LNG streams → bargaining chips for Europe
Gas-on-gas competition now makes for 50% of Europe long term contracts (20% in 2005)
26
Sources: Henderson, 2012 – Teusch, 2012

One of the major impact on imports from Russia will bethe evolution of imports from Norway
27
Sources: ENTSOG, 2013
Evolution of EU supply mix

Conclusion Estimation of shale gas reserves are quite widespread
Local production in Europe will at best compensate for the fall in conventional production
North American LNG exports are unlikely to be more than a bargaining chip for Europe
European supply mix is likely to stay similar even though the terms could evolve
28

Thank you!
Main references Boston Consulting Group, 2010. Medium-term tendencies on term
tendencies on the gas market: Materials for panel discussion. ENTSOG, 2013. Ten-Year Network Development Plan. European
Network of Transmission System Operators for Gas. Henderson, J., 2012. The Potential Impact of North American LNG
Exports. University of Oxford. INSEAD, 2013. Europe’s shale gas competitiveness challenge and
consequences for the petrochemical sector. JRC, 2012. Unconventional Gas: Potential Energy Market Impacts in
the European Union. Joint Research Centre – European Commission. Teusch, J., 2012. Shale Gas and the EU Internal Gas Market: Beyond
the hype and hysteria. Centre for European Policy Studies. Total, 2012. Strategic sectors: unconventional gas – resources for the
future. Vially, R., Maisonnier, G. and Rouaud, T., 2013. Hydrocarbures de
roche-mère : États des lieux. Rapport IFPEN Wang, Z. and Krupnick, A., 2013. A retrospective review of shale gas
development in the United States. Resources for the Future.
30
31
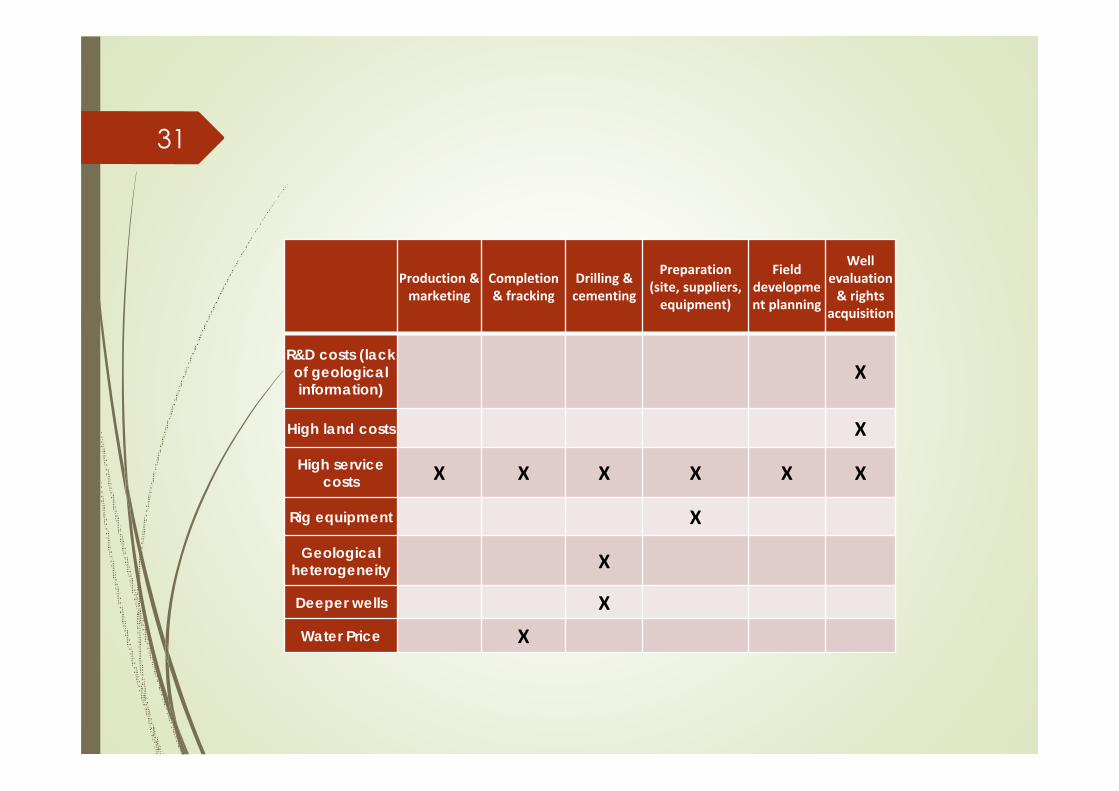
Production & marketing
Completion & fracking
Drilling & cementing
Preparation (site, suppliers,equipment)
Field development planning
Well evaluation & rights
acquisition
R&D costs (lack of geological information)
X
High land costs X
High service costs X X X X X X
Rig equipment X
Geological heterogeneity X
Deeper wells XWater Price X
32
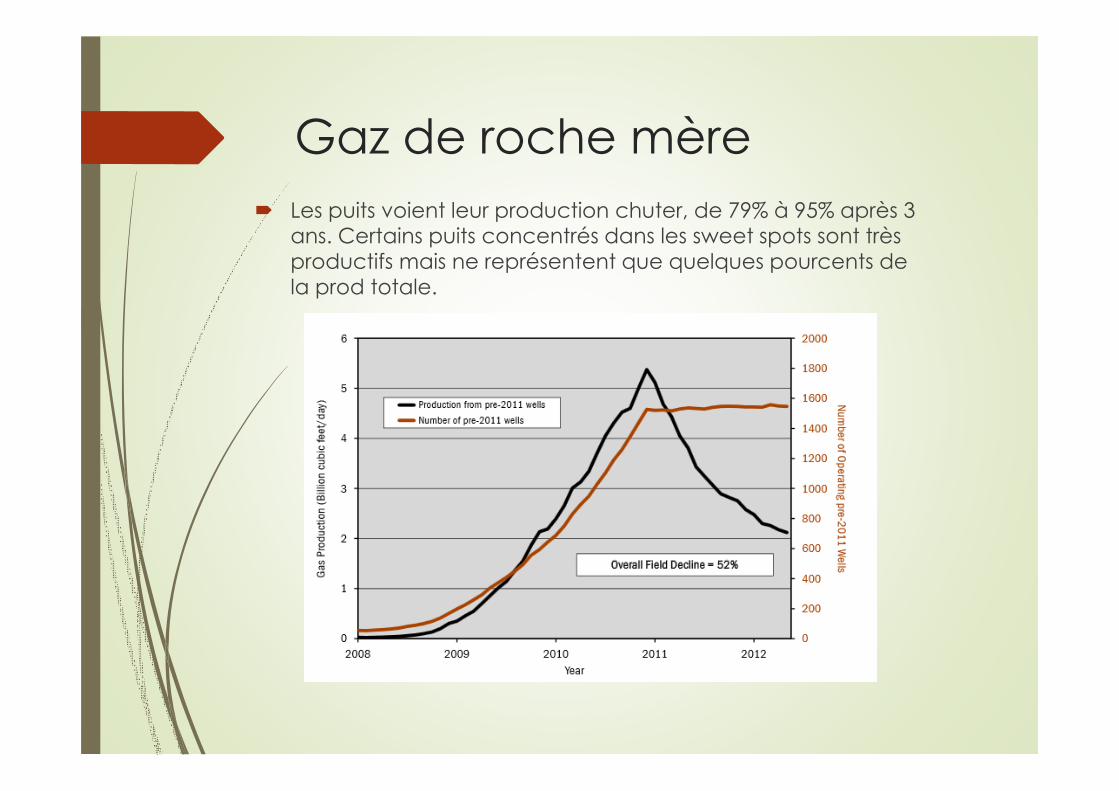
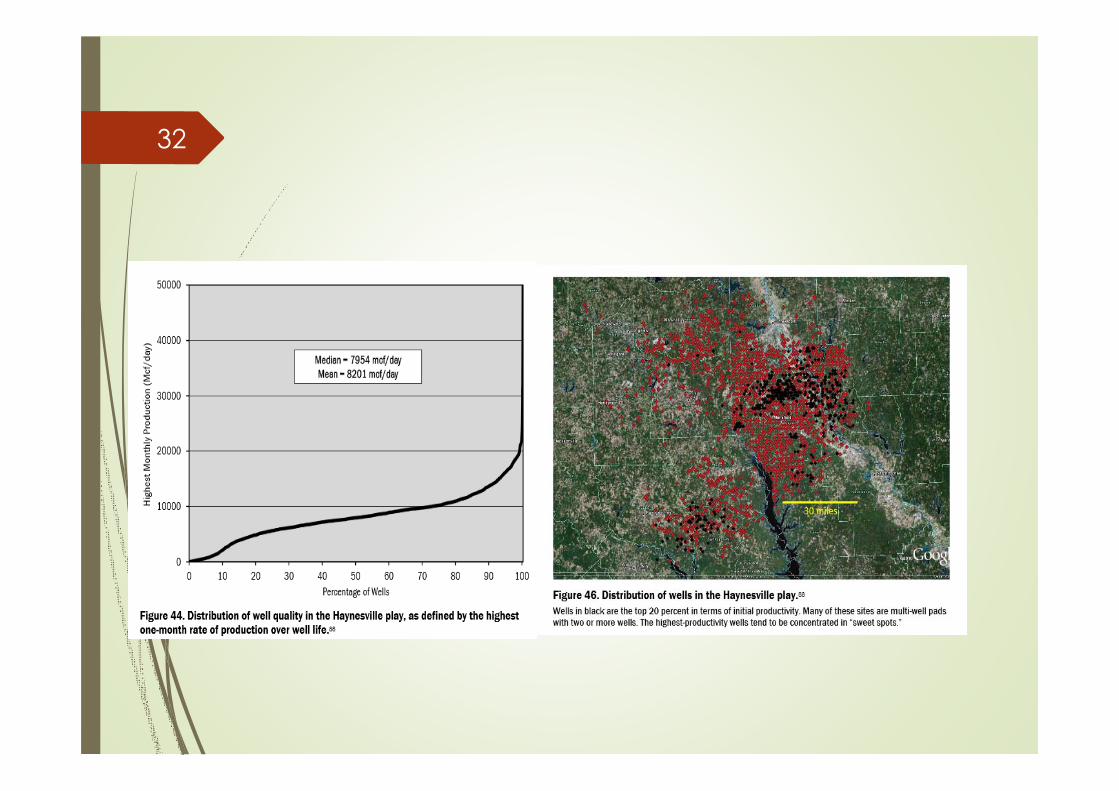
Gaz de roche mère Les puits voient leur production chuter, de 79% à 95% après 3
ans. Certains puits concentrés dans les sweet spots sont très productifs mais ne représentent que quelques pourcents de la prod totale.

Gaz de roche mère L'ensemble du déclin des puits implique que de 30 à
50% de la production annuelle doit être remplacée par de nouveau forages -> ~40 milliards $ d'investissement annuel pour simplement maintenir la prod. (comparaison : le gaz produit en 2012 a rapporté environ 33 milliards de $)

35