quality outcomes and financial benefits of nutrition ... outcomes and financial benefits of...
TRANSCRIPT

Quality Outcomes and Financial Benefits of Nutrition Intervention Maggie Whalen, RN, RD, BSN, CNSC Clinical Liaison

DISCLOSURE
• Support for this program is provided by Abbott Nutrition
• The speaker is a member of the Abbott Nutrition Sales Force
• The program is not intended for continuing education credits for any health care professional
September 4, 2015 Quality Outcomes and Financial Benefits of Nutrition Intervention 2

OBJECTIVES
• Discuss healthcare reform trends
• Describe the effect of nutrition intervention on improved patient outcomes
• Examine evidence-based recommendations for patients at risk for malnutrition
• Review Health Economic data supporting the use of oral nutritional supplements (ONS) in hospitalized patients
• Discuss next steps
September 4, 2015 Quality Outcomes and Financial Benefits of Nutrition Intervention 3

September 4, 2015 4
A Changing Healthcare Landscape:
The Effect of Nutrition on Clinical Outcomes
Quality Outcomes and Financial Benefits of Nutrition Intervention

Performance against the nation determines penalty
CMS=Centers for Medicare and Medicaid Services
2013 HIDA Acute Care Market Report, Alexandria Va. www.HIDA.org http://www.cms.gov/newsroom/ mediareleasedatabase/fact-sheets/2014-fact-sheets-items/2014-04-30-2.html
A CHANGING HEALTHCARE LANDSCAPE
Payment adjustments based on interventions and outcomes related to:
Efficiency (2015)
Outcomes (2014)
Processes of Care
Patient Satisfaction measures
1.50% of DRG payments in 2015
Hospital Value Based Purchasing (VBP)
Readmission Reduction Program
Hospital Acquired Condition Reduction Program
Hospitals benchmarked against national averages and penalties for low-performers inflicted for:
Patients who have been discharged then return to hospital within 30 days after having AMI, CHF, pneumonia and for COPD and Hip/Knee Arthroplasty 2015
Even if reason for return is not related to original hospitalization
Payment Adjustments for all Medicare payments to hospital – 1% in 2013, 2% in 2014, 3% in 2015
CMS does not reimburses for the following conditions that occur in the hospital:
Burns/electric shock
Falls
Pressure ulcers stage III & IV
Surgical foreign object retention
Air embolism
Blood incompatibility
Poor glycemic control
Catheter-associated urinary tract infections
Bottom 25% will be penalized 1% in 2015 (new)
September 4, 2015 Quality Outcomes and Financial Benefits of Nutrition Intervention 5

SHIFTING MARKET DYNAMICS PROVIDE AN OPPORTUNITY TO ELEVATE THE ROLE OF NUTRITION
September 4, 2015 Quality Outcomes and Financial Benefits of Nutrition Intervention 6
Role of Nutrition in Improving Patient Outcomes
Aging Population
Disease Incidence
Healthcare Consumption
Quality of Life
Life Expectancy
Evolving Demographics
CMS Payments
Quality of Care
Cost of Care
Transitional Care
Evolving Health Policy

SOME PREVENTABLE OCCURRENCES PRESENT A FINANCIAL BURDEN
September 4, 2015 Quality Outcomes and Financial Benefits of Nutrition Intervention 7
1 Department of Health and Human Services. Book 2. Federal Register. 2008;73:48433-49084. 2 Hackbarth GM, et al. 2007. Report to the Congress: Medicare Payment Policy. Washington, DC.: Medicare Payment Advisory Commission.
Surgical Site Infections
$39,858,2681
Falls $6,560,726,0041
Pressure Ulcers $11,111,505,0601
Readmissions $12,000,000,0002
September 4, 2015 8 Quality Outcomes and Financial Benefits of Nutrition Intervention
Malnutrition:
Identification and Intervention Throughout the Continuum of Care

MALNUTRITION IS AN INDEPENDENT PREDICTOR OF POOR CLINICAL OUTCOMES
September 4, 2015 Quality Outcomes and Financial Benefits of Nutrition Intervention 9

RECOMMENDED CHARACTERISTICS FOR THE IDENTIFICATION AND DOCUMENTATION OF ADULT MALNUTRITION
September 4, 2015 Quality Outcomes and Financial Benefits of Nutrition Intervention 10
1 White et al., JAND 2012;112:730-738. 2 White et al., JPEN 2012;36:275-283.
Insufficient Energy Intake
Functional Status
Fluid Accumulation Subcutaneous
Fat
Muscle Mass
Weight Loss
Adult Malnutrition1,2
(if ≥2, present)
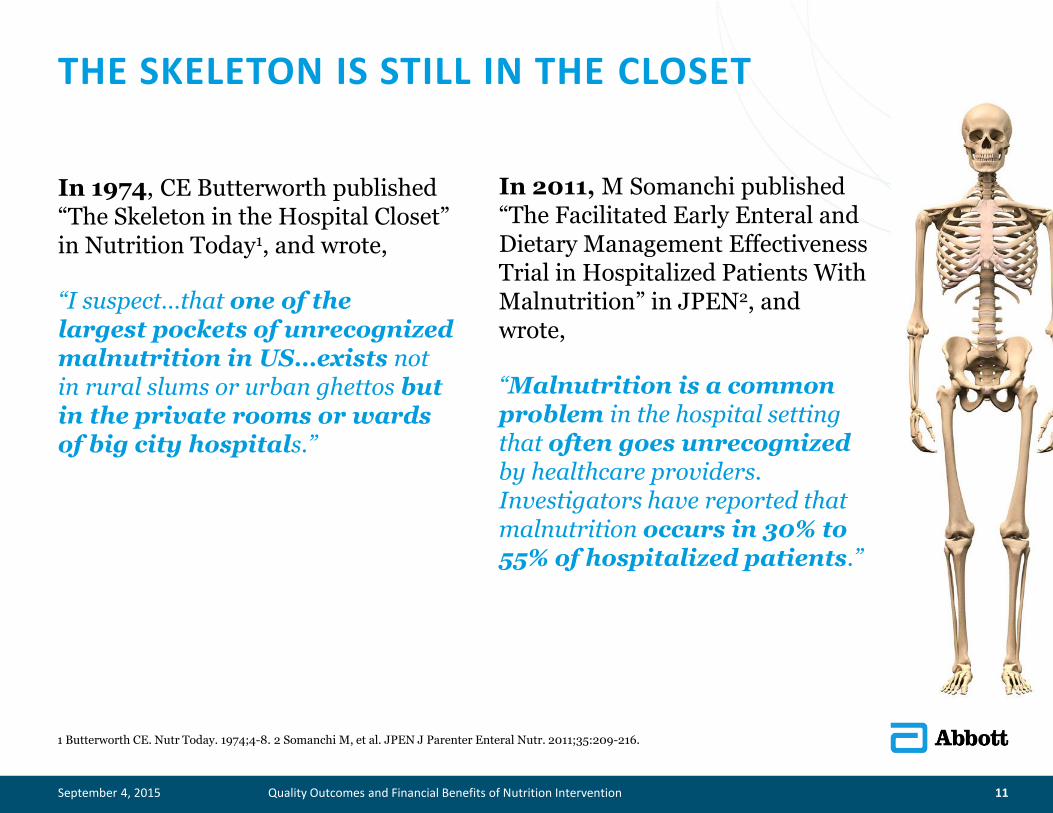
THE SKELETON IS STILL IN THE CLOSET
September 4, 2015 Quality Outcomes and Financial Benefits of Nutrition Intervention 11
1 Butterworth CE. Nutr Today. 1974;4-8. 2 Somanchi M, et al. JPEN J Parenter Enteral Nutr. 2011;35:209-216.
In 1974, CE Butterworth published “The Skeleton in the Hospital Closet” in Nutrition Today1, and wrote,
“I suspect…that one of the largest pockets of unrecognized malnutrition in US…exists not in rural slums or urban ghettos but in the private rooms or wards of big city hospitals.”
In 2011, M Somanchi published “The Facilitated Early Enteral and Dietary Management Effectiveness Trial in Hospitalized Patients With Malnutrition” in JPEN2, and wrote,
“Malnutrition is a common problem in the hospital setting that often goes unrecognized by healthcare providers. Investigators have reported that malnutrition occurs in 30% to 55% of hospitalized patients.”

MALNUTRITION: SCOPE OF THE PROBLEM
Prevalent across all healthcare settings
September 4, 2015 Quality Outcomes and Financial Benefits of Nutrition Intervention 12
Healthcare Setting Prevalence
Hospital 30-50%1-4
Long-Term Care 21%-51%5
Outpatient & Homecare 13-30%5
Risk is increased in:6
• Older adults
• Critically ill patients
• Patients with comorbid chronic diseases, e.g., cancer, COPD, chronic kidney disease
1 Coats KG et al. J Am Diet Assoc.1993;93:27-33. 2 Giner M et al. Nutrition.1996;12:23-29. 3 Thomas DR et al. Am J Clin Nutr.2002;75:308-313. 4 Somanchi M et al. JPEN. 2011;35:209-216. 5 Guigoz Y. J Nutr Health Aging. 2006;10:466-487. 6 Jensen GL, et al. JPEN J Parenter Enteral Nutr. 2010;34:156-159.


CAUSES OF LEAN BODY MASS LOSS
Normal
Aging
Bed rest
Poor diet
Cyclical dieting
Lack of physical activity
September 4, 2015 Quality Outcomes and Financial Benefits of Nutrition Intervention 14
Abnormal—stressed state
Chronic diseases – Cancer, Diabetes, COPD
Acute illnesses/complications – Flu, Sepsis, Wounds
Surgical healing/immobilization – General, Orthopedic, Cardiac
Acute injuries/immobilization – Sports-related, Trauma/accidents, Burns

BED REST, AGE AND HOSPITALIZATION INCREASE LOSS OF MUSCLE
September 4, 2015 Quality Outcomes and Financial Benefits of Nutrition Intervention 15
1 Paddon-Jones D et al. J Clin Endocrinol Metab. 2004;89:4351-4358. 2 Kortebein P et al. JAMA. 2007;297:1772-1774.
3 Paddon-Jones D. Presented at: 110th Abbott Nutrition Research Conference; June 23-25, 2009; Columbus, Ohio.
Healthy Young
28 Days Inactivity1
≈ 1 lb loss of muscle
≈ 2.2 lb loss of muscle
≈ 2.2 lb loss of muscle
Healthy Elders
10 Days Inactivity2
Elderly Inpatients
3 Days Hospitalization3
0
.5
-1.0
-2.5
-2.0
-1.5

LOSS OF LEAN BODY MASS INCREASES RISK FOR COMPLICATIONS1
September 4, 2015 Quality Outcomes and Financial Benefits of Nutrition Intervention 16
% Loss of Total LBM
Complications Associated
Mortality (%)
10 Decreased immunity,
increased infections 10
20 Decreased healing,
weakness, infection 30
30 Too weak to sit, pressure ulcers,
pneumonia, no healing 50
40 Death, usually from
pneumonia 100
1 Demling DH. Eplasty. 2009;9:65-94.

LINK BETWEEN LBM AND FUNCTIONALITY
September 4, 2015 Quality Outcomes and Financial Benefits of Nutrition Intervention 17
Nutrition
Muscle / LBM
Strength Functionality
ADLs

FALLS ARE ASSOCIATED WITH MALNUTRITION
September 4, 2015 Quality Outcomes and Financial Benefits of Nutrition Intervention 18
1 Bauer JD et al. J Nutr Diet. 2007;20:558-564. 2 Vivanti A, et al. J Nutr Health Aging. 2011;15:388-391.
Malnutrition not a contributing
cause
Malnutrition is a contributing
cause in
45% of cases
45% of patients who fall in the hospital suffer from malnutrition,1 which is significantly associated with reduced mobility.2

RISK OF NEVER EVENTS WITH PRE-EXISTING MALNUTRITION/WEIGHT LOSS1
September 4, 2015 Quality Outcomes and Financial Benefits of Nutrition Intervention 19
1 Fry DE, et al. Arch Surg. 2010;145:148-151.
3 0 1 2 4 5 6
Surgical site infection 2.5
Mediastinitis after CABG 5.3
Catheter-associated UTI 5.1
Pressure Ulcer 3.8
Odds Ratio

September 4, 2015 20 Quality Outcomes and Financial Benefits of Nutrition Intervention
Improving Clinical and Economic Outcomes With Nutrition Intervention

INADEQUATE FOOD INTAKE
• More than 50% of patients did not eat full meal provided1
• Of those patients who ate less than ¼ of their meals, more than 50% did not receive nutrition supplementation1
September 4, 2015 Quality Outcomes and Financial Benefits of Nutrition Intervention 21
1 Hiesmayr M et al. Clin Nut 2009;28:484-491.

DISCONNECT BETWEEN MD AND RD
Physicians do not order the recommendations in the dietitian’s nutrition care plan
39-57% of the time.1-4
September 4, 2015 Quality Outcomes and Financial Benefits of Nutrition Intervention 22
1 Skipper A, Young M, Rotman N, Nagl H. J Am Diet Assoc. 1994;94:45-49. 2 Hagan DW, Traynor KS, Pfaff M. J Am Diet Assoc. 2000;100:21.
3 Silver HJ, Wellman NS. J Am Diet Assoc. 2003;103:1470-1472. 4 Braga JM, Hunt A, Pope J, Molaison E. J Am Diet Assoc. 2006;106:281-284.

HIGH PROTEIN ONS RESULT IN CLINICAL, NUTRITIONAL AND FUNCTIONAL BENEFITS1
September 4, 2015 Quality Outcomes and Financial Benefits of Nutrition Intervention 23
1 Cawood AL, Elia M, Stratton EJ. Ageing Research Reviews. 2012; 11: 278-296.
Demographics Treatment Measurements
• Systematic review of 36 RCTs
• 3790 subjects (mean age 74 years; 83% of trials in patients >65 years)
• Patient populations: hip fractures, pressure ulcers, COPD, cancer, GI disease, etc.
• Readmissions
• LOS
• Complications
• Handgrip strength
• Body composition
• Body Weight
• Nutritional Status
• Energy/Protein Intake
Group 1 (treatment)
High-Protein ONS
Group 2 (control)
Usual Care

HIGH PROTEIN ONS RESULT IN CLINICAL, NUTRITIONAL AND FUNCTIONAL BENEFITS1
September 4, 2015 Quality Outcomes and Financial Benefits of Nutrition Intervention 24
1 Cawood AL, Elia M, Stratton EJ. Ageing Research Reviews. 2012; 11: 278-296.
The study also showed:
Improvement in handgrip strength (P<0.014)
Improvement in body weight (P<0.001)
Increase in muscle mass (mid-arm muscle circumference) (P<0.05)
Increase in protein and energy intake with little reduction in normal food intake (P<0.001)
19% Reduction in complications (P<0.001)
10% Reduction in length of hospital stay (P=0.04)
30% Reduction in hospital readmissions (P=0.004)

NUTRITION INTERVENTION CAN HELP IMPROVE CLINICAL OUTCOMES
September 4, 2015 Quality Outcomes and Financial Benefits of Nutrition Intervention 25
1. Cawood AL, Elia M, Stratton EJ. Ageing Research Reviews. 2012;11:278-296. 2. Gariballa S, et al. Am J Med. 2006;119:693-699. 3. Stratton RJ, Elia M. proc Nutr Soc Annual Meeting of the Nutrition Society and BAPEN 2010;1-11. 4. Norman, K., et al.,Clin Nutr, 2008. 27(1): p. 48-56. 5. Somanchi M et al. JPEN 2011;35:209-216. 6. Milne AC, Potter J, Vivanti A, Avenell A. Cochrane Database Syst Rev 2009;(2):CD003288. 7. Brugler L et al. J Qual Improv 1999;25:191-206. 8. Rana SK, et al. Clinical Nutrition 1992, vol 11, pages 337-344.
Readmissions LOS Complications
(Wounds, Infections, Pressure Ulcers)
Cawood 20111 X X X
Gariballa 20062 X X X
Stratton 20103 X
Norman 20084 X
Somanchi 20115 X
Brugler 19996 X
Milne 20097 X
Rana 19928 X

NUTRITION INTERVENTION CLINICAL STUDY OVERVIEW BY PATIENT POPULATION
September 4, 2015 Quality Outcomes and Financial Benefits of Nutrition Intervention 26
1. Keele AM, et al. Gut 1997, vol 40, pages 393-399. 2. Rana SK, et al. Clinical Nutrition 1992, vol 11, pages 337-344. 3. Jensen M and Hessov I. Nutrition. 1997;13:422-430. 4. Stratton RJ, et al. Ageing Research Rev. 2005; 4:422-450. 5. Stratton R and Elia M. Eur J Gastrenterol Hepatol 2007; 19:353-358. 6. Norman K, et al. Clin Nutr. 2008;27;48-56. 7. Cawood AL, Elia M, Stratton EJ. Ageing Research Reviews. 2012;11:278-296. 8. Gariballa S, et al. Am J Med. 2006;119:693-9. 9. Vivanti AP, et al. J Nutr Health Aging. 2011; 15:388-397. 10. Neelemaat F et al. J Am Geriatr Soc. 2012;60:691-699.
Post-Surgical
GI Cancer Respiratory (COPD+ and Pneumonia)
Elderly Renal
Failure
Keele 19971 X
Rana 19922 X
Jensen 19973 X
Stratton 20054 X X
Stratton 20075 X X X
Norman 20086 X
Cawood 20127 X X X
Gariballa 20068 X
Vivanti 20119 X
Neelemaat 201210 X

September 4, 2015 27 Quality Outcomes and Financial Benefits of Nutrition Intervention
Nutrition Intervention:
Readmissions

EVIDENCE THAT NUTRITION INTERVENTION DECREASES READMISSION
Hospital patients who received dietary counseling + oral nutrition supplements (ONS) experienced significantly fewer readmissions (p=0.041)1
September 4, 2015 Quality Outcomes and Financial Benefits of Nutrition Intervention 28
1 Norman K, et al. Clin Nutr. 2008;27:48-56. 2 Brugler L. Jt Comm J Qual Improv. 1999;25:191-206. 3 Gariballa S, et al. Am J Med. 2006;119:693-9.
30-day readmission rates decreased from 16.5–7.1% after institution of a comprehensive nutrition pathway from inpatient to post-discharge2
Patients who received ONS (up to 995 kcal/ day in addition to food) for 6 weeks had fewer readmissions: 29% who consumed ONS vs. 40% who ate food only3
Counseling only
Before
Food only
48%
16.5%
40%
ONS
After
ONS
26%
7.1%
29%

EVIDENCE THAT NUTRITION INTERVENTION DECREASES READMISSION
September 4, 2015 Quality Outcomes and Financial Benefits of Nutrition Intervention 29
1 Gariballa S, et al Am J Med. 2006;119:693-9 . *Adjusted hazard ratio 0.68 (95% confidence interval 0.49-0.94)
Results
• Over 6 months, 29% of patients in the supplements group were readmitted to the hospital compared with 40% of patients in the placebo group.*
• LOS was 9.4 days in the supplements group compared with 10.1 days in the placebo group.
Patients who received ONS (up to 995 kcal/ day in addition to food) for 6 weeks had fewer readmissions: 29% who consumed ONS vs. 40% who ate food only
Food only
ONS 29%
40%
Objective
• Study examined whether nutritional support of older patients during acute illness leads to a clinical benefit.1
Patients and intervention
• Randomized, double-blind, placebo-controlled 445 hospitalized patients aged 65 to 92 years.
• Normal hospital diet plus ONS (223 subjects) or a normal hospital diet plus a placebo (222 subjects) daily.
• ONS provide 995 kcal.
• Outcome measure: 6 months of disability, non-elective readmission and length of hospital stay, discharge destination, morbidity, and mortality.

EVIDENCE THAT NUTRITION INTERVENTION DECREASES READMISSION
Objective
• St. Francis Hospital examined initiating a nutrition care plan for acutely ill patients.
Patients and intervention
• Pilot study showed that nutrition intervention was not being provided in a uniform and timely manner.
• Free-standing hospital committee, the Nutrition Care Committee (NCC), began developing a malnutrition pathway that would serve as an integrated plan for providing nutrition care to high-risk patients.
September 4, 2015 Quality Outcomes and Financial Benefits of Nutrition Intervention 30
1 Brugler L. Jt Comm J Qual Improv. 1999;25:191-206.
Results
• Significant improvement in the identification of high-risk patients (from 25.9% to 86%).
• Significant improvement in timeliness of nutrition (from 6.9 days to 2.4 days).
• Comparison before vs. after in a similar patient population indicated reductions in:
– average LOS from 10.8 to 8.1 days.
– incidence of major complications from 75.3% to 17.5%.
– 30-day readmission rates from 16.5% to 7.1%1.
30-day readmission rates decreased from 16.5–7.1% after institution of a comprehensive nutrition pathway from inpatient to post-discharge
Before
After 7.1%
16.5%

September 4, 2015 31 Quality Outcomes and Financial Benefits of Nutrition Intervention
Health Economic Studies on the Impact of Oral Nutrition Supplements Among Hospital Patients

HEOR – WHAT IS IT?
Health Economics:
• Analysis of the economic aspects of health and healthcare
• Focuses on the costs (inputs) and the consequences (outcomes) of healthcare interventions
• Applies economic theories to medical practices
Outcomes Research:
• Aims to understand the end results of heath care practices or interventions.
• Evaluates the effect of healthcare interventions on patient-reported clinical, humanistic and economic outcomes.
September 4, 2015 Quality Outcomes and Financial Benefits of Nutrition Intervention 32

IMPACT OF ORAL NUTRITIONAL SUPPLEMENTATION PROVIDED DURING HOSPITALIZATION WAS STUDIED IN A RETROSPECTIVE HEALTH ECONOMIC ANALYSIS1
September 4, 2015 Quality Outcomes and Financial Benefits of Nutrition Intervention 33
1 In a retrespecitive health economic study, Philipson T et al. Am J Manag Care. 2013;19(2):121-128.
The Sample
11-year database from 2000-2010
44 million adults ages 18+ after inpatient
episodes
ONS Use Within Sample
Rate of ONS use: 1.6%
Within the 11-year database,
ONS use was used in 724,027 of 43,968,567 adult
inpatient episodes

ORAL NUTRITION SUPPLEMENTATION PROVIDED DURING HOSPITALIZATION WAS ASSOCIATED WITH:1
September 4, 2015 Quality Outcomes and Financial Benefits of Nutrition Intervention 34
† Monetary figures are based on 2010 US dollars and inflation adjusted.
*Readmission defined as return to study hospital for any diagnosis. Data measured delayed readmission and does not include patients not readmitted due to recovery or death.
1 In a retrospective health economic study, Philipson T et al. Am J Manag Care. 2013;19(2):121-128.
21% decrease in length of stay
(2.2 days)
21.6% decrease†
in episode costs ($4734)
6.7% decrease* in probability of
30-day readmissions

IMPACT OF ORAL NUTRITIONAL SUPPLEMENTATION PROVIDED DURING HOSPITALIZATION WAS STUDIED IN MEDICARE AGE 65+ POPULATION1
September 4, 2015 Quality Outcomes and Financial Benefits of Nutrition Intervention 35
1In a retrospective health economic study, Lakdawalla D et al. , Forum for Health Economics and Policy, 2014 DOI 10.1515/fhep-2014-0011
14.2 million age 65+
Medicare inpatient
episodes from
44 million total
database
667,684 1:1 matched samples
Medicare 65+ Within Sample
11-year Database
from 2000-2010
Sample
Within the 11-year database, matched samples of ONS vs.
non-ONS were compared

ONS IMPROVED THE FOLLOWING OUTCOMES IN MEDICARE PATIENTS AGES 65 AND OLDER:1
September 4, 2015 Quality Outcomes and Financial Benefits of Nutrition Intervention 36
1 In a retrospective health economic study, Lakdawalla D et al. , Forum for Health Economics and Policy ,2014 DOI 10.1515/fhep-2014-0011.
1.7 day (16%) decrease in
hospital length of stay 1
$3079 (15.8%)
decrease in episode cost 1
8.4% decrease in probability of 30-day readmission1

ONS DECREASED THE PROBABILITY OF 30-DAY READMISSIONS IN SPECIFIC 65+ MEDICARE POPULATIONS1,2
September 4, 2015 Quality Outcomes and Financial Benefits of Nutrition Intervention 37
Change in 30-Day Readmission Probability with ONS
COPD1
Acute Myocardial Infarction (AMI)2
All Diagnoses (Ages 65+)2
Congestive Heart Failure (CHF)2
Pneumonia (PNA)2
-13.1%* -12.0%*
-10.1%*
-5.2%
-8.4%*
* Indicates significance at the 1% level
1. In a retrospective health economic study, Thornton Snider J et al. , Chest. 2014 Oct 30. doi: 10.1378/chest.14-1368.
2. In a retrospective health economic study, Lakdawalla D et al. Forum for Health Economics and Policy ,2014 DOI 10.1515/fhep-2014-0011.

September 4, 2015 38 Quality Outcomes and Financial Benefits of Nutrition Intervention
Implementation Process

CURRENT US NUTRITION CARE LANDSCAPE1
September 4, 2015 Quality Outcomes and Financial Benefits of Nutrition Intervention 39
1. Patel V et al. Nutr Clin Pract 2014; 29(4):483-490
Nutrition screen completed within 24 hours of admission
Use of a validated screening tool
Nutrition screen findings documented in medical record
Nutrition screen resulted in a clinician’s intervention >75% of the time
90%
38%
73%
34%

USE THESE SIX PRINCIPLES TO EFFECTIVELY ADDRESS MALNUTRITION AND IMPROVE PATIENT OUTCOMES IN THE HOSPITAL
September 4, 2015 Quality Outcomes and Financial Benefits of Nutrition Intervention 40
1. Tappenden KA, et al. JPEN J Parenter Enteral Nutr. 2013 Jun 4. [Epub ahead of print]. EHR=electronic health record NCP = nutrition care plan

YOU CAN USE THE MALNUTRITION SCREENING TOOL (MST) TO SCREEN YOUR PATIENTS’ NUTRITIONAL STATUS1
September 4, 2015 Quality Outcomes and Financial Benefits of Nutrition Intervention 41
1 Ferguson, M et al. Nutrition 1999 15:458-464
The set of questions helps you quantify your patients’ malnutrition
risk level and guides you on what action to take. No 0
Unsure 2
If yes, how much
weight have you lost?
2-13 lb 1
14-23 lb 2
24-33 lb 3
34 lb or more 4
Unsure 2
Weight
loss score:
Have you recently
lost weight without
trying?
Yes
Appetite
score:
Have you been eating
poorly because of a
decreased appetite?
No 0
1
STEP 1: Screen with the MST
MST SCORE:
Add weight loss and appetite scores


Quality Improvement is a formal approach to the analysis of performance and systematic efforts to improve it.
http://www.hrsa.gov/quality/toolbox/methodology/developingandimplementingaqiplan/index.html
WHAT IS QUALITY IMPROVEMENT?
43

INSTITUTE FOR HEALTHCARE IMPROVEMENT (IHI) TRIPLE AIM1
The IHI Triple Aim is a framework developed by the Institute for Healthcare Improvement that describes an approach to optimizing health system performance.
It is IHI’s belief that new designs must be developed to simultaneously pursue three dimensions, which are called the “Triple Aim”:
• Improving the patient experience of care (including quality and satisfaction)
• Improving the health of populations
• Reducing the per capita cost of health care
September 4, 2015 Quality Outcomes and Financial Benefits of Nutrition Intervention 44
1. Stiefel M, Nolan K. A Guide to Measuring the Triple Aim: Population Health, Experience of Care, and Per Capita Cost. IHI Innovation Series white paper. Cambridge, Massachusetts: Institute for Healthcare Improvement; 2012. (Available on www.IHI.org)

IMPACT OF A MULTIDISCIPLINARY NUTRITION PROGRAM ON LENGTH OF STAY, HOSPITAL COSTS, AND READMISSION1
September 4, 2015 Quality Outcomes and Financial Benefits of Nutrition Intervention 45
Akron General Medical Center
• Level 1 Trauma Center
• Teaching Hospital
• Over 100 years of service
• Magnet designation
• NICHE designation
1. Goates S, et al., JPEN, February 2015; vol. 39: online supplement S-74, 79. URL: http://pen.sagepub.com/content/39/2/231/suppl/DC2

57% REDUCTION IN TIME TO INTERVENTION1
September 4, 2015 Quality Outcomes and Financial Benefits of Nutrition Intervention 46
Day 1 Day 1-2 Day 2-3
Nursing admission
screen, referral to RD
RD sees patient,
writes order or verbal
order
Patient receives
supplement (2.3 days)
Nursing admission
screen, referral to RD
Patient receives
supplement (<24 hrs)
RD sees patient,
validates order
2011
2013
Day 1 Day 1 Day 1-2
1. Goates S, et al., JPEN, February 2015; vol. 39: online supplement S-74, 79. URL: http://pen.sagepub.com/content/39/2/231/suppl/DC2

LENGTH OF STAY REDUCED BY 0.77 DAYS1
September 4, 2015 Quality Outcomes and Financial Benefits of Nutrition Intervention 47
Proportion of patients receiving ONS rose from 6.1% in 2011 to
8.1% in 2013, a 34% increase (p=<0.01).
P=<0.01
0%
-0.1%
-0.2%
-0.3%
-0.4%
-0.5%
-0.6%
-0.7%
-0.8%
-0.9%
-0.77
-0.39
Reduction in LOS for Diagnoses Commonly Treated with ONS and other Diagnoses
Dx Commonly Treated with ONS
Other Dx
1. Goates S, et al., JPEN, February 2015; vol. 39: online supplement S-74, 79. URL: http://pen.sagepub.com/content/39/2/231/suppl/DC2

18% REDUCTION IN THE PROBABILITY OF 30-DAY READMISSION1
September 4, 2015 Quality Outcomes and Financial Benefits of Nutrition Intervention 48
Proportion of patients receiving ONS rose from 6.1% in 2011 to
8.1% in 2013, a 34% increase (p=<0.01).
P=<0.059
0%
-2%
-4%
-6%
-8%
-10%
-12%
-14%
-16%
-18% -18.1%
-3.8%
Dx Commonly Treated with ONS
Other Dx -20%
Change in Probability of 30-Day Readmission
1. Goates S, et al., JPEN, February 2015; vol. 39: online supplement S-74, 79. URL: http://pen.sagepub.com/content/39/2/231/suppl/DC2

September 4, 2015 49 Quality Outcomes and Financial Benefits of Nutrition Intervention
Educate patients on their nutrition care plan to continue their recovery at home and help avoid readmissions

POST ACUTE SERVICES ARE BECOMING INCREASINGLY MORE IMPORTANT IN DRIVING IMPROVED PATIENT OUTCOMES FOR HOSPITALS1
• Hospitals need to pay much more attention to the transition of patient care into post acute / community
• Transition of care has not historically been your responsibility
– Increased attention on follow-up care
– Greater opportunity for active involvement of home health care
September 4, 2015 Quality Outcomes and Financial Benefits of Nutrition Intervention 50
1 Denniston L. New Final HHS Rules on Readmissions. http://connect.curaspan.com/articles/new-final-hhs-rules-readmissions. Accessed October 18, 2011. http://www.gpo.gov/fdsys/pkg/FR-2011-08-18/html/2011-19719.htm

Sleep Deprivation
Pain and Discomfort
Decline in Mental Functioning
Poor Nutrition
Krumholz HM. N Engl J Med 2013; 368: 100-102.
Associated causes:
Malnutrition during hospitalization may cause poor outcomes, yet often receive little attention
Post-Hospital Syndrome
51

NUTRITIONAL STATUS BECOMES PROGRESSIVELY COMPROMISED THROUGH THE CONTINUUM OF CARE
September 4, 2015 Quality Outcomes and Financial Benefits of Nutrition Intervention 52
1. Schiesser M, et al. Surgery. 2009;145(5):519-526 2. Naber THJ, et al. Am J Clin Nutr. 1997;66:1232-1239
3. Braunschweig C, et al. JADA. 2000;100:136-1322 4. Beattie AH, et al. Gut. 2000;46(6):813-818.
30% to 50% of patients are
malnourished upon admission1,2
Many patients continue to lose
weight4
38% of patients with normal nutrition
status experience a decline during
hospitalization3
Upon Admission to the Hospital
During Hospital Stay
Post-discharge

3 STEPS FOR ADDRESSING MALNUTRITION
September 4, 2015 Quality Outcomes and Financial Benefits of Nutrition Intervention 53
Screen and recognize all patients at risk of malnutrition
Include nutrition in every discharge plan with education on why nutrition is important to recovery
Rapidly implement nutrition interventions and continue monitoring your patients

QUESTIONS? THANK YOU!!
54
