qualitative text analysisabicqu.webfactional.com/test/wp-content/uploads/2014… · ·...
TRANSCRIPT

Qualitative Text Analysis
Course Convenor: Aude Bicquelet
Office Hours: Thursday 11:30-13:30
LSE Department of Methodology
MY 428/528 – LT 2014

CLASSICAL CONTENT ANALYSIS (II)
Forming and testing hypotheses about texts
Week 5

1. Variables and Predictions
------------------------------------------------------------------
2. Coding
------------------------------------------------------------------
3. Application of Classical Content Analysis
------------------------------------------------------------------
Cunningham’s study of Media Bias
Hirschman’s study of People as Products
Lecture Outline

VARIABLES AND
PREDICTIONS

A variable is a definable and measurable concept that varies; that holds different values for different individual cases or units.
We refer to each ‘presumed cause’ as an independent or explanatory variable.
We refer to each ‘presumed effect’ as a dependent or response variable.
Example We may predict that gender is related to the type of argument expressed about abortion in parliament (females will talk about the health of the mother more often than males). Each unit will hold a certain value on the independent variable (male or female) and a certain value on the dependent variable (i.e.; Health; Moral Concerns…).
Variables and Predictions

Gender is here the independent variable (x)
The type of argument expressed the dependent variable (y)
Speech acts are the units of analysis (or cases).
Variables and Predictions

Research Questions & Hypotheses
In CA, variables should be linked in a form of research question or hypotheses.
Example 1: ‘Girls’ advertisements will use more in-home settings; boys
advertisements will use more out-of-home settings’.
directional hypothesis.
Example 2: ‘Commercials run in the Dominican Republic differ from those run in
the US in the frequency with which music is used’.
nondirectional hypothesis.
Variables and Predictions
Research Questions & Hypotheses
When there is no theory to drive the research or past studies that have examined the
content of interest, research question may guide the process.
Example 1: ‘What issues do women’s and news magazines address concerning
breast cancer?’
Example 2: ‘How widespread is the use of billboards by small business?’
Variables and Predictions

Conceptual Definitions and Operationalization
In the process of writing hypotheses, predictions and research questions, each
variable must be carefully defined.
This dictionary-type definition is called the conceptual definition of the variable.
Each conceptual definition is a guide to the subsequent measurement of that
variable.
Variables and Predictions

Conceptual Definitions and Operationalization
Examples
Conceptual definitions appearing in the content analysis literature include:
Rumination: The tendency to think nonproductively about negative affects,
situations, and attributions (Satterfield, 1998: 670)
Climate: Employee perceptions of one or more strategic imperatives made
manifest through work place routines and rewards (Schneider et al., 1992: 705)
Variables and Predictions

Each variable should be measured with categories that are at the highest level of measurement possible.
The least sophisticated or lowest level of measurement is called nominal.
A nominal scale consists of a set of categories that are distinct from one another. The order of the categories is arbitrary.
Example:
Gender: Report the gender of the character 1. Male
2. Female
3. Unable to determine
Variables and Predictions – levels of measurement

An ordinal variable consists of a set of values that are ordered.
The use of numbers is for maintaining the proper ordering, but the numbers do not
signify equal intervals between the groups.
Example
Social Age: Estimate the stage at which the character operates in his or her interactions
with others:
1. Child: The individual behaves and speaks as one who is 12 years of age or younger.
2. Adolescent: The individual behaves and speaks as one who is 13 to 19 years of age.
3. Young Adult: The individual behaves and speaks as one who is 20 to 39 years of age.
4. Mature Adult: The individual behaves and speaks as one who is 40 to 64 years of age.
5. Elderly: The individual behaves and speaks as one who is 65 years of age or older.
6. Unable to determine.
Variables and Predictions – levels of measurement
An interval scale consists of categories or values represented by numbers that are
quantitative or numeric in the ordinary sense.
Example:
The classic example is the temperature scale of degree Celsius.
- It is meaningful to say that 20ºC is a higher temperature than 10ºC, and that this
difference is of the same size as that between 30ºC- 40ºC. However, because of the
lack of a true zero point of the Celsius scale, differences in temperature cannot be
expressed as a ratio: 40ºC is not twice as warm as 20ºC.
Variables and Predictions – levels of measurement

The most sophisticated or highest level of measurement is called ratio.
A ratio scale consists of categories or levels represented by numbers that are
quantitative or numeric in the ordinary sense, including a true or meaningful zero
point.
Example
Chronological Age: Report or estimate the character’s chronological age in years (if
less than 1 year, code as 0).
Here there is a true zero (a new born baby) and we can calculate an average in years.
Variables and Predictions – levels of measurement

CODING

All measures for human content analysis need to be fully explicated in the
codebook.
The codebook must provide appropriate spaces for recording the codes for all
variables being measured.
The coding form is a summarized version of the codebook where codes are
reported
The goal in creating codebooks and coding forms is to make the set so
unambiguous as to almost eliminate the individual differences amongst coders.
Coding

Example: Character Demographics Analysis
Units of Data Collection: Each individual personality or character who (a) speaks, or (b) performs important actions in the story Episode ID: Fill in the episode ID number, as indicated on the episode ID list Coder ID: Indicate the number of the individual who coded that sheet according to the coder ID list. Character Name Character ID Role: Indicate whether the character plays a minor, medium or major part of the episode
1. Minor: If in an episode a character has 10 or fewer lines 2. Medium: If a character speaks more than 10 lines in an episode 3. Major: If in an episode a character is featured in 50% or more of an episode content 4. Unable to determine
Coding

Character name
Character ID
Role
Social Age
Chronological Age
Determination for
Chronological Age
Social Status
Gender
Sexual Preferences
Marital Status
Religious
Affiliation
Determination for
Religious
Affiliation
Character name Jo Max Amy Jen
Character ID 002 003 011 012
Role 3 2 1 3
Social Age 3 3 2 1
Chronological Age 21 27 16 12
Determination for
Chronological Age
2 2 2 1
Social Status 1 2 3 1
Gender 1 1 2 2
Sexual Preferences 1 2 1 9
Marital Status 31 20 77 99
Religious Affiliation 3 2 2 4
Determination for
Religious Affiliation
2 2 1 2
Sample Coding Form
Episode ID_________ Coder ID_________ Episode ID: 434 Coder ID: 0006
Coding
The construction of an original codebook is a rather long process with
repeated revisions.
The process of coder training is linked with the process of codebook
development.
Note that that blind coding – in which coders do not know the purpose of the
study – is desirable to reduce bias that compromise validity.
This is to avoid demand characteristic.
Coding

APPLICATIONS OF
CLASSICAL CONTENT
ANALYSIS

1. Formulate a research question or a hypothesis, based on existing theory or on
prior research.
2. Select a set of texts to test the research question or hypothesis.
3. Create a set of codes in the research question or hypothesis.
4. Pre-test the variables on a few of the selected text. Fix any problems that may
turn up with regard to the codes, so that coders become consistent in their coding.
5. Create a case-by-variable matrix from the texts and codes.
6. Analyse the matrix using whatever level of analysis is appropriate.
Steps developed by Russell and Ryan (2010)

Cunningham's study
of Media Bias

(1) Formulate a research question or a hypothesis based on existing theory or on prior
research.
In 1994, Shifflett and Revelle found that from 1988 to 1991 the National Collegiate
Athletic Association journal (NCAA) was biased against women’s athletics.
In 2004, Cunningham et al. set out to test whether things had changed in NCAA news.
They had no hypothesis, but 2 solid research questions:
- (1) Did the NCAA News provide equitable coverage for men’s and women’s
athletics in 1999-2001?
- (2) Did the coverage of men’s and women’s athletics in the NCAA improved since
Shifflett and Revelle’s study?
Cunningham’s et. al study of Media Bias (2004)

(2) Select a set of texts to test the questions or hypotheses.
Cunningham et al. randomly selected one of the two issues of the NCAA news published each month during 1999 and 2001.
The sampling universe (population) was 48 issues, of which 24 issues were selected.
Next, Cunningham et al. went through the 24 issues. They selected and coded all the articles about athletes, coaches and teams.
Paragraphs (5, 745) and photographs (1,086) were the units of analysis as in S&R’s previous analysis.
Cunningham’s et. al study of Media Bias (2004)

(3) Create a set of codes in the research question or hypothesis.
Cunningham et al. coded the article for:
A) gender = 1. women; 2. men; 3. both sexes; 4. neither sex.
B) Location = 1. front page; 2 second to seventh page; 3 last page.
C) Length of the article = in square inches.
D) Content = 1. factual information related to athletics;
2. factual information not related to athletics;
3. personal information related to athletics;
4. personal information not related to athletics.
Cunningham’s et. al study of Media Bias (2004)

(4) Pretest the variables on a few of the selected texts. Fix any problems that turn
up with regard to the codes and the coding.
Cunnigham et al. did pre-tests on three of the NCAA News that were not part of
the main sample. They found nearly perfect agreement on coding the content of
the text.
(5) Apply the codes to the rest of the texts. Keep cheeking for inter-coder
reliability
They used latent coding in marking paragraphs.
Cunningham’s et. al study of Media Bias (2004)

(6) Create a case-by-variable matrix from the text and Codes
Paragraph
Year
Gender
Location
Length
Content
1
2
3
4
5
x
Cunningham’s et. al study of Media Bias (2004)

(6) Create a case-by-variable matrix from the text and Codes (Bis)
Paragraph
Year
Gender
Location
Length
Content
1
1999
1
3
20
4
2
1999
2
3
50
3
3
2000
3
2
10
4
4
2000
4
1
60
2
5
2001
2
1
10
1
x
-
-
-
-
-
Cunningham’s et. al study of Media Bias (2004)

(7) Analyse the matrix using whatever level of analysis is appropriate
Did the NCAA News provide equitable coverage for men’s and women’s athletics from 1999-2001?
• Women comprised 42% of all college athletes in those years and received 42.4% of the coverage in NCAA News.
• The average in length in paragraphs was identical for men and women.
• Paragraphs about women were likely to contain information about athletic as were paragraphs about men.
• On these measures, women received coverage equal to men.
Cunningham’s et. al study of Media Bias (2004)

Hirschman’s study of people
as product

(1) Formulate a research question or a hypothesis based on existing theory or
on prior research
Researchers of human mate selection have shown that:
Men tend to prefer women of greater physical beauty.
Women tend to prefer men of higher and economic status.
Hirschman’s study of People as Products

Expected Pattern of Resource Exchange in Ads:
Women are expected to offer and Men to seek
Men are expected to offer and Women to seek
Physical attractiveness Love Entertainment Information (age, marital status, residence) Ethnicity Personality
Money Educational status Intellectual status Occupational status
Hirschman’s study of People as Products

(2) Select a set of texts to test the questions or hypotheses.
Hirschman randomly sampled 100 female-placed ads and 100 male-placed ads in
New York Magazine and the Washingtonian from May 1983 to April 1984.
(3) Create a set of codes in the research question or hypothesis.
In this case, the variables, or themes are the 10 resources that Hirschman posited
would be in the ads (previous slide).
Hirschman’s study of People as Products

(4) Pre-test the variables on a few of the selected texts. Fix any problems that
turn up with regard to the codes and the coding.
Coders involved in the project provided support for the variables that had
been developed by Hirschman and were able to categorize 100 test items.
(5) Apply the codes to the rest of the texts. Keep cheeking for inter-coder
reliability.
Hirschman gave a male and female coder the entire set of 405 ads.
The two coders worked apart and did not know the hypotheses that
Hirschman was testing.
Hirschman’s study of People as Products

(6) Create a case-by-variable matrix from the text and Codes
Ad. Mag. Gender Physical
features
offered
Physical
Features
sought
Money
offered
Money
sought
Educ.
Status
offered
Educ.
Status
sought
Occup.
Status
offered
Occup.
Status
sought
Etc.
1
2
3
4
X
405
Hirschman’s study of People as Products

(6) Create a case-by-variable matrix from the text and Codes (Bis)
Ad. Mag. Gender Physical
features
offered
Physical
Features
sought
Money
offered
Money
sought
Educ.
Status
offered
Educ.
Status
sought
Occup.
Status
offered
Occup.
Status
sought
Etc.
1
0 2 1 0 1 0 1 0 1 0 -
2
0 2 0 0 1 1 0 0 1 1 -
3
1 1 1 1 1 0 0 1 1 1 -
4
1 2 0 0 0 0 1 1 1 1 -
X
- - - - - - - - - - -
405
1 1 1 0 0 1 0 1 0 1 -
Hirschman’s study of People as Products
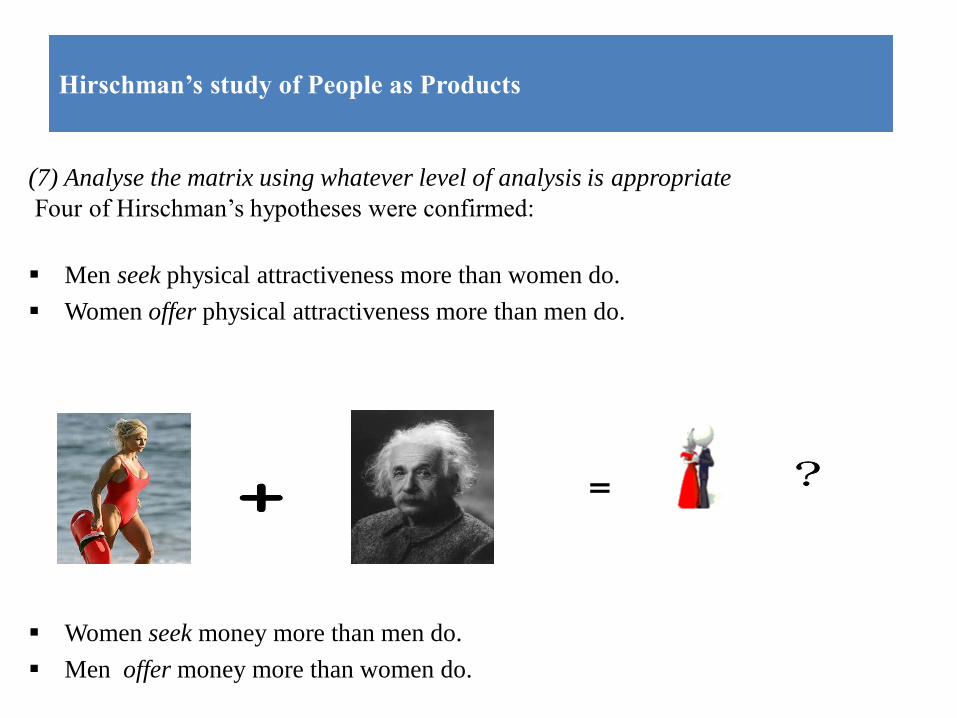
(7) Analyse the matrix using whatever level of analysis is appropriate
Four of Hirschman’s hypotheses were confirmed:
Men seek physical attractiveness more than women do.
Women offer physical attractiveness more than men do.
Women seek money more than men do.
Men offer money more than women do.
Hirschman’s study of People as Products

Useful Resources
Franzosi R P (2004) ‘Content analysis,’ in: Hardy, M. and Bryman, A. (eds) Handbook of Data Analysis, Thousand Oaks: Sage, pp 547-565.
Krippendorff, K. (2004). Content Analysis: An Introduction to Its Methodology. Sage, Thousand Oaks, CA, 2nd edition (Chapter 1 and 2) Laver, M. and Garry, J. (2000). Estimating policy positions from political texts. American Journal of Political Science, 44(3):619–634.
Neuendorf, K. A. (2002). The Content Analysis Guidebook. Sage, Thousand Oaks, CA. Sage, Thousand Oaks, CA (Chapter 1 and 2) Newman, M.L., Groom, C.J., Handelman, L.D., & Pennebaker, J.W. 2008. “Gender differences in language use: An analysis of 14,000 text samples.” Discourse Processes 45:211–236.
Roberts, C. W. (2000). A conceptual framework for quantitative text analysis. Quality and Quantity, 34(3):259–274.
Slapin, J. and Proksch, S.-O. (2008). A scaling model for estimating time series policy positions from texts. American Journal of Political Science, 52(8).
Sven-Oliver Proksch and Jonathan B. Slapin. 2010. “Position Taking in European Parliament Speeches”, British Journal of Political Science 40, 587-611.
Tausczik, Yla R. and James W. Pennebaker. 2010. “The Psychological Meaning of Words: LIWC and Computerized Text Analysis Methods.” Journal of Language and Social Psychology 29(1) 24–54.