quaderni di storia economica - banca d'italia · the purpose of the economic history working...
TRANSCRIPT

Quaderni di Storia Economica(Economic History Working Papers)
numbe
r 28Dec
emb
er 2
012
A Tale of Two Fascisms: Labour Productivity Growth and Competition Policy in Italy, 1911-1951
Claire Giordano and Ferdinando Giugliano

Quaderni di Storia Economica(Economic History Working Papers)
A Tale of Two Fascisms: Labour Productivity Growth and Competition Policy in Italy, 1911-1951
Claire Giordano and Ferdinando Giugliano
Number 28 – December 2012

The purpose of the Economic History Working Papers (Quaderni di Storia economica) is to promote the circulation of preliminary versions of working papers on growth, finance, money, institutions prepared within the Bank of Italy or presented at Bank seminars by external speakers with the aim of stimulating comments and suggestions. The present series substitutes the Historical Research papers - Quaderni dell'Ufficio Ricerche Storiche. The views expressed in the articles are those of the authors and do not involve the responsibility of the Bank.
Editorial Board: MARCO MAGNANI, FILIPPO CESARANO, ALFREDO GIGLIOBIANCO, SERGIO
CARDARELLI, ALBERTO BAFFIGI, FEDERICO BARBIELLINI AMIDEI, GIANNI TONIOLO. Editorial Assistant: ANTONELLA MARIA PULIMANTI.
ISSN 2281-6089 (print) ISSN 2281-6097 (online)

A Tale of Two Fascisms Labour Productivity Growth and Competition Policy
in Italy, 1911-1951
Claire Giordano and Ferdinando Giugliano
Abstract This paper offers the first quantitative assessment of labour productivity dynamics within Italy's industrial sector over the period 1911-1951 and of their links with competition policy. By relying on a newly compiled dataset and on fresh labour productivity estimates, we find that the earlier period of the Fascist era was characterised by a productivity boom, which ended and was reversed following the switch to a more interventionist industrial policy. In the overall period 1911-1951, new industries did not perform any better than the old ones and labour productivity growth was explained largely by internal productivity growth within industrial sectors rather than from the contribution of structural change from old to new industries. Finally, we find that reductions in the level of competition, induced by specific policies, were associated with lower productivity growth. This paper thus casts a shadow on the optimist accounts of Fascist industrial policy and confirms the findings of a revisionist literature minimising the positive role played by the State in the earlier stages of Italian industrialization. JEL Classifications: L16, L52, N14 Keywords: labour productivity, competition, Great Depression.
Contents
1. Introduction……………………………………………………………………………………………… 5 2. Shifts in Italian industrial policy………………………………………………………………………… 8 2.1 Pre-Fascism industrial and competition policy……………………………………………………… 9 2.1.1 A three-pronged approach to industrial policy, 1861-1913…………………………………… 9 2.1.2 The impact of World War One ………………………………………………………………. 11 2.2 Industrial and competition policy in the age of Fascism……………………………………………. 12 2.2.1 A “liberal” Fascist phase……………………………………………………………………… 12 2.2.2 Quota 90……………………………………………………………………………………… 14 2.2.3 Competition policy…………………………………………………………………………… 16 2.2.4 The creation of IRI and foreign exchange policy…………………………………………….. 19 2.3 Measuring the effects of shifts in competition policy………………………………………………. 23 2.3.1 The evidence on concentration………………………………………………………………... 24 2.3.2 Prices and Cowling indices………………………………………………………………….… 27 3. Labour productivity growth dynamics and structural change…………………………………………… 31 3.1 Output per worker: the data……………………………………………………………………..…… 32 3.2 Output per worker: results…………………………………………………………………………… 36 3.3 Accounting for changes in hours worked………………………………………………………….… 41 4. Labour productivity growth and competition policy………………………………………………..…… 47 4.1 The existing evidence…………………………………………………………………………….…… 47 4.2 New econometric evidence for Italy……………………………………………………………..……. 53 5. Conclusions………………………………………………………………………………………….…… 59 A Data Appendix…………………………………………………………………………………….……… 61 B. Robustness check: labour productivity growth based on industrial census data………………………… 67 B.1 The data……………………………………………………………………………………………... 67 B.2 The results…………………………………………………………………………………………… 68 References…………………………………………………………………….…………………………..… 73 Economic and Financial History Division, Banca d'Italia. E-mail: [email protected] Department of Economics and Pembroke College, University of Oxford. E-mail: [email protected].
Quaderni di Storia Economica – n. 28 – Banca d’Italia – December 2012


1 Introduction1
The evolution of labour productivity in Italian industry over the interwar era has beenmainly looked at from an aggregate point of view. Filosa, Rey and Sitzia (1976) haveshown that it was generally slow throughout the 1922-1938 period. More recently,Broadberry, Giordano and Zollino (2011), in their century-and-a-half analysis ofItaly’s development, find similar results, with not only growth rates falling but alsocomparative labour productivity levels relative to the United Kingdom deterioratingafter 1911. And since the United States were ploughing ahead in those years, itis clear that Italy was dropping even further behind from the new technologicalfrontier. Only after World War Two did Italy decidedly embark on a catching-uptrajectory.
An aggregate analysis is, however, far from satisfactory. Studies conducted over thelast twenty years on a range of countries2 have shown that the evolution of labourproductivity in the different branches of the industrial sector was generally heteroge-neous. Even when grouping branches together, “new” industries often experiencedrates of productivity growth which were very different from those registered by the‘old staples.”3 Disaggregated analysis, important per se, also enables researchers touse shift-share analysis to distinguish whether industrial productivity growth wasdue to internal productivity growth or to structural change, i.e. shifts of resourcesfrom low-productivity level industrial sectors to high-level ones. Lastly, disaggre-gated data can allow researchers to exploit the cross-sectional variation betweenindustries to better study which factors truly drove productivity growth and, in par-ticular, whether a given type of industrial policy had a positive or a negative effecton productivity growth.
All the mentioned lines of research are particularly appealing in the Italian case. Theasymmetric performance of old and new industries, the role of structural change andthe impact of active industrial policies in the interwar period have all been referredto in the literature. The division between new and old industries is particularlyimportant, so much that Tattara and Toniolo (1976) have openly talked about a “dualeconomy:” using information from the industrial censuses taken in the second half
1We are very grateful to Brian A’Hearn, Federico Barbiellini Amidei, Emanuele Felice, KnickHarley, Anna Missiaia, Paolo Sestito, Gianni Toniolo and an anonymous referee for commentingon earlier versions of this paper. We also thank Stephen Broadberry, Carlo Ciccarelli and KevinO’Rourke for useful suggestions, as well as participants of a seminar in Oxford, and Stefano Fenoal-tea and Emanuele Felice for sharing unpublished data with us. All errors remain our own. Theopinions herein expressed are those of the Authors and do not necessarily reflect those of the Insti-tutions represented.
2For example, for Britain and the United States, see, among others, Broadberry and Crafts(1990b; 1992), Broadberry (1997) and De Jong and Woltjer (2011); for Britain and Germany, seeBroadberry and Fremdling (1990) and Fremdling, De Jong and Timmer (2007).
3For example, in the British case, see Broadberry and Crafts (1990a).
5

of the 1930s, they argued that the productivity gap between new and old industries,measured in levels, was larger in Italy than in Germany or in Britain (Tattara andToniolo 1976, p. 150). In their view, this gap was the consequence of the differentdynamics in investments, with the level of horsepower rising much faster in the newindustries than in the old ones. Although the two scholars do not analyse productivitydynamics in detail, they hint at the fact that such differences in levels may have nottranslated into large productivity growth differentials. This is because employmentdynamics largely followed those of investments, so that structural change might haveactually hampered productivity growth within new sectors by increasing employmentmore than output.
An analysis of structural change within industry cannot, however, be detached froma more general analysis of Fascist industrial policy, which tended to favour newindustries over the old staples. The decision to revalue the lira in 1926-1927 and theincrease in import duties which accompanied it favoured the more modern sectors ofthe Italian economy while penalising the export-oriented old industries, starting whathas been defined as ‘a deliberate policy of forced redistribution of resources’ (Tattaraand Toniolo 1976, p. 105). This included a general retrenchment from competition inthe product market. Although the literature has emphasized the importance of thisretrenchment, doubts remain over whether its impact on productivity growth waspositive or, in fact, negative. This question can also be answered via a disaggregatedanalysis of productivity growth.
The only study that has thus far looked at the evolution of labour productivity in theindividual sectors of Italian industry is a preliminary conference paper by Bardini(1998),4 which presented information on labour productivity of 28 sectors of Italy’smanufacturing industry for the three benchmark years 1911, 1936 and 1951.5 Bardinifound that (i) Italian heavy industries did not start off badly in 1911; (ii) structuralchange during Fascism was accompanied by some gain in relative productivity inthe heavy-industry sectors; and (iii) the light industries generally experienced onlysmall improvements in productivity. The main conclusion of his paper is that ‘Italianheavy sectors seem to have been in better waters than it is generally thought [. . . ]and the growth of their relative weight results as the major dynamic component ofItalian manufacturing in the first period of our study; if anything, one could ratherargue that the restructuring in favour of them was not pushed far enough’ (Bardini1998, p. 99).
The limitations of Bardini’s study are twofold. Firstly, Bardini treats the period be-tween 1911 and 1936 as a single time span, without accounting for its discontinuity.
4This work builds on Bardini (1996).5The nature of the paper is such that little information is provided on how the estimates are
obtained and why certain data choices were made. Furthermore Bardini himself states that hisresults are preliminary, ‘with much room for improving them’ (Bardini 1998, p. 95), a venture heunfortunately never pursued.
6

This appears unfortunate, as industrial policy changed quite dramatically towardsthe end of the 1920s and a good understanding of the period calls for an examinationof this policy break. Secondly, Bardini does not attempt to single out the drivers ofproductivity growth. The techniques he employs allow to distinguish between inter-nal productivity growth and structural change, but do not provide an examination,for example, of the potential impact of Fascist industrial policy.
Our paper aims to address these two shortcomings. Firstly, by employing the newdisaggregated yearly series of industrial value added produced by Carreras and Felice(2010), we are able to analyse the performance of the different sectors of Italianindustry between 1911 and 1951, introducing a larger set of benchmarks and payingclose attention to the regime break occurring at the end of the 1920s. By doing so,we are able to track down more precisely when productivity growth accelerated andwhen exactly structural change occurred. Secondly, by relying on a newly compileddataset, we construct an econometric model to better explain the determinants ofproductivity growth. In particular, following Broadberry and Crafts (1992), we aimto assess whether the anticompettive industrial policy pursued by the Fascist regimewas positively or negatively correlated with productivity growth, therefore helpingor hindering the development of the Italian economy.
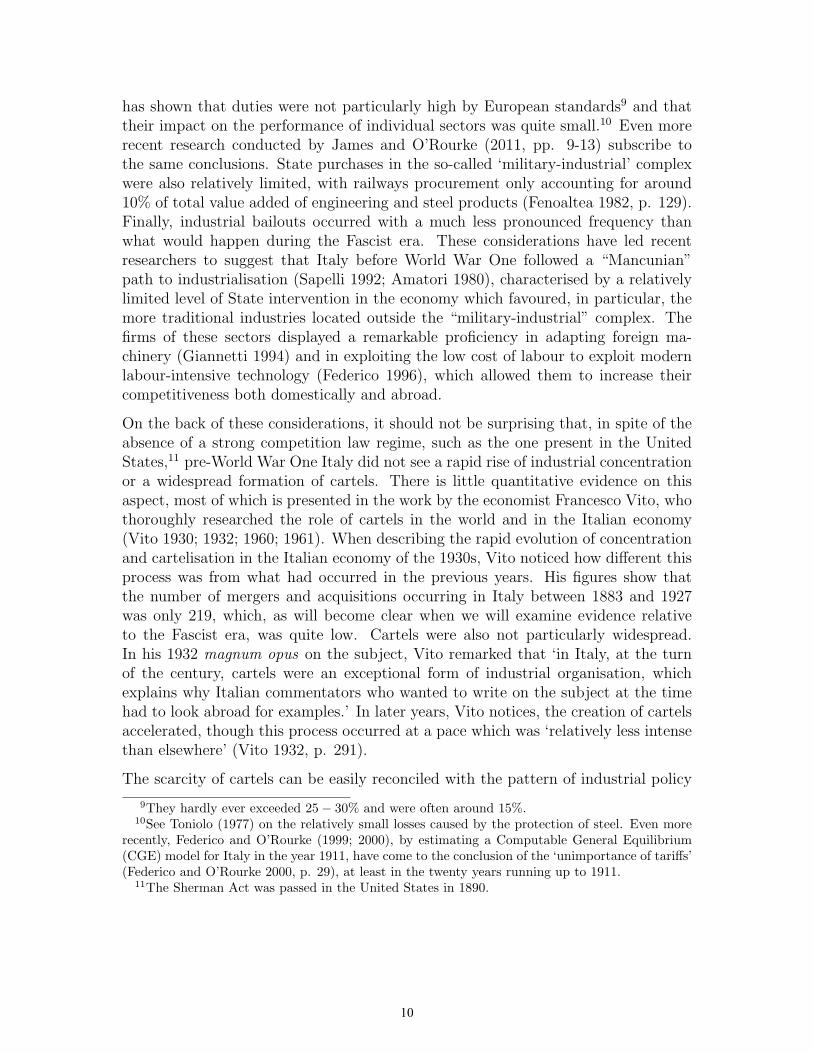
The paper is constructed as follows. Section 2 provides a short account of industrialpolicy in post-Unification Italy, with a specific focus on the Fascist era. A range ofqualitative and quantitative indicators show that competition in the product marketwas effectively reduced circa 1927 and that this reduction largely characterised thenew industries. This section justifies our choice of splitting the analysis of labourproductivity into more sub-periods than was done in previous work; it also confirmsthe importance of analysing the impact of competition policy on the evolution oflabour productivity. The first task is undertaken in Section 3, which displays ourfindings on the evolution of labour productivity growth in Italian industry between1911 and 1951, using a larger number of benchmarks than in Bardini (1998). Threesets of results emerge. Firstly, over the 1911-1951 period old industries grew at ratewhich is comparable to the one of new industries. Secondly, the 1930s were charac-terised by slower productivity growth than the 1920s. Thirdly, productivity growthwas largely driven by internal productivity growth, with structural change only play-ing a role in the 1920s, that is before the regime’s active intervention. These results,which are found to be largely robust to the inclusion of newly compiled data onchanges in the number of hours worked, would suggest that Fascist industrial policyhampered productivity growth. This claim is corroborated by evidence presented inSection 4, in which we employ standard panel data techniques to better understandthe link between Fascist competition policy and labour productivity growth. Oureconometric evidence shows that the reduction of competition went hand in handwith a slowdown in productivity. This result, which is robust to the inclusion of arange of control variables, is confirmed by a set of more qualitative evidence which
7

we also include in Section 4. Finally, the conclusions of our paper are presented inSection 5.
2 Shifts in Italian industrial policy
The existing quantitative literature on productivity in Italian industry has treatedthe Fascist era as a homogenous period. The analysis by Bardini (1998) went asfar as finding a continuity between the 1910s and the years of Fascism. Bardini’sargument is that World War One marked a strong acceleration in State interventionin the economy which was neither interrupted nor reversed by the Fascist regime. Onthe contrary, in the post-war environment the latter took measures to support thoseindustries which had developed throughout the conflict. For this reason Bardiniconcludes that ‘it does not seem too incorrect to look [. . . ] at the changes in thewhole 1911-1936 time span as the results of Fascist economic policy’ (Bardini 1998,p. 96).
Such considerations, however, clash with the periodisation conventionally used inthe historiography. As remarked by Rossi and Toniolo, ‘1914-46 and even 1922-43(the Fascist years) were far from being homogenous periods: not only were there ex-ogenous shocks of a hitherto unprecedented magnitude, but economic policies wereanything but consistent over time’ (Rossi and Toniolo 1992, p. 545). More specifi-cally, the Fascist era has traditionally been divided between a more liberal period,covering the early part of the 1920s and one characterised by a more invasive indus-trial policy, which spanned between the end of the 1920s and World War Two.
As will be argued in this Section, the significance of this rupture goes beyond themere periodization of Fascism. In fact, the promotion of the new industries occur-ring in the second era of Fascism and the tools through which this was carried outmarked a discontinuity with the approach to industrial policy which had been takenbefore World War One and which had been temporarily suspended during the Warbefore being resumed in the early 1920s. While industrial policy in these more lib-eral phases had come in the shape of trade policy, sporadic industrial bailouts andState purchases of goods, the late 1920s and 1930s saw four sets of measures beingintroduced, namely heavy intervention in the labour market, autarky, direct Statemanagement of firms and cartelisation in the product market.
This section and this paper are mainly concerned with this last set of measures.which, we argue, had a significant effect on Italian industry. We first outline theevolution of competition policy in Italian industry between the late 19th century andWorld War Two and then offer some quantitative evidence to back up our claims.In Section 2.1 we argue that industrial policy in the pre-World War One era waslargely unconcerned with competition issues and was pursued through alternative
8

avenues. In Section 2.2 we outline the changes introduced during the War andargue that they were largely reversed by the policies enacted in the first years ofFascism. This policy stance changed following the revaluation of the lira in 1926-1927, which led to the introduction of a range of measures promoting concentrationand cartelisation. In Section 2.3, we present a range of new quantitative indicators,showing that competition in the product market did decrease significantly over the1930s. This evidence justifies our decision to break up the Fascist era into twophases, in particular by separating its early laissez-faire stage from its second, moreinterventionist spell. It also suggests that a full understanding of productivity growthover the Fascist period has to take into account the role played by the regime’santicompetitive policies.
2.1 Pre-Fascism industrial and competition policy
2.1.1 A three-pronged approach to industrial policy, 1861-1913
It would be a gross mistake to assume that active industrial policy came to Italyonly with the advent of Benito Mussolini. In fact, after a relatively liberal periodin the decades immediately following the country’s political unification in 1861, the1876 elections, which brought a left-wing government to power, led to a more inter-ventionist policy stance. A detailed account of the policies pursued in those yearsand their impact is beyond the scope of this paper.6 Yet, two points should cer-tainly be made. Firstly, it is noteworthy that industrial policy in this period tooka three-pronged direction, namely trade policy, public procurement and industrialbailouts.7 Secondly, as it has been emphasised by a more recent literature, its effectswere not particularly significant. Economic historians had long been convinced thatindustrial policy had significantly shaped the development of the Italian economy inthe late 19th century.8 However, more recent research by Federico and Tena (1998b)
6For an excellent summary, see Federico and Giannetti (1999, pp. 126-130) and, more recently,James and O’Rourke (2011).
7The Italian State, which had until then pursued a relatively free-trade policy inherited fromthe Piedmontese tradition, started to pursue an activist trade policy, initially raising its duties ona range of products (mainly textiles). In 1887, a new tariff on textiles was introduced, togetherwith a duty on wheat and a new duty on pig iron and steel products. This policy was accompaniedby State purchases of a range of goods, including weapons and railway stock, whose scale becamemore significant after national suppliers were given preferential treatment over foreign ones. Withthe support of the mixed banks, the Italian State also organised a range of industrial bailouts,including, for example, that of the steel-making firm Terni in the late 1880s.
8For instance, for the case of trade policy, Gerschenkron (1962) criticised the choice made bythe government to protect textiles, arguing that mechanical engineering would have been a betterchoice. Bailouts and State purchases were also seen as helping the development of a “military-industrial” complex, with heavier industries being helped to benefit from economies of scale in spiteof a small domestic market.
9
has shown that duties were not particularly high by European standards9 and thattheir impact on the performance of individual sectors was quite small.10 Even morerecent research conducted by James and O’Rourke (2011, pp. 9-13) subscribe tothe same conclusions. State purchases in the so-called ‘military-industrial’ complexwere also relatively limited, with railways procurement only accounting for around10% of total value added of engineering and steel products (Fenoaltea 1982, p. 129).Finally, industrial bailouts occurred with a much less pronounced frequency thanwhat would happen during the Fascist era. These considerations have led recentresearchers to suggest that Italy before World War One followed a “Mancunian”path to industrialisation (Sapelli 1992; Amatori 1980), characterised by a relativelylimited level of State intervention in the economy which favoured, in particular, themore traditional industries located outside the “military-industrial” complex. Thefirms of these sectors displayed a remarkable proficiency in adapting foreign ma-chinery (Giannetti 1994) and in exploiting the low cost of labour to exploit modernlabour-intensive technology (Federico 1996), which allowed them to increase theircompetitiveness both domestically and abroad.
On the back of these considerations, it should not be surprising that, in spite of theabsence of a strong competition law regime, such as the one present in the UnitedStates,11 pre-World War One Italy did not see a rapid rise of industrial concentrationor a widespread formation of cartels. There is little quantitative evidence on thisaspect, most of which is presented in the work by the economist Francesco Vito, whothoroughly researched the role of cartels in the world and in the Italian economy(Vito 1930; 1932; 1960; 1961). When describing the rapid evolution of concentrationand cartelisation in the Italian economy of the 1930s, Vito noticed how different thisprocess was from what had occurred in the previous years. His figures show thatthe number of mergers and acquisitions occurring in Italy between 1883 and 1927was only 219, which, as will become clear when we will examine evidence relativeto the Fascist era, was quite low. Cartels were also not particularly widespread.In his 1932 magnum opus on the subject, Vito remarked that ‘in Italy, at the turnof the century, cartels were an exceptional form of industrial organisation, whichexplains why Italian commentators who wanted to write on the subject at the timehad to look abroad for examples.’ In later years, Vito notices, the creation of cartelsaccelerated, though this process occurred at a pace which was ‘relatively less intensethan elsewhere’ (Vito 1932, p. 291).
The scarcity of cartels can be easily reconciled with the pattern of industrial policy
9They hardly ever exceeded 25 − 30% and were often around 15%.10See Toniolo (1977) on the relatively small losses caused by the protection of steel. Even more
recently, Federico and O’Rourke (1999; 2000), by estimating a Computable General Equilibrium(CGE) model for Italy in the year 1911, have come to the conclusion of the ‘unimportance of tariffs’(Federico and O’Rourke 2000, p. 29), at least in the twenty years running up to 1911.
11The Sherman Act was passed in the United States in 1890.
10

and development outlined by the revisionist literature. This association is made byVito himself. The scholar, in fact, noticed that cartelisation is more effective andeasier to coordinate in an economy with few large firms. As Italy was characterisedby a large number of small and medium enterprises, and as the government had donelittle to promote those industrial sectors which tend to be characterised by largerfirms, the role of cartels in Italian development was way smaller than in Germanyor even the United States, despite the presence of the Sherman Act (Vito 1930,pp. 281-284). As emphasised by another contemporary economist, Fausto Pitigliani,most of the cartels organised in the pre-World War One era were in fact agriculturalor highly localised (Pitigliani 1940).
2.1.2 The impact of World War One
Similarly to other countries in Europe, World War One played a significant rolein increasing the scope and intensity of industrial policy in Italy. Public procure-ment became larger in scale, particularly towards the industries of the “military-industrial” complex. There was a proliferation of planning bodies, with the creationof 297 commissioni speciali per l’economia di guerra (“special commissions for thewar economy”). A particularly important body was the Mobilitazione Industriale(Industrial Mobilisation), the arm of the Ministry of War in charge of dealing withprivate producers.12 This body was in charge of determining which firms were to beconsidered as “auxiliary firms,” and could therefore enjoy special prices, contribu-tions to investment and a range of fiscal exemptions.13 Because of the advantagestied to this status, it is unsurprising that the number of auxiliary firms kept risingthroughout the war, going from 221 in 1915 to 1,976 by the end of the war, whenthey would employ over 580,000 workers (Caracciolo 1978b, pp. 208-210). Most im-portantly for our analysis, these firms were not located uniformly across sectors. Ofthe mentioned 1,976 auxiliary firms, over 56.7% was located in chemicals, engineer-ing and iron and steel (Caracciolo 1978b). As a result, this particular discriminationintroduced during the war helped the development of new industries in a significantway.
Although they were not part of a deliberate attempt to curb competition, otheraspects of the war economy also ended up distorting the market and favouring aswitch towards a more concentrated industrial sector. In particular, the progressiverationing in the supply of raw materials meant that firms either had to lobby toreceive a large share of a depleting stock or had to find ways to obtain raw materials
12The Mobilitazione Industriale was created with two decrees passed on 26th June and 22ndAugust 1915.
13The Mobilitazione could also coordinate the activity of auxiliary firms with the military facto-ries, intervene in case of economic controversies, supervise the work done by women and minors,and manage the training schools for new employees.
11

independently from the State. This problem was particularly acute in the case ofenergy supplies, which the government often had to import from its war allies. Therationing process ended up favouring larger firms. It also contributed to the growthof concentration and the strengthening of oligopolistic or monopolistic powers bycertain groups (Caracciolo 1978b, p. 212). Overall, as put by Caracciolo, ‘onecan conclude that this emergency situation, which was prolonged for many years,represented a non-negligible discriminating factor among producers and strengtheneddominant groups in the heavy industry’ (Caracciolo 1978b, p. 215). The list certainlyincludes the vertically integrated conglomerate Ansaldo whose production rangedfrom iron ore to warships, as well as the aircraft manufacturer Caproni and the carmanufacturer Fiat.
2.2 Industrial and competition policy in the age of Fas-cism
2.2.1 A “liberal” Fascist phase
The discontinuity marked by the war did, initially, spill-over into the post-World WarOne era. This is evident from the decision taken in 1921 to approve a new generaltariff which raised duties on chemicals, engineering goods and steel products. Thenew tariff was the most tangible sign of the fact that the war had strengthenedthe arguments of protectionists against free-traders and that trade policy was nowtaking a stance which was more openly in favour of the new industry. Furthermore,in 1921 a banking consortium led by the Banca d’Italia bailed out the industrialgiant Ansaldo, enacting a rescue operation which resulted in the State taking overthe industrial concern (Saraceno 1981). Although this was different from previousbailouts, in that for the first time the State actually came to own a manufacturingfirm, it must be noticed that the government’s main preoccupation was that of swiftlyselling off the shares and not starting out a full-scale industrial policy such as theone which will be undertaken as of the 1930s (Toniolo 1980, p. 244). In fact, thesurprising aspect of the first phase of the Fascist era is that, differently from what isargued by Bardini, the discontinuity brought in by the War did not seem to be long-lived. The measures introduced in the early era of Fascism were largely reminiscentof the three-pronged industrial policy promoted in the pre-World War One era andtheir scale also appears limited.
When Fascism came to power in 1922, in fact, its industrial policy was very muchcontiguous to the one of the pre-World War One era. The rhetoric displayed byMussolini around that time was supportive of a ‘hands-off approach’ to the runningof the economy.14 This belief was mirrored by the appointment as Finance Minister
14Mussolini’s initial rhetoric displays a belief that government intervention ‘was absolutely ruinous
12

of the liberal academic Alberto De’ Stefani, ‘one of the few ministers, in twenty-threeyears of Fascism, who was above average competence’ (Mack Smith 1981, p. 118).Although one should not exaggerate the view of De’ Stefani as a free-marketeer,15
the measures he took during his short term as minister remained largely in line withthe industrial policy observed in the pre-World War One period.
Although the government insisted in bailing out firms in trouble, either directlyor through mixed banks,16 De’ Stefani’s management of public finances showed adecisive drive in reducing the amount of government spending, which fell from 35%of GDP in 1922 to 13% in 1926 (Toniolo 1980, p. 49). This was also the year inwhich the government budget was finally balanced (Toniolo 1980, pp. 48-49), fallingfrom a deficit of 23% of GDP registered in 1921 (Toniolo and Salsano 2010, p. 11).As for the trade policy the government chose to pursue, this took a decisively pro-competitive turn. Between 1922 and 1926, De’ Stefani signed 19 agreements, allaiming at reducing the rate of protection enjoyed by Italian goods abroad. The 1921tariff was also mildly lowered, so that the average rate of protection on Italian goodsfell from 10.3% in 1922 to 8.4% in 1925 (Toniolo 1980, pp. 53-54). De’ Stefani’stentative attempt to reduce protectionism did not gain him friends and, in fact,contributed to his downfall.17 When, in March 1925, he attempted to curb a flurryof speculation on the stock market, this resulted in a market crisis which ‘helped tocrystallise smouldering resentment against him’ (Sarti 1971, p. 58).18 His free-tradepolicies, which had done little to help newer industries, were criticised by a numberof influential senators. Unsurprisingly, on 8th July 1925, Mussolini announced theresignation of his Finance Minister, a decision which was also very much welcome bythe industrial establishment (Lyttleton 1974, p. 546).
In his seminal account of the economic history of Fascist Italy, Toniolo writes that,when judging De’ Stefani’s term, ‘the view that it consisted in “continuity” withthe previous financial, fiscal and banking policy would seem to be much nearer themark than the idea that it represented a form of free-market, liberal policy [. . . ],
to the development of the economy’ (Mack Smith 1981, p. 117). Also, the contemporary economistBenvenuto Griziotti (1926, p. 26) recalls that when the programme of the Fascist National Partycame out in 1922, the liberal economist Luigi Einaudi described it on the Italian daily Corrieredella Sera as marking ‘a return to the liberal ideas of classical economic policy.’
15Marcoaldi (1986, p. 14) has argued that, at the theoretical level, his conception of the economywas ‘very different from that of theoretical liberalism,’ whereas, more recently, Guidi (2000, p. 34)has defined De Stefani’s economic policy as inspired by an ‘authoritarian laissez-faire.’
16This was the case of Ilva, a steel-producing firm, which was rescued by Banca CommercialeItaliana and Credito Italiano under the auspices of the Italian government. See Toniolo (1980, p.56).
17See Toniolo and Salsano (2010, p. 13) for a description of the opposing views on trade policyamongst industrialists in those years. Whereas industries which depended on imported raw ma-terials, fuel and machinery were in favour of reducing tariffs, Italian exporters were against thismeasure.
18See also Toniolo and Salsano (2010, pp. 18-20).
13

which is basically foreign to this country’ (Toniolo 1980, p. 247).19 This appearslargely correct, as his policies were hardly liberal in an orthodox sense. Yet, twopoints should be made. Firstly, differently from what is argued by Bardini, theperiod by De’ Stefani does mark a break from the more intrusive industrial policywhich had unsurprisingly characterised the Italian economy during World War One.His decision to limit government expenditure and reduce tariffs are emblematic inthis direction. Secondly, if one accepts the revisionist view that, despite all the falserhetoric about the importance of the “military-industrial” complex, pre-World WarOne economic development in Italy was more “Mancunian” than it was previouslythought, the continuity view on De’ Stefani’s term rightly emphasised by Toniolocan be easily accompanied by a relatively benign judgement on De Stefani’s free-marketism. As State intervention had not been so significant before World WarOne, De’ Stefani’s policies were both relatively “Mancunian” and continuative of thestances taken by previous governments.
2.2.2 Quota 90
More importantly, De’ Stefani’s policies appear significantly different from the stancestaken by the Fascist government as of his resignation. His successor was GiuseppeVolpi, a Venetian industrialist and financier who was close to the entrepreneurial es-tablishment.20 Although Volpi’s holding office as Finance Minister was short-lived,21
his appointment was a clear message to the industrial establishment, which had longdemanded more State support (Toniolo 1980, p. 79). Unsurprisingly, among Volpi’sfirst decisions there was an increase in a range of tariffs.22 This was certainly sym-bolic, though not sufficiently significant to make it a breakpoint in Italian industrialpolicy.23 The true paradigm shift in industrial policy occurred circa 1926-1927.24
The key moment was Mussolini’s decision to wage the “battle for the lira,” that
19More recently, in Toniolo and Salsano (2010, p. 11) the two scholars define the Fascist liberalphase as ‘the revival of the Giolitti era fiscal orthodoxy.’
20For a detailed biography of Volpi, see Romano (1979).21His term only lasted between July 1925 and July 1928.22Volpi re-introduced the tariff on wheat, cereals and their derivatives, which had been suspended
as of 9th June 1921. He also doubled the duty on sugar which, again, had been suspended by De’Stefani in July 1923. Volpi also increased the duty on newspaper paper and on artificial silk, aswell as abolishing the customs exemptions on import machinery.
23In this respect, Toniolo’s definition as 1925 as an anno cerniera, or “hinge year” (see Toniolo1980, p. 74), in Italian Fascism appears true more from a political than an economic point of view.This seems to be confirmed by the author: ‘The change of pace [caused by the replacement of De’Stefani with Volpi] was self-evident and quick. It was a very clear political message’ (Toniolo 1980,p. 79).
24This periodisation has ample support in the literature. See Ciocca and Toniolo (1976, p. 17);Rossi and Toniolo (1992, p. 545). Even more recently, Toniolo and Salsano (2010, p. 18) describethese years as a shift from an exchange policy based on ‘benign neglect’ to a more interventioniststance.
14

is the regime’s decision to re-enter the gold standard and to fix the exchange rateparity with the pound sterling at 90 to one, the so called Quota 90.25 The intentionto pursue this policy was first announced during the so-called Pesaro Speech held on18th August 1926, but only became reality on 21st December 1927, when full con-vertibility of the lira to gold and to foreign currencies was reinstated. In particular,the lira was pegged at 92.46 lire to the pound.
Although Toniolo has argued that, in terms of purchasing power parity, Quota 90 wasjust right (Toniolo 1980, p. 123),26 it is also true that most industrialists, economistsand policymakers favoured a lower exchange rate. Before the Pesaro Speech, the lirahad been fluctuating around an exchange rate of 150 to the pound, so rejoining at120 lire appeared a more realistic target as it would have entailed less deflation andfewer trade restrictions.27 There has been a wide debate over the reasons behindthis decision. Some have argued that the rate had an intrinsic appeal, as it wasthe one in force when the Fascists took power in 1922. Restoring it was a wayfor Mussolini to gain prestige (Mack Smith 1981, p. 123), both internationally andat home. Conversely, others have argued that Quota 90 was consciously chosento promote autarky, favour newer industries and facilitate government intervention(Gregor 1979). This view has been rebutted by Cohen. In Cohen’s view, the ideathat Quota 90 rewarded those who relied heavily on imported raw materials, whilepunishing those such as textile and food producers who exported a large proportionof their produce, was wrong. His argument was that, by lowering the price of alltradeables, Quota 90 adversely affected both exporters and import-competing firms.To Cohen (1988, p. 103), ‘showing his usual political astuteness, Mussolini saw inQuota 90 a way to gain prestige for his regime at home and abroad and, at the sametime, to impose his political will on big business, the one group that still retainedsome autonomy.’28
Cohen’s view, however, appears to be somewhat narrow-minded. Quota 90 did notcome on its own but was accompanied by a range of policies which were clearly aimedat favouring some sectors of the economy over others. In particular, there was a gen-eralised increase in tariffs (Guarneri 1953, p. 134), which largely favoured the newerindustries over the older ones. This is acknowledged by Cohen, who does not denythat such measures affected the composition of domestic demand. The point is that
25The wide-reaching consequences of this decision have widely been recognized in the literature.De Felice (1968, p. 222) went as far as defining it one of the key moments in the formation ofthe Fascist State. For a discussion of the short- and long-term macroeconomic costs of the returnto the gold standard, which went hand in hand with a package of stabilization measures (thatincluded raising interest rates, budgetary stabilization and debt consolidation), and restrictions ofnote issuance by Italy’s central bank, see Ripa Di Meana (1993).
26See also more recent work by Di Nino, Eichengreen and Sbracia (2011) on the topic.27Volpi himself was sceptical of the Quota 90 as he had long tried to stabilise the lira around
Quota 120.28See also Cohen (1972).
15

Quota 90 and the new type of industrial policy should not be evaluated separately,as they were part of the same overall strategy. As argued by Toniolo, Quota 90was ‘tied to a game with the industrial leadership’ (Toniolo 1980, p. 118) wherebyconcessions were awarded to a given set of industries in exchange for support in theimplementation of the new policies. These negotiations were complex and, at times,quite tumultuous.29 Yet, the concessions were sufficiently large to bring at leastbig industrialists on the side of the regime. In April 1927, Antonio Stefano Benni,who was then heading Confindustria30 wrote on Il Popolo d’Italia that rumours con-cerning the industrialists’ disapproval of Mussolini’s monetary policy were ‘stupidnonsense’ (Adler 1995, p. 400). As underlined by Toniolo, some industrialists suchas textile producers continued to complain (Toniolo 1980, pp. 118-119), but theirlamentations remained largely ignored.
2.2.3 Competition policy
A fundamental part of the deal struck between the regime and the industrial estab-lishment was the decision by the government to favour concentration and cartelisationin the product market.31 As it has been mentioned beforehand, these had remainedlargely limited phenomena in the Italian economy before World War One. Yet, allof this changed as of 1927. The political game started with Quota 90 was, in fact,‘aimed at commencing a large-scale experiment of corporatist management and car-tel formation in the main economic sectors, similar to the one which was occurringin Weimar Germany’ (Toniolo 1980, p. 118). The first step in this direction was a1927 law providing fiscal incentives in favour of industrial concentration.32 It statedthat mergers and corporate purchases were to be subject to a lump-sum tax of 10lire, a low amount, so as to explicitly encourage industrial concentration (Guarneri1988, p. 374).
The effects were immediate. According to later work by Vito, ‘many firms decidedto form links,’ leading to ‘a powerful wave of concentration and cartelisation’ (Vito1961, pp. 44-45). This wave did not halt shortly after, but continued over thefollowing couple of years. According to data published in Vito (1930), between thesecond half of 1927 and the first nine months of 1929, 215 mergers occurred, as many
29For a full account, see Adler (1995, pp. 353-357).30This is the Italian entrapreneurial association. From 1st January 1926 Confindustria. had to
add the word fascista in its name, hence becoming Confederazione Generale Fascista dell’IndustriaItaliana (Castronovo 2010, p. 202) to then revert to its former name after the demise of Mussolini.
31In an international perspective, Italy was, however, not the only country to introducecartelization-enhancing measures during the 1930s. For example, see Broadberry and Crafts (1992)for the United Kingdom or Alexander (1994) and Cole and Ohanian (2004) for the United States.
32This was announced in a speech given by Mussolini to the Chamber of Deputies on 26th May1927 and was implemented only a month later in the R.D.L. 23rd June, n. 1206.
16

Table 1: The number of domestic cartels in the major Europeancountries, 1929
Austria 94 Poland 58Czechoslovakia 91 Russia 357Hungary 41 Estonia 4Switzerland 84 Latvia 3Netherlands 15 Lithuania 4Belgium and Luxembourg 59 Italy 28France 66 Spain 17United Kingdom 161 Portugal 2Denmark 9 Jugoslavia 10Sweden 31 Romania 21Norway 44 Greece 5Finland 31 Turkey 4Danzig 3
Source: Vito 1930.
as between 1883 and 1927. These involved 528 companies, for a total value of almost9 billion lire of the time.
On the other hand, Table 1 offers some evidence that, even in 1929, the numberof cartels in Italy was still relatively small by international standards.33 The GreatDepression was the true watershed. The crisis in fact led the government to pass leg-islation which was more obviously favourable to cartels, in an attempt to rationaliseindustrial production and to boost profits via price increases. Two laws, in particu-lar, stand out. The first one was a law on ‘obligatory cartels’ (consorzi obbligatori),which was passed in June 1932,34 while the second one was the one on ‘voluntarycartels’ (consorzi volontari),35 passed in April 1937. In the case of “compulsory car-tels”, all firms in a given industry were required by law to join the industry-specificcartel. Conversely, in the case of “voluntary cartels”, firms could voluntarily decideto join, leading to a less drastic reduction of competition in the given sector.36 We
33It is clear that the absolute number of cartels in different countries (where Germany is, surpris-ingly, excluded) is a poor indicator of the extent of cartelisation. The size and economic structureof the countries considered in the sample, in fact, differ significantly. Secondly, the data give noinformation on the coverage and effectiveness of the cartels at raising prices and reducing output.Nonetheless, Table 1 still offers some support for our overall argument.
34R.D.L. 16th June 1932, n. 834.35R.D.L. 22nd April 1937, n. 961.36Confindustria however ‘saw to it that compulsory cartels were essentially consensual: they
17

Figure 1: Cartels present in the different branches of Italian industry,1942
482
219
69
40
38
35
19
16
13
11
10
9
3
0 50 100 150 200 250 300 350 400 450 500
Total
Food
Paper and prin8ng
Mechanical engineering
Non metallic minerals
Chemicals
Tex8les
Metalmaking
Mining
Various
Clothing
Timber and furniture
Leather
Source: Giordano, Piga and Trovato 2012.
will seek to assess the impact of these laws quantitatively in Section 2.3. Yet, it isuseful to present here some initial evidence. According to Federico and Giannetti(1999), by 1938 the number of cartels in manufacturing had risen to 144 nationaland 111 local ones. This number rose further across World War Two. Figure 1,shows that the total number of cartels in Italian industry in 1942 was as high as482.37
Having favoured concentration and cartelisation, the regime also made it more dif-ficult for new firms to enter a given market. This was done through a law on thediscipline of industrial plants which was passed in 1933.38 This law obliged firmsto apply for a licence in order to create new productive units or to expand existingones.39 According to evidence by Cianci, only 71% of the requests sent in between
would have to represent at least four-fifths of any given sector, and their deliberative assembliescould take action only if two-thirds of the members were present’ (Adler 1995; p. 424-425). Thismeant that Confindustria made sure that the law on “compulsory cartels” ‘remained a dead letter’(Sarti 1971, p. 101) and that the legislation on consorzi obbligatori was effectively transformed intoa promotion of consorzi volontari.
37Unfortunately, the sources consulted do not reveal the share of the market which was cartelisedin each individual sector or whether the cartel was regional or national. This limits the usefulnessof this type of evidence.
38R.D.L. 12th January 1933, n. 141.39The law disciplined all industrial sectors with the exception of construction and mining which
had their own specific legislation.
18

1933 and 1937 were actually approved (Cianci 1977, p. 233). The three major bene-ficiaries of the licenses were the chemical, steelmaking and engineering sectors (Sarti1971, p. 108), evidence which, once again, points to a sectoral bias.
This law immediately stood out as an anti-competitive device. In Gualerni’s words,the law ‘allowed large incumbents to tactically use permits in order to create apowerful barrier to entry against possible competition’. As the firm applying fora permit was not obliged by law to build or enlarge the plant, a ‘large number ofapplications was, therefore, made, only to prevent competition’ (Gualerni 1976, p.177). In fact, once a license was issued, government officials would most likely rejectsimilar applications to competing firms. In theory, a 10,000 lire fine would then beimposed on those failing to act upon a granted license. Yet, as Covino, Gallo andMantovani (1976) have pointed out, the sanction was rarely applied. Furthermore,as explained by Sarti, even when it was applied, the fine was ‘a relatively small sumgiven what is at stake’ and was therefore treated as an ‘insurance against competition’(Sarti 1971, pp. 108-109).40 The quantitative evidence seems to support this view.Gualerni shows that, by the end of World War Two, when licensing was discontinued,only 414 out of 5,114 new plants for which an authorisation had been requested wereactually built (Gualerni 1976, p. 177).41
2.2.4 The creation of IRI and foreign exchange policy
Another development, which was probably the most innovative policy of the entireFascist period, concerned the creation of the Istituto per la Ricostruzione Industriale(IRI) in 1933. It was created as a temporary institution, whose aim was to alleviatethe balance sheets of the Italian mixed banks, weighed down by their frozen industrialstakes, following their aggressive purchase strategy pursued in the 1920s.42 Thefinancial troubles affecting these banks were ultimately threatening the solidity of
40The same conclusion was reached by the contemporary economist Luigi Einaudi, then corre-spondent of The Economist. As he wrote at the time: ‘It appears that some people have asked forauthorisations to start new plants, without any real intention of starting them, hoping instead thatentrepreneurs already on the job would be willing to purchase those rights for the sake of avoidingcompetition’ (Einaudi 1934, p. 356).
41A large debate, fuelled by Gualerni himself, has discussed the reliability of these numbers. AsCovino, Gallo and Mantovani (1976 p. 198) recall, the first figures on the number of authorizationswere presented in Istat (1941) and covered the period until 31st December 1940. ISTAT (1946)then published the number of authorizations until 1941 and, for the first time, the number ofauthorized plants actually built. However in Del Buttero (1946), a publication by the Ministeroper la Costituente, a much lower ratio of plants built to authorizations released was published,but was later defined ‘too strict’ by Gualerni (1976 p. 177), who, in turn, revised the numbers.Finally, Covino, Gallo and Mantovani (1976) presented numbers disaggregated by sector. Anyhow,all figures produced point to a low share of plants actually built.
42Italy’s main mixed banks were Credito Italiano, Banca Commerciale Italiana and Banco diRoma.
19

the Bank of Italy, as the latter was exposed towards the banks for sums equivalent to54% of the total circulation in place at the end of 1932 (De Mattia 1967, p. 459). Inorder to definitively end the crisis and to reorganize the banking system, the regimethus opted for the creation of IRI.43
Before the 1930s there had been episodes of the State acting as a lender of last re-sort of the banking system and, directly or indirectly, supporting industrial shares.44
However, in these occasions, the State had paid little interest in using these oper-ations to pursue an independent industrial policy.45 As argued by Cohen, this wasalso the initial intention of the government when it created IRI.46 Yet, following theinitial moves which were largely targeted at reducing its debt towards the Bank ofItaly, a new type of policy was pursued.47 Given the abolishment of mixed banksby the 1936 Banking Act,48 it became obvious that IRI could provide a key rolein re-organising the industrial activity of the country.49 This action was aimed atsupporting the whole of Italian industry, including small and medium enterprises,which were defined in an internal document as ‘the basis on which Italian industrialstructure can be preserved and strengthened.’50 Its impact was to be long-lastingas, despite the initial intentions by the government, IRI was made permanent in
43R.D.L. 23rd January 1933, n. 5.44Institutions such as the Consorzio per Sovvenzioni su Valori Industriali (CSVI), founded in
1914, and the Liquidation Institute (Istituto di Liquidazioni), created in 1926, financed by theState, organized and managed relevant bank bailouts in the 1920s (see, for example, BarbielliniAmidei and Giordano 2012, p. 26). IRI actually absorbed the Liquidation Institute.
45Furthermore, these previous interventions were generalised and concerned all industrial sectorswith no particular sectoral bias. For example, Biscaini Cotula, Gnes and Roselli, when analysingthe CSVI, claim that the Governor of the Bank of Italy, also head of the CSVI, ‘never showed anysectoral “vocation” in the credit extension of the Consortium, neither initially nor in its later phase.Conversely, he emphasized, probably in order to avoid risk concentration, the need to commit tomultiple industrial branches’ (Biscaini Cotula, Gnes and Roselli 1985, p. 157).
46‘IRI was not the logical fulfillment of a long-term plan but it was instead an emergency measuretaken to avert an economic disaster’ (Cohen 1988, p. 106).
47Already in May 1934, Mussolini threatened that: ‘Those who still speak of a liberal economymake me laugh or weep, both at the same time. But three quarters of the Italian industrial andagricultural economy is in the hands of the State. And if I dare to introduce to Italy State capitalismor State socialism, which is the reverse side of the medal, I will have the necessary subjective andobjective conditions to do it’ (Giordano 2007, p. 35).
48As well as explicitly aiming at preventing banking instability, the Banking Act also opened upthe way to an active direction of financial flows on behalf of the State towards selected sectors ofthe economy. The so-called “long-term liability” credit institutions, financed by State-guaranteedbonds, were the only banks allowed to extend long-term loans, as this activity was forbidden to“short-term liability” institutions. Via the guidance of these long-term credit institutions and theextension of subsidised credit, the State replaced the former mixed banks in allocating credit tothe Italian economy. See Barbiellini Amidei, Gigliobianco and Giordano 2012 for an analysis of thelong-run relations between long-term and subsidised credit, and sectoral economic performance inthe decades following World War II.
49This aim was stated in the preamble of the decree which set up IRI. See Toniolo (1980, p. 245).50See an IRI memorandum quoted in Toniolo (1980, p. 267).
20

1937.51
Despite the intent to support the whole of Italian industry, however, IRI invariablyended up having an immediate distortionary effect across sectors. The sharehold-ings acquired by IRI were, in fact, unequally distributed among sectors and largelyincluded the more capital-intensive ones, with which the former mixed banks hadcloser ties to. To get an idea of its sphere of influence, IRI came to hold: 100% ofthe iron and steel war industry, of the artillery industry and of the coal-extractionindustry; 90% of the naval industry; 80% of naval companies and of the locomotiveindustry; 40% of the iron and steel industry; 30% of the electricity industry; 20%cent of the artificial silk industry; 13% of the cotton industry (Toniolo 1980, p. 250).It also controlled the mechanical and armaments industries, telephone services, aswell as the three ex-mixed banks. In all, IRI owned over 40% of the Italian sharehold-ers’ capital, hence resulting the greatest holding company in Italy. IRI also groupedsimilar concerns under the control of new sub-holding companies: STET (1933) fortelephone services, Finmare (1936) for shipping companies, Finsider (1937) for steel,Finmeccanica (1947) in the mechanical engineering sector, and Finelettrica (1952)in the electrical sector (Barbiellini Amidei and Giordano 2012, p. 64).52 All thesesectors, which were also those where the investment of private capital was riskierand least likely to occur after the Great Depression (Toniolo 1980, p. 256), endedup benefitting largely from the Istituto.
Interestingly, IRI outlived the Fascist regime and became a key actor in Italy’s GoldenAge.53 Following the confirmation of the 1936 Banking Act by the Assemblea Cos-tituente at the end of World War Two, the segmentation of Italy’s banking sector inshort-term and long-term credit institutions remained even after the demise of theFascist government which had introduced it. IRI too was saved since it was widelyrecognized as not being an arm of the Fascist regime, but rather the product of ahighly technical and committed braintrust which had used its experience in bankbailouts to reorganise Italy’s financial system, and industrial sector as a result. Thecontribution of IRI to innovation and growth in Italy in the 1950s and ‘60s goesbeyond, however, the scope of this paper.
Finally, to complete the picture, in the 1930s, as in many other countries hit bythe Great Depression, controls on the foreign exchange were introduced, again withan asymmetric effect on Italy’s industrial sectors. In 1931, in fact, the Minister ofFinance Antonio Mosconi, who had replaced Volpi, was given the power to issue
51IRI Report of 6th May 1937, reported fully in Cianci (1977, pp. 362-371).52IRI further enlarged its reach in the 1950s, obtaining an absolute majority of shares of RAI
(the national broadcasting company) in 1952 and taking control over Alitalia (the national airline)in 1957.
53See for example Barca and Trento (1997); de Cecco (1997), Pastorelli (2006) and Antonelli,Barbiellini Amidei and Fassio (2012).
21

measures regulating foreign exchange.54 Interestingly, Mosconi himself had abol-ished similar measures only the year before, in 1930, introduced by his predecessor.However, Mosconi used his new power solely to dictate general guidelines to Ital-ian banks, guidelines which however were not mandatory and which therefore werenot enforced by many parties involved (Guarneri 1953, p. 432). The next FinanceMinister, Guido Jung, changed stance, and regulated foreign exchange heavily. Forinstance, operations in foreign currency were forbidden if they did not respond tothe true needs of industry.55 Moreover, clearing agreements were drawn with Bul-garia, Romania and Germany.56 In 1935, the Sovrintendenza agli scambi e alle valute(Superintendence of exchanges and currencies) was created. Its aim was to coordi-nate the complex foreign exchange issues, but also to distribute the scarce meansof payments to Italian importers according to the priorities dictated by the needsof the nation (Toniolo 1980, p. 281). This implied strict, but also discretionary,controls on imports. As the head of the Sovrintendenza Felice Guarneri later de-clared in 1939: ‘the distribution of imported raw materials is to be organised withthe aim of insuring the manufacturing firms which export sufficient resources alsofor the internal market, putting them in a position of clear superiority relative tothose firms that enjoy relying on the internal market’ (Guarneri 1939). This impliedthat import-dependent sectors, such as cotton, cited in Toniolo (1980, p. 275), wereforced to export to survive, which often meant relying on dumping procedures giventhe international closure of those years. The controls on imports also led to corrup-tion and speculation, hidden behind the golden propaganda of the Fascist regime(Toniolo 1980, pp. 286-287). Once again industrial policy was tailored in such away so as to favour certain sectors, namely the modern ones, to the detriment of theother, traditional sectors.
Overall, the account presented in this Section shows that Italian industrial policyunderwent a significant shift after the decision to fix the exchange rate with thepound at Quota 90. Far from signalling continuity relative to the previous period,the years which followed were characterised by an innovative approach to industrialpolicy. This included a decisive attempt to tamper with competition in the productmarket which was followed by a new, more intrusive, State action through the newlycreated IRI and foreign exchange controls. These policies often affected the mar-ket in an asymmetric way, favouring newer industries at the expenses of the moretraditional ones. Their impact was all more significant, as they came after an eraof relative liberalisation, the age of De’ Stefani, that had reversed at least some ofthe trends which had characterised the economy during World War One. Althoughthe legislative evidence appears relatively strong to back-up our claims a) that anyanalysis of the evolution of labour productivity in Italian industry cannot treat the
54Royal legislative decree of 29 September 1931, no. 1207.55Ministerial decree of 26 May 1934, no. 124.56See Guarneri (1953, pp. 433-434) for details.
22

Fascist era as a homogenous period and b) that the relation between industrial pol-icy and productivity ought to be tested empirically, it appears essential to provideevidence that the legislative changes occurring in the era did change the behaviourof Italian firms. The relationship between industrialists and the regime was, in fact,relatively complex with continuous games being played between the two actors (Sarti1971; Adler 1995). Hence, it is possible that the propaganda by the regime maskeda lack of application of its laws. Using the limited existing evidence and some newlyconstructed measures, Section 2.3 shows that the legislative changes in competitionpolicy were truly matched by changes in various indicators of concentration in theeconomy. We also provide evidence that these changes affected old and new industriesasymmetrically.
2.3 Measuring the effects of shifts in competition policy
The policy shift occurring as of the second half of the 1920s can be traced in a rangeof economic indicators showing changes in the level of competition in the industrialsector.57 This Section looks at two sets of indicators. The first one, presented inSection 2.3.1, is evidence on concentration indices. Although an imperfect proxyfor competition, disaggregated data on concentration are available for a number ofbenchmarks over the 1911-1951 period. In order to complement these results, inSection 2.3.2 we present a second set of indicators, namely changes in prices andin the Cowling index. Although they are only available for a limited number ofbranches and years, these measures have the advantage of looking at the effectsof anti-competitive behaviour rather than at one of the possible causes. As bothindicators behave quite similarly in response to the main changes occurring over theperiod, we find strong evidence that the legislative changes outlined in the previousSection did have an impact on the behaviour of Italian firms.
57This may have not necessarily been the case for the economy as a whole. In two distinct papers,Rossi and Toniolo (1992; 1993) calculated the aggregate mark-up in the Italian economy. In theirfirst paper, the two scholars assumed the presence of three factors of production (labour, importsand capital). Their estimates of market power over the period between 1922 and 1938 are high andvolatile. They find that market power declines almost continuously between 1922 and 1929 (from2.03 to 1.29), before rising between 1929 and 1932 (from 1.29 to 1.92). Surprisingly, this value thenfalls throughout the 1930s, reaching 1.40 in 1938. In the estimates presented in their later paper, thescholars re-calculate the aggregate mark-up for an economy with five factors of production (labour,energy inputs, other imported inputs, private capital and public capital). In this case the level ofthe mark-up remains high but the volatility disappears (their estimate of market power is mostlybound between 1.65 and 1.75). In this case, the decline in market power is steady and happensalmost continuously throughout the 1920s and 30s. Since this evidence refers to the economy as awhole rather than to the industrial sector, it does not contrast directly with our findings. Moreover,the results remain controversial (Federico 1996, p. 781).
23

2.3.1 The evidence on concentration
Studies on the evolution of concentration in Italian industry in the first half of the20th century trace back to the pioneering work by two contemporary statisticians,Felice Vinci and Mario Saibante. In particular, using data on corporate capital and anaggregate Gini inequality index, Saibante found that concentration in industrial joint-stock companies stayed substantially stable between 1916 and 1926, only increasingfrom 78.80 to 80.82, before jumping to 88.92 in 1932 (Saibante 1934).58 This wouldsuggest that there was a sudden acceleration in the concentration of Italy’s industrialstructure after Quota 90. However, this evidence is of limited use as it does not allowone to explore the evolution of concentration in the different industrial branches.This was done by a later economist, Profumieri, who in the 1970s calculated thepercentage of share capital which was controlled by the largest firm in a numberof sectors for 1938, using data taken from an extensive study carried out in theRapporto della Commissione Economica all’Assemblea Costituente (Ministero perla Costituente 1948, pp. 289-300). His results59 led him to conclude that, in the1930s, ‘there is much evidence that the reorganization and concentration of shareand financial capital went along with State intervention’ (Profumieri 1972, p. 684).Notwithstanding the limited size of this dataset, this study also confirms that thepolicies we outlined in the previous Section did have a relevant impact on the marketstructure of Italian industry.
A more comprehensive dataset, looking at broader indicators than Profumieri’s C1ratios, is the one on the evolution of concentration in the corporate capital-base, puttogether more recently by Giannetti and Vasta (2006).60 The two scholars calculatedthe C4 index of assets of listed manufacturing firms.61 The firms considered werethose present in the Imita.db dataset over seven benchmark years for the period1913-1971.62 Giannetti and Vasta define as competitive a sector whose C4 index is
58This study builds on the eariler work by Vinci (1918) and Saibante (1926).59He found the C1 ratio to be: 100% for tyres, 70% for phone cables, 100% for rayon, 75% for
chemical fertilisers, 83% for cars, 65% for artificial fibres and 45% for electricity. See Profumieri(1972, p. 684).
60This work builds on a previous paper by Giannetti, Federico and Toninelli (1994).61C4 is the percentage quota of the observed variable (in this case, assets) for the four largest
firms. This is an imperfect indicator, since ideally one would like to base the calculation on valueadded or production of the considered firms. However, this evidence is not available. The authorsalso constructed a Herfindhal index, which was strongly correlated (0.85) with their C4 indicator(Giannetti and Vasta 2006, p. 51). Furthermore, the fact that the database only takes into accountlisted firms could potentially bias the results. Giannetti, Federico and Toninelli (1994) effectivelyrebutted this criticism, underlining how the selection of firms subjects the dataset to two contrastingbiases. On the one hand, the database understates concentration because it ignores the role playedby cartels. On the other, however, it overstates it, as multisectoral firms are counted only once andbecause it ignores the presence of firms which either were too small or were not joint stock.
62IMITA.db (IMprese ITAliane Data Base) is the historical archive of the Italian joint stockcompanies. It represents the digital version of a serial source based on a collection of published
24

Figure 2: C4 ratios in Italian manufacturing, 1913-1951
0.10
0.20
0.30
0.40
0.50
0.60
0.70
1913 1921 1927 1936 1952
C4 inde
x
Manufacturing (Giordano and Giugliano) New
Manufacturing (GianneA and Vasta) Old
Sources: Giannetti and Vasta 2006 and our elaborations on their data.
below 40%, semi-competitive if its value is between 40% and 59% and monopolisticif the index is above this last threshold. The scholars present both their raw resultsand those adjusted for the role of groups, that is consolidating assets for those firmslinked by interlocking directorates. Since we find the latter measure to be moreinteresting for our study, we only present Giannetti and Vasta’s ‘consolidated’ C4index for manufacturing in Figure 2. The Figure looks at the five benchmarks whichare most relevant for our work, namely 1913, 1921, 1927, 1936 and 1952.
Giannetti and Vasta’s consolidated index shows little change over the five bench-marks which are most relevant to this study. Despite being relatively small, thechanges occurring between 1913 and 1927 are consistent with what we expect fromthe historical narrative. Concentration rose over the war, before declining between
volumes, edited from 1908 to 1926 by the Credito Italiano, and then from 1928 by the associationof Italian joint-stock companies, the Associazione fra le societa italiane per azioni (Asipa). Thissource includes all the joint-stock companies listed in at least one of the Italian stock markets,together with all those companies based in Italy, which in their last balance sheet reported capitalhigher than a given threshold, which was fixed at different levels in different years. The databaseincludes information on individual companies and on boards’ members, for the period between 1900and 1983. The years chosen by Giannetti and Vasta were selected to be close to the years of theindustrial censuses (Giannetti and Vasta 2006, p. 52).
25

1921 and 1927. Conversely, there seems to be no change in the C4 index between 1927and 1936 and only a small change between 1936 and 1952. Such results would sug-gest that the liberal phase of Fascism was only able to return concentration levels inthe manufacturing sector to those registered in the pre-World War One era, and thatthere was practically no “regime break” in the Fascist years. Finally, manufacturingresults as a “competitive” sector throughout.
However, drawing such conclusions from this piece of evidence appears quite rushed.The indicator presented by Giannetti and Vasta appears of little use for those in-terested in the level of competition within Italian manufacturing. In fact, Giannettiand Vasta compute their index by considering the four largest firms in the aggregatemanufacturing sector: they therefore analyse a market which is too broadly definedand which dilutes the resulting concentration measures since the denominator of theindex is disproportionately large relative to the numerator (hence their small index).In Figure 2 we compute an alternative C4 index for manufacturing, in which weweight the C4 ratios for each branch (available in Giannetti and Vasta 2006) bybranch-specific value added at current prices.63 The immediate result is that ourmanufacturing concentration index is much higher than Giannetti and Vasta’s, sincethe assets of the four largest firms in each branch are divided by the total assets ofthe same branch, and not by the total assets of the aggregate manufacturing sector.As well as being higher, our new indicator also behaves differently from Giannettiand Vasta’s over time. According to our measure, the level of concentration between1913 and 1927 was roughly stable, with the period of liberal Fascism being charac-terised by a gentle decrease in concentration. The second phase of the Fascist erawas, conversely, characterised by a rise of our indicator from 0.47 (semi-competitive)to 0.56 (nearly monopolistic) in just under ten years, providing some useful supportto the theory that the new policy regime introduced as of 1926-1927 did have asignificant effect on concentration in the product market.
Our further elaborations on Giannetti and Vasta’s data, which divide the industrialsector into new and old industries,64 and which are also presented in Figure 2, shedsome light on the heterogeneous performance of the different branches of Italianmanufacturing.65 Generally speaking, concentration was quite high in both groups.66
The old industries were characterised by falling concentration between 1913 and1921 and by a relatively stable C4 ratio thereafter. Conversely, between 1913 and
63For the years 1913, 1921, 1927 and 1936, we employ data from Carreras and Felice (2010). Forthe year 1952, we employ data relative to 1951, taken from Fenoaltea and Bardini (2000b).
64For a description of this classification, refer to Section 3.2.65Note how our aggregate manufacturing concentration index is consistent by construction with
the new and old industries’ concentration measures.66This is confirmed by Giannetti and Vasta (2006, p. 61): ‘competitive sectors diminish greatly,
while the monopolistic sectors prevail; amongst these we find both those sectors linked to thetechnological regime of the second industrial revolution, as also the majority of the traditionalsectors.’
26

1952, concentration increased quite substantially in the newer industries. For thelatter, changes in the individual sub-periods were rather dramatic. Concentrationrose fast during World War One, and then fell below 1913 levels during the eraof liberal Fascism. Conversely, the 1930s saw a fast acceleration in the process ofconsolidation in the new industries, as our indicator rises by 0.12 in less than 10years. In particular, the C4 ratio for the coke and petroleum products industry roseby 0.22, while the one for chemicals and chemical products by 0.13.67 These resultscontrast with what happened over the same period to the textiles, textile productsand leather industries, where the C4 ratio fell. Overall, these findings suggest thatthe new industries underwent the most dramatic changes in concentration, and thatthese changes closely map the historical narrative we have outlined in the previousSection. Conversely, the regime break we have identified over the period was lesspronounced for the old industries.
2.3.2 Prices and Cowling indices
The concentration data presented in Section 2.3.1 provide some initial evidence thatthe level of product-market competition responded to the policy changes introducedover the period and that these changes were particularly dramatic for the new indus-tries. However, concentration may not be indicative of what is happening to the levelof competition in a given product market. Although a high concentration ratio canfavour the establishment of an anticompetitive environment, there is no monotonicrelation between the number of firms in a sector, or the concentration of production,and the level of competition.68 Therefore, it is useful to look at the changes in pricesto understand whether increased concentration was also accompanied by reducedcompetition.
Unfortunately, evidence on the pricing behaviour of firms is more piecemeal thanthe one on concentration.69 Some evidence is however presented in a recent studyby Giordano, Piga and Trovato (2012). Similarly to Cole and Ohanian (2004), whoanalysed the US manufacturing sector, Giordano, Piga and Trovato (2012) measured
67This is based on our elaborations, here not shown. The rise in concentration in these brancheswas due not only to the increase in size of existing firms, but also due to the emergence of new,successful players who gained relevant market shares in these years.
68For example, the standard Bertrand (1883) model shows that, under stringent assumptions, thepresence of only two firms in a market can result in competitive pricing. The theory of contestablemarkets, first presented by Baumol (1982), has shown that the threat of entry can be sufficientlysevere to induce a reduction in the mark-up even in a monopolistic market. Conversely, althoughcollusive agreements are harder to sustain in the presence of a large number of firms, a market withmany firms can be characterised by super-normal profits when a cartel is created.
69‘Despite the importance which some attribute to the measures aiming at regulating competition,it is impossible to evaluate quantitatively their relevance in slowing down the fall of the prices ofindustrial products’ (Toniolo 1980, p. 163).
27

the relative prices of a selection of goods produced by cartels in Italy for the period1932-1938, after the introduction of the law on consorzi obbligatori, mentioned inSection 2.2. The ratio is computed with respect to a private services deflator, whereprivate services represent one of the few not-cartelised sectors in the 1930s. Theirmain finding is that the relative prices of cartelised goods rose after 1932, and re-mained high throughout the decades. Their conclusion is that, ‘even if the Fascistcartels rarely included all the firms of an industry, they seem to have been effectivein reducing competition and raising the prices of goods’ (Giordano, Piga and Trovato2012, p. 15).
The problem with this type of evidence is two-fold. Firstly, because of data limita-tions, Giordano, Piga and Trovato (2012) cannot offer a systematic view of all sectorsof Italian industry and have to limit their analysis to selected products. Secondly,the evidence they present can be misleading in the case of processed goods. In thiscase, rather than being a consequence of the establishment or of the improvement inthe functioning of a cartel, their result may be due to changes in the prices of inputs,not necessarily due to the presence of other cartels, which could have driven up theprices of the final output.70
In order to avoid the problems related to the comovement of inputs and output prices,one possible approach is to calculate branch-specific price-cost margins, through theso-called Cowling index. For branch i, this means calculating (V Ai − wiLi)/V Ai,where V A is value added and wL is the wage bill (Cowling 1982).71 This indicatorhas been used extensively in the international literature, as it has the advantage oflooking at the effects of competition rather than at the possible causes.72
The calculation of price-cost margins in the Italian case is not straightforward, asinformation on ‘value added’ and on ‘wage bills’ only began to appear in the officialstatistics in the 1937-1939 industrial census. However, thanks to the recent effortin the reconstruction of the Italian national accounts, branch-specific data on valueadded at current prices are now available in the literature. Conversely, calculatingthe wage bill is less straight-forward and requires using a wide range of sources.
70In Giordano, Piga and Trovato (2012)’s sample of products, two are in fact processed goods.71Broadberry and Crafts (1992) use this measure in their analysis of the impact of cartelisation
on productivity growth in Britain in the 1930s. Alexander (1994) uses a slightly modified versionin order to examine the effects of the National Industrial Recovery Act in the United States. Onemust be aware, however, that a potential problem with the price-cost margins estimated throughthe Cowling index is that they inappropriately include in the supernormal profits the return oncapital. Data limitations are however such that this issue cannot be tackled.
72Another recently developed index of the effects of competition is the profit elasticity (Booneand van Leuvensteijn 2010), which measures the percentage fall in a firm’s profits in response toa 1% fall in the firm’s efficiency. The more competitive the environment, the bigger the fall inprofits due to a given loss in efficiency. The data required to compute this measure are profits andmarginal costs, which, however, are not available for Italy in the period under study. Hence thistype of indicator has not been explored in this paper.
28

Data on payroll is only available for the 1937-1939 and 1951 industrial censuses and,even in these cases, because of the incomplete coverage of the industrial censuses,73
they only refer to a fraction of Italian workers. To make these figures comparablewith the available evidence for value added, which refer to the whole of the Italianworking population, we combine information from the relevant industrial censuseswith data from the population censuses. This procedure is also applied to the pre-1938 datapoints, where a range of independent sources is employed to obtain data onhourly and daily wages and on the number of hours worked.74 The main point to bemade here is that this procedure only allows us to calculate Cowling indices for fourbenchmark years, namely 1911, 1927, 1938 and 1951, instead of the five benchmarksavailable in the analysis of concentration ratios. The absence of an industrial censusbetween the years 1911 and 1927 prevents us from constructing a post-World WarOne benchmark, which would be useful to distinguish between the war and the De’Stefani era.75 However an analysis of the Cowling index limited to the years availablecan still be useful to confirm or refute the previous findings drawn by observing theconcentration index, as in the previous Section.
Figure 3 shows the Cowling index for the benchmark years 1911, 1927, 1938 and1951. We present data for the whole of industry,76 for manufacturing,77 and forold and new industries. All the indicators represent weighted averages, which arecalculated multiplying the price-cost margin of each branch by weights based on thevalue added generated in that year. This figure shows that there was a significantdifference in the behaviour of the product market between, respectively, 1911 and1927, and 1927 and 1938. In industry as a whole, price-cost margins stayed roughlystable between 1911 and 1927, before rising substantially in the second period. Thisincrease is then followed by a fall in the margins which characterised the 1938-1951period, showing that the experience of the post-World War Two era was differentfrom what occurred in the 1930s.
Generally speaking, the trends observed in industry as a whole are confirmed by thedata relative to manufacturing, which allow a more direct comparison with what washappening to the concentration ratios supplied in the previous Section. Although it isnot possible to say how the two measures relate over the 1911-1927 period because ofthe lack of a post-World War One benchmark, for the other periods the movements ofthe aggregate price cost margins tend to mirror those of the aggregate concentration
73For more details, see Section 3.2.74Full details of how the estimates are obtained are provided in Appendix A to which we refer.75This will also be the reason why, in our econometric exercise performed in Section 4.2, we prefer
to rely on concentration ratios rather than on the Cowling indices.76As in the later Sections of this work, we prefer to drop construction, a sector whose behaviour
is deemed to be excessively cyclical to produce meaningful results in this type of study.77We plot data referring only to manufacturing (hence dropping utilities and mining in this graph)
so as to allow comparability with the data on C4 presented in Figure 2, which refer to manufacturingonly.
29

Figure 3: Cowling Index for Italian industry and manufacturing,1911-1951
0.50
0.55
0.60
0.65
0.70
1911 1927 1938 1951
Cowlin
g Inde
x
Old industries New industries Manufacturing Industry
Sources: see text.
30

ratio. In both cases, a significant break is present after 1927, proving that the secondphase of Fascism was charcaterised by a much less competitive industry.
When we look at the different behaviour of the price-cost margins for the new andold industries, just as in the case of the concentration ratios, we can appreciatesome significant differences between the two categories. In the case of old industries,price-cost margins rose gently in both 1911-1927 and in 1927-1938, before falling,again quite mildly, between 1938 and 1951. These changes contrast vividly withthose occurring among new industries. In this case, the period between 1911 and1927 is marked by slightly falling price-cost margins, which then rose very fast in the1930s, before falling in the 1940s. These results confirm the view that the anticom-petitive shift occurring in the 1930s was largely driven by what occurred in the newindustries.
Overall, the evidence on concentration ratios and on the pricing behaviour of firmsshows that the legislative changes occurring between 1911 and 1951 did have an effecton the behaviour of agents in the product market. The era of liberal Fascism markeda shift from the war economy which was then reversed throughout the 1930s, whenproduct market competition was severely limited, largely because of what occurred inthe new industries. This analysis fully justifies our decision to analyse productivitygrowth in Italian industry over the period using a larger set of benchmark years thandone in previous work, something which we spell out in Section 3. It also justifiesour decision to assess whether these changes had a positive or a negative impact onproductivity growth, a task which we undertake in Section 4.
3 Labour productivity growth dynamics and struc-
tural change
This Section examines the evolution of labour productivity growth in Italian indus-try, during its different phases and within its component sectors, between 1911 and1951. Building on a new dataset described in Section 3.1, in Section 3.2 we presentcrude figures on the growth rates of output per worker in key sub-periods, whereasin Section 3.3 we attempt to refine our results in order to account for changes inthe number of hours worked. What clearly captures our attention is the differentgrowth rates registered in the two phases of Fascism, as well as the heterogenousperformance of new and old industries. In both sections, we complete our analysisby decomposing, via shift-share techniques, our estimated productivity growth rates,so as to disentangle the effects of internal productivity growth and of shifts of labourresources from low-level productivity sectors to high-level productivity ones.
31

3.1 Output per worker: the data
In order to analyse the patterns in Italian industrial labour productivity growth,many issues concerning the data available have to be first tackled. Value addedestimates for the period under study were heavily unreliable until the most recentpast. Official ISTAT (1957a) and semi-official ISTAT (Fua 1978) data, constructedon the basis of dubious, or simply not described methodologies, were found to sus-piciously amplify Italy’s industrial growth during World War One, which thus ledItaly to outperform all other European belligerant countries (Broadberry 2005), andto underestimate the impact of the Great Depression on Italian industry (Giugliano2011a). In general, the extant 1911-1951 data were unanimously deemed highlyunsatisfactory for economic analysis.
Very recently, Carreras and Felice have produced new annual estimates of Italy’sindustrial VA for the period 1911-1951 (Carreras and Felice 2010; Felice 2011) whichhave overcome the flaws in the previous series. Giugliano (2011a) has in turn revisedsome of the underlying elementary series, thus providing even more refined estimatesfor the decade 1929-1938. For the present paper, however, Carreras and Felice’s VAestimates are used, given the too short a time-span in Giugliano (2011a)’s work. Abrief description of Carreras and Felice (2010) and Felice (2011) data may be foundin Appendix A to which we refer.
If the existing VA series present some problems, the choice of the labour input data iseven more controversial. For the headcount of labourers, two possible sources exist:industrial census (IC) or population census (PC) data.78 Not all the mentionedcensuses, however, have the same degree of reliability. For example, the 1921 PCfigures were revised at the next census date, in 1931, due to recognized irregularitiesin the data-collection process (Vitali 1970, p. 272). Similarly, the 1937-1939 IC isproblematic in that it was taken over three years, so as to measure each industrialbranch when it was working at full capacity (Chiaventi 1987, p. 131). Furthermore,IC data are known to underestimate the labour input as they exclude seasonal andpart-time work, and cottage industry; PCs on the other hand, by measuring the activepopulation, are known to overrate employment, since they also count in seasonalworkers and (temporarily) unemployed. All things equal, the use of ICs as labourinput increases the labour productivity estimate at a given date, whereas the use ofPCs brings the estimate down.79
These measurement issues are not unknown to other countries, yet in Italy a partic-ularly heated debate concerning the correct measure of employment to be adopted isstill ongoing. Just to mention a recent example, when constructing Italy’s regional
78For those not familiar with Italian censuses, ICs were taken in 1911, 1927, 1937-1939 and 1951,in the period considered, whereas PCs date back to 1911, 1921, 1931, 1936 and 1951.
79It is noteworthy that the difference between the two census-based estimates decreases signifi-cantly over time (Zamagni 1987, p. 44).
32

estimates of industrial production for the period 1861-1913, Fenoaltea vouched forPC figures (e.g. Fenoaltea 2003, p. 1061), after having criticized Zamagni’s use ofthe 1911 IC in Zamagni (1978). Felice (2005, p. 5) diplomatically opts for an inter-mediate solution, assuming that the workers counted in the PC but not in the IChad half the productivity of those who were both in the PC and in the IC. Finally,in their estimates of labour productivity, Broadberry, Giordano and Zollino (2011)in some sense sidestep the issue, by using PC data as an upper-bound estimate oflabour in Italy and the IC as a lower-bound in the period 1861-1951, with the “true”value falling within this interval.80
In this paper we mainly rely on PC figures due to consistency issues: the VA estimatesat constant prices used in this paper are constructed assuming that the workingpopulation was the one counted in the PCs rather than in the ICs. Sources andmethodology are explained in detail in the above-mentioned Appendix A; here weonly provide the general gist of our choices and elaborations. Our benchmark years,subject to data availability as well as to the purposes of our analysis, are: 1911,1921, 1927, 1938 and 1951. The starting and ending years (1911 and 1951) coincidewith the two years in which both population and industrial censuses were taken. Forboth years we use PC data as revised by Vitali (1970), with minor exceptions fora couple of branches in 1911. In order to isolate the World War One years fromthe rest of the period, the 1921 PC turns out to be crucial. Although the lattercensus is not the most reliable,81 it has been used in other studies (e.g. Zamagni1987) and was deemed too precious for our analysis to be discarded. Next, so as tohighlight the switch in Fascist industrial policy stance as well as the Great Depressionyears and Italy’s subsequent recovery, the two benchmark years supplied by IC data,respectively 1927 and 1938, are ideal. Yet switching to IC data for these two yearswould jeopardize our estimates. In order to construct a hypothetical PC figurefor 1927 we follow a procedure which is roughly analogous to the one employed byFenoaltea and Bardini (2000a) for 1938,82 that is we retropolate the PC figure revisedby Vitali (1970) for 1931 to 1927 using a range of branch-specific production series,taken from Carreras and Felice (2010). Finally, for 1938, we again adopt Fenoalteaand Bardini’s (2000a) estimation procedure pushing forward the 1936 PC figures to1938. For those branches in which yearly production indices were not available, weemployed data on employment coming from a range of other sources, including the
80Recall, however, that Broadberry, Giordano and Zollino (2011) examine productivity trendsin the overall Italian economy from 1861 through 2011. PC data are therefore necessary to coverthe first fifty years of Italian development, as well as to gain information on the agricultural andservices sectors which are not covered by the ICs. Refer to Giordano and Zollino (2012) for moredetails concerning historical labour data sources and connected issues.
81The 1921 PC suffered from a range of irregularities, which were particularly acute in theSouthern regions and which led to an overestimation of the population. The data we employ areanyhow those from Vitali (1970), who made a number of correction to solve this problem. Fordetails, see Vitali (1970, pp. 272-284).
82See in particular Fenoaltea and Bardini (2000a, pp. 181-184).
33

Bollettino di Notizie Economiche from Assonime83 and Banca d’Italia (1938).
Finally, before presenting our labour productivity estimates, a brief description of theindustial sectors analysed may be of use. Compared to Bardini (1998), we expand ourviewpoint by considering not only manufacturing, but also mining and utilities sincethey too present interesting productivity growth patterns in the period under study.84
Manufacturing is then further disaggregated as in Fenoaltea and Bardini (2000a, p.116) at a two-digit level. Furthermore, a special effort was made to disaggregate thetextile industry (woollen and worsted; cotton weaving and spinning; other textiles;silk and artificial textiles), in that whereas the former branches belong to Italy’s“old industries”, artificial textiles are new.85 It was unfortunately not possible todisaggregate the mechanical engineering industry, which similarly includes new andold branches. Estimates of value added for this branch are based on the apparentconsumption of raw material and this type of data cannot be separated among itsdifferent products.86 The industrial sectors thus identified and listed in Table 2 werethen grouped into new and old industries.87
83This source includes the results of the statistical survey run by Confindustria, in agreementwith ISTAT and the Ispettorato dell’Industria e del Lavoro.
84As stated in footnote 76, we choose to exclude construction because of their strongly cyclicalnature. “Other industries” are also dropped from the sample as what is included in this residualcategory changes over time.
85Unfortunately, it is not possible to separate silk from artificial textiles, owing to the fact thatthey are combined in the 1937-1939 IC. This is problematic (but unavoidable given our data sources)since silk was a traditional, labour-intensive and competitive industry, tied to agriculture andexport-oriented (Federico and Ishii 2001). Federico and Wolf (2011, p. 8), by arguing that mostof silk’s value consisted in cocoons, a purely agricultural raw material, and since the processing ofcocoons settled close to the production areas, actually push the argument even further, and classifysilk as an agricultural product until 1939. Conversely artificial textiles were a much more recentand modern industry. Given the impossibility of separating silk from artificial textiles, we havedecided to assign them both to the new industries since, in the period under study (1911-1951),the latter passed from virtually no production to an estimated value added of 13,664 million lire in1951 (Fenoaltea and Bardini 2000b, p. 230). The sensitivity of our overall results to the inclusionor exclusion of the silk/artificial fibres sectors in new industries is, anyhow, minimal.
86On the problems associated with disaggregating the mechanical engineering sector, also seeTattara and Toniolo (1976, pp. 145-146).
87This classification mirrors the one reported in Richardson (1967) and may also be found in vonTunzelmann (1982, p. 30) and Broadberry and Crafts (1992). Federico (2003, p. 44) has criticisedthe use of a new/old classification on the grounds that it may change over time. However, thedistinction between heavy and light industries which he favours is also not entirely aloof from thiscriticism. Anyhow, we do not expect a heavy/light classification to yield substantially differentresults. Tattara and Toniolo (1976, p. 148) in fact apply it for the period 1927-1937 and whatthey include in their categories roughly matches our choices. Finally, we prefer to classify branchesaccording to the old/new divide also to be free to employ a new/old dummy alongside the differentdegree of capital intensity in our econometric model presented in Section 4.2.
34

Table 2: Taxonomy of the different sectors of Italian industry
Old New
Mining XFood XTobacco XSilk and artificial textiles XCotton XWool XOther textiles XClothing and leather XTimber and furniture XPaper XPrinting XPhotography and cinema XMetalmaking XEngineering XNon metallic minerals XChemicals XRubber XUtilities X
Source: see text and Appendix A.
35

Figure 4: Employment shares in Italian industry, 1911-1951
0%
10%
20%
30%
40%
50%
60%
70%
80%
1911 1921 1927 1938 1951
Share of workers in indu
stry
New Industries Old industries
Sources: see Appendix A.
3.2 Output per worker: results
Figure 4 presents employment shares in our chosen benchmark years, divided into‘new’ and ‘old’ industries. We see new industries monotonically increasing from 26%in 1911 to 42% in 1951. Conversely, the share of old industries drops from 74% to58%. As for the different periods, the era between 1911 and 1927 was the one inwhich Italian industry modernised fastest: more than half of the shift of employmentfrom old industries to new industries occurred in this particular period.
Figure 5 computes average annual labour productivity growth rates in Italian in-dustry, in four key sub-periods. Between 1911 and 1927 (figures here not shown),yearly labour productivity growth (1.4%) was just below the average for the overallperiod (1.7%). Yet the former average growth rate is biased by the potentially dis-tortive effect of World War One on Italy’s productivity performance. This “WorldWar One critique,” that one can advance relative to the aforementioned study byBardini (1998), loses significance if we introduce our 1921 benchmark year, as wedo in Figure 5. The latter shows that the performance in 1911-1927 was extremelyheterogeneous. Productivity growth during World War One halted, with rates closeto zero being experienced. Conversely, the 1920s were years of booming productivity
36

Figure 5: Labour productivity growth in Italian industry, 1911-1951 (in%, per annum)
‐3%
‐2%
‐1%
0%
1%
2%
3%
4%
5%
1911‐1921 1921‐1927 1927‐1938 1938‐1951 1911‐1951
VA per worker average an
nual growth ra
tes
Old Industries New Industries Total Industry
Sources: see text and Appendix A.
37

in all sectors: growth rates rose to 3.6% in the overall industrial sector. These werethe years of fastest growth in the overall 1911–1951 period. When compared to the“roaring Twenties,” the performance of the 1930s appears very feeble, with labourproductivity growth averaging around 0.9% per year and hence dropping to a quar-ter of previous growth rates. In the 1940s output per worker growth rates picked upagain, but averaged 2.2% per year.88
We then analyse differential growth rates in the old and new sectors. Over the wholeperiod 1911-1951 the two categories’ labour productivity tended to grow at similarannual rates.89 This is consistent with the hypothesis by Tattara and Toniolo, byus referred to in Section 1, that the differences in levels present at the time betweennew and old industries may not have translated into large productivity growth dif-ferentials (Tattara and Toniolo 1976, p. 150). However, breaking down the period,striking differences appear. In the decade 1911-1921 new industries were a strongdrag on overall productivity growth. This result may appear surprising in light ofour earlier discussion on the decision by the government to direct its industrial policytowards the promotion of new industries. Yet, it reflects the fact that the increase in
88The period 1938–1951 is extremely heterogeneous, as it encompasses both World War Twoand the early post-World War Two phase. It is therefore hard to pin-point what explains the2.2% per year growth rate which we observe in our data. Generally speaking, changes in labourproductivity growth can be driven both by changes in the capital stock and by an increase in totalfactor productivity. We concentrate on the former and on how World War Two might have affectedItaly’s capital stock. Firstly, we note that between 1938 and 1939, in the run-up to World WarTwo, total fixed investments increased significantly (14.5% relative to 0.4% the previous year; Baffigi2011), reaching a local maximum which would be exceeded only in 1946 during Italy’s reconstructionphase. Secondly, if the capital stock of a country is destroyed by a war, this destruction can lead to afall in output. Were the labour input to remain constant, the destruction of the capital stock couldlead to a fall in productivity growth. The increase in capital stock, output and labour productivityoccurring in the reconstruction phase will compensate for the initial fall and may not result infast labour productivity growth such as the one we observe in our data. However, Italy did notsuffer from large destruction of the capital stock during World War Two. An excellent survey anddiscussion on the matter is provided in Zamagni (1997, pp. 35–39). Furthermore, new estimatesreconstructed in Giordano and Zollino (2012) indicate an erosion of total capital stock at 2010constant prices from approximately 380,354 to 371,364 million euros which would confirm that itsuffered relatively little during the war, at least from an aggregate economy perspective, hence notslowing labour productivity growth down significantly via this channel. Thirdly, another aspect tobe considered is what occurred to the labour-force. Unfortunately data on employment are veryfew for this period, but between 1945 and 1951 there is quantitative evidence of total industriallabour (both headcount and full-time equivalent) being almost stationary (Giordano and Zollino2012), given the high number of workers fired by large firms specialised in war production, whohowever often became small self-employed entrepreneurs (Zamagni 1997, p. 22). Relative to anincreasing output, this stationarity of the labour-force also could have contributed to an increasein labour productivity.
89The growth rate of total industry is higher than that of both old and new industries’ rates. Thisis due to shift effects – which we will analyse more in detail further on – with the transfer of labourresources from the former to the latter as an additional, and independent, source of productivitygrowth.
38

resources devoted to these sectors did not necessarily translate into a proportionalincrease in output. The main problem faced by the Italian economy was the hastewith which it had to accelerate production in these sectors. As remarked by thecontemporary liberal economist Attilio Cabiati, ‘the speed at which new huge plantswere created, existing ones were expanded, blast furnaces were built [. . . ] workerswere turned into technicians, companies were concentrated and cartelised both hor-izontally and vertically was a liability for the economy and for firms’ organisation’(Cabiati 1920, p. 10).90 These limits, which were not foreign to larger groups,91
affected severely small firms which had expanded rapidly as a result of the war. Onesuch example is that of the aircraft manufacturer Caproni, which, in spite of a fastrising number of employees, was incapable of meeting the promised output targets.This was largely because of its lack of a ‘real industrial management of its workforce,’which was noticed in a range of inspections by army officers and which Caraccioloagain attributes to its ‘hasty growth and to its desire to speculate’ from the wareffort (Caracciolo 1978b, p. 238).
Despite the problems associated with rapid industrialisation, the war did contributeto the transformation in the structure of production. The contemporary statisticianCorrado Gini (1921) emphasised the importance of learning-by-doing approaches,while the commentator Riccardo Bachi (1920) emphasized the relevance of the Taylorsystem of production which was slowly adopted throughout the war. Such factors canhelp to explain why, after the war, the new industries experienced a real productivityboom. As shown in Figure 5, throughout the 1920s, their growth rates were wellabove those of the old industries, peaking at 4.3%. The pace of this growth was,however, halted in the 1930s, when new industries held the fort, but registered halvedannual growth rates relative to the preceding decade. In the last sub-period the oldindustries bounced back to their 1920s average annual growth rates, outperformingthe stable new industries.92
Overall productivity growth rates can also be additively decomposed, via a shift-share analysis, as the sum of internal productivity growth rates and the effect ofstructural change, i.e. shifts of resources from low-level productivity sectors to high-level productivity sectors. In particular, we are interested in searching for evidenceof the effect of a disengagement of labour from the old industries in favour of the
90Also see the remarks by another contemporary commentator, the engineer Giuseppe Belluzzo,who also commented on the amount of disorganisation and incompetence present in Italian industryover the period (see Caracciolo 1978b, p. 244).
91To only give one example, the quality of the weapons built by the Ansaldo group was severelyquestioned by the Italian army towards the end of the war. See Caracciolo (1978b, p. 234).
92The finding that old industries did better than new ones across World War Two mirrors theresults found by Vonyo (2011) for the German case. Vonyoo attributes it to the fact that theincrease in resources devoted to the new sectors did not necessarily translate into a proportionalincrease in output. Workers relocated to these sectors during the war effort were not as productiveas those who had been working there in peacetime.
39

new ones.93 The basic approach is derived from Nordhaus (1972), which allows us tobreak down the overall productivity growth of Italian industry into its two structuralcomponents:
XT
XT
=∑
i∈N,O
Xi
Xi
× V Ai
V AT
+∑
i∈N,O
V Ai
V A0
×( Li
L i− LT
LT
)(1)
Where: Xi is labour productivity growth in sector i, V Ai is the value added in sectori, Li is employment in sector i and i can take two values (O, if the sectors are old,N if the sectors are new).94 The first term on the right hand side of equation 1is the “direct productivity effect” (Stiroh 2002), or “intensity effect” (Salter 1966),or “within effect” (Antonelli and Barbiellini Amidei 2007). It is a weighted averageof the productivity growth rates in component sectors, where the weights are baseyear nominal value-added shares of each sector and it indirectly reflects technicalimprovement within industries. The second term is the “shift effect” (Salter 1966)or “reallocation effect” (Stiroh 2002), which captures the effect of shifts in resourceallocations within the industrial sector on aggregate productivity.
We apply this decomposition to the overall growth rates and present it in Figure 6.95
This figure shows how structural change, with old industries releasing labour to theadvantage of new industries, was, in relative terms, dominant in the period 1911-1921, when productivity gains from switching to the new industries were high andsufficient to offset negative internal productivity growth. This finding is consistentwith the account of World War One given by Caracciolo (1978b), who emphasisedthe role of structural change in the war economy.96 The contribution of structuralchange to growth was instead quite small in the other decades, accounting on averagefor only 12% of overall growth in the remaining sub-periods.97 Sectoral productivitygrowth was hence the main driver of overall industrial productivity growth in Italyin the period 1911-1951.98
93Broadberry, Giordano and Zollino (2011) measure the effects of structural change from 1861through 2011 between agriculture, industry and services, which we here do not touch upon. Theindustrial and services sectors are in turn however aggregations of sub-sectors whose internal struc-ture also changed over time; hence the importance of our exercise here, although limited to industryand to the 1911-1951 period.
94The “hat” symbol denotes time derivatives.95Following Stiroh (2002), the value-added shares are computed as average two-period sectoral
value added shares.96‘The exceptional importance of the war in moving resources towards the more modern and
dynamic sectors appears now to be well-established’ (Caracciolo 1978b, p. 246).97This result is hardly surprising, since in periods of fast growth structural change generally
weighs less; viceversa in periods of slow growth. In the remaining three sub-periods, reallocation oflabour was most important in the 1921-1927 years, when it accelerated labour productivity growthby 0.5 percentage points, contributing to 13% of aggregate growth.
98This result mirrors the one found by Broadberry and Crafts (1990a) for the United Kingdom
40
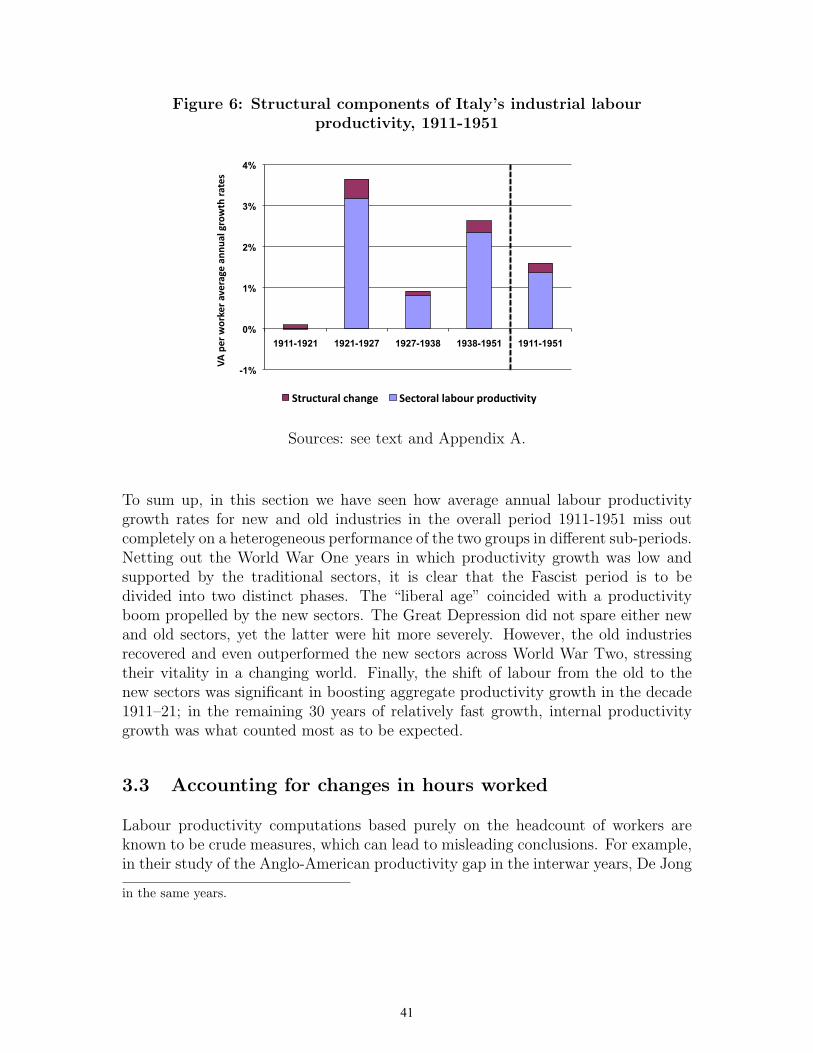
Figure 6: Structural components of Italy’s industrial labourproductivity, 1911-1951
-1%
0%
1%
2%
3%
4%
1911-1921 1921-1927 1927-1938 1938-1951 1911-1951
VA per worker average an
nual growth ra
tes
Structural change Sectoral labour produc7vity
Sources: see text and Appendix A.
To sum up, in this section we have seen how average annual labour productivitygrowth rates for new and old industries in the overall period 1911-1951 miss outcompletely on a heterogeneous performance of the two groups in different sub-periods.Netting out the World War One years in which productivity growth was low andsupported by the traditional sectors, it is clear that the Fascist period is to bedivided into two distinct phases. The “liberal age” coincided with a productivityboom propelled by the new sectors. The Great Depression did not spare either newand old sectors, yet the latter were hit more severely. However, the old industriesrecovered and even outperformed the new sectors across World War Two, stressingtheir vitality in a changing world. Finally, the shift of labour from the old to thenew sectors was significant in boosting aggregate productivity growth in the decade1911–21; in the remaining 30 years of relatively fast growth, internal productivitygrowth was what counted most as to be expected.
3.3 Accounting for changes in hours worked
Labour productivity computations based purely on the headcount of workers areknown to be crude measures, which can lead to misleading conclusions. For example,in their study of the Anglo-American productivity gap in the interwar years, De Jong
in the same years.
41

and Woltjer (2011) have shown how Broadberry’s (1997) finding that the productivitygap in manufacturing between the two countries was stable throughout the 1930s nolonger holds when changes in the number of hours worked are correctly accountedfor. As the average number of hours worked declined more rapidly in the UnitedStates than in Britain, relative output per hour worked rose faster in US than inBritish manufacturing.99
Not accounting for changes in the number of hours worked can also be deceptive in theItalian case. As it is well documented in Toniolo and Piva (1988), the Italian officialtrade unions made work-sharing one of the pillars of their action in the 1930s. Asshown by Tattara and Toniolo (1976), the average working day in manufacturing fellfrom 7 hours and 17 minutes in 1929, to 6 hours and 43 minutes in 1932. The 11thOctober 1934 agreement signed by the trade union and Confindustria introducedthe forty hours working week. It was then established by law on 26th October1937.100 Changes in the number of hours worked did not however only affect the1930s. Zamagni (1976) shows in fact how the average working day fell by as muchas 20% between 1911 and 1919. Some important changes also occurred across WorldWar Two. Federico (2003) argues that the average number of hours worked byfactory workers rose by as much as 25% between 1937 and 1951, with light industriesexperiencing an increase in the region of 30%.
In order to account for these differences, we have put together a new dataset on theyearly number of hours worked in the four benchmark years of 1911, 1927, 1938 and1951. In our attempt, we had to overcome significant problems of data availability.Data on hours worked are in fact presented only in the 1937-1939 and 1951 ICs andthey refer exclusively to blue collar workers. For 1927 we use data from Assonime,a publication including data on the number of employees and hours worked for asample of large firms. For 1911, no data are available, so we rely on the work byZamagni (1976, p. 378), who has estimated that daily hours worked per workerfell from 10 to 7.7 between 1911 and 1927.101 Table 3 shows changes in the hoursworked per worker in the sectors considered in our work. We find a descending trendbetween 1911 and 1938, which is followed by an increase in the number of hoursworked between 1938 and 1951.102
99See also Scott and Spadavecchia 2011 on the relations between hours worked and labour pro-ductivity.
100For an analysis of the effects of the 1934 agreement on unemployment, see Mattesini andQuintieri (2006).
101We refer to Appendix A for details.102This increase is less pronounced than what was found by Federico (2003), particularly for what
concerns old industries. The difference has to do with a different handling of data from the 1937-1939 IC. Federico seems to have divided the total number of hours worked, which only refers toindustrial workshops, by the number of manual workers in both artisan and industrial workshops.This leads him to underestimate the number of hours worked by an amount which is particularlysignificant for those trades in which the number of craftsmen was large.
42

Figure 7: Hourly labour productivity growth in Italian industry,1911-1951 (in %, per annum)
‐3%
‐2%
‐1%
0%
1%
2%
3%
4%
5%
1911‐1927 1927‐1938 1938‐1951 1911‐1951
VA per hou
r worked average an
nual growth
rate
Old industries New industries Total industry
Sources: see text and Appendix A.
43

Table 3: Yearly hours worked by industrial workmen, 1911-1951
1911 1927 1938 1951
Mining 2,646 2,037 1,877 1,816Food 2,360 1,817 1,458 2,143Tobacco 2,995 2,306 2,042 2,193Textiles 2,576 1,984 1,762 1,855Silk 2,391 1,841 1,555 1,808Cotton 2,723 2,097 1,903 1,886Wool 2,902 2,235 1,867 1,930Other textiles 2,289 1,762 1,723 1,797Clothing and leather 2,182 1,877 1,652 2,088Timber and furniture 2,478 1,908 1,757 1,818Paper 2,931 2,256 1,956 2,236Printing 2,899 2,232 1,935 2,310Photography and cinema 3,704 2,852 2,473 1,887Metalmaking 3,241 2,496 2,083 2,143Engineering 2,798 2,180 1,819 2,099Non metallic minerals 2,243 1,727 1,591 1,967Chemicals 3,348 2,578 2,222 2,082Rubber 2,671 2,057 1,773 2,036Utilities 2,343 1,804 1,991 2,411
Old Industries 2,535 1,974 1,763 1,960New Industries 2,925 2,255 1,979 2,112Total 2,730 2,115 1,871 2,036
Sources: see text and Appendix A.
Figure 7 provides average annual sectoral VA per hour worked growth rates for theoverall period and for three sub-periods. The average industry labour productivitymeasure from 1911 through to 1951 rises to 2.1% relative to 1.7% derived from theheadcount measure. Unfortunately, due to data availability, it is not possible toseparate the 1910s from the 1920s as we previously did, so we miss out completelyon any 1920s productivity boom103. However, the annual labour productivity growth
103In order to calculate the total number of hours worked in a given year we need both an ICand a PC. In fact, we assume that only the workers counted in the IC worked “full time;” 50% ofthe ‘full-time’ number of hours worked is instead assigned to those workers, counted in the PC butnot in the IC. This assumption is necessary due to the fact that, as discussed in Section 3.2, PCsinclude seasonal and part-time workers. For 1921 and for the nearby years we are lacking an IC.Hence we unfortunately cannot build a feasible estimate of total hours worked for this year. Formore details, we refer to Appendix A.
44

rate between 1911 and 1927 in the overall industrial sector is 2.8%, and the highestmeasured in the forty years considered.104 Overall labour productivity growth rateswere just below 2% in the 1927-1938 period, which means that industrial hourlylabour productivity grew twice as fast as labour productivity per worker during the1930s. The drop relative to the previous period is still, however, significant andeven more so given that it is impossible to separate the fast-growing 1920s from theslow-growing 1911-1921 period. As for the 1940s, it is now clear that much of thepositive result one could find when looking at output-per-worker figures was dueto an increase in the number of hours worked. From 1938 to 1951, hourly labourproductivity growth dropped to 1.3% in the overall industrial sector, which is halfthan the output-per-worker growth rate of 2.6%.
We again present figures on average annual labour productivity growth rates fornew and old industries respectively. When considering hourly labour productivity,differences between old and new industries increase somewhat: in the forty yearsconsidered, new industries annually grew 0.5% faster in productivity terms than oldindustries. Whereas new industries’ growth increases during the Great Depressionrelative to the previous 1911-1927 period (reaching 3.3% per year), old industries’growth slows quite substantially (down to 0.5%). As for the case of output perworker, the period across World War Two saw the old industries doing better thanthe new ones, although less markedly.
Finally, we perform a shift-share exercise on hourly labour productivity data in thesame manner as Section 3.2. Figure 8 confirms ever more strongly our previousclaim that structural change was almost never significant in explaining industrialproductivity growth. The biggest contribution was achieved in the 1940s, when itaccounted for almost 15.4% of productivity growth, whereas on average in the formertwo sub-periods it only accounted for around 4.5%.
To conclude, does accounting for hours worked add to our knowledge of labour pro-ductivity growth under Fascism and during the two World Wars? Unfortunately datalimitations are severe up to the point that output per worker remains our preferredlabour productivity measure, used in the econometric analysis of our next Section.Yet, when comparing the two sets of estimates, a few remarks can be made. Althoughaccounting for hours worked improves the overall performance of the 1930s, the factthat hourly productivity growth in the 1927-1938 period was roughly similar to theaverage 1911-1927 would confirm the finding that there was a slowdown between the1920s and the 1930s. Since the hourly productivity performance in Italian industryacross the Great War is in fact likely to have been worse than the one of the 1920s,the average over the 1911-1927 period is likely to hide productivity figures for the1920s which were better than those registered for the 1930s. As for the different
104In headcount terms, labour productivity growth increased annually by 1.5% on average in theperiod 1911–1927, with new industries growing at 0.2% and old industries at 1.8%.
45

Figure 8: Structural components of Italy’s industrial hourly labourproductivity, 1911-1951
0%
1%
2%
3%
1911-1927 1927-1938 1938-1951 1911-1951
Value ad
ded pe
r ho
ur worked average an
nual
grow
th ra
tes
Years Structural change Sectoral labour produc6vity
Sources: see text and Appendix A.
46

performance of the new and old industries, their labour productivity growth rates,however measured, were roughly similar in the period 1911-1951. Old industriesdominated in productivity terms in the period 1911-1927 (but presumably only inthe 1911-1921 period, as the output per worker data show) and during the 1940s.New industries ruled the roost in the 1930s, yet it is unclear the extent to which theydeteriorated their hourly productivity performance relative to the 1920s. Finally,internal productivity growth is confirmed to be the main determinant of aggregateproductivity growth. The general patterns outlined in Section 3.2 are thus confirmedeven when correcting our measures by the number of hours worked.
4 Labour productivity growth and competition pol-
icy
Section 2 has shown that industrial policy differed significantly between the two erasof Fascism, moving from a pro- to a significantly anti-competitive stance. Section3 has put forward evidence that the era of liberal Fascism was characterised byfaster rates of growth of labour productivity than the second period and that bothnew and old industries enjoyed slower rates of productivity growth following theregime shift. The current Section aims to explore whether changes in competitioncan explain changes in productivity growth, or whether the asymmetric performanceof the different sectors of the Italian economy can be explained in terms of otherfactors.
In Section 4.1, we highlight the fact that there is no consensus over whether compe-tition helped or hindered productivity growth in the Fascist era. As the theoreticalliterature on the matter is also inconclusive and since there is no existing economet-ric study on the period, economic historians of Italy who have tried to answer thisquestion largely had to compare a wide range of qualitative evidence, with resultswhich are often contradictory. In Section 4.2, we perform the first empirical studyon this matter, building an econometric model which is similar to the one presentedin Broadberry and Crafts (1992). The main result is that, although the growth ofcapital intensity explains changes in productivity, there is a strong and significantnegative relationship between our indicator of competition and productivity growth.This evidence confirms that the competition policy pursued after 1926-1927 wasrelated to a poor performance of Italian industry.
4.1 The existing evidence
That economic historians of Fascist Italy disagree over whether the measures limitingcompetition had a positive or negative effect on productivity growth should not come
47

as a surprise. In fact, the economic literature has identified at least three theoreticalchannels through which competition and productivity growth are related, yet has notbeen able to unambiguously predict the sign of this relationship.105 The first channelshows that competition has an effect on static efficiency, also defined as productiveefficiency: a change in competition could affect the level of effort put in by workersand managers to improve the performance of a given firm. A fall in competition canin fact lead to an increase in slack by both workers and managers, as it reduces thenumber of opportunities for comparing performance across firms.106 Furthermore,Schmidt (1997), has argued that a reduction in competition reduces the threat ofbankruptcy, lowering managers’ incentives to avoid this scenario. These two claimsshowing that more competition increases productivity growth are countered by athird one which shows that greater competition will actually lead to less effort. Thisis because an increase in the number of firms in the market may lead to a reductionin demand, which may in turn reduce the level of effort by workers and managersrequired by the owner of a given firm (see Willig 1987; Hermalin 1992; Martin 1993;Horn, Lang and Lungren 1994).
Competition may also affect productivity growth through two other, dynamic, chan-nels, which have to do, respectively, with R&D and with market entry. As for R&D,it has been argued that innovation may be reduced in the presence of lower productmarket competition as firms will benefit less from possible innovations and thereforewill prefer enjoying a “quiet life,” in which incentives to innovate are low (Nickell1996, p.728). Seen from an opposite perspective, a firm’s gains from innovation atthe margin are larger in a more competitive industry. As Arrow (1962) pointed out,assuming perfect appropriability of profits deriving from innovative activity (via theconcession of patents, for instance), an incumbent monopolist’s returns to innovationare only the increment beyond the monopoly rents that it was earning beforehand(“replacement effect”). In contrast, a competitive firm would not be displacing anymonopoly profit and would gain the full return from innovation: hence its greater in-centive to invest in R&D. Yet, other studies lead to different conclusions. Schumpeter(1943) has claimed that an oligopolistic market structure makes rival behaviour morestable and predictable, thus increasing the incentive to invest. Also, the presence ofex ante market power may actually induce firms to innovate to capture the ex postmonopoly rents.107 Furthermore, a reduction in competition may lead to more inno-
105This section only offers a brief summary of the links between market structure and productivitygrowth. Refer to Cohen (2010) for a comprehensive recap of the literature on the topic.
106For the case of workers, see, in particular, Nickell, Vainiomaki and Wadhwani (1994). For thecase of managers, see Holmstrom (1982) and Hart (1983).
107Aghion, Bloom, Blundell, Griffith and Howitt (2005) find evidence of an inverted-U relation-ship between industry-level market power, measured by an averaged Lerner index, and industryinnovation, measured by the average number of citation-weighted patents. They argue that morecompetition fosters innovation and growth when an incumbent firm’s pre-innovation rents are re-duced by more than its post-innovation rents. Competition, hence, increases the incremental profitsof innovating; R&D investments take place in order to ‘escape competition.’ This occurs in sec-
48

vation if credit constraints and other failures in financial markets make investmentsin R&D solely dependent on internal sources of funding (Blundell, Griffith and VanReneen 1999). The profits derived from market power (“deep pockets”) would infact provide firms with the cash flow necessary to invest in innovative activity.
As for the role of entrants, Jovanovic (1982) has argued that competition fosters effi-ciency by letting “many flowers bloom” and ensuring that only the best ones survive.Similarly, Hopenhayn (1992, p. 1142) points to higher costs of entry entailing lessselection in an industry, lower average productivity and a higher expected lifetimeof firms, including the less efficient ones. Conversely, Salop (1977) and Dixit andStiglitz (1977) argue that more intense product market competition cuts post-entryrents, hence reducing the equilibrium number of entrants, in turn discouraging in-novative activity; Gilbert and Newbery (1982) claim that an incumbent monopolisthas an incentive to pre-empt entry by investing more aggressively in innovation thanan innovating entrant.
These three channels have been widely referred to by those who have tried to gaugethe impact of competition policy on industrial productivity growth in the Fascist era.In particular, the “optimist” field, which naturally included the regime and Confind-ustria, as well as a range of economic historians, underlined the role cartels had inpromoting technical progress. An anonymous document found in the Confindustriaarchives and cited in Giordano, Piga and Trovato (2012, p. 13) lists among theadvantages of introducing consorzi in the Italian economy the fact that the higherprices cartels guarantee to the producers allow firms to have greater revenues andto be able to invest in new technologies. This was also the opinion of Vito (1932,p. 173), who argued that cartels can favour productivity improvements, as they canpromote new technical and scientific experiments and favour the diffusion of bestpractices.108
A similar advantage was attributed to large groups by Petri (1997; 2002), who haslooked at the Schumpeterian process of innovation occurring, in particular, in thechemical and metal-making industries, and in the industries for the production ofelectricity and of oil and coal derivatives (Petri 1997, p. 245). To Petri, the inno-vative activity pursued by large Italian firms was essentially of two types. Firstly,there was some in-house R&D activity, whose results occasionally came with some
tors in which all incumbent firms have similar technologies and are “neck-and-neck.” Conversely,if there is a leader and a laggard, greater intensity of competition dampens a laggard’s incentiveto innovate, as it has little to gain from innovation, given that post-innovation rents remain lowdue to the competition with the leader. In this scenario, the Schumpeterian effect dominates theescape-competition effect.
108Vito continues by listing a number of productivity improvements favoured by cartelisation inGermany. However, when he later describes the advantages brought to the Italian economy by theexistence of cartels, interestingly his list does not include any specific technical advance. See Vito(1932, pp. 174-177).
49

delay. This was the case of the discovery of polypropylene by the future Nobel prizewinner, Giulio Natta. Although this discovery only occurred in 1954, Petri arguesthat Natta greatly benefitted from his work at the Societa anonima italiana gommasintetica (SAIGS), which had been created in 1939 by the rubber-making firm, Pirelliand then purchased by the chemical giant, Montecatini. Further to pursuing origi-nal innovative activity, large groups could facilitate the transfer of know-how fromforeign firms into Italy.109 This was the case of the cooperation between Monteca-tini and the German cartel IG Farbenindustrie, facilitating the transfer of know-howfor the production of a range of organic chemicals, or the agreements between thesame IG and Pirelli over the production of synthetic rubber. Another example wasthe transfer into Italy of the hydrogenation and the catalytic refinement processes,invented by IG Farbenindustrie and Standard Oil. These were transferred to Italyin 1936 thanks to an agreement between these companies and ANIC, a joint ven-ture involving Montecatini and the recently established oil firm, AGIP. The largesum paid by ANIC (US$ 2.5 million, around 10% of its capital) for the licenses sup-ports the argument that super-normal profits could be an important pre-conditionfor innovative activity.
While the “optimists” have mainly referred to R&D as the channel through whichthe reduction in competition occurring in Fascist Italy helped to increase produc-tivity, evidence can be found to show that the anti-competitive measures taken bythe regime hindered productivity growth through all three channels referred to inthe theoretical literature. Firstly, there are signs that cartelisation limited the in-dustrialists’ incentives to increase efficiency. This was a problem which had beenrecognised by contemporaries. In January 1933, the Rivista di Politica Economicapublished an essay by the engineer Tullio Ortu Carboni. In a rare example of offi-cial dissent to the mainstream views, Ortu Carboni underlined how ‘an excessivelyfavourable sale price could induce firms to neglect industrial rationalisation, as theindividual firm will not be worried about producing at low costs’ (Ortu Carboni1933, p. 165). This also meant limiting the positive effect the Great Depressioncould have in pushing the least efficient producers out of the market. In Sarti’s lateropinion, ‘voluntary cartels seldom led to significant improvements in the methods ofproduction,’ as ‘they usually took the form of price agreements whereby prices werepegged at a sufficiently high level to assure the survival of even the least efficientproducers’ (Sarti 1971, p. 100).110
109For a peripheral, backward country, such as Italy was at the time, the process of knowledgetransfer is undoubtedly an important path to productivity growth. Antonelli and Barbiellini Amidei(2007) dedicate many pages of their analysis of technological innovation in Italy in the period 1950s-1990s to the relevance of the process of “creative adoption” of foreign innovation which demandssocial capabilities and a certain degree of “technological congruence” between the follower and leadercountries, in terms of market size, demand characteristics, factor endowments and availability ofnatural resources.
110Unfortunately, Sarti does not offer any evidence for this claim. It should also be noticed that
50

Secondly, it can be argued that innovation was hindered by a limitation of compe-tition. Contemporaries had worried about this particular aspect, too. In a speechgiven in Parliament during the vote on the law for the establishment of the con-sorzi obbligatori, the MP Francesco Paoloni warned against the risk that cartels may‘oblige those who have the best equipment not to use it and therefore hinder the im-provement of the production process’. Such choices – Paoloni warned – ‘may causedamages to the whole nation [. . . ] as resting on a lazy and comfortable position whichis, however, technically backward, may one day lead Italy to a condition of suffocat-ing inferiority vis-a-vis the technical development of foreign competitors’ (Ministerodelle Corporazioni 1932, p. 680). His worries were, in fact, well founded.111 De-spite what is claimed by Petri, in fact, several points can be raised to challenge theevidence he presents. Firstly, his examples refer to far too few branches that it is im-possible to generalise from their experience.112 Furthermore, even in these branches,innovation was limited. Barbiellini Amidei, Cantwell and Spadavecchia (2011, pp.11-12), confirm that systematic research and the establishment of laboratories evenin the “innovative” chemical industry was of a limited scale in Italy in the interwaryears, the only exception being the short period between the introduction of autarky(1935) and the onset of the Second World War, which witnessed the establishment oflaboratories and research offices, since ‘developing new technologies was considered amatter of national interest’. However, even in this period, the scale of research activ-ity was far less significant than in contemporary Germany, United States and Japan.Evidence from Giannetti (1998) shows that the national share of chemical patentsdeposited in Italy in the late 1930s increased ‘only by a few dozen’ in absolute terms,and hence ‘cannot be interpreted as a watershed towards a greater innovational po-tential’ (Giannetti 1998, p. 109).113 Furthermore, there is little evidence that the
this was also the reason why banks were generally in favour of the creation of cartels: by preventingfirms from going bankrupt, they would also increase the probability of banks’ credits being paidback (Cianci 1977). Efficiency arguments simply did not have a place in this mindset.
111As underlined by Caracciolo (1978a, p. 188), during the 1930s Italian industry became ‘sclerotic’and, even when it expanded after the crisis, it did so ‘strengthening acquired positions and withthe minimum amount of risk or innovation.’ This is also the view expressed by Cianci (1977, p.210) who argues that increased concentration and cartelisation led to ‘a drop in those creativeincentives that are in every epoch crucial for industrial progress’. In this economic and politicalclimate contacts and relations between firms ‘did not end in higher productivity, technical progress,research of new raw materials and sales markets, but in the search for perks in confederations andministries, in the Fascist party, in the government’ (Cianci 1977, p. 210).
112Petri’s only examples in sectors which are not the four fore-mentioned ones, include some limitedinnovation in the wood industry and the introduction of an alternative way of producing cellulose(the processo Pomilio). This process, whose benefits were not visible until the post-war period,could diffuse thanks to the links between the large firm Burgo and a range of small-medium firms.
113More in general, Barbiellini Amidei, Cantwell and Spadavecchia (2011, p. 12), by analysingdata on Italian patents deposited in the US, concluded that ‘the Italian innovation activity mea-sured in terms of Italian patenting abroad began a decreasing trend from the second half of the1920s and remained at a relatively low level until the Second World War [...]. A weak connectionbetween science and industry was considered a major weakness of the Italian industrial system.’
51

Italian breakthroughs happening in these industries were significant by internationalstandards. With the exception of water electrolysis via the Fauser technique, theproduction of synthetic ammonia and of nitrogenous fertilizers (Giannetti 1998, p.110), few Italian innovations were adopted outside the country. As for the processof knowledge transfer, this did not always lead to positive results. The different bar-gaining power between the Italian firms and the foreign conglomerates often meantthat the processes introduced in Italy were not necessarily the best available ones.In 1939, IG Farbenindustrie and the Italian steel producing firm, Cogne, built a newplant for the extraction of magnesium in order to experiment a new, riskier, typeof process at a lower cost than it would have been incurred in Germany. Its resultswere, unsurprisingly, meagre (Petri 1997, pp. 269-271).
As a last point, one can present evidence that the anti-competitive measures taken bythe regime did, in fact, prevent “flowers from blooming,” that is impeded the entryof new competitors who could enhance sectoral productivity though their newlydeveloped processes. As explained in Section 2, laws such as the one disciplining theconstruction or the enlargement were effective at keeping entrants out of the marketand so was the decision by cartels to assign raw materials, production and marketquotas on the basis of a firm’s past share of the market.114 An excellent exampleof the hostility faced by entrant is the case of Bombrini Parodi-Delfino (BPD), achemical firm which tried to challenge the quasi-monopoly enjoyed by the chemicalgiant Montecatini. Having developed as a successful producer of explosives sincethe mid-1920s, BPD wanted to expand into other areas of the chemical industry.In particular, it was interested in entering the field of organic chemicals throughthe production of dying products, pharmaceuticals and plastic. As accounted byPetri (1997, p. 282), this attempt was not blocked by the absence of a strongtechno-scientific base at BPD, but because of the mutual exchange of favours goingon between IG and Montecatini, which in fact had formed an international cartelagreement. Although BPD managed to obtain a limited number of patents fromGermany, it was obliged to only use them to produce explosives, so as not to challengeMontecatini’s dominance in the other markets. These difficulties and the breakingout of World War Two meant that its plans to expand into other areas of the chemicalindustry were effectively thwarted. As admitted by Petri himself, in this case ‘theinstitutional rigidities of the interwar and war eras and the monopolistic positions
Furthermore, in their empirical exercise, when regressing the share of industrial Italian patentsabroad on a set of explanatory variables for the period 1920–1948, they found ‘positive and statis-tically significant coefficients on the variables that depict the share of university students studyingengineering, and the share of manufacturing industry in total Italian output. This was a phase ofincreasingly inward-looking development, in which the continued building of local technical skillsand the commitment to industrialization were what mattered for innovation’ (Barbiellini Amidei,Cantwell and Spadavecchia 2011, p. 35).
114According to Sarti, these measures acted as ‘a powerful brake on the economy’ (Sarti 1971, p.102).
52

enjoyed by its rivals’ hindered the development of BPD, even though the firm ‘hadwhat it took to expand’ (Petri 1997, pp. 282-283).
Overall, this Section has reviewed the evidence presented by the “optimist” andthe “pessimist” field with regard to the impact of Fascist anti-competitive measureson industrial productivity growth. While the case of the “optimists” largely restson the existence of a Schumpeterian process of innovation, that of the “pessimists”is based on three sets of arguments, namely that the lack of competition hinderedinnovation, that it reduced workers’ and managers’ effort and that it impeded theentry of more efficient producers. The next Section aims to adjudicate between thesetwo views.
4.2 New econometric evidence for Italy
In this Section we apply panel data techniques to look for evidence of a link betweenthe competition policy analysed in the previous Sections and labour productivitygrowth in Italy in the era of Fascism. In particular, we are interested in the roleplayed by the decisions to support new industries and to restrict competition in theproduct market. This is the first study of this kind and, despite its methodologicaland data-related limitations, provides a useful framework to appraise the impact ofthese policies on the development of Italian industry.
In order to achieve this aim we employ a model which is a modified version of the onedeveloped in Broadberry and Crafts (1992), concerning labour productivity growthin the United Kingdom in the 1930s. Relying on a cross-section of 79 industries, thetwo scholars regressed the average annual growth rate of labour productivity from1924 to 1935 on an array of independent variables: the growth rate of the capital-to-labour ratio, as measured by the ratio of horsepower per worker; the decline inemployment from peak (1929) to trough (1932) during the Great Depression, whichpresumably reduced labour’s bargaining power; a dummy variable taking value onefor highly unionised industries; a second dummy variable taking value one for newindustries; a third dummy variable taking value one for industries in which the price-cost margin fell by more than 25 per cent in the period under study.115 Their resultspoint to a positive correlation between labour productivity and capital intensitygrowth. Their new industry variable also presents a positive sign, yet it ‘is by nomeans dominant’ (Broadberry and Crafts 1992, p. 537). High union density and anincrease in competition both affected labour productivity growth significantly, theformer negatively, the latter positively. Broadberry and Crafts conclude that ‘therecessionary shock of the early 1930s improved labour productivity by weakening the
115As previously mentioned in Section 2.3.2, Broadberry and Crafts (1992) measured price-costmargins as in Cowling (1982).
53

resistance of organized labour, but the tendency for the market power of firms toincrease had an offsetting effect’ (Broadberry and Crafts 1992, p. 538).
We build upon this study and apply a modified version of this model to our dataon Italy. The first difference rests upon the nature of the datasets available: an 18sector-level disaggregation of Italian industry, compared to Broadberry and Crafts’79 sectors for the UK industry. We hence move from a cross-sectional dimensionto a panel data setting, as we also have observations through time at our disposal.Wishing to focus solely on the Fascist period, we employ average annual labourproductivity growth rates (LPRODGR) in three sub-periods 1921-1927; 1927-1938;1938-1951 as our dependent variable. Our first independent variable is the growth incapital intensity (HPWORKGR), measured as in Broadberry and Crafts (1992).116
Our second regressor (NEW) is defined as in Broadberry and Crafts (1992): it is adummy variable taking value one for new industries.117 Next, we need a measure ofcompetition. Differently to Broadberry and Crafts who use a dummy variable takingvalue one for industries in which the price-cost margin fell by more than a quarter,we prefer to use a continuous variable since it contains more accurate informationand since we find the definition of their dummy variable somewhat arbitrary.118 Asseen in Section 2.3.2, we too have estimated industry-specific price-cost margins.Yet, as previously discussed, it is not possible to compute the Cowling index forthe year 1921 due to lack of data. By using this competition measure, we would betherefore compelled to consider the overall period 1911-1927 in our empirical analysis,hence missing out on the precious possibility of isolating Italy’s Fascist liberal period.We thus revert back to the industry-specific concentration indices, as published inGiannetti and Vasta (2006), which anyhow we have seen in Section 2.3.2 to havesimilar evolutions to our Cowling index in the period under study. C4GR is henceour third explanatory variable and it expresses the average annual rate of growthin C4.119 Finally, conversely to Broadberry and Crafts’ model, we do not include
116Recall our initial choice of comparing new vs. old industries rather than capital-intensive vs.labour-intensive industries as in Federico (2003), so as to be able to exploit this variable in ourregression. Details on how these data are obtained are provided in Appendix A. As Federico(2003, p. 48) points out, horsepower per worker may underestimates capital intensity in that thecomplexity and sophistication, and hence the cost, of machinery probably grew much more thanthe power necessary to drive them. However, given the lack of sectoral capital data, and given thesimilar problem faced by Broadberry and Crafts’ regressions, we confirm the use of our proxy forcapital intensity.
117The list of new industries is the same as the one provided in Section 3.2.118Note that when Broadberry and Crafts (1992) replace their price-cost margin dummy with a
continuous variable, the latter loses in statistical significance.119Another possible competition measure considered was the number of cartels in each industry.
Yet two problems arise when handling this measure. First, it is not a truly reliable indicator of thedegree of concentration of a certain industry. As discussed in Section 2.2, there may be few butdominant cartels in an industry, or many and ineffective cartels. Secondly, archival sources do notallow us to pinpoint a reasonably correct figure of the number of cartels in each industry for thefour years considered.
54

the 1929-1932 drop in employment since our time-span covers a much longer periodthan that of the Great Depression years, nor do we include the unionized industries’dummy. As Mattesini and Quintieri (2006) and Giordano, Piga and Trovato (2012)point out workers’ conditions after the Palazzo Vidoni Agreement of 1926 were placedinto the hands of a sole Fascist trade union, acquiescent towards the regime, who didnot oppose a series of mandatory wage cuts in the following years, officially justifiedby the widespread deflation. Workers’ bargaining power was hence small for mostof the period and in all of the industries considered; thus this channel was here notinvestigated.120
As a result, our baseline specification is the following:
LPRODGRi,t = α+ β1HPWORKGRi,t + β2C4GRi,t + β3NEWi + εi,t (2)
where i indicates each of the 18 industries, t each of the three sub-periods considered,α is a constant, and ε is a random error. We report our results in Table 4 after havingrun our regression with pooled OLS.121
Column 1 is our baseline specification. Growth in capital intensity (HPWORKGR)is significant at a 1% level and presents its expected positive sign. The economicsignificance of this variable is considerable: the impact is more than three times largerthan that found by Broadberry and Crafts (1992) for the British case. C4GR is alsosignificant at a 5% level and presents a negative sign. The magnitude of the coefficienttells us that an increase in the average annual rate of growth of the C4 index by 1percentage point decreased labour productivity growth by approximately a third of apercentage point. The “new” dummy variable is not significant.122 Notwithstandingthe small number of explanatory variables introduced into our baseline model, theR2 is satisfactory (0.34).123
120Another channel which we do not investigate is trade policy, which, as it has been explainedin Section 2.2, was also employed by the regime. In particular, duties spiked in reaction to theGreat Depression and were then accompanied by quotas and other restrictions to trade duringItaly’s autarkic period. As tariffs are levied on individual goods and not on entire sectors, a properinvestigation of this channel would require the construction of a new dataset and this is beyondthe scope of this paper. It is worth mentioning, however, that a detailed study by Federico andTena concerning the period 1870-1930 has already concluded that ‘there was no consistent strategyto favor any broad category industry over others – apart perhaps from a small preference forconsumption goods over investment goods. So, as a first approximation, one would not expect bigeffects on the overall structure of the economy or on the growth rates of large sectors’ (Federicoand Tena 1998a, p. 17).
121A Breusch and Pagan Lagrange multiplier test confirms the absence of random effects in ourmodel. The presence of a time-invariant dummy variable (new) in our model prevented us fromusing a fixed effects model, which would anyway be too demanding for our data given the limitednumber of observations (54).
122We however retain the variable in our model, in accordance to Broadberry and Crafts.123The R2 reported in Broadberry and Crafts (1992) is 0.24.
55

Table
4:
Est
imati
on
resu
lts
(1)
(2)
(3)
(4)
(5)
(6)
(7)
(8)
LP
RO
DG
RLP
RO
DG
RLP
RO
DG
RLP
RO
DG
RLP
RO
DG
RLP
RO
DG
RLP
RO
DG
RLP
RO
DG
R
HP
WO
RK
GR
0.62
6***
0.63
7***
0.62
4***
0.61
6***
0.62
2***
0.62
5***
0.65
5**
0.64
8**
[0.0
056]
[0.0
085]
[0.0
050]
[0.0
090]
[0.0
089]
[0.0
068]
[0.0
157]
[0.0
276]
C4G
R-0
.339
**-0
.336
*-0
.325
*-0
.358
*-0
.347
**-0
.395
*-0
.408
*[0
.045
9][0
.063
6][0
.066
0][0
.055
8][0
.047
6][0
.074
8][0
.087
7]
NEW
0.00
90.
009
0.01
20.
010
0.00
90.
011
0.00
90.
009
[0.4
067]
[0.4
407]
[0.3
111]
[0.3
868]
[0.4
561]
[0.3
525]
[0.4
166]
[0.4
473]
NEW
C4
-0.3
87*
[0.0
888]
HR
SG
R0.
20.
2[0
.592
8][0
.737
6]
LC
4GR
-0.0
44-0
.044
[0.8
860]
[0.8
923]
IRI
-0.0
1-0
.001
[0.3
747]
[0.8
865]
t192
70.
024
0.02
4[0
.214
1][0
.229
3]
t193
80.
008
0.01
1[0
.524
3][0
.514
6]
CO
NSTA
NT
-0.0
09-0
.012
-0.0
12-0
.009
-0.0
08-0
.007
-0.0
2-0
-02
[0.4
297]
[0.3
055]
[0.3
190]
[0.4
351]
[0.5
479]
[0.5
283]
[0.2
448]
[0.3
113]
Obs
erva
tion
s54
4854
5454
5454
54
R-s
quar
ed0.
3429
0.34
250.
3346
0.34
450.
3434
0.34
910.
3816
0.38
29
Rob
ust
pva
lues
inbr
acke
ts∗s
igni
fican
tat
10%
;∗∗
sign
ifica
ntat
5%;∗∗∗s
igni
fican
tat
1%R
egre
ssio
nsar
eru
nw
ith
pool
edO
LS.
Not
eth
atre
gres
sion
s(1
)an
d(3
)-(6
)re
fer
toov
eral
lin
dust
ry;
regr
essi
on(2
)is
rest
rict
edto
man
ufac
turi
ng.
56
Conversely to Broadberry and Crafts (1992) who seem to ignore the issue, we haveconsidered the possibility of both the capital intensity and the C4 growth variablesbeing endogeneous. As well as capital accumulation affecting labour productivity,over long periods of time we may in fact also see increases in labour productivity,translated into a higher profitability, spurring on investments and thus contributingto a rise in capital stock. Similarly, in the 1930s low productivity growth may haveallowed only the largest firms to survive, hence increasing concentration. This re-verse causality problem may be solved by using instrumental variables. However,data availability severely limits our choice. We therefore ran a two-stage least-squares (2SLS) regression in which we instrumented the variable HPWORKGR andC4GROWTH with their lagged value. The latter is in fact presumed to be highlycorrelated with the instrumented variable, yet uncorrelated with the error term.124
The signs of the coefficients obtained in our baseline model are confirmed, but thecoefficients turn out to be not significant under the IV specification. On the otherhand, an endogeneity test did not allow us to reject the null hypothesis of exogeneityof the two regressors (p-value 0.8675). This reassured us into validating the estimatesof our pooled OLS regressions, which moreover have the advantage of being strictlycomparable to Broadberry and Crafts’ results.
Different specifications of the model were also tested. Column 2 restricts our analysissolely to the manufacturing sector; hence the drop in the number of observations.The model does not lose power nor do LPRODGR and C4GROWTH lose muchsignificance. The results of our baseline model are confirmed. Column 3 includes aninteraction variable (NEWC4) that measures the C4 growth solely in new industries,which hence attempts to test the assumption, put forward by Aghion et al. (2005),according to which the newer industries, i.e. the industries closer to the technologicalfrontier, respond more in terms of innovation/productivity growth to an increasein competition vis-a-vis the farther-from-the-frontier/older industries. This claimseems to be confirmed the case of Fascist Italy: an increase in concentration inthe new sectors is significantly and negatively linked to total labour productivitygrowth.125
We also try out some augmented model specifications in order to reduce the omittedvariables issue, if it exists. When adding the growth of hours worked (HRSGR)to our model (column 4), justified by the possible effect of variations in workinghours on output per worker growth, the new variable turns out to be not statisticallysignificant. This may, however, be due to the construction of the hours workedvariable in the period 1921-1927 for which no industry-specific data exist (see Section3.3). We cannot therefore draw strong conclusions from this piece of evidence.
124However, a Sargan-Hansen test deemed the lagged variables used by us to be weak instruments.125When including the C4GROWTH variable, as well as NEWC4, in specification (3), both es-
timated coefficients present negative signs, although they lose their significance (results here notreported).
57

In column 5 we introduce into our model, alongside the growth rates of our concen-tration indices (C4GR), their lagged growth rates (L C4GR). The latter in fact areincluded in order to test the assumption that an increase in concentration has posi-tive effects on labour productivity not immediately, but with a time lag, a possibilitywhich, as we have explained in the previous Section, can be derived from Petri (2002).Yet no significant correlation between labour productivity growth and the growth inconcentration registered in the previous period emerges from the model. Interest-ingly, however, L C4GR too presents a negative sign. This piece of evidence goesagainst the claim that, in the period under study, less competition was beneficial forproductivity with a lag. On the contrary, an increase in concentration is confirmedto have affected labour productivity growth, immediately and negatively. Column6 includes a dummy variable which takes value one for industries controlled by IRI.State management and ownership of key industries could in fact have affected labourproductivity growth.126 Yet the IRI dummy variable is also rejected as not statis-tically significant. Finally two time dummies (t1927 and t1938) are introduced, inorder to discriminate between the Great Depression years and the other sub-periods.These dummies are however not significant, separately but also jointly.127 Column8 simply includes all the mentioned regressors simultaneously (with the exception ofthe NEWC4 variable), with the only advantage of boosting the R2, and does not addany extra information to what previously stated. What emerges clearly from Table4 in general is that the two variables, HPWORKGR and C4GR, always retain theirstatistical and economic significance in all alternative model specifications.
To conclude, our econometric evidence points to two main results for Italy’s industriallabour productivity performance in the three decades from 1921 to 1951: a) labourproductivity growth and capital intensity growth were strongly and positively cor-related. This could imply that capital accumulation was particularly important inItaly’s growth process in those years and that it might have mattered more than TFPgrowth which we know at the aggregate economy level to have been slow (Broad-berry, Giordano and Zollino 2011); b) an increase in the C4 growth index, a measurefor the level of concentration in each industry, was negatively correlated to labourproductivity growth, nor did it contribute to the latter growth in later sub-periods.Furthermore, the reduction of competition was particularly detrimental for new in-dustries, as the theory of Aghion et al. (2005) would predict. These findings thereforeconfirm that, as in the contemporary British case, the competition-reducing indus-trial policy enacted during the 1930s was negatively linked to the growth of labourproductivity in Italian industry, especially in the new sectors.
126On the one hand, studies such as Antonelli and Barbiellini Amidei (2007, p. 73) point to Stateownership having encouraged R&D expenditure in firms and contributing to technological spillovers(in the specific case of Italy in the 1960s and 1970s). On the other hand, mismanagement, corruptionand rent-seeking in State-owned firms can also lead to a slowdown in productivity. Hence, theexpected sign of this variable is ambiguous.
127The latter result was obtained by performing a joint significance F-test on the two variables.
58

5 Conclusions
Between 1911 and 1951, Italian industry underwent a phase of significant moderni-sation, which the Fascist regime attempted to accelerate through active industrialpolicy. Using a newly compiled dataset, this paper analyses the evolution of labourproductivity in the different branches of Italian industry, grouped into new and oldindustries, paying particular attention to the impact of the changes in competitionpolicy occurring as of the late 1920s. The qualitative and quantitative evidencepresented in this paper confirms the presence of a policy shift occurring around1926-1927. Following this shift, competition in the product market became morelimited and the government began an active promotion mainly of the new industries.To assess the impact of these changes, we therefore construct a new benchmark for1927 and analyse how labour productivity changed over four different benchmarkperiods between 1911 and 1951. We look at the evolution of industry as a whole,but also present disaggregated data for both ‘new’ and ‘old’ industries.
Three main results emerge. Firstly, in the sub-periods considered, there is a notablevariance in the labour productivity growth patterns: in particular, exceptionally highproductivity growth rates were experienced in the 1921-1927 period, while there wasa slowdown in the performance of Italian industries in 1929-1938. Secondly, new andold industries, on average and over the whole period, do not present significantlydifferent labour productivity growth rates. Thirdly, when we perform a shift-shareexercise, we find that industrial labour productivity growth was driven by growthwithin sectors rather than by the effect of reallocation of labour between industrialsectors. The condition of structural change was minimal, especially in the 1930s,after the Fascist policy shift. Accounting for changes in the number of hours workeddoes not modify the general results, although the performance of the 1930s appearsless severe than what is indicated by the output-per-head measure.
The paper also explores what were the main determinants of productivity and, inparticular, whether product market competition played any role. In our econometricexercise, we find that capital accumulation was a significant driver of productivity, afinding which is consistent with the measurement of limited TFP growth over the pe-riod considered in other studies (Broadberry, Giordano and Zollino 2011; Giugliano2011b). Changes in current and lagged product-market competition were also neg-atively related with productivity growth, especially in the new industries, a findingwhich is robust to a set of different specifications and is confirmed by a range ofqualitative evidence.
The current study could be expanded in a number of directions. Firstly, the newlyconstructed benchmarks could be used for an international comparison which wouldallow to trace the relative positioning and repositioning of the different branches ofItalian industry more accurately. Secondly, our impression that capital accumulation
59

may have overshadowed TFP growth as a driver of labour productivity needs tobe confirmed by a more careful analysis. Research efforts should be pointed in thedirection of estimating branch-specific estimates of the capital stock, which currentlydo not exist, in order to obtain branch-specific estimates of total factor productivity.Thirdly, this paper has focused mainly on competition policy, one aspect of industrialpolicy in the years considered. Our econometric evidence does point to the presence ofIRI not being significantly correlated with labour productivity growth in the sectorsit operated in until 1951. However, the binary dummy variable constructed by usis a very rudimentary measure of the institution’s effect. Furthermore, we haveignored the impact of trade and labour policy in our empirical analysis, which hasalready been taken into account separately for Italy in the 1930s (see Federico andTena 1988a for trade; Mattesini and Quintieri 2006 and Giordano, Piga and Trovato2012 for labour), yet should be taken into account jointly, together with competitionpolicies. Moreover, this study could be extended to later time periods, so as tobetter understand whether there was any impact of the industrial policy conductedin the 1930s on the post-World War Two boom. The preliminary evidence presentin this paper would suggest that it did not, but more research is needed to confirmthe plausibility of this statement. Finally, more empirical evidence on causal linksis called for, also for other countries (i.e. the 1930s U.K. case). This research goalwould require a significant expansion of the current dataset and the use of appropriateinstrumental variables and other econometric techniques, but it would lead to therewarding measurement of the actual effect of Fascist competition policies on Italy’sproductivity growth.
60

A Data Appendix
In this Appendix we describe the sources and methodology underlying the industrialdata used throughout our paper, namely labour productivity and price-cost margins.In particular, we describe value added, employment, hours worked and wage data.In section 4.2 we also used horsepower data to build our capital intensity variable.The latter will also be discussed here.
I. Classification: The first issue to be tackled is the classification of industrialsectors. Not only do the classifications between different sources (PCs, ICs andthe more recent works by scholars who have calculated industrial VA) differ, butthe classification used by the same source (IC or PC) also changes over time. Thissecond problem is solved using studies by Vitali (1970), furthered by Zamagni (1987),and Chiaventi (1987). These works have reclassified, respectively, the PCs and ICsin order to make them comparable diachronically. For this reason, they are largelyemployed in our work.
The first problem (standardisation between different sources) was harder to solve andseverely limited the number of branches in which we could disaggregate industry. Ourfinal classification is the one chosen by the Bank of Italy in the computation of thebenchmarks of value added in Italian industry (Fenoaltea and Bardini 2000a, p.116),which we extend to include a disaggregation of the textile industry. The full list ofsectors covered by our study has been presented in Table 2. As it is clear from thetable, all industries except construction and “other industries” were included. Theformer was dropped because of its extreme cyclicality; the latter because its definitionchanged significantly over time. Thereby classified VA data were then matched withthe corresponding data from Vitali (1970), whenever we intended to use the PC, andwith the corresponding data from Chiaventi (1987), whenever we intended to use theIC.
II. Value Added at Constant Prices: In order to compute labour productivityestimates over time we were in need of industry-specific VA estimates at constant(1938) prices. These are conveniently provided by Carreras and Felice (2010), whoestimate yearly industry-specific VA from 1911 through to 1938. For 1951, we useunpublished data which were kindly provided to us by Emanuele Felice (2011). Theseestimates are fully consistent with Carreras and Felice (2010).
III. Value Added at Current Prices: In order to estimate price-cost margins,value added at current prices is also needed. We here use different sources for differentyears.
1951. See Fenoaltea and Bardini (2000b).
1938. See Fenoaltea and Bardini (2000a).
61

1927. See Carreras and Felice (2010).
1921. See Carreras and Felice (2010).
1911. Data for industrial value added at current prices for this year are mostlytaken from Fenoaltea (1992). A special effort was made to update these figures inlight of the scholar’s more recent work. The estimate for tobacco, as well as those forthe paper and printing industries therefore come from Fenoaltea (2000). The datafor the non-manufacturing industries, namely mining and utilities, come from Cic-carelli and Fenoaltea’s (2009) new regional estimates, which were aggregated by us.The data for the chemical and rubber industries come from Fenoaltea (2007). Datafor metalmaking come from the new regional estimates by Ciccarelli and Fenoaltea(2009). Data for the textile industry come from the new regional estimates by Fenoal-tea (2004), which were by us aggregated. Data for mechanical engineering and theproduction of non-metallic minerals come from new unpublished figures which werekindly provided to the authors by Carlo Ciccarelli and Stefano Fenoaltea.128
IV. Employment: The headcount number of workers in the different branches ofthe industrial sector is calculated on the basis of the PC figures. As explained inSection 3.2 this decision is based on the fact that the VA estimates at constantprices used to compute the labour productivity estimates assume that the workingpopulation was the one included in the PC rather than that of the IC. In orderto compute our employment figures, we have made extensive use of the estimatesby Vitali (1970). These estimates have the precious advantage of being reclassifiedhomogenously, and hence of being comparable over time. Yet they also present someproblems, which led us to adjust Vitali’s estimates in a number of cases. Theseadjustments are listed below:
a) Vitali provides estimates for 1911, 1921, 1931, 1936 and 1951. Since we wereinterested in having figures for 1911, 1921, 1927, 1938 and 1951, we had to extrapolatethe figures relative to 1931 and 1936 to 1927 and 1938 respectively. This procedurehas been previously employed by Fenoaltea and Bardini (2000a) as one of theirsteps in the calculation of VA at current prices for 1938. Therefore, to computethe extrapolation relative to 1938, we follow the exact procedure by Fenoaltea andBardini (2000a). The two scholars employed branch-specific “employment” indices,which are, in fact indices of production largely taken from Carreras (1982). Wereplicate this exercise, extrapolating the figures relative to 1936 present in Vitali viathe same indices. To be consistent with this procedure, a similar exercise is followedfor 1927: here we employ the branch-specific estimates by Carreras and Felice (2010)to retropolate the 1931 data to 1927. Since the work of Carreras and Felice (2010)is largely based on Carreras (1982), this makes the two procedures consistent.
128The new estimates for mechanical engineering include the new data for the shipbuilding industrycontained in Ciccarelli and Fenoaltea (2008).
62

b) Vitali’s estimates are at constant 1951 boundaries, while the VA estimates weuse to compute productivity are at the boundaries of the time. This is a problem,as Italy gained territory after World War One, to then lose part of it after WorldWar Two. We therefore needed to adjust Vitali’s figures to compute employment atthe boundaries of the time. To do so, we used the coefficients published in Zamagni(1987, p. 43). In particular, we subtracted 2.1% employment from the 1911 figureand added on 1.7% in 1921, 1931 and 1936. One problem with this procedure isthat these coefficients was applied to the aggregate industry figure and to all thesectoral data. This would mean assuming that the territories which were gained andlost following the conflicts had the same sectoral distribution of labour as the Italianeconomy as a whole, which is clearly not necessarily true. However, given the smallsize of the adjustment, we do not expect this to significantly bias our estimates.
c) A range of other, smaller adjustments is also made. Firstly, Vitali’s estimates donot disaggregate the textile industry, while we found it helpful to do so. In orderto make this adjustment, we had to revert back to original PC figures. For 1911,1936 and 1951, the PCs offered sufficient disaggregation so that we could combinethe different categories present in the censuses into the four sectors we have dividedthe textile industry into. In this case, therefore, we simply re-proportioned thesefour figures, so that their sum would match the total from Vitali. As for the 1921and 1931 PCs, they provide a lower level of disaggregation for textiles, which didnot allow us to combine existing categories into the four branches we had identified.Hence, to break these more aggregate figures down to a lower disaggregation, we usedthe average of the relevant proportions from the 1911 and 1936 censuses. Secondly,for the case of 1911, the more accurate employment data for the chemical and rubberindustry comes from Fenoaltea (2007). Thirdly, for all years, the relevant IC figureis taken instead of the actual/extrapolated PC figure, when the former is found tobe higher. This adjustment is rarely made, since, as we have discussed, the IC figureis almost always lower than the corresponding PC figure.
V. Hours worked: Our main sources were the ICs, since PCs contain no informationon hours worked. However, even the ICs report hours data only in 1937-1939 and1951, hence the use of different sources and methodologies, which we describe indetail in this paragraph. In general, in order to calculate the total number of hoursworked in a given branch, we first calculate a branch-specific coefficient of numberof hours worked per year by an individual worker. These figures correspond to thosewe have presented in Table 3. Because of the nature of the sources used, this figurenormally assumes that the worker is fully employed. However, since our employmentfigure is largely based on PCs, we expect some of the workers counted to be under-employed or seasonal . Since we do not have an accurate measure of how many wereexactly this kind of workers, we follow Felice (2005)’s methodology. We exploit thedifference between the PC and the IC figures and assume that the workers who werecounted in the PC but not in the IC were under-employed or seasonal workers. We
63

therefore attribute to the latter a number of hours worked per person which is onlyhalf of that we have estimated on the basis of our sources. Conversely, we attributeto the workers who were counted in the IC the full number of hours worked perperson. Since no IC was held in 1921, it was impossible to compute a comparablefigure for this year. This explains why we could not construct an estimate for 1921.We now provide a description of the sources used to calculate the number of yearlyhours worked per person relative to each individual benchmark year.
1951. We took the branch-specific total number of hours worked by manual workersfrom the IC and divided it by the total number of manual workers present in thesame census. However, since the number of hours worked refers to 1950, whilst thenumber of workers refers to 1951, and since the total number of hours worked islikely to have increased between 1950 and 1951, the resulting effect is probably anunderestimation of the number of hours worked by each workman. Unfortunately,there were no available employment indices for 1950-1951, which is why the datahave been left uncorrected.
1938. We took the number of hours worked by manual workers in industrial plantsfrom the IC and divided it by the total number of workers in industrial plants. Inthis case, too, the data on the number of hours worked usually referred to the yearpreceding the one in which the headcount was made. Differently from 1951, however,in this case we could employ a range of branch-specific indices on the number ofhours worked, which are largely taken from Assonime. When such an index was notavailable, we used branch-specific indices of employment taken from Fenoaltea andBardini (2000a).
1927 . The procedure used to obtain the number of average number of hours workedper year in 1911 and 1927 is more complicated, as the relative ICs did not collectdata relative to the number of hours worked. To calculate these estimates, we have torely on other sources. For 1927, we largely employ data on the total number of hoursworked and the total number of employees as taken from Assonime. This source doesnot allow us to cover all sectors, which is why we have to do a rough matching. Inorder to minimise the inconsistencies between this source and the IC, we rescale thethereby obtained figure by using the ratio of the figure from this source relative to1938 and the figure coming from the IC.
1911. The 1911 data are calculated using the branch-specific estimates for 1927,corrected by the average reduction of daily hours in industry, which is taken fromZamagni (1984, p. 75). This corresponds to a fall from 10 hours a day to 7.7hours.
VI. Wage bill: Data on the wage bill are needed to calculate the price-cost margins.Our main sources were the ICs, since PCs contain no information on wages. However,even the ICs report wage data only in 1937-1939 and 1951, hence the use of differentsources and methodologies, which we describe in detail in this paragraph. In general,
64

in order to calculate the total wage bill in a given branch, we first calculate a branch-specific coefficient of the total amount earned in a year by an individual worker.Because of the nature of the sources used, this figure normally assumes that theworker is fully employed. However, since our employment figure is largely based onthe PCs, we expect many of those who are counted to be under-employed or seasonalworkers. This problem is analogous to the one encountered in building the estimatesfor the number of hours worked. Hence, we adopt the same methodology, comparingthe IC and the PC figures. In particular, we attribute a wage which is only two-thirdsof that we have estimated on the basis of our sources to the workers included in thePCs but not in the ICs. Conversely, we attribute to the workers who were countedin the IC the full wage. Since no IC was held in 1921, it was impossible to computea comparable figure for this year. We now provide a description of the sources usedto calculate the amount earned per person relative to each individual benchmarkyear.
1951. We took the branch-specific total wage bill for workers from the IC and dividedit by the total number of workers present in the same census. Since the first figureexcluded craftsmen, we had to exclude craftsmen from the headcount data and wedid so on the basis of information provided in Chiaventi (1987). As in the case of thenumber of hours worked, the wage bill calculated in the IC refers to 1950, while thenumber of heads is counted in 1951. Unfortunately, as there is no index of industrialemployment relative to the years 1950-1951, we do not correct the wage bill figurefor the change in the number of employees which occurred between the two years.Since we expect this number to have risen between 1950 and 1951, this is likely tounderestimate the yearly wage each worker received. However, we do correct for thegrowth in wages which occurred between the two years. This is done using data onthe aggregate wage which is taken from Rossi, Sorgato and Toniolo (1993).
1938. We took the branch-specific total wage bill for manual workers in industrialplants from the 1937-1939 IC and divided it by the total number of workers inindustrial plants. In this case, too, the data on the figure for the wage bill usuallyreferred to the year preceding the one in which the headcount was made. Differentlyfrom 1951, however, in this case we could employ a range of branch-specific indices onthe number of employees, which are largely taken from Assonime, in order to correctthe wage bill figure for changes in employment occurring between 1937 and 1938.Furthermore, we used branch-specific data on hourly wages taken from Zamagni(1976, p. 374) to correct for wage inflation between the two years.
1927. The procedure used for 1911 and 1927 is more complicated, as the relativeICs did not collect data relative to the wage bill. To calculate these estimates, wehave to rely on other sources. For 1927, we rely on data on hourly wages. Mostof these data come from Zamagni (1976, p. 374) and actually refer to April andJuly 1928. We take the average of the two months and extrapolate it to 1927 usingan index of industrial wages also from Zamagni (1976, p. 378). For the textile
65

industry, a slightly different procedure is followed: rather than relying on the datarelative to 1928 which refer to all textiles, we prefer to use data relative to 1925, alsotaken from Zamagni (1976), which refer to individual textile industries. We thenextrapolate these data to 1927 using the fore-mentioned index. On the basis of thesesources, we now have a dataset of branch-specific hourly wages relative to 1927. Inorder to transform it into the total wage bill, we use two different procedures forthose workers who appear in the IC and for those workers appearing in the PC andnot in the IC and which we assume are seasonal or underemployed workers. For theworkers present in the IC, we multiply the hourly wage times the yearly number ofhours worked by an individual worker in 1927 (as calculated in “V. Hours Worked”),and then multiply this number times the number of workers present in the IC. Forthe workers present in the PC but not in the IC, we first multiply the hourly wagetimes two-thirds and then multiply it times half the yearly number of hours workedby an individual worker in 1927. Finally, we multiply it times the number of workerspresent in the PC but not in the IC. The sum of these two figures constitutes thetotal wage bill.
1911. The 1911 data are calculated using branch-specific data on the daily wages ofindustrial workers from Zamagni (1984, pp. 68-69 and 87), which we divide by thetypical number of hours worked per day taken from Zamagni (1976). On the basis ofthese sources, we now have a dataset of branch-specific hourly wages relative to 1911.In order to transform it into the total wage bill, we use two different procedures forthose workers who appear in the IC and for those workers appearing in the PC andnot in the IC and which we assume are seasonal or underemployed workers. For theworkers present in the IC, we multiply the hourly wage times the yearly number ofhours worked by an individual worker in 1911 (as calculated in “V. Hours Worked”)and then multiply this number times the number of workers present in the IC. Forthe workers present in the PC but not in the IC, we first multiply the hourly wagetimes two-thirds and then multiply it times half the yearly number of hours workedby an individual worker in 1911. Finally, we multiply it times the number of workerspresent in the PC but not in the IC. The sum of these two figures constitutes thetotal wage bill.
VII. Horsepower: The data for on horsepower come from the various ICs, asstandardised in Chiaventi (1987). This source has the advantage of dealing with theinconsistencies in the calculation of the number of horsepowers which characterisedthe ICs. In particular, Chiaventi (1987) eliminates the duplications relative to the1927 IC, when ISTAT incorrectly summed primary and secondary engines, largelyoverestimating the total number of horsepower in the Italian economy of the time.129
As no IC was held in 1921, the figure for the number of horsepower relative to thisyear is interpolated using the 1911 and 1927 data.
129For more details, see Chiaventi (1987, pp. 126-131 and 148-149).
66

B Robustness check: labour productivity growth
based on industrial census data
As a robustness check, in this Appendix we present the results obtained by calcu-lating our labour productivity estimates using employment data from the ICs ratherthan from the PCs. Differently from the PCs which included information on the“active population,” the ICs provide information on the number of workers presentin industrial plants on the day of the census. Therefore, in theory, the IC is a moreaccurate source from which to measure employment than the PC. However, its imper-fect coverage has made scholars skeptical of the information therein contained. Thisis particularly true for the first IC, held in 1911, which, as Fenoaltea has remarkedin his many contributions to the literature, failed to pick up “domestic” activityas well as all production carried out at the same address as the mater’s residence(this included the large rubber-making firm, Pirelli).130 The 1911 IC also formallyexcluded any plant with less than two employees, which were around 241, 000 in1927. This, and the other reasons which led to our choosing the PC figures as ourpreferred estimate, are described in detail in Section 3. We here however feel theneed to implement a robustness check.
B.1 The data
As the numerator of our labour productivity estimates, we use VA at constant pricesdescribed in Appendix A. What changes is the denominator which we here describe.The headcount of workers is taken from the following sources.
1911. We employ the figures published in Chiaventi’s (1987) work, which standard-ised the data relative to the 1911-1951 ICs. In particular in 1911, to tackle theformal exclusion of one-employee firms from the underlying IC, Chiaventi calculatedthe number of employees working in plants with one employee as a share of the totalnumber of employees for 1927 and applied this coefficient to 1911. We apply the samemethodology in order to add on the excluded workers, yet do so branch by branch(conversely to Chiaventi who does it for industry as a whole). Our corrections rangefrom zero (for branches such as chemicals, metalmaking or tobacco), to almost 30%(for branches such as the leather industry).
1927. We use the figures present in Chiaventi (1987) with no further adjust-ments.
1938. We employ the figures relative to the IC taken from Fenoaltea and Bar-dini (2000a), which are more precise than Chiaventi’s in that they are corrected for
130For a more detailed explanation on the problems associated with the 1911 IC, see Fenoaltea2003, pp. 1095-1100.
67

seasonality. The 1937-1939 census was, in fact, conducted over several months ofdifferent years, in order to measure each sector at the peak of its productive capac-ity. We however include in Fenaoltea and Bardini’s numbers the workers in servizigenerali di stabilimento, which were by them excluded, but included by Chiaventi(1987).
1951. Again, we use Fenoaltea and Bardini(2000b)’s figures, which are very similarto Chiaventi’s. The only major departure concerns the data for the the oil industry:Fenoaltea and Bardini (2000b) in fact substantially reduce the number of employeesworking in the branch so as to exclude those involved in agricultural activities. Weaccept their revision.
In our VA-per-hour-worked measures, which we also compute in this section, wemultiply our IC-based employee figure and multiply it by the same branch-specificcoefficient of hours worked used for our benchmark estimates and described in Ap-pendix A.
B.2 The results
Given the IC data constraints, we could only measure productivity over three bench-mark years, thus failing to separate the World War One period from the era of liberalFascism. The results are presented in Figure 9 and confirm that the 1927-1938 periodis the one of slowest productivity growth, even though the difference with the earlierperiod is much less marked than in the case of our preferred estimates. Once again,the 1938-1951 period is characterised by the fastest productivity growth, althoughthis robustness check suggests that our preferred measure may have exaggerated thespeed of the process.
When one differentiates between new and old industries, the finding that the newindustries did much better than the old industries in the 1930s is confirmed. Someimportant differences with our preferred measure emerge as far as the first period isconcerned: using the IC data the performance of the new industries over the 1911-1927 era appears much better than the one provided by the PC figures. This findingalso has an impact on the overall rate of growth for the whole 1911-1951 period,which is now fairly different between new and old industries. Unfortunately, becauseof the nature of this dataset, it is impossible to say whether the fast productivityof the new industries over the 1911-1927 period is due to changes in the World WarOne or in the liberal Fascist era.
Figure 10 aims to understand whether productivity growth in Italian industry wasdue to internal productivity growth or to the shift of resources from low-level pro-ductivity sectors to high-level productivity sectors. As in the case of our preferredestimates, a large part of labour productivity growth appears to be due to internal
68

Figure 9: Labour productivity growth in Italian industry, 1911-1951,annual percentage growth rates, industrial census
‐3%
‐2%
‐1%
0%
1%
2%
3%
4%
5%
1911‐1927 1927‐1938 1938‐1951 1911‐1951
VA per worker average an
nual growth ra
tes
Old industries New Industries Total industry
Source: see text and Appendix B.2.
productivity growth.131 Differently from them, however, this robustness check wouldimply that structural change was proportionally more important in the 1930s thanin any other period.
The same exercise is repeated by using the data on hours worked. Figure 11 plotsannual average output per hour worked growth rates. Figure 12 highlights the con-tribution of structural change to labour productivity growth. In general, also forconstruction reasons, the results concerning output per hour worked growth ratesbased on IC figures are similar to those based on PC figures. Labour productivitygrowth rates in the new industries do not seem to vary between 1911-1927 and 1927-1938, whereas old industries still see a fall, hence contributing the the slower growthin the 1930s relative to the previous period. No other significant difference appearsrelative to Figure 7. Structural change again played a marginal role in contributingto labour productivity growth. World War Two and the reconstruction years showup again those in which a shift of hours worked from old to new industries had a
131This is consistent with the evidence provided by Federico (2003, pp. 56-58) who conducts ashift-share analysis on other indicators, such as capital intensity and employment, and concludesthat the within effect contributes most to growth, yet for the longer period 1911-1996.
69

Figure 10: Structural components of Italy’s industrial labourproductivity, 1911-1951, industrial census
0%
1%
2%
3%
1911-1927 1927-1938 1938-1951 1911-1951
Value ad
ded pe
r worker average an
nual
grow
th ra
tes
Years Structural change Sectoral labour produc6vity
Sources: see Appendix B.2.
minimal impact.
To conclude, the robustness check conducted in this section reassuringly does notcontradict our main results obtained via PC estimates of employment, which for boththeoretical and empirical reasons are anyhow the data to be used in the context ofthis paper.
70

Figure 11: Hourly labour productivity growth in Italian industry,1911-1951, industrial census (in %, per annum)
‐3%
‐2%
‐1%
0%
1%
2%
3%
4%
5%
1911‐1927 1927‐1938 1938‐1951 1911‐1951
VA per hou
r worked average an
nual growth
rates
Old industries New industries Total industry
Sources: see text
.
71

Figure 12: Structural components of Italy’s industrial hourly labourproductivity, 1911-1951, industrial census
0%
1%
2%
3%
1911-1927 1927-1938 1938-1951 1911-1951
Value ad
ded pe
r ho
ur worked average an
nual
grow
th ra
tes
Years Structural change Sectoral labour produc6vity
Sources: see Appendix B.2.
72

References
Adler, F. H. (1995) Italian Industrialists from Liberalism to Fascism, Cambridge:Cambridge University Press.
Aghion, P., N. Bloom, R. Blundell, R. Griffith, and P. Howitt (2005) “Competi-tion and Innovation: An Inverted-U Relationship,” Quarterly Journal of Eco-nomics, Vol. 120, No. 2, pp. 701–728.
Alexander, B. (1994) “The Impact of the National Industrial Recovery Act on CartelFormation and Maintenance Costs,” Review of Economics and Statistics, Vol.76, No. 2, pp. 245–254.
Amatori, F. (1980) “Entrepreneurial Typologies in the History of Industrial Italy(1880-1960): A Review Article,” Business History Review, Vol. 54, No. 3, pp.359–386.
Antonelli, C. and F. Barbiellini Amidei (2007) “Innovazione tecnologica e mutamentostrutturale dell’industria italiana nel secondo dopoguerra,” in C. Antonelli,F. Barbiellini Amidei, R. Giannetti, M. Gomellini, S. Pastorelli, and M.Pianta eds. Innovazione tecnologica e sviluppo industriale nel secondo do-poguerra, Roma-Bari: Laterza, pp. 3–358.
Antonelli, C., F. Barbiellini Amidei, and C. Fassio (2012) “Knowledge Externalitiesand Knowledge Governance: State Owned Enterprises and Italian EconomicGrowth, 1963-1994,” Dipartimento di Economia, Universita di Torino - Work-ing paper No. 10/2012.
Arrow, K. J. (1962) “Economic Welfare and the Allocation of Resources for In-vention,” in R. R. Nelson ed. The Rate and Direction of Inventive Activity,Princeton: Princeton University Press, pp. 609–626.
Assonime (anni vari) Bollettino di Notizie Economiche.
Bachi, R. (1920) L’economia italiana nell’anno 1920, Milano: Societa Editrice DanteAligheri.
Baffigi, A. (2011) “Italian National Accounts, 1861-2010,” Banca d’Italia - Quadernidi Storia Economica, No. 18.
Banca d’Italia (1938) L’economia italiana nel sessennio 1931-1936, Roma: Bancad’Italia.
Barbiellini Amidei, F., J. Cantwell, and A. Spadavecchia (2011) “Innovation andForeign Technology in Italy, 1861-2011,” Banca d’Italia - Quaderni di StoriaEconomica, No. 7.
73

Barbiellini Amidei, F., A. Gigliobianco, and C. Giordano (2012) “Credit Policy andEconomic Development in Post-WWII Italy,” in H. Bonin, N. V. Haueter,A. Gigliobianco, and H. James eds. Public Policies and the Direction on Fi-nancial Flows. Studies in Banking and Financial History, Bucarest: EABH.
Barbiellini Amidei, F. and C. Giordano (2012) “Regulatory Responses to the ‘Rootsof All Evil’ - The Re-Shaping of the Bank-Industry-Financial Market Interlockin the U.S. Glass-Steagall and the Italian 1936 Banking Acts,” Mimeo.
Barca, F. and S. Trento (1997) “La parabola delle partecipazioni statali: una missionetradita,” in F. Barca ed. Storia del capitalismo italiano, Roma: Donzelli, pp.186–236.
Bardini, C. (1996) “Labour Productivity in Maunfacturing - The UK and Italy inthe 20th Century,” Nota di Lavoro 96.18, Universita Ca’ Foscari di Venezia.Dipartimento di Scienze Economiche.
(1998) “Dictatorship and Catching-Up. The Use of Benchmark ProductivityComparisons to Evaluate the Impact of Fascism on Italian Industrial Conver-gence,” in C. E. Nunez ed. Proceedings of the Twelfth International EconomicHistory Congress.
Baumol, W. J. (1982) “Contestable Markets: An Uprising in the Theory of IndustryStructure,” American Economic Review, Vol. 72, No. 1, pp. 1–15.
Bertrand, J. (1883) “Theorie mathematique de la richesse sociale par Leon Walras:Recherches sur les principles mathematiques de la theorie des richesse parAugustine Cournot,” Journal des Savants, Vol. 67, pp. 499–508.
Biscaini Cotula, A. M., P. Gnes, and A. Roselli (1985) “Origini e sviluppo delConsorzio per Sovvenzioni su Valori Industriali durante il GovernatoratoStringher,” Bancaria, Vol. 2, No. 12, pp. 154–172.
Blundell, R., R. Griffith, and J. Van Reenen (1999) “Market Share, Market Value andInnovation in a Panel of British Manufacturing Firms,” Review of EconomicStudies, Vol. 66, No. 3, pp. 529–554.
Boone, J. and M. van Leuvensteijn (2010) “Measuring Competition Using the ProfitElasticity: American Sugar Industry, 1890-1914,” Discussion Papers 8159,CEPR.
Broadberry, S. N. (1997) “Anglo-German Productivity Differences, 1870-1990: ASectoral Analysis,” European Review of Economic History, Vol. 1, No. 2, pp.247–267.
74

(2005) “Appendix: Italy’s GDP in World War I,” in S. N. Broadberry andM. Harrison eds. The Economics of World War I, Cambridge: CambridgeUniversity Press.
Broadberry, S. N. and N. F. R. Crafts (1990a) “The Implications of British Macroe-conomic Policy in the 1930s for Long Run Growth Performance,” Rivista diStoria Economica, Vol. 7, No. 1, pp. 1–19.
(1990b) “Explaining Anglo-American Productivity Differences in the Mid-Twentieth Century,” Oxford Bulletin of Economics and Statistics, Vol. 52, No.4, pp. 375–401.
(1992) “Britain’s Productivity Gap in the 1930s: Some Neglected Factors,”Journal of Economic History, Vol. 52, No. 3, pp. 531–558.
Broadberry, S. N. and R. Fremdling (1990) “Comparative Productivity in Britishand German Industry, 1907-37,” Oxford Bulletin of Economics and Statistics,Vol. 52, No. 4, pp. 403–421.
Broadberry, S. N., C. Giordano, and F. Zollino (2011) “A Sectoral Analysis of Italy’sDevelopment, 1861-2011,” Banca d’Italia - Quaderni di Storia Economica, No.20.
Cabiati, A. (1920) Problemi commerciali e finanziari dell’Italia: lezioni tenuteall’Universita commerciale Luigi Bocconi, Milano: Fratelli Treves.
Caracciolo, A. (1978a) “Il processo d’industrializzazione,” in G. Fua ed. Lo sviluppoeconomico in Italia, Vol. III - Studi di settore e documentazione di base, Milano:Franco Angeli, pp. 104–191.
(1978b) “La crescita e la trasformazione della grande industria durante laprima guerra mondiale,” in G. Fua ed. Lo sviluppo economico in Italia, Vol.III - Studi di settore e documentazione di base, Milano: Franco Angeli, pp.195–248.
Carreras, A. (1982) “La produccio industrial espanyola i italiana des de mitjan segleXIX fins a l’actualitat,” Ph.D. dissertation, European University Institute.
Carreras, A. and E. Felice (2010) “L’industria italiana dal 1911 al 1938: ricostruzionedella serie del valore aggiunto e interpretazioni,” Rivista di Storia Economica,Vol. 26, No. 3, pp. 285–334.
Castronovo, V. (2010) Cento anni di imprese. Storia di Confindustria 1910-2010,Roma-Bari: Laterza.
75

Chiaventi, R. (1987) “I censimenti industriali italiani 1911-1951: procedimenti distandardizzazione,” Rivista di Storia Economica, Vol. 4, No. 1, pp. 119–151.
Cianci, E. (1977) Nascita dello Stato imprenditore in Italia, Reprinted in: A.Gagliardi ed., “Nascita dello Stato imprenditore in Italia”, Lanciano: RoccoCarabba, 2009.
Ciccarelli, C. and S. Fenoaltea (2008) “Shipbuilding in Italy, 1861-193: the Burdenof the Evidence,” CEIS - Research Paper 137.
(2009) La produzione industriale delle regioni d’Italia, 1861-1913: una ri-costruzione quantitativa, Vol. I - Le industrie non manifatturiere, Roma: Bancad’Italia.
Ciocca, P. (2007) Ricchi per sempre?, Torino: Bollati Boringheri.
Ciocca, P. and G. Toniolo (1976) “Introduzione,” in P. Ciocca and G. Toniolo eds.L’economia italiana nel periodo fascista, Bologna: il Mulino, pp. 7–18.
Cohen, J. S. (1972) “The 1927 Revaluation of the Lira: A Study in Political Econ-omy,” Economic History Review, Vol. 25, No. 4, pp. 642–654.
(1988) “Was Italian Fascism a Developmental Dictatorship? Some Evidenceto the Contrary,” Economic History Review, Vol. 41, No. 2, pp. 95–113.
Cohen, W. M. (2010) “Fifty Years of Empirical Studies of Innovative Activity andPerformance,” in B. H. Hall and N. Rosenberg eds. Handbook of the Economicsof Innovation, Vol. I, Amsterdam: North-Holland, pp. 129–213.
Cole, H. L. and L. E. Ohanian (2004) “New Deal Policies and the Persistence ofthe Great Depression: A General Equilibrium Analysis,” Journal of PoliticalEconomy, Vol. 112, No. 4, pp. 779–816.
Covino, R., G. Gallo, and E. Mantovani (1976) “L’industria dall’economia di guerraalla ricostruzione,” in P. Ciocca and G. Toniolo eds. L’economia italiana nelperiodo fascista, Bologna: il Mulino, pp. 171–270.
Cowling, K. (1982) Monopoly Capitalism, London: Macmillan.
de Cecco, M. (1997) “Splendore e crisi del sistema Beneduce: note sulla strutturafinanziaria e industriale dell’Italia dagli anni Venti agli anni Sessanta,” inF. Barca ed. Storia del capitalismo italiano, Roma: Donzelli, pp. 389–404.
De Felice, R. (1968) Mussolini il fascista, Vol. II - L’organizzazione dello Statofascista, 1925-1929, Torino: Einaudi.
76
De Jong, H. and P. Woltjer (2011) “Depression Dynamics: A New Estimate ofthe Anglo-American Manufacturing Productivity Gap in the Interwar Period,”Economic History Review, Vol. 64, No. 2, pp. 472–92.
De Mattia, R. (1967) I bilanci degli istituti di emissione italiani 1845-1936, Vol. I -T. I, Roma: Banca d’Italia.
Del Buttero, A. (1947) “La disciplina degli impianti industriali in Italia,” in Mini-stero per la Costituente ed. Rapporto della Commissione economica presentatoall’Assemblea Costituente, Vol. II - Industria, I - Relazione, Roma.
Di Nino, V., B. Eichengreen, and M. Sbracia (2011) “Real Exchange Rates, Trade,and Growth: Italy 1861-2011,” Banca d’Italia - Quaderni di Storia Economica,No. 10.
Dixit, A. K. and J. E. Stiglitz (1977) “Monopolistic Competition and OptimumProduct Diversity,” American Economic Review, Vol. 67, No. 3, pp. 297–308.
Einaudi, L. (1934) “Italy,” The Economist.
Falco, G. and M. Storaci (1977) “Il ritorno all’oro in Belgio, Francia e Italia: sta-bilizzazione sociale e politiche monetarie (1926-1928),” Italia Contemporanea,Vol. 29, No. 126, pp. 3–44.
Federico, G. (1996) “Italy, 1860-1940: A Little-known Success Story,” EconomicHistory Review, Vol. 49, No. 4, pp. 764–86.
(2003) “La struttura industriale (1911-1996),” in R. Giannetti and M. Vastaeds. L’impresa italiana nel Novecento, Bologna: il Mulino, pp. 41–88.
Federico, G. and R. Giannetti (1999) “Italy: Stalling and Surpassing,” in J. Foreman-Peck and G. Federico eds. European Industrial Policy - The Twentieth-CenturyExperience, Oxford: Oxford University Press, pp. 124–151.
Federico, G. and K. Ishii (2001) “The Silk Industry: A Historical Perspective,” inA. Boltho, A. Vercelli, and H. Yoshikawa eds. Comparing Economic Systems:Italy and Japan, Basingstoke and New York: Palgrave, pp. 221–240.
Federico, G. and K. H. O’Rourke (1999) “Much Ado About Nothing? Italian TradePolicy in the Late 19th Century,” in S. Pamuk and J. G. Williamson eds.Globalization Challenge and Economic Response in the Mediterranean Before1950, London and New York: Routledge, pp. 269–296.
(2000) “A Social Accounting Matrix for Italy, 1911,” Rivista di Storia Eco-nomica, Vol. 16, No. 1, pp. 3–36.
77

Federico, G. and A. Tena (1998a) “Did Trade Policy Foster Italian Industrialization:Evidence from the Effective Protection Rates 1870-1930,” Dpto. de HistoriaEconomica e Instituciones, Universidad Carlos III de Madrid, Working Paper.
(1998b) “Was Italy a Protectionist Country?” European Review of Eco-nomic History, Vol. 2, No. 1, pp. 73–97.
Federico, G. and N. Wolf (2011) “Comparative Advantages in Italy: A Long-runPerspective,” Banca d’Italia - Quaderni di Storia Economica, No. 9.
Felice, E. (2005) “Il valore aggiunto regionale. Una stima per il 1891 e per il 1911 e al-cune elaborazioni di lungo periodo (1891-1971),” Rivista di Storia Economica,Vol. 21, No. 3, pp. 83–124.
(2011) “Private correspondence with the Author.”
Fenoaltea, S. (1982) “Railways and the Development of the Italian Economy to 1913,”in P. O’Brien ed. Railways and the Economic Growth of Western Europe, Bas-ingstoke and New York: Palgrave Macmillan, pp. 49–120.
(1992) “Il valore aggiunto dell’industria italiana nel 1911,” in G. M. Reyed. I conti economici dell’Italia, Vol. II - Una stima del valore aggiunto per il1911, Roma-Bari: Laterza, pp. 105–90.
(2000) “Le modifiche alle stime per il 1911,” in G. M. Rey ed. I conti eco-nomici dell’Italia, Vol. III - Il valore aggiunto per gli anni 1891, 1938, 1951,Roma-Bari: Laterza, pp. 235–236.
(2003) “Peeking Backward: Regional Aspects of Industrial Growth in Post-Unification Italy,” Journal of Economic History, Vol. 63, No. 4, pp. 1059–1102.
(2004) “Textile Production in Italy’s Regions, 1861-1913,” Rivista di StoriaEconomica, Vol. 20, No. 2, pp. 145–174.
(2007) “Le industrie chimiche dei derivati del petrolio e del carbone, e dellagomma in Italia, 1861-1913: una ricostruzione quantitativa,” Rivista di StoriaEconomica, Vol. 23, No. 1, pp. 33–80.
Fenoaltea, S. and C. Bardini (2000a) “Le stime per il 1938,” in G. M. Rey ed. I contieconomici dell’Italia, Vol. III - Il valore aggiunto per gli anni 1891, 1938, 1951,Roma-Bari: Laterza, pp. 161–209.
(2000b) “Le stime per il 1951,” in G. M. Rey ed. I conti economici dell’Italia,Vol. III - Il valore aggiunto per gli anni 1891, 1938, 1951, Roma-Bari: Laterza,pp. 210–238.
78
Filosa, R., G. Rey, and B. Sitzia (1976) “Uno schema di analisi quantitativadell’economia italiana durante il fascismo,” in P. Ciocca and G. Toniolo eds.L’economia italiana nel periodo fascista, Bologna: il Mulino, pp. 51–101.
Fremdling, R., H. De Jong, and M. P. Timmer (2007) “British and German Man-ufacturing Productivity Compared: A New Benchmark for 1935/36 Based onDouble Deflated Value Added,” Journal of Economic History, Vol. 67, No. 2,pp. 350–378.
Fua, G. (1978) Lo sviluppo economico in Italia,, Vol. III - Studi di settore e docu-mentazione statistica di base, Milano: Franco Angeli.
Gerschenkron, A. (1962) “Observations on the Rate of Industrial Growth in Italy(1881-1913),” in A. Gerschenkron ed. Economic Backwardness in HistoricalPerspective: A Book of Essays, Cambridge: Belknap Press of Harvard Univer-sity Press, pp. 98–127.
Giannetti, R. (1994) “Alcune tesi sull’intervento dello Stato in una prospettiva dilungo periodo,” in P. Ciocca ed. Il progresso economico dell’Italia, Bologna: ilMulino, pp. 47–80.
(1998) Tecnologia e sviluppo economico italiano 1870-1990, Bologna: ilMulino.
Giannetti, R., G. Federico, and P. A. Toninelli (1994) “Size and Strategy of Italian In-dustrial Enterprises (1907-1940): Empirical Evidence and Some Conjectures,”Industrial and Corporate Change, Vol. 3, No. 2, pp. 491–512.
Giannetti, R. and M. Vasta (2006) Evolution of Italian Enterprises in the 20th Cen-tury, Heidelberg-New York: Physica-Verlag (Springer).
Gilbert, R. and D. Newbery (1982) “Pre-emptive Patenting and the Persistence ofMonopoly,” American Economic Review, Vol. 72, No. 3, pp. 514–526.
Gini, C. (1921) Problemi sociologici della guerra, Bologna: Zanichelli.
Giordano, C., G. Piga, and G. Trovato (2012) “Fascist Wage and Price Policies andthe Industrial Great Depression,” forthcoming in Macroeconomic Dynamics.
Giordano, C. and F. Zollino (2012) “A Historical Reconstruction of Capital andLabour in Italy, 1861-2011,” Mimeo.
Giordano, F. (2007) Storia del sistema bancario italiano, Roma: Donzelli.
Giugliano, F. (2011a) “Crisis? Which Crisis? New Estimates of Industrial ValueAdded in Italy during the Great Depression,” Mimeo.
79

(2011b) “The Italian Climacteric - Productivity Growth in Interwar Italyin Comparative Perspective,” Mimeo.
Gregor, A. J. (1979) Italian Fascism and Developmental Dictatorship, Princeton:Princeton University Press.
Griziotti, B. (1926) Studi sui problemi monetari e finanziari, Milano: Istituto EditoreScientifico.
Gualerni, G. (1976) Industria e Fascismo, Milano: Vita e Pensiero.
Guarneri, F. (1939) Politica commerciale e valutaria del governo fascista - Discorsopronunciato alla Camera dei Fasci e delle Corporazioni il 12 Maggio 1939,Bologna: Tipografia della Camera.
(1953) Battaglie economiche tra le due grandi guerre, Milano: Garzanti.
(1988) Battaglie economiche fra le due guerre, Bologna: il Mulino.
Guidi, M. E. L. (2000) “Corporative Economics and the Italian Tradition of EconomicThought: A Survey,” Storia del pensiero economico, Vol. 40, pp. 31–58.
Hart, O. D. (1983) “The Market Mechanism as an Incentive Scheme,” Bell Journalof Economics, Vol. 14, No. 2, pp. 366–82.
Hermalin, B. E. (1992) “The Effects of Competition on Executive Behaviour,” RandJournal of Economics, Vol. 23, No. 3, pp. 350–365.
Holstrom, B. (1982) “Managerial Incentive Problems - A Dynamic Perspective,” inEssays in Honor of Lars Walhbeck, Helsinki: Swedish School of Economics,pp. 177–208.
Hopenhayn, H. (1992) “Entry, Exit, and Firm Dynamics in Long-Run Equilibrium,”Econometrica, Vol. 60, No. 5, pp. 1127–1150.
Horn, H., H. Lang, and S. Lundgren (1994) “Competition, Long Run Contracts andInternal Inefficiencies in Firms,” European Economic Review, Vol. 38, No. 2,pp. 213–233.
ISTAT (1932) Censimento industriale e commerciale - 15 ottobre 1927, Roma: I-STAT, 8 voll.
(1933) VII Censimento generale della popolazione - 21 aprile 1931, Roma:ISTAT, 20 voll.
(1939) VIII Censimento generale della popolazione - 21 aprile 1936 - XIV,Roma: ISTAT, 9 voll.
80

(1941) Annuario Statistico Italiano, Roma: ISTAT.
(1942) Censimento industriale e commerciale 1937-1940, Roma: ISTAT, 16voll.
(1946) Compendio Statistico Italiano, Roma: ISTAT.
(1955-8) III Censimento generale dell’industria e del commercio - 5 novem-bre 1951, Roma: ISTAT, 18 voll.
(1957a) “Indagine di Statistica sullo sviluppo del Reddito dell’Italia dal 1861al 1956,” Annali di Statistica, Vol. 8, No. 9, pp. 3–270.
(1957b) IX Censimento generale della popolazione - 4 novembre 1951, Roma:ISTAT, 9 voll.
James, H. and K. O’Rourke (2011) “Italy and the First Age of Globalization, 1861-1940,” Banca d’Italia - Quaderni di Storia Economica, No. 16.
Jovanovic, B. (1982) “Selection and the Evolution of Industry,” Econometrica, Vol.50, No. 3, pp. 649–70.
Lyttleton, A. (1974) La conquista del potere. Il fascismo dal 1919 al 1929, Roma-Bari:Laterza.
Mack Smith, D. (1981) Mussolini, London: Weidenfeld & Nicolson.
Marcoaldi, F. (1986) Vent’anni di economia e politica. Le carte di De’ Stefani 1922-1941, Milano: Franco Angeli.
Martin, S. (1993) “Endogenous Firm Efficiency in a Cournot Principal-AgentModel,” Journal of Economic Theory, Vol. 59, No. 2, pp. 445–450.
Mattesini, F. and B. Quintieri (2006) “Does a Reduction in the Length of the Work-ing Week Reduce Unemployment? Some Evidence from the Italian Economyduring the Great Depression,” Explorations in Economic History, Vol. 43, pp.413–37.
Ministero delle Corporazioni (1932) “Informazioni Corporative.”
Ministero dell’economia nazionale (1927) Censimento della popolazione del Regnod’Italia al 1 dicembre 1921, Roma: MEN, Direzione generale della statistica -Ufficio del censimento - 20 voll.
Ministero di agricoltura, industria e commercio (1913) Censimento degli opifici edelle imprese industriali al 10 giugno 1911, Roma: MAIC, Direzione generaledella statistica e del lavoro - Ufficio del censimento - 5 voll.
81

(1914) Censimento della popolazione del Regno d’Italia al 10 giugno 1911,Roma: MAIC, Direzione generale della statistica e del lavoro - Ufficio delcensimento - 7 voll.
Ministero per la Costituente (1946) Rapporto della commissione economica presen-tato all’Assemblea Costituente: Istituto Poligrafico dello Stato.
Morrison, C. J. (1992) “Unraveling the Productivity Growth Slowdown in the UnitedStates, Canada and Japan. The Effects of Subequilibrium, Scale Economies andMarkups,” Review of Economics and Statistics, Vol. 74, No. 3, pp. 381–393.
Nickell, S. J. (1996) “Competition and Corporate Performance,” Journal of PoliticalEconomy, Vol. 104, No. 4, pp. 724–746.
Nickell, S. J., J. Vainiomaki, and S. Wadhwani (1994) “Wages and Product MarketPower,” Economica, Vol. 61, No. 244, pp. 457–473.
Nordhaus, W. D. (1972) “The Recent Productivity Slowdown,” Research Paper 3,Brookings Papers on Economic Activity.
Ortu Carboni, T. (1933) “La concorrenza nell’industria meccanica (problemi delleconcentrazioni industriali),” Rivista di Politica Economica, Vol. 23, pp. 164–171.
Pastorelli, S. (2006) “Lo Stato imprenditore e la qualificazione tecnologica dellosviluppo economico italiano: l’esperienza dell’IRI nei primi decenni del se-condo dopoguerra,” Banca d’Italia - Quaderni dell’Ufficio Ricerche Storiche,No. 12.
Petri, R. (1997) “Innovazioni tecnologiche tra uso bellico e mercato civile,” in V. Za-magni ed. Come perdere la guerra e vincere la pace - L’economia italiana traguerra e dopoguerra 1938-1947, Bologna: il Mulino, pp. 245–307.
(2002) Storia economica d’Italia, Bologna: il Mulino.
Pitigliani, F. R. (1940) “The Development of Italian Cartels under Fascism,” Journalof Political Economy, Vol. 48, No. 3, pp. 375–400.
Profumieri, P. (1972) “Capital and Labour in Italy 1929-40: An Economic Interpre-tation,” Journal of European Economic History, Vol. 1, No. 3, pp. 681–696.
Richardson, H. W. (1967) Economic Recovery in Britain, 1932-1939, London: Wei-denfeld & Nicolson.
Ripa di Meana, A. (1993) “Il consolidamento del debito e la stabilizzazione Mus-solini,” in F. Cotula ed. Problemi di finanza pubblica tra le due guerre, 1919-1939, Roma-Bari: Laterza, pp. 285–332.
82

Romano, S. (1979) Giuseppe Volpi: industria e finanza tra Giolitti e Mussolini,Milano: Bompiani.
Rossi, N., A. Sorgato, and G. Toniolo (1993) “I conti economici italiani: una ri-costruzione statistica,” Rivista di Storia Economica, Vol. 10, No. 1, pp. 1–47.
Rossi, N. and G. Toniolo (1992) “Catching up or Falling Behind? Italy’s EconomicGrowth, 1895-1947,” The Economic History Review, Vol. 45, No. 3, pp. 536–563.
(1993) “Un secolo di sviluppo economico italiano: permanenze e disconti-nuita,” Rivista di Storia Economica, Vol. 10, No. 2, pp. 145–175.
(1996) “Italy,” in N. F. R. Crafts and G. Toniolo eds. Economic Growth inEurope Since 1945, Cambridge: Cambridge University Press, pp. 427–454.
Saibante, F. (1926) I profitti delle Societa per Azioni e la concentrazione dei capitaliindustriali, Reprinted in: F. Saibante, “Scritti Scelti”, Roma, 1956, pp. 76-104.
(1934) Nuovi dati statistici sulle Societa italiane per Azioni, Reprinted in:F. Saibante, “Scritti Scelti”, Roma, 1956, pp. 269-70.
Salop, S. (1977) “The Noisy Monopolist: Imperfect Information, Price Dispersionand Price Discrimination,” Review of Economic Studies, Vol. 44, No. 3, pp.393–406.
Salter, W. E. G. (1966) Productivity and Technical Change, Cambridge: CambridgeUniversity Press.
Sapelli, G. (1992) “Technical Change, Microeconomic Evolution and Growth: An In-troductory View of Italian Industrial Development,” in G. Dosi, R. Giannetti,and P. Toninelli eds. Technology and Enterprise in a Historical Perspective,Oxford: Clarendon Press, pp. 291–313.
Saraceno, P. (1981) “Salvataggi bancari e riforme negli anni 1922-36,” in Bancae Industria fra le due guerre, Vol. II - Le riforme istituzionali e il pensierogiuridico, Bologna: il Mulino, pp. 15–61.
Sarti, R. (1971) Fascism and the Industrial Leadership in Italy, 1919-1940, Berkeleyand Los Angeles: University of California Press.
Schmidt, K. M. (1997) “Managerial Incentives and Product Market Competition,”Review of Economic Studies, Vol. 64, No. 2, pp. 191–213.
Schumpeter, J. A. (1943) Capitalism, Socialism and Democracy, London: Allen andUnwin.
83

Scott, P. and A. Spadavecchia (2011) “Did the 48-Hour Week Damage Britain’sIndustrial Competitiveness?” Economic History Review, Vol. 64, pp. 1266–1288.
Stiroh, K. J. (2002) “Information Technology and the U.S. Productivity Revival:What do the Industry Data Say?” American Economic Review, Vol. 92, No.5, pp. 1559–1576.
Tattara, G. and G. Toniolo (1976) “L’industria manifatturiera: cicli, politiche e mu-tamenti di struttura (1921-37),” in P. Ciocca and G. Toniolo eds. L’economiaitaliana nel periodo fascista, Bologna: il Mulino, pp. 103–158.
Toniolo, G. (1977) “Effective Protection and Industrial Growth: The Case of ItalianEngineering, 1898-1913,” The Journal of European Economic History, Vol. 6,No. 3, pp. 659–73.
(1980) L’economia dell’Italia fascista, Roma-Bari: Laterza.
Toniolo, G. and F. Piva (1988) “Unemployment in the 1930s: The Case of Italy,” inB. Eichengreen and T. J. Hatton eds. Interwar Unemployment in InternationalPerspective, Dordrecht: Kluwer Academic Publishers, pp. 221–246.
Toniolo, G. and F. Salsano (2010) Da Quota 90 allo Sme, Roma-Bari: Laterza.
Vinci, F. (1918) “La concentrazione dei capitali nelle societa ordinarie per azioni,”Rivista delle societa commerciali, Vol. 8, pp. 195–207.
Vitali, O. (1970) Aspetti dello sviluppo economico italiano alla luce della ri-costruzione della popolazione attiva, Roma: Collana dell’Istituto di Demografiadell’Universita di Roma.
Vito, F. (1930) I Sindacati industriali: Cartelli e Gruppi, Milano: Vita e Pensiero.
(1932) I Sindacati industriali: Cartelli e Gruppi, Milano: Vita e Pensiero.
(1960) Concorrenza e monopolio nell’economia italiana, Milano: Vita e Pen-siero.
(1961) Concorrenza e monopolio nell’economia internazionale, Milano: Vitae Pensiero.
von Tunzelmann, G. N. (1982) “Structural Change and Leading Sectors in BritishManufacturing, 1907-68,” in C. P. Kindleberger and G. di Tella eds. Eco-nomics in the Long View. Essays in Honour of W.W. Rostow, Vol. III, London:Macmillan, pp. 1–49.
84

Vonyo, T. (2011) “The Economics of Wartime Dislocation and Post-War Recon-struction: Factor Accumulation and Productivity Growth in West GermanIndustry, 1939-1955,” Working paper, presented at Oxford, Brasenose College,10 May 2011 - cited with permission of the author.
Willig, R. D. (1987) “Corporate Governance and Market Structure,” in A. Razin andE. Sadka eds. Economic Policy in Theory and Practice, London: Macmillan,pp. 481–497.
Zamagni, V. (1976) “La dinamica dei salari nel settore industriale,” in P. Ciocca andG. Toniolo eds. L’economia italiana nel periodo fascista, Bologna: il Mulino,pp. 329–378.
(1978) Industrializzazione e squilibri regionali in Italia. Bilancio dell’etagiolittiana, Bologna: il Mulino.
(1984) “I salari giornalieri degli operai dell’industria nell’eta giolittiana(1898-1913),” Rivista di Storia Economica, Vol. 1, No. 2, pp. 183–221.
(1987) “A Century of Change: Trends in the Composition of the ItalianLabour Force, 1881-1981,” Historical Social Research, Vol. 44, pp. 36–97.
(1997) “Un’analisi microeconomica degli effetti della guerra,” in V. Zamagnied. Come perdere la guerra e vincere la pace, Bologna: il Mulino, pp. 13–54.
85


(*) Requestsforcopiesshouldbesentto: Bancad’Italia–ServizioStudidistrutturaeconomicaefinanziaria–DivisioneBibliotecaeArchiviostorico– ViaNazionale,91–00184Rome–(fax00390647922059). TheQuaderniareavailableontheInternetwww.bancaditalia.it.
PREVIOUSLY PUBLISHED “QUADERNI” (*)
N. 1 – Luigi Einaudi: Teoria economica e legislazione sociale nel testo delle Lezioni,byAlbertoBaffigi(September2009).
N. 2 – European Acquisitions in the United States: Re-examining Olivetti-Underwood Fifty Years Later,byFedericoBarbielliniAmidei,AndreaGoldsteinandMarcellaSpadoni(March2010).
N. 3 – La politica dei poli di sviluppo nel Mezzogiorno. Elementi per una prospettiva storica,byElioCerrito(June2010).
N. 4 – Through the Magnifying Glass: Provincial Aspects of Industrial Grouth in Post-Unification Italy,byCarloCiccarelliandStefanoFenoaltea(July2010).
N. 5 – Economic Theory and Banking Regulation: The Italian Case (1861-1930s), byAlfredoGigliobiancoandClaireGiordano(November2010).
N. 6 – A Comparative Perspective on Italy’s Human Capital Accumulation,byGiuseppeBertolaandPaoloSestito(October2011).
N. 7 – Innovation and Foreign Technology in Italy, 1861-2011, byFedericoBarbielliniAmidei,JohnCantwellandAnnaSpadavecchia(October2011).
N. 8 – Outward and Inward Migrations in Italy: A Historical Perspective, by MatteoGomelliniandCormacÓGráda(October2011).
N. 9 – Comparative Advantages in Italy: A Long-run Perspective,byGiovanniFedericoandNikolausWolf(October2011).
N. 10 – Real Exchange Rates, Trade, and Growth: Italy 1861-2011,byVirginiaDiNino,BarryEichengreenandMassimoSbracia(October2011).
N. 11 – Public Debt and Economic Growth in Italy,byFabrizioBalassone,MauraFranceseandAngeloPace(October2011).
N. 12 – Internal Geography and External Trade: Regional Disparities in Italy, 1861-2011,byBrianA’HearnandAnthonyJ.Venables(October2011).
N. 13 – Italian Firms in History: Size, Technology and Entrepreneurship, by FrancoAmatori,MatteoBugamelliandAndreaColli(October2011).
N. 14 – Italy, Germany, Japan: From Economic Miracles to Virtual Stagnation,byAndreaBoltho(October2011).
N. 15 – Old and New Italian Multinational Firms,byGiuseppeBertaandFabrizioOnida(October2011).
N. 16 – Italy and the First Age of Globalization, 1861-1940,byHaroldJamesandKevinO’Rourke(October2011).
N. 17 – The Golden Age and the Second Globalization in Italy, by Nicholas Crafts andMarcoMagnani(October2011).
N. 18 – Italian National Accounts, 1861-2011,byAlbertoBaffigi(October2011).N. 19 – The Well-Being of Italians: A Comparative Historical Approach, by Andrea
BrandoliniandGiovanniVecchi(October2011).N. 20 – A Sectoral Analysis of Italy’s Development, 1861-2011,byStephenBroadberry,
ClaireGiordanoandFrancescoZollino(October2011).N. 21 – The Italian Economy Seen from Abroad over 150 Years, by Marcello de Cecco
(October2011).N. 22 – Convergence among Italian Regions, 1861-2011, by Giovanni Iuzzolino, Guido
PellegriniandGianfrancoViesti(October2011).N. 23 – Democratization and Civic Capital in Italy, by Luigi Guiso and Paolo Pinotti
(October2011).N. 24 – The Italian Administrative System since 1861, by Magda Bianco and Giulio
Napolitano(October2011).N. 25 – The Allocative Efficiency of the Italian Banking System, 1936-2011, by Stefano
Battilossi,AlfredoGigliobiancoandGiuseppeMarinelli(October2011).N. 26 – Nuove serie storiche sull’attività di banche e altre istituzioni finanziarie dal 1861 al
2011: che cosa ci dicono?,byRiccardoDeBonis,FabioFarabullini,MiriaRocchelliandAlessandraSalvio(June2012).
N. 27 – Una revisione dei conti nazionali dell’Italia (1951-1970),byGuidoM.Rey,LuisaPicozzi,PaoloPiselliandSandroClementi(July2012).

Printed by the Printing and Publishing Division
of the Bank of Italy