()~qis, - universiti putra...
TRANSCRIPT

Pertanika 15(3),225-235 (1992)
Limestone, Gypsum, Palm Oil Mill Effluent and Rock Phosphate Effects onSoil Solution Properties of Some Malaysian Ultisols and Oxisols
J. SHAMSHUDDIN\ 1. JAMILAHI, HAH. SHARIFUDDINI and L.C. BELL 2
IDepartment of Soil Science, Faculty of Agriculture,UPM 43400, Serdang, Selangor Darul Ehsan, Malaysia
2Department of Agriculture, University of Queensland, Qld 4072, Australia
Keywords: ultisoIs, ()~qIs, ameliorant, acidity, pH, aluminium, calcium, magnesium, manganese
ABSTRAK
Tanah Ultisol dan Oksisol di Malaysia dicirikan oleh pH yang rendah, tepuan Al yang tinggi, KPKE yang rendahdan kekurangan Ca dan/atau Mg. Ini menghadkan pengeluaran tanaman bermusim. Satu kajian berpasu telahdijalankan untuk menilai perubahan kimia fasa larutan tanah daripada beberapa tanah Ultisol dan Oksisol selepasdirawat dengan batu kapuT, gipsum, efluen kilang kelapa sawit dan fosfat batuan. Keputusan kajian menunjukkanbahawa 2-4 batu kapur/ha diperlukan untuk meningkat pH, Ca, Mg dan SO/, dan menurunkan Al dan Mndi dalam larutan tanah ke tahap yang sesuai. Rawatan eJluen kelapa sawit dengan kadar 0.5 -1.0 t/ha (equivalenkapur) memberi kesan pengapuran sama seperti batu kapur. Rawatan gipsum meningkatkan kepekatan Al, tetapiapabila rawatan bertambah kebanyakan Al wujud di dalam bentuk AISO/. Rawatan tanah siri RPngam, Bungordan siri Prang dengan gipsum denga'(t kadar 1t/ha telah mengurangkan pAl OHS0
4kepada 17. Ini menunjukkan
jurbanit boleh terbentuk di dalam tanah Ultisol dan Oksisol setelah dirawat dengan gipsum.
ABSTRACT
Ultisols and Oxisols in Malaysia are characterized by low pH, high Al saturation, low ECEC and Ca and/or Mgdeficiencies, which are limiting to annual crop production. A pot experiment was conducted to assess the chemicalchanges in the properties of the soil solution phase of soils of some representative Ultisols and Oxisols followingapplication of limestone, gypsum, palm oil mill eJJluent and rock phosphate. The results showed that 2-4 t limestone/ha were needed to increase pH, Ca, Mg and SO/, and to reduce Al and Mn to an acceptable level in the soilsolution. Palm oil mill eJJluent application at 0.5-1 t/ha (lime equivalent) gave similar liming effects to those oflimestone. Gypsum application increased Al concentration, but at high rate of application the Al existed mainly inthe form of AISO/. Gypsum application in RPngam, Bungor and Prang series soils at 1 t/ha reduced pAIOHS0
4to 17, suggesting that jurbanite can be formed in Ultisols and Oxisol when gypsum is applied.
INTRODUCTION
Ultisols and Oxisols occupy about 72% of Malaysia (IBSRAM 1985) and are acid and highly weathered, with the variable charge minerals such askaolinite, gibbsite and/or goethite dominatingthe clay fraction (Tessens and Shamshuddin1983). Additionally, the soils have low cation exchange capacities (CEe) , high Al activity and aredeficient in Ca and/or Mg, and low in availablephosphate which are limiting to maize and groundnut production on these soils (Shamshuddin et al.1991; Zaharah et at. 1982). It is important todelineate ameliorants which can be used economically to increase CEC and Ca, Mg and P
availability and decrease phytotoxic Al. Potentialameliorants available in Malaysia include dolomiticlimestone, rock phosphate, gypsum, and palm oilmill effluent. Little is known of the ability of thesematerials to ameliorate acid soil infertility inMalaysian soils. The objective of this paper was toassess the chemical changes in the properties ofthe solution phase of samples of some representative Malaysian Ultisols and Oxisols following application of various rates of limestone, gypsum,rock phosphate and palm oil mill effluent; changesof interest include those properties important forcrop growth such as pH, bases and Al species.

J. SHAMSHUDDIN, 1. JAMllAH, H.A.H. SHARIFUDDIN & L.C. BELL
MATERIALS AND METHODS
Soils
Six soil series which are very widespread in theupland areas of Peninsular Malaysia were selectedfor the study. The soils were Rengam (Kandiudult),Bungor (Paleudult), Serdang (Paleudult),Munchong (Hapludox), Katong (Hapludox) andPrang series (Acrudox). Relevant chemical properties of the six soils are given in Table 1. Detailmineralogy and charge properties of these soilshave already been reported (Tessens andShamshuddin 1982; Tessens and Shamshuddin1983); major minerals in the clay fraction of thesoils are kaolinite, gibbsite and/or goethite. Soilsamples for the study were taken from the surface(0-15 cm) and subsoil (30-45 cm). Only the topsoilswere used for the pot trials.
Experimental
Air-dried surface soil (0-15 cm, < 2mm) from eachof the Rengam, Bungor, Serdang, Munchong,Katong and Prang series was mixed with groundmagnesium limestone (GML), gypsum, palm oilmill effluent (POME) and rock phosphate (carbonate rock phosphate) as a precursor to a glasshouse trial to assess the response of maize to thevarious ameliorants. Results of the plant responsewill be the subject of a subsequent paper. Therates of application were 0, 0.5, 1.0, 2.0, 4.0 and
8.0 t/ha calculated on the basis of lime equivalent. The elemental composition of the GML,gypsum, POME and rock phosphate is given inTable 2. The pot trial involved equilibrating theameliorants and basal nutrients (180 kg N/ha asurea, 150 kg P/ha as superphosphate and 75 kgK/ha as muriate of potash) for 30 days prior tothe growth of maize for 30 days. The soils werekept moist at field capacity by adding distilledwater. Mter harvest the soils in the pots were airdried, well mixed and subsampled for laboratoryanalysis.
Soil Analysis
Some of the untreated soil samples were taken tothe laboratory for determination of basic chemical properties (Table I), where pH in water (1:2.5)and in CaC12 (I:1) was determined after I h ofintermittent shaking and being left to stand overnight. Basic exchangeable cations were extractedby I M NHpAC buffered at pH 7; Ca and Mgwere determined by atomic absorption spectrophotometry, while K and Na were determinedby flame photometry. Al was extracted by 1 M KCIand determined colorimetrically (Barnhisel andBertsch 1982). Free iron oxide was determined bythe method of Mehra and Jackson (1960), whileorganic carbon was estimated by the WalkleyBlack method (Nelson and Sommers 1982). Clay
TABLE 1Relevant chemical properties of surface soils (0 - 15 cm) ofRengam, Bungor,
Munchong, Katong, Serdang and Prang Series
pH Exchangeable CationsSeries ECEC Al.Sat. Fe
20 s Org.C Clay
Hp CaC12 Ca Mg K Na Al
(1:2.5) (1:1 ) cmol (+)/kg %
Serdang 5.23 4.70 1.79 1.00 0.16 0.05 0.77 3.77 20 4.4 1.68 47
Bungor 4.29 4.09 1.05 0.30 0.22 0.02 4.02 5.16 72 3.6 1.95 25
Rengam 4.97 4.39 1.05 0.20 0.18 0.03 2.68 4.14 65 1.2 2.13 41
Munchong 4.68 4.12 0.26 0.17 0.09 0.02 1.76 2.30 77 5.0 1.27 81
Katong 4.87 4.20 0.17 0.17 0.12 0.05 1.32 1.83 72 8.0 2.50 87
Prang 4.39 3.90 0.03 0.05 0.05 0.02 1.58 1.73 91 9.1 1.16 81
226 PERTANlKA VOL. 15 NO.3, 1992
SOIL SOLUTION PROPERTIES OF ULTISOLS AND OXISOLS
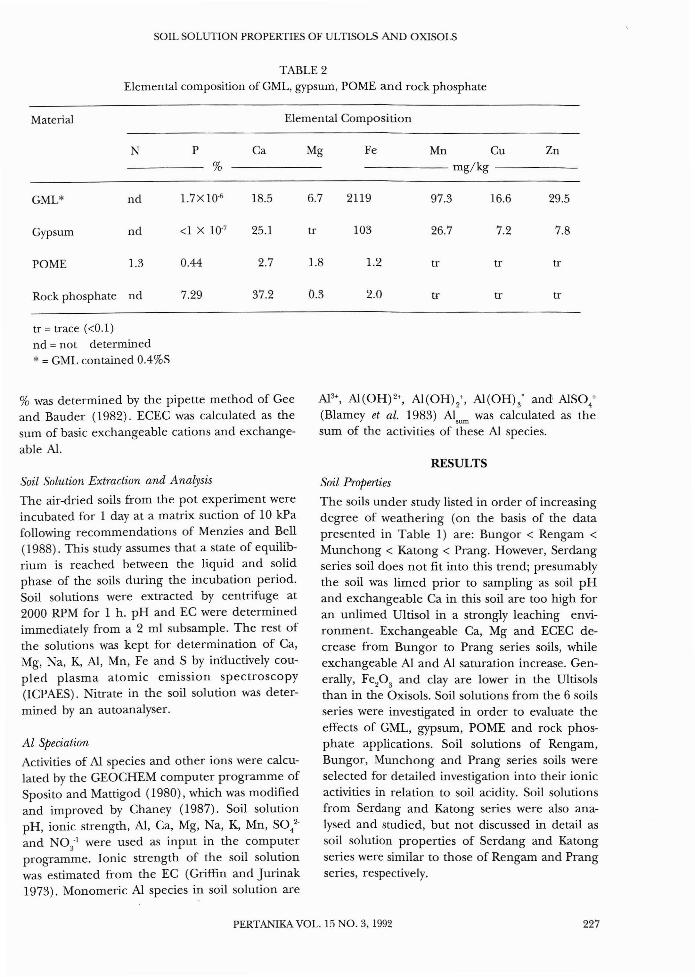
TABLE 2Elemental composition of GML, gypsum, POME and rock phosphate
Material Elemental Composition
N P Ca Mg Fe Mn Cu Zn% mg/kg
GML* nd 1.7X 10⁻⁶ 18.5 6.7 2119 97.3 16.6 29.5
Gypsum nd <1 X 10⁻⁷ 25.1 tr 103 26.7 7.2 7.8
POME 1.3 0.44 2.7 1.8 1.2 tr tr tr
Rock phosphate nd 7.29 37_2 0.3 2.0 tr tr tr
tr = trace «0.1)nd = not determined* = GML contained 0.4%5
% was determined by the pipette method of Geeand Bauder (1982). ECEC was calculated as thesum of basic exchangeable cations and exchange
able Al.
Soil Solution Extraction and Analysis
The air-dried soils from the pot experiment wereincubated for 1 day at a matrix suction of 10 kPafollowing recommendations of Menzies and Bell(1988). This study assumes that a state of equilibrium is reached between the liquid and solidphase of the soils during the incubation period.Soil solutions were extracted by centrifuge at2000 RPM for 1 h. pH and EC were determinedimmediately from a 2 ml subsample. The rest ofthe solutions was kept for determination of Ca,Mg, Na, K, Al, Mn, Fe and S by inauctively coupled plasma atomic emission spectroscopy(ICPAES). Nitrate in the soil solution was determined by an autoanalyser.
Al Speciation
Activities of Al species and other ions were calculated by the GEOCHEM computer programme ofSposito and Mattigod (1980), which was modifiedand improved by Chaney (1987). Soil solutionpH, ionic strength, Al, Ca, Mg, Na, K, Mn, S042and N03-
1 were used as input in the computerprogramme. Ionic strength of the soil solutionwas estimated from the EC (Griffin and Jurinak1973). Monomeric Al species in soil solution are
Al3+, Al(OH)2+, Al(OH)2+' Al(OH)3· and AlSO/(Blarney et al. 1983) Al
sumwas calculated as the
sum of the activities of these Al species.
RESULTS
Soil Properties
The soils under study listed in order of increasingdegree of weathering (on the basis of the datapresented in Table 1) are: Bungor < Rengam <Munchong < Katong < Prang. However, Serdangseries soil does not fit into this trend; presumablythe soil was limed prior to sampling as soil pHand exchangeable Ca in this soil are too high foran unlimed Ultisol in a strongly leaching environment. Exchangeable Ca, Mg and ECEC decrease from Bungor to Prang series soils, whileexchangeable Al and Al saturation increase. Generally, Fep3 and clay are lower in the Ultisolsthan in the Oxisols. Soil solutions from the 6 soilsseries were investigated in order to evaluate theeffects of GML, gypsum, POME and rock phosphate applications. Soil solutions of Rengam,Bungor, Munchong and Prang series soils wereselected for detailed investigation into their ionicactivities in relation to soil acidity. Soil solutionsfrom Serdang and Katong series were also analysed and studied, but not discussed in detail assoil solution properties of Serdang and Katongseries were similar to those of Rengam and Prangseries, respectively.
PERTANlKA VOL. 15 NO.3, 1992 227

J. SHAMSHUDDIN, I.JAMILAH, H.A.H. SHARIFUDDIN & L.C. BELL
Effects of GML
Data in Table 3 show that application of 4 t (Table 4). Bungor series soil is more acid than
GML/ha in Rengam series soil increased soil Rengam, shown by a higher exchangeable AI in
solution pH from 4.1 to 5.5, Ca from 559 to 1498 Bungor series (Table 1), thus more GML is needed
JlM and Mg from 206 to 1615 JlM, respectively. to increase soil solution pH in Bungor than in
GML application at 2 t/ha increased SO42. con- Rengam series (Table 5 ). AI3+ activity in Bungor
centration from 235 to 483 JlM, but reduced AI series was decreased from 21 to 4 JlM by the
concentration from 23 to 13 JlM. The increase in application of 2 t GML/ha (data not presented).
S042. concentration was due partly to the addition Soil solution pH of Munchong series was low,
of S from GML (Table 2) and partly to replace- with a value of 3.6 in the control (Table 6). This
ment of SO42. by OH'. AI3+ and Mn2+ activities were value increased to 4.6 by application of 4 t GML/
reduced from 9 to 4 JlM and from 8 to 4 JlM, ha. GML application at this rate reduced AI con-
respectively, by the application of 2 t GML/ha centration from 56 to 14 uM and reduced Mn
TABLE 3Concentration of cations and anions in the soil solution ofRengam series soil as affected by GML,
gypsum, POME and rock phosphate application
Treatment Rate pH EC Al Ca Mg K Na Fe Mn SO;' N03"
(t/ha) (dS/m) 11M
GML 0 4.11 1.23 23 559 206 340 5712 1.8 11 235 17680.5 4.39 1.16 13 477 258 245 5902 0.7 7 420 16361.0 4.42 1.13 12 608 492 197 5724 0.9 8 321 18872.0 4.49 1.20 13 685 553 212 5370 0.5 6 483 16534.0 5.53 1.54 13 1498 1615 247 6166 0.5 7 716 22898.0 6.63 1.73 12 2392 3177 259 5645 0.1 2 1802 2276LSD 0.78 0.06 5 665 812 131 1045 1.1 6 217 836
Gypsum 0 4.48 1.31 24 332 150 286 5169 1.2 10 271 18120.5 4.30 1.16 19 598 119 237 5393 1.0 8 601 985
1.0 4.08 1.23 26 1011 164 213 5539 1.5 11 3517 417
2.0 4.00 2.03 91 3949 375 363 5987 5.8 29 7953 3514.0 4.10 2.80 159 9410 543 291 6267 10.7 45 12546 239
8.0 4.03 3.22 141 10656 618 311 6336 10.9 51 14272 184
LSD 0.52 0.23 31 493 61 111 1479 2.0 6 1486 379
POME 0 4.86 1.27 45 706 287 455 7945 9.0 13 275 2637
0.5 6.17 1.97 30 3344 3644 378 8415 0 12 647 40171.0 6.57 2.48 23 4586 6032 366 6410 0 5 1663 4724
2.0 7.08 3.25 28 7349 9288 517 6651 0 3 3216 7629
4.0 7.60 4.57 32 11521 12716 760 5659 0 2 4408 9197
8.0 7.42 5.54 35 14667 15269 977 5458 0 3 6967 11301LSD 0.42 0.69 18 2177 1835 176 1337 8.1 6 808 2780
Rock phosphate 0 4.91 1.03 28 297 105 281 5820 1.4 5 567 1088
0.5 5.09 0.85 25 264 74 214 5322 2.0 5 530 966
1.0 5.13 0.91 21 297 79 239 6007 1.7 4 483 992
2.0 5.19 0.84 19 426 93 217 5423 2.1 5 541 610
4.0 5.36 0.92 26 542 94 167 6508 1.8 4 1047 806
8.0 5.53 0.92 18 532 98 199 5545 1.5 4 986 706
LSD 0.52 0.25 8 39 48 99 1513 2.2 3 513 553
228 PERTANlKA VOL. 15 NO.3, 1992

SOIL SOLUTION PROPERTIES OF ULTISOLS AND OXISOLS
TABLE 4Activities of AI and Mn species in the soil solution of Rengam, Munchong and Prang series
Treatment Rate(t/ha) AI,um
Activities (J.IM)Al3+ AlSO: Mn2+ Aloum Al3+ AlS0
4+ Mn2+ AI,um Al3+ AlS0
4+ Mn2+
GML
Gypsum
POME
Rock phosphate
o0.51.02.04.08.0
o0.51.02.04.08.0
o0.51.02.04.08.0
o0.51.02.04.08.0
13879
1212
151217538574
322923253029
232116171216
Rengarn
9 24 24 14 2
<1 <1<1 <1
7 24 64 128 44
10 738 65
7 2<1 <1<1 <1<1 <1<1 <1<1 <1
4 22 11 <1
<1 <1<1 <1<1 <1
Munchong
8 24 22 25 21 18 26 18 14 24 8 6 14 7 3 11 6 <1 <1
7 40 34 35 19 13 56 36 23 10
12 33 15 1715 49 9 3917 65 6 50
9 32 27 3773 23 13 <1 <11 14 <1 <11 17 <1 <11 21 <1 <1
4 21 17 24 29 25 33 17 15 24 15 12 23 9 7 23 8 6 2
205 25207 13180 11123 958 7
9 9
269 15210 28196 39177 65225 81198 78
234 1839 13
8 131 231 231 12
15 15201 13149 14156 16105 16107 14
Prang
127542
<1
9101012
97
852
<1<1<1
8.2
<1<1<1<1
11 145 85 104 94 5
<1 1
6 1115 1528 1550 2071 2470 26
7 107 86 3
<1 <1<1 <1<1 <1
5 141 10
<1 8<1 6<1 6<1 5
concentration from 305 to 99 11M. However, Caand Mg concentrations increased from 577 to2964 11M and from 302 to 2175 11M, respectively.AI3+ activity was reduced from 22 to 3 11M andMn2+ activity was reduced from 205 to 58 11M byapplication of 4 t GML/ha (Table 4). GML application at 4 t/ha or less alleviates AI3+ toxicity, butdoes not alleviate Mn2+ toxicity in the soil.
Likewise, soil solution of Prang series is acid,with pH of 3.8 (Table 7). This value was increasedto 4.2 by the application of 4 t GML/ha. GMLapplication at this rate reduced AI and Mn concentrations from 42 to 11 11M and from 21 to 911M, respectively. On the other hand, Ca and Mgconcentrations increased from 191 to 1447 11Mand from 109 to 2126 11M, respectively. It was alsoobserved that S042- concentration increased from950 to 2786 11M by GML application at that rate.However, it needed only 2 t GML/ha to reduceAI3+ activity from 12 to 4 11M (Table 4).
Effects of Gypsum
Increasing level of gypsum application increasedthe concentration of AI, Ca, Mg, Na, Mn and S042.
in the six soil solutions of the soils under study. Inthe Rengam series application of 8 t gypsum/haincreased AI concentration from 24 to 141 11M(Table 3), while in Bungor series AI concentration increased from 88 to 652 11M (Table 5). Thecorresponding increase in the AI concentrationof Prang series soil was from 25 to 158 11M (Table7). Mn concentration in the soil solutions ofRengam and Prang series increased from 10 to 5111M and from 17 to 89 11M, respectively by application of 8 t gypsum/ha. Mn concentration in thesoil solution of Munchong series was very high,with a value of 409 11M (Table 6) and this valueincreased further with gypsum application. Insome soils it was also observed that Mg and Naconcentrations increased significantly by gypsum
PERTANlKA VOL. 15 NO.3, 1992 229

J. SHAMSHUDDIN, I.]AMlLAH, H.A.H. SHARIFUDDIN & L.G. BELL
TABLE 5Concentration of cations and anions in the soil solution of Bungor series soil as affected by GML,
gypsum, POME and rock phosphate applications.
Treatment Rate pH EC Al Ca Mg K Na Fe Mn SO.2- NOg-
(t/ha) (dS/m) ~M
GML 0 4.16 1.66 71 1662 922 476 6032 4.0 16.9 281 22920.5 4.32 1.73 54 1702 1178 440 920 2.8 14.3 316 21691.0 4.33 1.64 35 1729 1364 407 1644 2.1 12.2 393 24242.0 4.50 1.85 33 2518 2389 529 8044 1.4 14.0 455 31374.0 5.06 2.15 26 3191 3596 415 5062 1.0 9.5 791 40458.0 5.35 2.31 14 4372 5742 447 3542 0.9 6.3 1689 4921LSD 0.29 0.40 25 725 818 182 4210 0.9 3.4 247 907
Gypsum 0 4.24 2.25 88 1800 1052 574 31I0 4.9 35.9 239 34920.5 4.31 1.84 1I3 2227 875 416 8743 3.2 17.1 1292 25891.0 4.14 2.64 330 61I9 1918 951 3000 6.7 39.8 2187 38042.0 4.31 2.65 317 6979 1556 492 9688 6.0 32.6 8552 21914.0 4.20 3.70 595 15452 2310 507 10593 9.0 51.2 22641 14148.0 4.30 4.25 652 17568 2746 588 13093 8.7 61.6 22965 1755LSD 0.19 0.70 130 2305 684 367 3744 2.7 20.3 1721 1089
POME 0 4.54 1.72 98 1790 962 429 8975 4.9 17.3 335 26880.5 4.69 2.33 61 3186 2958 424 9526 2.5 15.2 756 40631.0 4.98 3.61 57 6397 7433 636 9004 2.5 19.2 1447 68172.0 5.28 6.14 64 18552 17955 819 9700 2.1 19.2 2979 140644.0 5.76 1O.1I 81 23638 31641 1330 9639 2.0 15.0 6774 221668.0 5.93 13.34 92 35600 47787 2170 8172 2.0 12.6 13142 32533LSD 0.29 1.54 23 3494 4981 195 1I08 0.7 5.8 741 2863
Rock Phosphate 0 4.23 1.70 93 1587 788 468 8357 4.4 15.4 277 24700.5 4.21 1.83 94 1860 863 531 9120 4.6 16.6 289 26571.0 4.26 1.89 85 1919 881 515 9059 3.2 16.8 296 27032.0 4.34 1.94 90 2164 894 465 10031 3.6 16.8 331 27584.0 4.35 1.96 86 2771 930 365 10115 2.6 16.5 452 27818.0 4.53 1.82 66 3329 982 307 8798 1.5 16.2 578 2766LSD 0.16 0.35 36 837 272 97 1411 2.1 5.1 66 457
application due to replacement of Na and Mg byCa from the gypsum (data not presented).
There was no clear trend in the change ofAP+ with increasing rate of gypsum application. Inall the four soils Apt activity increased and laterdecreased with increasing level of gypsum application (Table 4). However, AlS0
4t and Alsum ac
tivities increased significantly with increasingrate of gypsum application.
There was no significant pH change in thesoil solutions of Rengam and Bungor series bygypsum application, but EC increased from 1.31to 3.22 dS/m and from 2.25 to 4.25 dS/m, respectively by application of 8 t gypsum/ha. The corresponding EC increases in the soil solutions ofMunchong and Prang series were from 1.83 to
3.06 dS/m and from 2.11 to 4.63 dS/m, respectively.
Effects of POME
POME application increased soil solution pH andEC significantly. In the Rengam series pH increased from 4.86 to 6.17 by application of 0.5 tPOME/ha (Table 3). This same rate of POMEapplication did not increase soil solution pH ofBungor and Prang series (Table 5, 7). Applicationof 1 t POME/ha in Bungor and Prqng seriesincreased soil solution pH from 4.54 to 4.93 andfrom 4.21 to 4.72, respectively. EC of Bungorseries increased from 1.72 to 13.34 dS/m byapplication of 8 t POME/ha; this has importantmanagement implications.
230 PERTANlKA VOL. 15 NO.3, 1992

SOIL SOLUTION PROPERTIES OF ULTISOLS AND OXISOLS
TABLE 6Concentration of cations and anions in the soil solution of Munchong series soil as affected by GML,
gypsum, POME and rock phosphate applications
Treatment Rate pH EC AI Ca Mg K Na Fe Mn So/' N03'
(tjha) (dS/m) J.lM
GML 0 3.63 1.68 56 577 302 453 7456 0.9 305 107 25250.5 3.50 1.66 49 920 722 393 7679 1.3 319 123 25561.0 3.96 1.52 38 982 695 243 6533 0.7 268 127 23902.0 4.06 1.76 20 1504 1558 285 6532 0.4 197 195 27644.0 4.59 2.16 14 2964 2175 362 6718 0 99 583 36108.0 6.03 2.50 17 3801 5376 311 5943 0 19 2988 3800LSD 0.77 0.58 27 1500 663 209 1694 0.7 99 518 1265
Gypsum 0 3.84 1.83 94 704 357 618 8265 1.9 409 115 26960.5 3.88 1.76 53 930 229 329 6961 1.4 329 756 23071.0 4.04 1.69 79 2205 292 332 7461 2.3 355 513 23972.0 3.75 1.84 64 2584 264 271 7631 3.7 311 1433 23524.0 3.84 3.00 96 8808 474 301 8379 3.0 562 7842 27328.0 3.70 3.66 116 15452 505 230 7472 2.2 641 17741 1940LSD 0.58 0.57 72 1799 187 221 2290 2.1 207 1773 880
POME 0 3.65 1.87 72 694 384 607 8487 3.5 354 130 25490.5 4.47 1.66 13 1864 2123 214 6335 0 66 812 26871.0 5.89 2.04 14 3089 4214 284 5713 0 16 3392 33122.0 7.36 3.31 16 6809 8640 432 4618 0 3 6511 45224.0 7.42 4.38 20 9445 11600 600 4378 0 3 8432 67608.0 7.45 6.29 25 13684 15650 911 4363 0.1 4 10831 10542LSD 1.00 0.51 21 967 1166 94 698 1.0 73 1018 1218
Rock phosphate 0 3.27 1.65 42 391 198 467 7195 2.9 218 147 23160.5 3.47 1.73 65 795 285 400 7632 1.6 305 116 25561.0 3.38 1.58 36 720 207 342 6904 1.6 218 138 24322.0 3.60 1.70 31 1142 229 323 7313 1.6 235 176 24234.0 3.47 1.57 21 1709 224 210 7094 1.5 164 387 22608.0 3.50 1.73 19 2360 253 231 7145 0.7 175 503 2437LSD 0.41 0.21 14 364 58 III 781 1.3 58 46 430
Ca and Mg concentrations in the soil solutions of Rengam, Bungor, Munchong and Prangseries increased significantly by application of 0.5t POME/ha (lime equivalent) .But concentrationsof N0
3' and sot only differed significantly from
the control by application of 1.0 t POME/ha.POME application at the rate of 1.0 t/ha reducedMn and Al concentrations in Munchong seriesfrom 354 to 16 ~M and from 72 to 14 ~M,
respectively (Table 6).It needed 0.5 t POME/ha to reduce Al3+
activity in the soil solution of Rengam andMunchong series to < 4 ~M (Table 4). For Prangseries, 1 t POME/ha was needed to reduce Al3+
activity to the same level.
Effects of Rock Phosphate
Rock phosphate application increased soil solution pH of Rengam and Prang series, but did notchange soil solution pH of Bungor and Munchongseries. There was a decreasing trend in the valueof EC, Al and N0
3' with increasing rate of rock
phosphate application in the soil solution ofRengam and Prang series. Conversely, Ca andS042. level increased with increasing level of rockphosphate application.
DISCUSSION
Alleviation of Soil Acidity
Al3+ is considered the most toxic Al species in soilsolution (Alva et al. 19S6a) and reduction in Al3+
PERTANIKA VOL. 15 NO.3, 1992 231

J. SHAMSHUDDIN, I.JAMllAH, H.A.H. SHARIFUDDIN & L.C. BELL
TABLE 7Concentration of cations and anions in the soil solution of Prang series soil as
affected by GML, gypsum, POME and rock phosphate applications
Treatment Rate pH EC Al Ca Mg K Na Fe Mn So/ N03"
(t/ha) (dS/m) ~M
GML 0 3.79 2.08 42 191 109 952 5944 3.9 21 950 25870.5 3.95 1.69 22 312 282 393 6093 3.2 13 804 19701.0 4.01 1.99 19 633 562 586 5590 2.8 16 1001 23062.0 4.00 1.94 15 780 590 596 5919 2.3 15 1149 22644.0 4.22 2.16 11 1447 2126 523 5287 0.1 9 2786 20978.0 6.12 2.89 10 3925 5737 642 4258 0 3 5424 3027LSD 0.34 0.58 6 710 1125 332 1099 2.1 7 556 745
Gypsum 0 3.69 2.11 25 155 83 917 5451 2.9 17 632 23190.5 3.91 2.30 43 720 103 730 6717 4.3 25 1700 24021.0 3.74 2.23 63 1338 117 536 6326 6.0 28 3237 18892.0 4.17 2.95 113 3542 185 674 8191 9.6 47 6039 22474.0 3.96 4.06 154 9471 284 952 9311 8.8 73 13449 21208.0 4.00 4.63 158 15699 345 667 10533 11.0 89 21219 1728LSD 0.30 0.47 36 2079 47 235 1117 2.4 11 2468 432
POME 0 4.21 2.05 31 262 105 506 8040 0.8 15 861 25180.5 4.17 2.67 29 3516 4504 313 9338 0.3 16 2316 43461.0 4.72 4.00 28 6737 9413 441 7342 0 6 5146 62602.0 6.91 4.84 24 10400 13164 621 6263 0.3 2 9257 73424.0 7.44 6.02 24 13331 15896 758 5683 0.3 1 10026 104718.0 7.58 7.00 13 15609 19402 997 5288 0.7 1 12690 11909LSD 0.87 1.02 4 1618 1152 162 1394 0.2 7 629 2362
Rock phosphate 0 4.11 2.13 25 282 220 1013 6515 4.5 22 652 28230.5 4.94 1.97 17 430 86 590 7610 1.5 16 761 23991.0 5.21 1.74 16 461 71 342 8266 1.7 12 933 19072.0 5.51 1.47 18 445 61 257 7307 2.4 9 1412 16564.0 5.68 1.82 18 1037 111 291 7922 1.5 11 1864 20238.0 5.62 1.44 16 1038 120 204 7251 1.4 9 2514 1118LSD 0.56 0.36 7 252 50 240 1702 2.6 7 502 512
TABLE 8Calculated ion-activity product values of soil solutions treated with gypsum'
Rate Basaluminite Alunite Jurbanite(t/ha) ( pAl4(OH)I'OS04) (pKAI3 (OH) 6 (SO4)2) (pAlOHS04)
Rengam Bungor Munchong Prang Rengam Bungor Munchong Prang Rengam Bungor Munchong Prang
O· 118 119 123 126 82 82 86 86 18 18 19 19
0.5 120 118 123 122 82 81 86 83 18 17 18 19
1.0 121 118 121 123 82 81 85 84 17 17 18 17
2.0 120 118 124 118 80 80 85 80 16 17 18 17
4.0 117 117 121 119 78 79 81 80 16 16 17 16
8.0 117 117 120 119 78 79 82 80 16 16 17 16
IReference: Basaluminite 117.7, Alunite 85.4 andJurbanite 17.8 (Hue et al. 1985)
232 PERTANlKA VOL. 15 NO.3, 1992

SOIL SOLUTION PROPERTIES OF ULTISOLS AND OXISOLS
activity in Ultisol by liming increases corn andgroundnut yields significantly (Shamshuddin etat. 1991). In this study it was observed that GMLapplication at the rate of 2-4 t/ha increased pH,Ca and Mg to a sufficient level for corn production. In the Rengam and Prang series soil AP+activity was reduced to 4 11M by application ofGML at this rate, making it suitable for soybeangrowth; critical AP+ activity for soybean is 4 11M(Bruce et at. 1988).
There are indications that Malaysian Ultisolsare deficient in Mg (Shamshuddin et at. 1991).Data in Table 3, 5, 6 and 7 suggest that Mgdeficiency can be alleviated by application of 2-4t GML/ha; the lime used in this experiment,which was manufactured locally, contains 6.7%Mg (Table 2).
Rock phosphate has a tendency to increasesoil solution pH, Ca and S042. concentrations. Itsliming effects are not as good as those of GML.Additionally, rock phosphate is too expensive touse as liming material to alleviate soil acidity.
Gypsum application increases Ca concentration in the soil solution. Ca, if present at anadequate level in the soil solution, helps reduceAl toxicity (Alva et at. 1986a). An increase inconcentration of S042. in soil solution of gypsumtreated soils may alleviate Al toxicity by formationofless phytotoxic Al-S04 complex. The toxicity ofAl may be further decreased by a reduction inactivity of Al3+ due to an increase in soil solutionionic strength in gypsum-treated soils.
It was observed that gypsum application increased Al concentration significantly, associatedwith an increase in ionic strength. The relationship between Al concentration (uM) and soilsolution (Iss) ionic strength (mM) is given by thefollowing equation:
But most of the Al present in the soil solutionat high rates of gypsum application is in the formof AlSO/ (Table 4) which is less phytotoxic thanAl3+ (Alva et at. 1986b).
POME gives comparative liming effects tothose of GML. Generally it needs 0.5 to 1.0 tPOME/ha (lime equivalent) to reduce Al and toincrease Ca and Mg concentrations to an acceptable level. In terms of real weight of POME,it isabout 3.5 to 7.0 t POME/ha; data in Table 2
suggest that GML contains 7 times more Ca thanPOME. However, POME applied at a high ratemay cause a temporary increase in EC, which mayaffect plant growth. An EC of 4 dS/m is considered detrimental to crop growth (Wong 1986).
POME is readily available in Malaysia; production of POME was 8-9 million tonnes yearly inthe early eighties (Chan et al. 1983). In the nineties, Malaysia is expected to produce about 6million tonnes of palm oil. Considering 3 tonnesof effluent are produced for every tonne of palmoil, Malaysian factories are now producing about18 million tonnes of effluent per year. N, P, Caand Mg concentrations in POME are reasonablyhigh (Table 2). POME is an organic matter thatcan detoxify Al by chelation (Tan and Binger1986). Zin et at. (1983) reported that POMEapplied in oil palm estates did not pollutegroundwater. The use of POME as a soilameliorant will not only lead to sustained foodcrop production, but also result in nutrient recycling and a safe environment.
Formation of At-hydroxy MineralS
GEOCHEM computer programme predicts thatincreases in soil solution pH resulting from GMLand POME application produce Al(OH)3' Curtinand Smillie (1983) believed that crystallineAl(OH)3 would not form by this process; thepresence of organic ligands in the soil solutionhamper crystallization of Al(OH)3 (Kwong andHuang 1979).
In the POME experiment Al concentrationwas not reduced to zero even though pH wasincreased to a value > 7 in some treatments. Atthis pH level the Al in the soil solution existed inthe form of Al(OH)3'
Table 8 gives the calculated ion-activityproduct of soil solution treated with gypsum. Thistable gives an indication of the possibility of Alhydroxy-sulfate formation in the soil solutiontreated with gypsum. It was observed that soilsolutions of Munchong and Prang series wereundersaturated with respect to basaluminite.However, appli~ation of 4 t gypsum/ha reducedpAI4(OH) lOS04 to 117, suggesting the soil solution was supersaturated with respect tobasaluminite.
Soil solutions of Rengam and Bungor serieswere supersaturated with respect to alunite aspKAl3(OH)6(S04)2 was less than 85.4, suggesting
PERTANIKA VOL. IS NO.3, 1992 233

J. SHAMSHUDDIN, I.JAMlLAH, H.A.H. SHARIFUDDIN & L.e. BELL
that alunite can be formed in this soil if environmental conditions are favourable for its formation. Application of 0.5 and 1.0 t gypsum/ha inthe soils of Prang and Munchong series, respectively, decreased pKAlg (OH) 6 (SO4) 2 to 85 or less,indicating that the solutions were thensupersaturated with respect to alunite. It took 4 tgypsum/ha to bring down pAlOHS0
4to 17 in
Munchong series soil and 1.0 t gypsum/ha inRengam and Prang series soils. In the Bungorseries soil only 0.5 t gypsum/ha was needed tolower pAlOHS0
4to 17.
It seems that Ultisols and Oxisols responddifferently to gypsum application (Table 8). Lessgypsum was needed in Ultisols than Oxisols tobring the solutions to supersaturation with respectto basaluminite, alunite and jurbanite. Thus, theseminerals are more likely to be precipitated inUltisols than Oxisols due to application of sulphurbearing amendments, such as gypsum and/orsulphate of ammonia.
It seems reasonable to suggest the formationof jurbanite in Oxisols and Ultisols is due togypsum application. This is in agreement withthat reported by Hue et al. (1985). Data in Table8 suggest that gypsum application at the rate of 8t/ha in Oxisols will not precipitate basaluminite.However, gypsum application may precipitatealunite in Oxisols, although Nordstrom (1982)argued that the formation of alunite is not likelyto occur in a short-term experiment.
CONCLUSION
Soil solution studies indicate that Ultisol andOxisol infertility factors can be alleviated by theapplication of palm oil mill effluent, which isavailable in large quantities in Malaysia. A rate of2-4 t GML/ha is required to alleviate soil acidityand Ca and/or Mg deficiencies in Ultisols andOxisols. However, 0.5-1 t POME/ha was found togive similar ameliorative effects to those of GMLapplication at 2-4 t/ha. Continuous application ofa sulphur-bearing amendment, such as gypsum,may result in the precipitation of jurbanite inthese soils.
ACKNOWLEDGEMENTS
We would like to record our appreciation toUniversiti Pertanian Malaysia, Australian Centrefor International Agricultural Research andMalaysian Agricultural Research and Development
Institute for financial and technical support during the conduct of this research.
REFERENCES
ALVA, A.K., CJ. AsHER and D.G. EDWARDS. 1986a. TheRole of Calcium in Alleviating Aluminium Toxicity. AustJ. Agric. Res. 37: 375-383.
ALVA, A.K., D.G. EDWARDS, CJ. AsHER and F.P.C.BlAJ\4EY. 1986b. Effects of Phosphorus/aluminiumMolar Ratios and Calcium Concentration onPlant Response to Aluminium Toxicity. Soil Sci.Am. J 50: 133-137.
BARNHISEL, R. and BERTSCH. 1982. Aluminium. InMethods ofSoil Analysis Part 2, ed. A.L. Page et al.2nd edn. p. 275-300. Agronomy Monog. 9. Madison, WI: ASA and SSSA.
BLAMEY, F.P.C., D.G EDWARDS and CJ AsHER. 1983.Effects of Aluminium, OH:Al and P:Al MolarRatios, and Ionic Strength on Soybean RootElongation in Solution Culture. Soil Sci. 136:197-207.
BRUCE, R.C., L.A. WARRELL, D.G. EDWARDS and L.C.BELL. 1988. Effects of Aluminium and Calciumin Soil Solution of Acid Soils on Root Elongation of Glycine max cv. Forest. Aust. J Agric Res.39: 319-338.
CHAt'!, K.W., T.C. P'NG and R. MOHD. AMINUDDIN.1983. Palm Oil Mill Effluent Utilization and itsFuture Research Directions in the Oil PalmIndustry. In Proc. Seminar on Land Application ofOil Palm Mill and Rubber Factory Effluents, ed.K.H. Lim et al. p. 23-45. Kuala Lumpur: MalaysianSociety of Soil Science.
CHANEY, R.F. 1987. Geochem, P.C 1.23. Beltsville,M.D: USDA-ARS, Soil Microbial Laboratory.
CURTIN, D. and G.W. SMILLIE. 1983. Soil SolutionComposition as Affected by Liming and Incubation. Soil Sci. Soc. Am. J 47: 701-707.
GEE, G.W. andJ.W. BAUDER 1982. Particle-size Analysis. In Methods of Soil Analysis Part 2, ed. A.L.Page et al. 2nd edn. p. 383-411. AgronomyMonog. 9. Madison, WI: ASA and SSSA.
GRIFFIN, R.A. and JJ. JURINAK. 1973. Estimation ofActivity Coefficient from Electrical Conductivityof Natural Aquatic Systems and Extracts. Soil Sci.115: 26-30.
HUE, T.V., F. ADAMS and C.E. EVANS. 1985. SulfateRetention by an Acid BE Horizon of an UltisoJ.Soil Sci. Soc. Am. J 49: 1196-1200.
IBSRAM. 1985. Report of the Inaugural Workshop andProposal for Implementation of the Acid Tropi-
234 PERTANlKA VOL. 15 NO.3, 1992

SOIL SOLUTION PROPERTIES OF ULTISOLS AND OXISOLS
cal Soils Management Network. Bangkok:IBSRAM. 40 p.
KWONG, N.K. and P.M. HUANG. 1979. Surface Reactivity of Aluminum Hydroxides Precipitated in thePresence of Molecular Weight Organic Acids.Soil Sci. Soc. Am.] 43: 1107-1113.
MEHRA, O.P. and M.L. JACKSON. 1960. Iron OxideRemoval from Soils and Clays by Dithionitecitrate System with Sodium Bicarbonate Buffer.Clays and Clay Minerals 7: 317-327.
MENZIES, N.W. and L.C. BELL. 1988. Evaluation of theInfluence of Sample Preparation and ExtractionTechnique on Soil Solution Composition. Aust.] Soil Res. 26: 451-464.
NELSON, D.W. and L.E. SOMMERS. 1982. Total Carbon,Organic Carbon and Organic Matter. In Methodsof Soil Analysis Part 2, ed. A.L. Page et al. 2ndedn. p. 359-579. Agronomy Monog. 9. Madison,WI: ASA and SSSA.
NORDSTROM, D.K. 1982. The Effect of Sulfate andAluminium Concentrations in Natural Waters:Some Stability Relations in the System AlP3S03-H20 at 298 K. Geochem. Cosmochin Acta 46:681-692.
SHAMSHUDDIN, J., I. CHE FAUZIAH and H.A.H.SHARJFUDDIN. 1991. Effects of Limestone andGypsum Applications to a Malaysian Ultisol onSoil Solution Composition and Yields of Maizeand Groundnut. Plant and Soil 134: 45-52.
SPOSITO, G. and S.V. MATIIGOD. 1980. Geochem: AComputer Program for Calculation of Chemical
Equilibria in Soil Solutions and Other NaturalWater Systems. Riverside: Kearney Foundationof Soil Science, University of California.
TAl, K.H. and A. BINGER. 1986. Effect of Humic Acidon Al Toxicity in Corn Plant. Soil Sci. 141: 20-25.
TESSENS, E. and J. SHAMSHUDDI T. 1982. CharacteristicsRelated to Charges in Oxisols of PeninsularMalaysia. Pedologie 32: 85-106.
TESSENS, E. and J. SHAMSHUDDIN. 1983. QuantitativeRelationship Between Mineralogy and Properties ofTropical Soils. UPM monograph. Serdang: UPMPress. 190p.
WONG, I.F.T.1986. Soil Crop Suitability Classification forPeninsular Malaysia. Kuala Lumpur: Ministry ofAgriculture Malaysia. 70p.
ZAHARAH, A.R., J. VANDERDEELEN and L. BAERT. 1982.Phosphorus Behavior in Some Limed andUnlimed Soils. In Proc. of the International Conference on Phosphorus and Potassium in the Tropics,ed. E. Pushparajah and HAH. Sharifuddin. p.61-79. Kuala Lumpur: Malaysian Society of SoilScience.
ZIN, Z.Z., MOHD. TAYEB DOLMAT, A.N. MA, K.H. YEaHand K.H. LIM. 1983. Monitoring and Environment Assessment - Water Quality. In Proc. Seminar on Land Application of Oil Palm Mill andRubber Factory Effluents, ed. K.H. Lim et at. p. 163179. Kuala Lumpur: Malaysian Society of SoilScience.
(Received 2 February 1992)
PERTANIKA VOL. 15 NO.3, 1992 235