qa/qc for local agencies and optimized aggregate gradations for
TRANSCRIPT

QA/QC for Local Agencies and Optimized Aggregate Gradations
for DM and S2M Concrete GradesMCA Local Concrete Seminar
October 4, 2016
Steve Waalkes, P.E.Director of Engineering – W. Mich.
Michigan Concrete Association

Agency QA PlanProvide the QA plan to QC Plan Administrator at least 5 days prior to the pre-production meeting. Make sure to note the QA strength test specimen size (6” x 12” or 4” x 8” cylinders).Also in plan:A. Personnel Requirements.
– Field inspectors– Persons obtaining QA samples and their qualifications (certification)
B. QA Testing Correlation.– Conduct side-by-side testing (QA & QC) of temperature & air content– Temperature within 2 degrees F– Air content within 0.8 percent
C. Laboratory Facilities.– Region testing lab? or Qualified facility under authority of Engineer

Acceptance• Who will do the acceptance testing?
– 2012 spec book / 12SP604(A) and (B)• Contractor performs QC • MDOT performs all QA (acceptance) sampling and testing
– Either in-house staff or consultant– Sampling:
• For concrete paving: Immediately in front of paver from the grade, or from chute if using ready-mix.
• For pumped concrete: After pump, if possible. If not, correlate air content and obtain sample at discharge of chute into pump hopper.
• Other: From chute of ready-mix truck.– As close to final location as practical

Acceptance• Initial acceptance criteria
– Slump– Air– Temperature
• Acceptance for payment– Compressive strength at 28-days
• Quality initiative (bonus) for PWL on air & strength (concrete paving only)– Opening to traffic flexural strength for full-depth pavement repairs
• QA verification for aggregate gradation
Also need initial QC/QA correlation, on startup

Dispute Resolution• If no contractor QC performed…then, no dispute
resolution is considered• No coring, nor NDT for acceptance
– Core results will not be mixed with fabricated cylinders– NDT only used to guide further corrective action

Quality Control Plans• A contractor quality control plan is the
documentation of the contractor’s process for delivering the level of construction quality required by the contract
• This is not just a testing plan, but instead needsto go beyond this and include the process!

Contractor Quality Control PlanA. Organization chartB. QC Plan Administrator and contact info.C. Names and credentials of QC staffD. Method for interaction between
production and QC personnel to engage in timely corrective action
E. Coordination activitiesF. Documentation, procedures, submittalsG. Project and plant specificsH. Concrete production facilities inspections
and certificationsI. Current testing equipment calibration
documentation including calibration factor
J. Testing and initial field curing facilities for QC and QA specimens
K. Stockpile management planL. Corrective action planM. Mixing time and transportation
N. Placement and consolidation methods including monitoring of vibration
O. Process for monitoring stability of air content of fresh concrete during placement and production
P. Hot and cold weather protection considerations and methods
Q. Control charts on action and suspension limits
R. Verification for non-deleterious alkali-reactivity
S. Mix design and JMFs (Job Mix Formula)T. Proposed lot size for JMF of concreteU. The frequency of sampling and testingV. Handling and protection of test specimensW. Methods to monitor construction equipment
loading and open to traffic strengths.X. Finishing and curing proceduresY. Ride quality controlZ. List of QC records to be submitted to
Engineer

Quality Control Plan• Contractor submits QC plan to the Engineer
for review 10 days before start of work. Do not place concrete before acceptance of the QC plan by the Engineer.It’s a plan to control the construction process and not
just a testing plan.
Quality Control Plan• After a QC Process Plan is established it
does not mean that as things or conditions change the plan cannot be changed.The plan must be flexible and adjusted to meet
existing conditions.
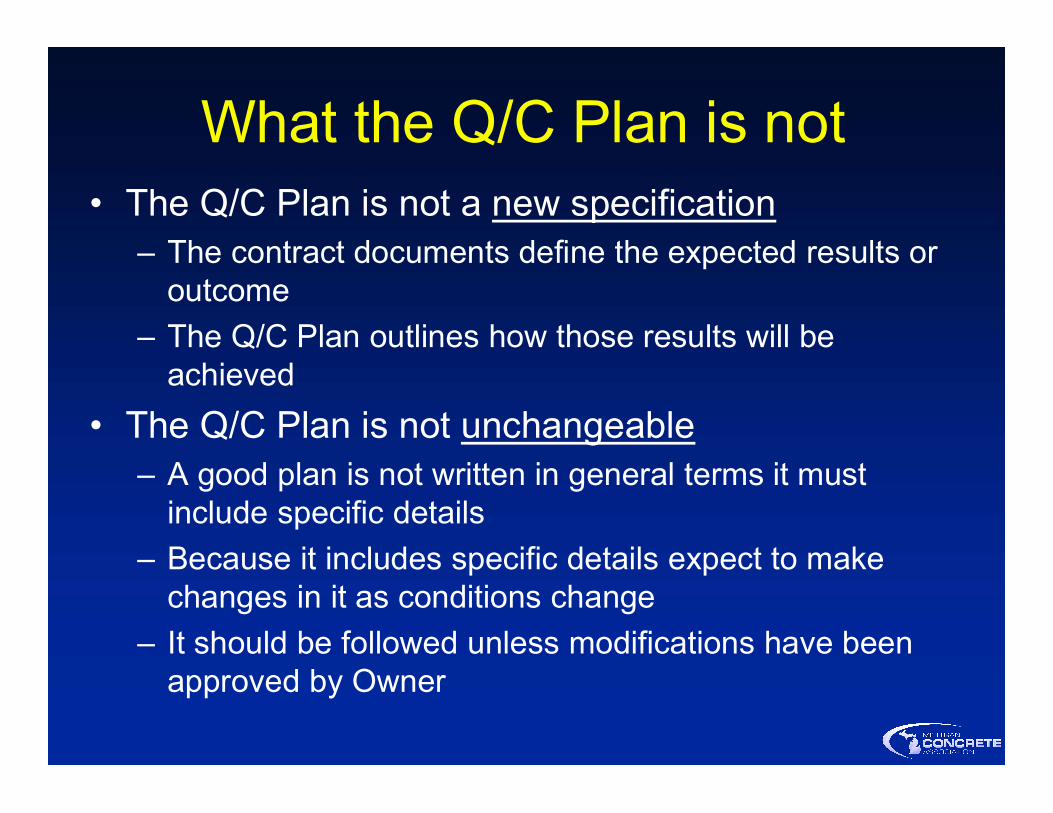
What the Q/C Plan is not• The Q/C Plan is not a new specification
– The contract documents define the expected results or outcome
– The Q/C Plan outlines how those results will be achieved
• The Q/C Plan is not unchangeable– A good plan is not written in general terms it must
include specific details– Because it includes specific details expect to make
changes in it as conditions change– It should be followed unless modifications have been
approved by Owner

What should a Q/C Plan contain• Detail of process – what you expect to see• List of personnel, equipment and anticipated production rates• Personnel assignments• List of tests with action and suspension limits• How you plan to document the quality of the work completed• How you plan to train the workforce

Approved Materials• Material Source Guide
– A contract document– Current revision in place at the
time of contractor’s bid is binding for the project
– Quarterly updates– Available on MDOT website at:
http://www.michigan.gov/mdot• Select:
– Reports, Publications & Specs– Publications– Manuals & Guides

Developing the Mix• Contractor provided mix designs and mixture
proportions– Supporting documentation– Methods of verification
• Method 1 – Trial batches: same materials used on project• Method 2 – Same mix: recent experience with same ingredients• Method 3 – Similar mix: similar aggregates, same cement/additives• Method 4 – Annual verification: concrete plant verification, same
materials
• All materials must be from MDOT approved sources


12SP604(A) & 12SP604(B)

MDOT Form 1976 (JMF Form)• Develop JMF (mix
proportions) according to ACI 211
• Aggregate bulk density now dry rodded, not shoveling (loose pour)– Density values up to
10% greater

Reviewing the Mix• Contractor submits mix documentation (Form 1976)
– 10 days prior to anticipated date of placement• Problems with submitted mix
– Incomplete packages will be returned without review• Annual verification – (ref. Method 4)
– Most common with ready-mixed concrete– Historically
• 2500 mixes generated by MDOT lab• Many were project specific
– Future• MDOT wants to get out of the mix design business
– Old mix proportion charts … new year• Readjust mix proportions with new physicals
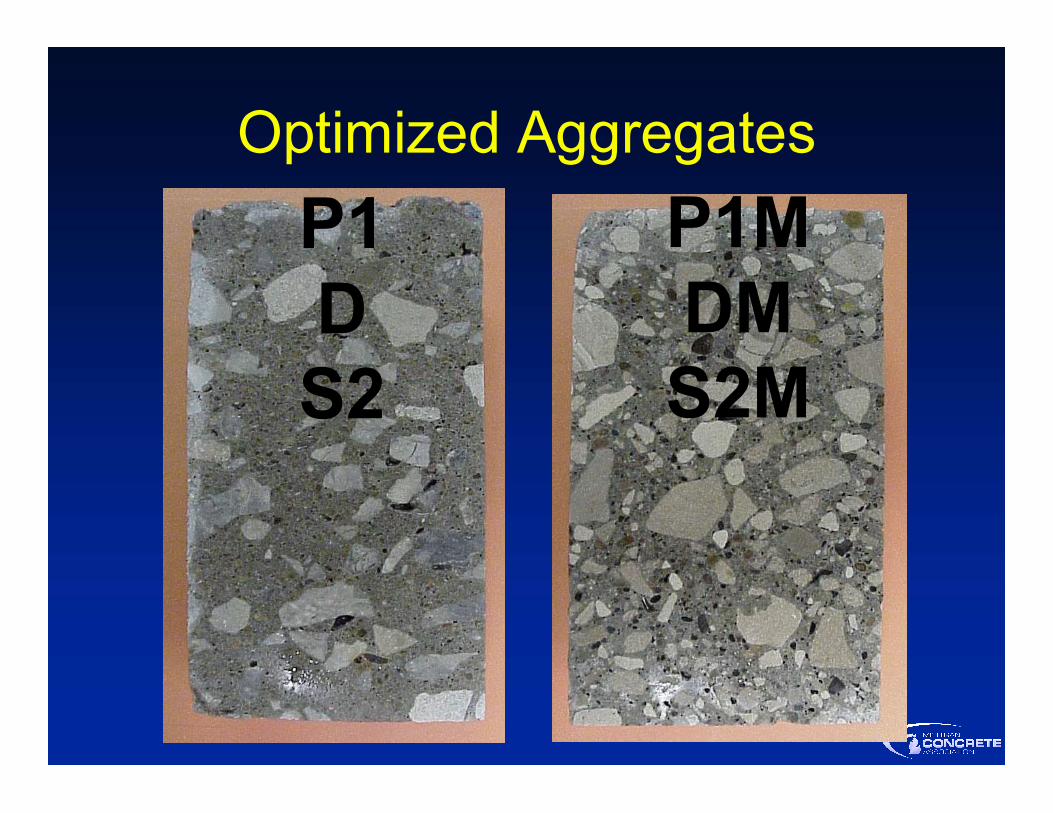
Optimized AggregatesP1DS2
P1MDMS2M

Goal of Optimized Aggregates• Reduce permeability
– Reduce mortar• Less shrinking• Cost savings related to less cementitious
• Better for pumping and finishing• Lower w-cm ratio• Greater durability

Improved FinishingLess Handwork
Better Barrier Walls
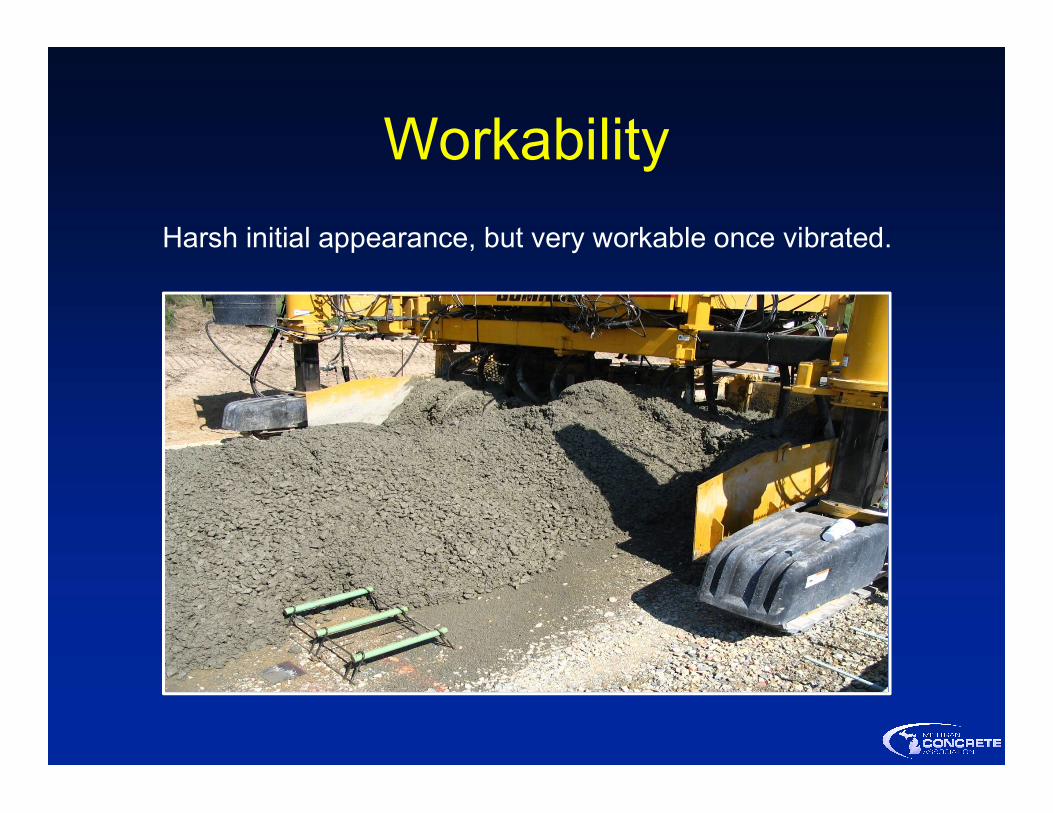
WorkabilityHarsh initial appearance, but very workable once vibrated.

MQAP Section 4.13• Does not specify MDOT gradation
series for aggregates– CA – retained on ½ inch sieve or greater– IA – retained on No. 4 and passing ½ inch– FA – passing No. 4 sieve
• Physical Requirements for each aggregate are located in subsection 902.03.C of the 2012 Spec Book

MQAP Section 4.13• Stockpile Management Plan
– Process controls for shipping, handling, and storage
• Two different max aggregate sizes– Pavements ≥ 6 inches = 2 inch max size– Pavements < 6 inches = 1½ inch max size– All other applications = 1½ inch max size

The “Shilstone” Method• Utilizes:
– Fineness Modulus– Power 0.45 Charts– Percent Retained Charts
• 5-15 or 8-18 Rule– Coarseness Factor– Workability Factor
To determine “Optimized” Gradations

Combined Gradation

Power 0.45 Chart• Ideal gradation line representing the maximum
aggregate density
0
10
20
30
40
50
60
70
80
90
100
Sieve Size
Perce
nt Pa
ssing
1 1/213/41/23/8# 4# 8# 16# 30# 50# 100
1/4# 6# 20
# 200# 40# 70
5/8# 12# 140

Percent Retained Charts“Haystack” graph
0
5
10
15
20
25
#200 #100 #50 #30 #16 #8 #4 3/8 1/2 3/4 1 1 1/2
Perce
nt Re
taine
d
Sieve Size

Coarseness vs. Workability
[combined % retained above 3/8 inch sieve]• CF = -------------------------------------------------------------- X 100[combined % retained above No.8 sieve]
• WF = Combined % Passing No.8 Sieve

Coarseness vs. Workability Chart

Coarseness vs. Workability Chart
NOTES:
45
35
25
20
30
40
304050607080
COAR
SE
SANDY
WELLGRADED1-1/2"-3/4"
WELLGRADEDMinus 3/4"
COAR
SEGA
P GRA
DED
ROCKY
CONTROL LINE
AGGR
EGAT
E SIZE
FINE
COARSENESS FACTOR
WORK
ABILI
TY FA
CTOR
2
1
27.5

MDOT ChartCF vs WF for Combined Aggregate
45, 44
45, 33
60, 36
52, 41
75, 3968, 38
68, 31
52, 34
75, 28
25
30
35
40
45
404550556065707580Coarseness Factor
(percent)
Worka
bility F
actor
(perce
nt)
Job Mix Formula Zone
Operating Zone
Center of JMF

Zones in MDOT Chart• Job Mix Formula
(JMF) Zone– Contractors proposed
optimized gradation for production, as submitted to the Engineer in the Initial Mix Design, must plot within this zone
CF vs WF for Combined Aggregate
45, 44
45, 33
60, 36
52, 41
75, 3968, 38
68, 31
52, 34
75, 28
25
30
35
40
45
404550556065707580Coarseness Factor
(percent)
Worka
bility F
actor
(perce
nt)
Job Mix Formula Zone
Operating Zone
Center of JMF

Zones in MDOT Chart• Operating Zone
– Contractor must ensure that the optimized gradation for production plots within this zone
CF vs WF for Combined Aggregate
45, 44
45, 33
60, 36
52, 41
75, 3968, 38
68, 31
52, 34
75, 28
25
30
35
40
45
404550556065707580Coarseness Factor
(percent)
Worka
bility
Factor
(perce
nt)
Job Mix Formula Zone
Operating Zone
Center of JMF


MDOT Spreadsheet

Tarantula Example
0.0
5.0
10.0
15.0
20.0
2 1 1/2 1 3/4 1/2 3/8 #4 #8 #16 #30 #50 #100 #200
Perce
nt Re
taine
d
Sieve Size
Combined Gradation - Tarantula Curve(1 in. top size agg.)
Upper Lower Retained

What Does It Take To Implement Optimized Mixtures?
• Possibly extra or dedicated bin• “Coarse” limestone, 6AAA quality, crushed to
“custom” size/gradation• “Intermediate” limestone, crushed to
“custom” size/gradation– Particles >½ inch must meet quality specs for
coarse aggregate (F-T dilation); anything >½ inch that doesn’t meet F-T limited to less than 5% of total aggregate
• Extra testing… How much?

Questions?