qa montana scf
TRANSCRIPT

NASA MODIS Project:University of Montana SCF QA Scheme
Rev. 07 September, 1998File: qa_montana_scf.doc/qa_montana_scf.pdfBy : Joe Glassy
Synopsis
This white paper further describes the University of Montana SCF proposed QualityAssurance (QA) scheme. This plan will be implemented at the launch of the EOS AM-1platform for our terrestrial archived data products. The UM SCF AM-1 land dataproducts referenced here include: PGE 34,36,37,38 (8-day FPAR and LAI, 8-day PSN,and the annual NPP) products. This discussion does not yet explicitly cover the ClimateModeling Grid (CMG) variants of these products, the DAO ancillary climatology data, orQA details pertaining to future PM-1 platform products (MOD16, ET and Surfaceresistance).
Disclaimer
Some aspects of the scheme proposed here will undoubtably change upon further reviewand experience gained during the period prior to launch of EOS AM-1. In particular, themagnitudes of the various sample efforts could change in either direction, reflecting thecompute resource levels actually available at launch and beyond.
Introduction
We consider the assessment of operational data product quality to be an integral aspect oftheir production. Data products that represent direct, sensor derived measures have theopportunity to assign quality scores based on published hardware error characteristics orspecifications. Conversely, derivative model outputs represented by data products suchas our Level 3 and 4 biophysical variables are several steps removed from direct sensorhardware outputs. Assessing the quality of these model outputs in a timely manner atnative spatial resolutions poses more of a challenge due to this derivative nature. This isparticularly true given the clear distinction made between validation activities occurringsome time after data production vs. QA assignments required operationally in near real-

quality of output from algorithms such as our radiative-transfer theory based lookup(FPAR,LAI) method are very directly related to the quality of these aggregated 1KMsurface reflectances. A necessary (but not always sufficient) precondition to good qualityFPAR and LAI outputs is therefore good quality surface reflectances. It is still possibleto produce sub-optimal FPAR and LAI outputs with excellent surface reflectances, if oneof the other key independent variables to the algorithm are faulty or missing. Since the8-day PSN and annual NPP algorithm is driven directly from our 8-day compositedFPAR,LAI outputs, the quality of the PSN algorithm too is directly related to the qualityof these FPAR and LAI inputs.
The overall philosophy we use in assigning our product QA is therefore to first assignpreliminary scores based on the pixel-wise QA of the input product directly upstream,and then to further attenuate this QA by additional factors introduced by the science logicof the given algorithm itself. Lastly, while many aspects of the QA assignment schemecan be predetermined ahead of launch, there will be no substitute for the experiencegained with real MODIS data during the out-gassing period. We therefore expect thatcritical refinements to the initial scheme will undoubtably be made based on thisexperience.
We anticipate that QA analysis (and problem resolution) of overtly incorrect dataproducts will be somewhat more straightforward. The greater challenge will likely be toconsistently distinguish results that are "partially (or weakly) incorrect", whose values liewithin "reasonable" and hence difficult to detect ranges. A systematic examination oflonger time series of outputs, along with diagnostics aimed at distinguishing spatiallydriven error patterns should eventually help reveal these more subtle problems. Note thatour data products are physically stored in a series of spatially contiguous gridded tileHDFEOS v.2.3 files, projected using the Integerized Sinusoidal (IS) grid, as opposed tothe swath/granule HDFEOS file organization used for Level 1 and 2 lower level products.
MODLAND Team Quality Assurance (QA) Definition
The following QA definition is taken from URL:http://pratmos.gsfc.nasa.gov/~droy/modland/qadefinition.html:
Operationally flag data products which obviously and significantly do not conform to the expectedaccuracies of that product. In an operational production system information/data will also be stored that isuseful for post production quality assurance.

• summary of per pixel QA over the granule / tile• documentation of the code processing history
Timing of QA Activities: ("which QA is done where")
QA activities are typically performed at two points in the overall process. First, at theDAAC or TLCF when the product is actually computed, the algorithms themselvesgenerate tile and pixel level QA measures which are stored in the archive product (e.g.for ESDT's MOD15A2, MOD17A2,MOD17A3). Secondly, post-production QAactivities are performed at some combination of the SCF (and/or the LDOPE), whereadditional verification tests can be used to further characterize the quality of the productfiles. This is represented by the AutomaticQualityFlag metadata fields [confirm].[Verify: who (DAAC or SCF) actually sets the final value into the ScienceQualityFlagand OperationalQualityFlag]
Relationship of the LDOPE to the SCF
The LDOPE supplies only product metadata and related tile level summaries to the SCF.When the SCF requires more specific data to investigate a problem, the SCF must orderthis from the DAAC directly. This would include orders for offending input products, aswell as copies of erroneous MOD15 or MOD17 outputs. Further, we expect that theLDOPE will QA our immediate upstream input products (MOD09 and MODPRAGG), sothat we do not need to operationally perform a (redundant) analysis of these products perse.
Common QA Fields
In each archived land product file, QA information is stored as entries in the ECS Core orECS Archive metadata blocks. QA entries are further identified here as either general orproduct specific attributes (PSA). Below, the common tile-level ECS CORE andARCHIVE metadata fields are listed.
ECS Core Metadata currently include:
ANCILLARYINPUTPOINTER(F)ANCILLARYINPUTTYPE(F)AUTOMATICQUALITYFLAG(F)AUTOMATICQUALITYFLAGEXPLANATION(F)

INPUTPOINTER(T)LOCALGRANULEID(T)OPERATIONALQUALITYFLAG(F)OPERATIONALQUALITYFLAGEXPLANATION(F)ORBITNUMBER(F)PARAMETERNAME(T)PGEVERSION(T)PRODUCTIONDATETIME(T)QAPERCENTINTERPOLATEDDATA(F)QAPERCENTMISSINGDATA(T)QAPERCENTOUTOFBOUNDSDATA(F)QAPERCENTCLOUDCOVER(F)RANGEBEGINNINGDATE(T)RANGEBEGINNINGTIME(T)RANGEENDINGDATE(T)RANGEENDINGTIME(T)REPROCESSINGACTUAL(T)REPROCESSINGPLANNED(T)SCIENCEQUALITYFLAG(F)SCIENCEQUALITYFLAGEXPLANATION(F)SHORTNAME(T)SIZEMBECSDATAGRANULE(T)VERSIONID(T)
Note: (T) stands for mandatory metadata and (F) stands for optional metadata. (Ref:MODIS Version 2 Science Computing Facility Software Delivery Guide,May 7, 1997).
ECS Archive metadata currently includes:
(Note: this list was taken from URL:pratmos.gsfc.nasa.gov/~droy/modland/modland_v2_metadata/archive_meta.html:
ALGORITHMPACKAGEACCEPTANCEDATE(F)ALGORITHMPACKAGEMATURITYCODE(F)ALGORITHMPACKAGENAME(F)ALGORITHMPACKAGEVERSION(F)EASTBOUNDINGCOORDINATE(T)

SPSOPARAMETERS(F)WESTBOUNDINGCOORDINATE(T)
Note: (T) stands for mandatory metadata and (F) stands for optional metdata. (Ref:MODIS Version 2 Science Computing Facility Software Delivery GuideMay 7, 1997)
Product Specific Attributes
A set of Product Specific Attributes (PSA's) are also defined for MOD15A2, MOD17A2,and MOD17A3. The product specific attributes for MOD15A2 are shown below. Notethat the majority of these are inherited directly from the upstream products. Whereappropriate, these are simply passed through to the our product files unchanged. ThePSAs for our other land products are similar.
MOD15A2 (8-day MODIS LAI and FPAR Products): (tile level) Product SpecificAttributes:
QAPERCENTGOODQUALITYQAPERCENTOTHERQUALITYQAPERCENTNOTPRODUCEDCLOUDQAPERCENTNOTPRODUCEDOTHERHORIZONTALTILENUMBERVERTICALTILENUMBERN_DAYS_COMPOSITEDQAPERCENTGOODFPARQAPERCENTGOODLAIQAPERCENTMAINMETHODQAPERCENTEMPIRICALMODELQAPERCENTBIOMEFALLBACKGEOANYABNORAMLGEOESTMAXRMSERRORSYSTEMFILENAMENUMBEROFGRANULESGRANULEDAYNIGHTFLAGGRANULEBEGINNINGDATETIMEGRANULEENDINGDATETIME

MAXIMUMOBSERVATIONSCOVERAGECALCULATIONMETHOD
In addition to these tile level QA PSA fields, all producers of land products on theMODLAND team have also adopted a common 2-bit spatial QA encoding scheme, whichoccupies the 1st two bits of our spatially distributed 8-bit QA data plane (e.g. HDFEOSfields: Fpar_1km_QA and Psn_1km_QA, NPP_1km_QA etc). The MODLAND andother bit fields are described in the table below:
MOD15A2 "Fpar_1km_QC" 8-bit QA bitfield layoutSub-field Bits Dec.
ValueBin.value
Bit Definition
0 00 Product pixel produced at ideal quality1 01 Product pixel produced, less than ideal quality2 10 Product pixel not produced due to cloud effects
MODLANDQA bits
00-01
3 11 Product pixel not produced for other reason0 00 Product pixel produced using main RT method
(Highest quality)1 01 Product pixel produced using 732 Empirical
LUT Method2 10 Product pixel produced using 6 biome model
fallback Method
AlgorithmPath bits
02-03
3 11 Product pixel could not be produced using anymethod
0 01 Pixel classified using valid MOD12 MODISlandcover class
Landcoversource
04-04
1 01 Pixel classified using U.Montana landcover 6-biome class
(Not used) 05-05 N/a N/a N/a0 00 Highest quality (76-100 percentile quality
score)1 01 Good quality (49-75 percentile quality score)2 10 Questionable/Poor quality (26-50 percentile
score)
Pixel quality 06-07
3 11 Unacceptable quality, (0-25); we recommendavoid using this pixel.

DAO Ancillary Data QA Issues
One of the primary driving inputs to our daily PGE 37,38 suite (MOD17A1, MOD17A2)is the Data Assimilation Office daily global surface climatology data product. Currentlythis ancillary daily input does not specifically carry QA fields internally. This makesascertaining the role of DAO inputs in error propogation resulting in apparently incorrectMOD17 products more complex. This issue is somewhat compounded by the coarseoverall resolution of the DAO data products (2 deg by 2.5 deg, or 1 deg by 1 degsometime after launch). The resolution of this issue is TBD.
Operational QA Methods Proposed
There are two structural layers of QA involved in the production of MODIS landproducts. The more general layer is represented by "tile-wise" quality indicators -- a setof EOSDIS Core System (ECS) metadata fields attached to each "tile" product file at itscreation. The majority of these are set at runtime, but some are adjusted by later, nearrun-time processes. Note that "tile-wise" QA measures may also be considered"regional" quality assessments, since tiles themselves are organized on a systematicspatial grid. The second structural QA layer is "pixel-wise", spatially distributed qualitymeasures. A good QA approach accommodates an analysis of each of these. Generally,the tile level metadata (CORE, ARCHIVE) are examined first, as in some cases further(pixel-wise) effort may be avoided if the quality of an entire tile falls on either far end ofthe quality spectrum.
The current spatial tiling scheme based on the IS (GCTP_ISINUS) grid stores a 1200x1200 km area in each (full) land tile; there are a total of (326) such land tiles required torepresent all the land surface on the globe. The MOD15A1 FPAR,LAI daily algorithm isexecuted daily using 1KM aggregated surface reflectances (MODPRAGG product),producing a series of up to (8) daily "candidate" FPAR and LAI planes per tile percomposite period. Once each 8-day period, the MOD15A2 8-day FPAR, LAIcompositing algorithm is executed to produce a single "best" output tile from thesecandidate daily images. This 8-day composite FPAR,LAI product is then passed on tothe MOD17 daily PSN algorithm. Since these algorithms fire once daily, a "best case"(e.g. most intense quality assurance) scheme might be to evaluate the QA for all (326)land tiles each day. An exhaustive data sampling scheme like this may be ultimatelypossible, but is currently considered impractical given the distributed nature of theDAAC, TLCF, LDOPE and SCF topology. The impracticality arises from the limited
the centralized LDOPE facility. Refinements in these assumptions are expected to occurduring the remainder of this pre-launch time period in 1998-1999.
The QA activities that we intend to perform may be classified along several differentgradients:
• Routine (subscription based) vs. problem-triggered• Batch vs. interactive quality assessments• Statistical (tabular) vs. image visualization• Tile level (e.g. LDOPE RDBMS query) vs. spatial (pixel-wise) QA• Realtime (at production) QA vs. Post-production QA
These are each described in more detail in the next section.
QA Activity Category Definitions
Routine QA activities represent a set of pre-planned evaluations, conducted both at thetile level as well as the pixel (spatial) level. These are performed as a matter of course ona limited sample of tiles for a given 8-day period.
Problem triggered QA activities represent directed, higher-intensity examinations of bothQA, archive product output, and input data. If the cause of a given problem cannot bedirectly traced to a simple problem in the input data as diagnosed via the input data'smetadata fields or pixel level QA values, we anticipate the potential need to re-run (at theSCF or at the TLCF) the offending tile model run to identify and rectify the problem.
Statistical QA operations are defined here as typically scripted batch tile or pixel-wisetasks used to determine key diagnostic statistics from QA planes and data product planes(FPAR, LAI, PSN, NPP), from a subset of land tiles retrieved from the DAAC, TLCF,and/or LDOPE. These statistics include various measures of central tendency (median,mode, mean) as well as distribution-related diagnostic measures. The purpose ofcompiling these statistics is typically to compare them to pre-established equivalentreference ("expected bench-mark") statistics, to quickly identify problem or outlier modelresults. Also included in the "statistical QA" category are a set of routinely calculated"deltas" -- the residuals (as both arithmatic and absolute value difference) obtained fromsubtracting the latest modeled result(s) from an appropriate reference data set.
automated scripts run at the LDOPE to function as the first line of defense in checkingthe presence (and where appropriate, the correctness) of these fields. These scriptsshould scan key ECS metadata fields each 8-day product sets 326 land tile, and log theidentity of any tiles with overt problems.
Spatial level QA operations are defined as critical evaluations on spatially data --typically one tile (or a contiguous 3x3 group of tiles). The pixel level MODLAND QAbits fall in this category. The evaluation of these elements may be statistical or visual innature, or both.
Realtime QA operations are defined as any performed by the algorithm in realtime whenit executes.
Post-production QA operations are defined as those performed any time after thealgorithm is executed, either at the DAAC, the LDOPE, or at the SCF.
QA Activity Hierarchy
Operationally, the goal is to maintain a flow of the "best science" data products aspossible, expending as little QA effort over time as is reasonably demanded by this firstgoal. Thus, the QA operational scheme envisioned here should consist of the followingactivity layers. Note that while all "routine" aspects of the QA operation are performedover time, we plan to employ the more intense QA activities only as necessary or atinfrequent intervals as resources allow. QA is by nature a time consuming task from astaffing standpoint. We will try to periodically re-evaluate our procedures with an eyetowards streamlining the process, and increasingly automate tasks that lend themselves tothis strategy.
The QA scheme envisioned here consists of several (hierarchical) activity layers, inwhich more rapid and coarse assessments are conducted first, followed by successivelymore intense (and potentially time consuming) types of assessments.
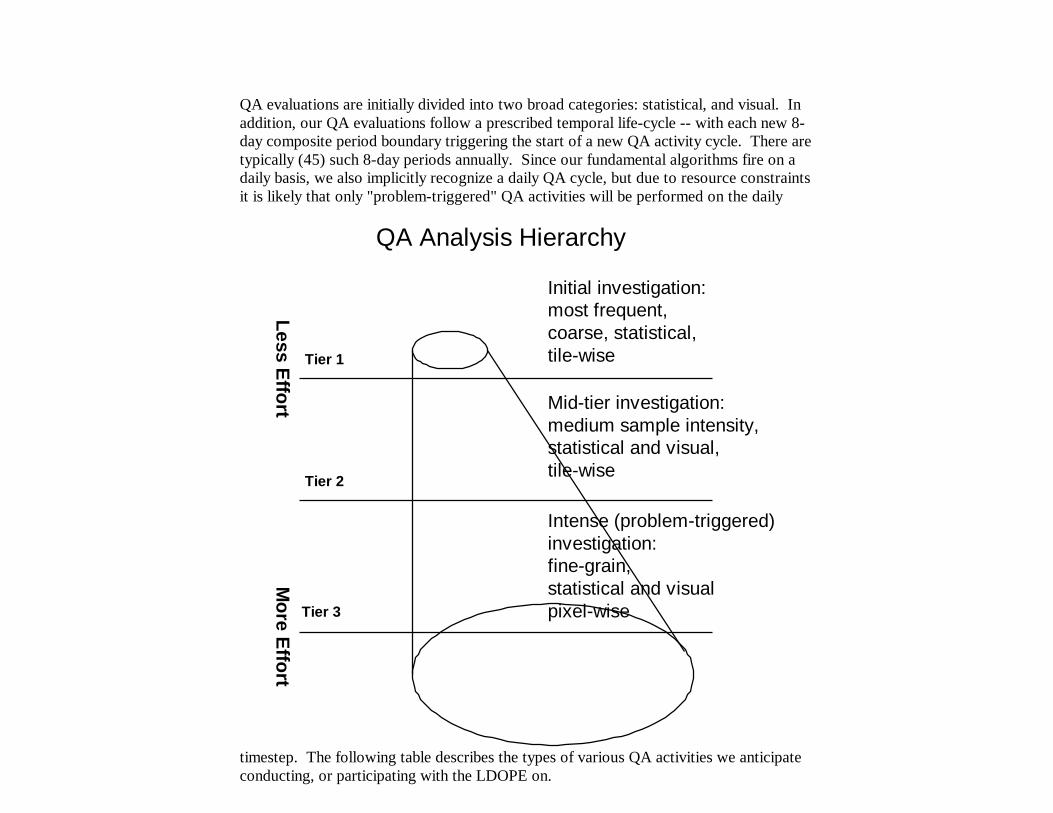
QA evaluations are initially divided into two broad categories: statistical, and visual. Inaddition, our QA evaluations follow a prescribed temporal life-cycle -- with each new 8-day composite period boundary triggering the start of a new QA activity cycle. There aretypically (45) such 8-day periods annually. Since our fundamental algorithms fire on adaily basis, we also implicitly recognize a daily QA cycle, but due to resource constraintsit is likely that only "problem-triggered" QA activities will be performed on the daily
timestep. The following table describes the types of various QA activities we anticipateconducting, or participating with the LDOPE on.
QA Analysis Hierarchy
Initial investigation:most frequent,coarse, statistical,tile-wiseTier 1
Tier 2
Tier 3
Mid-tier investigation:medium sample intensity,statistical and visual,tile-wise
Intense (problem-triggered)investigation:fine-grain,statistical and visualpixel-wise
Less Effort
More E
ffort

sample (1 or 2 per biome, more if practical), and ofCMG products, for visual cross-check.
2 Pixel level QA(medium)
a) Routinely retrieve a (globally distributed)systematic sub-sample of land tiles for statisticaland visual examination (1 or 2 per biome); resultsto form a longer term historical time series.
b) Routinely retrieve a random sample (withoutreplacement) of land tiles to examine as above.
3 Pixel level QA (finegrain)
a) At less frequent intervals (or as time permits),retrieve and examine a more exhaustive sample ofour land product tiles.
b) Response to Explicit problems identified at theLDOPE or SCF: this triggers a more intenseexamination; retrieve 3x3 contiguous tile regionscentered on the offending tile (as appropriate) formore in-depth, robust analysis and possible PGEre-execution at the SCF
Spatial Sampling of Land Tiles for QA
For each land product tile from (PGE 34,36,37,38) selected for QA examination, incoordination with the LDOPE we expect to conduct one or more the following types ofQA analyses:
• Examination of the tile-level ECS (core,archive) metadata fields for presence andcorrectness.
• Examination of the tile-level level PSA fields to assure that a sufficient percentage ofqualifying pixels were produced (Note: we have not yet set of fixed minimumthreshold for the QAPERCENTxxx fields)
• Statistical and/or visual examination of the pixel level QA fields (Fpar_1km_QA,Psn_1km_QA, etc)
When warranted (either by overt problems, or more routinely during out-gassing to verifythe product data themselves, the following QA activities may periodically be performed:
• Examination (statistical and/or visual) of the direct and/or ancillary inputs to a givenset of PGE execution(s)

Implicit in any quality analysis of biophysical model data is a recognition of the "level ofmeasurement" represented by the model variable, and how the data are likely to be usedby practitioners. Technically, our FPAR, LAI, PSN, and NPP measures are allcontinuously distributed variates, making the application of standard parametric statisticaltheory relevant. Nonetheless, we must distinguish at the onset the difference between agiven measure being "statistically" significant from its biophysical significance. In somecases, a trend or statistic may not be statistically significant at a traditional probability orCI level such as 0.05, yet it may still be very biologically significant. Conversely,differences or similarities objectively judged to be "statistically significant" may beinsignificant biologically. Our QA scheme will thus ultimately try to favor a scoring thatweights the biophysical importance of a difference or trend over its pure statisticalsignificance.
As indicated earlier, there are 326 IS land tiles. Currently, a Version 2.1 MOD15A2 fulltile data product file is 5694 Kb in size, and a V.2.1 MOD17A2 full tile data product fileis 4284 Kb in size. Given these per-tile sizes, with our SCF disk store limits and networkbandwidth limitations, it is quite likely that we will not be able to network-retrieve all theQA and/or primary data product data generated at a remote site. Indeed, our SCFnetwork bandwidth was specified (at best case) for retrieval of only 10% of our productQA. Therefore, we intend to perform a type of spatial sampling that should help usaccount for the majority of the anticipated (statistical) variation in the archived dataglobally.
The foundation for our sampling is a straightforward application of stratified two-stage(or cluster) sampling. Though our land products are produced at a global coverage ateach archive time-step, we recognize two spatial sample levels -- a higher resolutionmore intense sample universe comprised of the US Continent, and a more sparselysampled (less intensely sampled) universe comprised of the full global scope.Predicating this scheme is our stratification of global terrestrial landscapes into a limitednumber of biophysically defined biome classes. Further, note that we ignore pixelsclassified to any of the non-terrestrial classes (water, ice, rock, barren, etc).
The (6) biome classes we use (mapped from the 17 IGBP classes present in the at-launchland product, MOD12A1) tend to form a natural stratification criterion for "primary"sample frames (sub-populations), where the assumption is that within-group variation fora given measured field (FPAR,LAI, PSN or NPP) is significantly less than across-groupvariation. Even if these variance assumptions are not supported with classic parametric

life of the MODIS instrument. There are several implicit goals behind this "fixed"sample frame approach:
• we ultimately desire a longer term history of measured vs. modeled variables forcomparison and model refinement.
• we could potentially track larger scale "change detection" patterns in ecosystemvariables as they vary in time and space.
• a fixed but sparse set of primary samples centered about LTER, flux tower, or otherlong term study sites realistically represents what is available for high quality dataover longer historical time periods.
The "fixed,sparse " global sample should generally meet these criteria:
• Each land tile selected should ideally be centered on a "well-characterized site" froma biophysical science viewpoint. This "point" may correspond to an existing LTERsite, or any other site for which a temporal record of higher quality validationinformation for the given variables is available. The site locus could also be one inwhich a flux-tower or other instrumentation cluster is present.
• As a "smaller" number of tiles (6-18) , the data volume represented for networkretrieval at each 8-day composite cycle (for longer term archive at the SCF) should bemore practical.
• The globally distributed set of land tiles should, as a whole, represent the range ofvariation in each variable fairly well over time. Note that the "fixed set" of land tileschosen for FPAR and LAI should be spatially coincident with the set chosen for PSNand NPP.
Given the establishment of this group of "primary" (sample frame) land tiles, we followthe convention in two-stage sampling of stochastically identifying a sub-population of1KM pixels within each such "primary frame" land tile. To assure a better spatialdistribution and to increase sampling rigor, at each 8-day composite period boundary wewould sample an appropriate number of pixels (ca 100 for good Z-score distribution)without-replacement. From this sub-population, we would compute and analyze alimited set of standard diagnostic measures (mode, median, minimum, maximum) andany others identified as helpful to the time series analysis.

Delta Analysis on the Fixed Global Sample
In addition to analyzing simple trend statistics as cited above, we intend to also perform astandard residual or "delta" analysis, where pixel-wise difference values are computed forthe fixed sample land tiles described above vs. the spatially coincident pixel in pre-established "reference" images of the same variable (FPAR, LAI, PSN, NPP). Theglobal reference image (or set of IS tiles) for a given variable would contain 2 data
Fixed, Sparse Global Tile Sample

Tier-2 Methods for Stochastic Global Sampling
When a more intensive land tile sampling is justified, a separate sample (uniformlyrandomly selected) will be chosen. Analyses on these pixels sampled would includethose described above -- verification of the QA, the direct variables themselves, orvarious delta analyses using spatially coincident reference images.
Tier-3: US Continent (Intensive) 1KM Sampling
For more in-depth (and less frequent) spatial QA assessments, pixel wise comparisionsbetween a set of predefined 1KM reference images for FPAR, LAI, PSN and NPP will becompared with the latest model output. The sampling intensity of these comparisons canbe readily scaled to the resources (staff time, compute and storage) available. These deltacomparisons would probably be conducted once a month. Difference statistics willinclude pixel-wise simple difference, absolute difference, and a tile-wise mean-absolutedifference.
US Continent:1KM Exhaustive Sample

A number of QA software tools are now in place at our SCF. Interactive tools are listedbelow, by platform:
QA Software Tools at the Univ. Montana SCFPlatform Mode Tool
Interactive HDFLook, SphinxInteractive WebWinds (JPL)Interactive, scripted IDLInteractive, scripted SPSSInteractive, scripted S-PlusBatch, scriptable LDOPE batch command line toolsBatch, scriptable Custom SCF tools (delta, freq, etc)
UNIX (SGI, IBM)
Interactive LDOPE ENVY toolInteractive,scripted NoesysInteractive WebWindsInteractive,scripted SPSSInteractive SigmaPlot
Intel PC (NT OS)
Batch, scriptable Custom SCF tools (delta, freq, etc)At the LDOPE, we expect only IDL, ENVY and LDOPE command line tools to beimplemented for our use. In general, across all the above tools, we believe there isprobably currently a sufficient tool set available for all anticipated QA activities. Actualexperience may indicate additional needs not yet adequately filled.
Setting the Operational Science Quality Flag
Currently, we plan to set a threshold to indicate the minimum percent of a given tile thatwas completed correctly (at quality level good or excellent) as the basis for setting thisflag. This approach will need refinement [TBD].
Setting Product Level QA (Spatial) Flags
See the QA bitfield layout" table on p. 6 of this document for a list of the specific bitfields present in these spatial QA flags:
• FPAR,LAI: HDFEOS field: Fpar_1km_QC• PSN,NPP: HDFEOS field: Psn_1km_QC, Npp_1km_QC
in lowest quartile. The actual assignment is based on science-specific logic which variesby algorithm.
(TBD: include more specific MOD15 and MOD17 assignment logic for these fields).
Operational QA Scenarios
The following operational hypothetical scenario is offered to help anticipate various real-time coordination issues we expect to encounter. We will coordinate daily with both theLDOPE and the production DAAC (or TLCF, MEBS, etc) in the production of our landproducts. We are currently envisioning two basic types of communication trafficbetween the LDOPE and our SCF -- routine and problem-triggered. Routine traffic willinclude all pre-established, subscription based communication, such as notification email,servicing of standard LDOPE RDBMS queries, as well as any automated (or semi-automated) data transfer. Initially, almost all data transfer traffic should be onedirectional, from the LDOPE or DAAC to our SCF. Exceptions to this flow will be whenour SCF needs to update the production site with a particular (static) ancillary data object,or requested code revision. Details of code updates between our SCF and the TLCF stillneed to be worked out.Routine QA
We recognize two basic clocking cycles relevant to the production of our land products; adaily cycle which matches the execution periodicity of our main algorithms (MOD15A1and MOD17A1), and an 8-day composite period cycle, which matches the production ofour archive products. The current phased-production scheme indicates that otherupstream products will undergo certification prior to ours, most likely resulting in a"certification lag" of approximately Launch+ 3 months, whereupon the production of ourproducts will elevate to a more public state of maturity. During this initial period, subjectto LDOPE resources and availability, we hope to gather as much early information aspossible about how our algorithms are faring, if they are running at all. Once the"certification lag" period has passed, we expect to commence all QA subscriptioncommunications with the LDOPE. At this point, we plan on implementing a simple in-house SCF database to log routine QA messages and most likely, the body of the ECSCore, Archive, and PSA QA blocks associated with our 8-day products (45 periodsannually for each product).
Note that we do not plan on regularly retrieving any QA generated by the intermediate

since so much of the quality of our tiled land products stems directly from the continuityand accuracy of upstream products (e.g. aggregated surface reflectance, DAO dailysurface global climatology, etc) which are beyond our control. Nonetheless, we hope toput into place a systematic approach for handling as much of the unexpected as possible.
Problem triggered QA events can occur at any time, so we anticipate the development ofa "triage" problem classification to allow us (in partnership with the LDOPE) tocategorize real-time production problems into those that demand immediate attention, vs.those that can be deferred to the next 8-day composite period boundary, or some otherregular time interval. This recognizes that staffing resources at both the SCF and LDOPEmay be constrained during periods of high activity.
QA flags retrieved that indicate persistent and severe errors will be attended to first.Indications such as low percentages of tiles being produced correctly (via theQAPERCENTMISSINGDATA or QAPERCENTOUTOFBOUNDSDATA flags, etc).Local retrieval of QA traffic (and possibly product data itself) will be stepped upconsiderably for problems deemed severe, until the problem is identified and resolved.
Additional Information Sources
A great deal of information pertinent to effective QA methodologies is available. BelowI've listed several specific online and published references.
• LDOPE QA home page: (http://pratmos.gsfc.nasa.gov/~droy/modland/qahome.html)• The NASA software independent verification and validation facility:
(http://www.ivv.nasa.gov)• The NASA Software Assurance Technology Center (http://satc.gsfc.nasa.gov/)• The Software Engineering Institute home page (http://www.sei.cmu.edu/sei-home.html)
References
MODIS Version 2 Software Delivery Guide
Interface Control Document Between EOSDIS Core System (ECS) and Science

1984. Bezier, Boris. Software System Testing and Quality Assurance. Van NostrandReindhold Electrical/Computer Science and Engineering Series, Van NostrandReinhold.
1998. McConnell, Steve. Rapid Development. Microsoft Press.

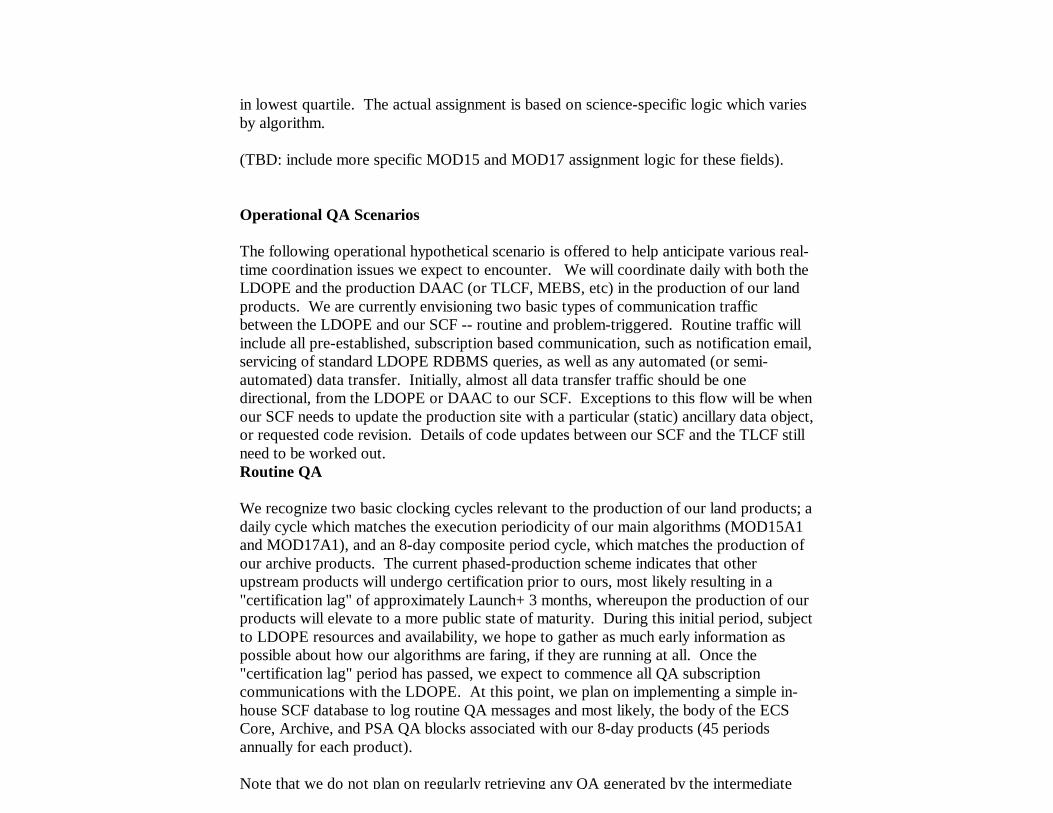
BiomeProperties
Lookup Table(BPLUT)
MODIS MOD17 (PSN, NPP)Data Flow Diagram
(daily firing scenario)
NPPQ/A
image
MOD_PR15_L4_8day LAI data product
image
MOD_PR15_L4_8dyFPAR data product
image
NPP TileProduct:
summed PSN,(annual)
DAO,NMCdaily surfaceclimatology:
TmaxTmin
SolRadPPT
Humidity One Input Per 8-dayComposite Period
Once Annually
Intermediate:(GPP-RM)updated
daily
PSN TileProduct:one per
compositeperiod
PGE 37MOD_PR17A1:
Daily IntermediatePSN, NPP
Tile ProductAlgorithm
3-hour global surfaceclimatology
PSNQ/A
image
Once Per Comp Period
(16-bit)
DAO,NMC3 hour surfaceclimatology:Tmax, TminSolRad, PPT
Humidity
Maryland/BostonMOD12Q1,
IGBP 1KM landcover