q4 & fy 2017 results - cnh industrial & fy 2017 results review january 30th, 2018 fy 2017 |...
TRANSCRIPT

Q4 & FY 2017 Results
January 30, 2018

Q4 & FY 2017 Results Review January 30th, 2018
2Safe Harbor Statement and Disclosures
All statements other than statements of historical fact contained in this presentation including statements regarding our competitive strengths; business strategy; future financial position or operating
results; budgets; projections with respect to revenue, income, earnings (or loss) per share, capital expenditures, dividends, capital structure or other financial items; costs; and plans and objectives of
management regarding operations and products, are forward-looking statements. These statements may include terminology such as “may”, “will”, “expect”, “could”, “should”, “intend”, “estimate”,
“anticipate”, “believe”, “outlook”, “continue”, “remain”, “on track”, “design”, “target”, “objective”, “goal”, “forecast”, “projection”, “prospects”, “plan”, or similar terminology. Forward-looking statements are
not guarantees of future performance. Rather, they are based on current views and assumptions and involve known and unknown risks, uncertainties and other factors, many of which are outside our
control and are difficult to predict. If any of these risks and uncertainties materialize or other assumptions underlying any of the forward-looking statements prove to be incorrect, the actual results or
developments may differ materially from any future results or developments expressed or implied by the forward-looking statements. Factors, risks and uncertainties that could cause actual results to
differ materially from those contemplated by the forward-looking statements include, among others: the many interrelated factors that affect consumer confidence and worldwide demand for capital
goods and capital goods-related products; general economic conditions in each of our markets; changes in government policies regarding banking, monetary and fiscal policies; legislation, particularly
relating to capital goods-related issues such as agriculture, the environment, debt relief and subsidy program policies, trade and commerce and infrastructure development; government policies on
international trade and investment, including sanctions, import quotas, capital controls and tariffs; actions of competitors in the various industries in which we compete; development and use of new
technologies and technological difficulties; the interpretation of, or adoption of new, compliance requirements with respect to engine emissions, safety or other aspects of our products; production
difficulties, including capacity and supply constraints and excess inventory levels; labor relations; interest rates and currency exchange rates; inflation and deflation; energy prices; prices for agricultural
commodities; housing starts and other construction activity; our ability to obtain financing or to refinance existing debt; a decline in the price of used vehicles; the resolution of pending litigation and
investigations on a wide range of topics, including dealer and supplier litigation, follow-on private litigation in various jurisdictions after the EU antitrust investigation announced on July 19, 2016,
intellectual property rights disputes, product warranty and defective product claims, and emissions and/or fuel economy regulatory and contractual issues; our pension plans and other post-employment
obligations; political and civil unrest; volatility and deterioration of capital and financial markets, including further deterioration of the Eurozone sovereign debt crisis, possible effects of Brexit, terror
attacks in Europe and elsewhere, and other similar risks and uncertainties and our success in managing the risks involved in the foregoing. Further information concerning factors, risks, and
uncertainties that could materially affect the Company’s financial results is included in our annual report on Form 20-F for the year ended December 31, 2016, prepared in accordance with U.S. GAAP
and in the Company’s EU Annual Report at December 31, 2016, prepared in accordance with EU-IFRS. Investors should refer to and consider the incorporated information on risks, factors, and
uncertainties in addition to the information presented here. Investors should consider non-GAAP financial measures in addition to, and not as a substitute for, financial measures prepared in accordance
with U.S. GAAP. Reconciliations of non-GAAP measures to the most directly comparable GAAP measure are presented in our earning releases, which are available in EDGAR on the SEC’s website at
www.sec.gov and on our website at www.cnhindustrial.com.
Forward-looking statements are based upon assumptions relating to the factors described in this presentation, which are sometimes based upon estimates and data received from third parties. Such
estimates and data are often revised. Our actual results could differ materially from those anticipated in such forward-looking statements. Forward-looking statements speak only as of the date on which
such statements are made, and we undertake no obligation to update or revise publicly our forward-looking statements. Further information concerning CNH Industrial and its businesses, including
factors that potentially could materially affect CNH Industrial’s financial results, is included in CNH Industrial’s reports and filings with the U.S. Securities and Exchange Commission (“SEC”), the
Autoriteit Financiële Markten (“AFM”) and Commissione Nazionale per le Società e la Borsa (“CONSOB”).
All future written and oral forward-looking statements by CNH Industrial or persons acting on the behalf of CNH Industrial are expressly qualified in their entirety by the cautionary statements contained
herein or referred to above.

Q4 & FY 2017 Results Review January 30th, 2018
3FY 2017 | Highlights
Note: All figures are provided herein on a US GAAP $ basis unless otherwise indicated (1) Non-GAAP measures (definition and reconciliation in appendix)
(*) Subject to the approval at the AGM (expected on April 13, 2018), the ex-
dividend date would be set at April 23, 2018)
Net Income at $313mn
Adjusted Net Income (1) at $669mn, up 39% vs.
last year
Industrial
Operating profit (1) at $1.5bn up $228mn from
last year, with margin at 5.8%
Net Industrial debt (1) reduced to $0.9bn
Diluted EPS at $0.22
Adjusted Diluted EPS (1) at $0.48, up 37% vs.
last year
Financial
Investment grade credit rating (S&P and Fitch)
has made Company’s securities eligible for the
main investment grade indices in the US market
Dividends & Share Buyback
BoD is recommending a dividend of €0.14 per
common share (up 27% vs. prior year dividend),
or €191mn ( $237mn) and a reauthorization
and upsizing of the Company’s share repurchase
program to $700mn (*)
FY 2017 Actual vs. Guidance
Guidance FY 2017
Net Sales (Industrial Activities) $25bn - $25.5bn $26.2bn
Adj diluted EPS $0.44 - $0.46 $0.48
Net Industrial Debt $1.5bn - $1.7bn $0.9bn

Q4 & FY 2017 Results Review January 30th, 2018
4Q4 2017 | Main Product Launches & Awards
MACHINERY OF THE YEAR
NEW LONG TERM SUPPLY AGREEMENTS (LNG & CNG PRODUCTS)
DAILY BLUE POWER: “INTERNATIONAL VAN OF THE YEAR”
ASABE NAMES INNOVATIONS FROM CASE IH AND NH AG TO 2018 AE50 LIST

Q4 & FY 2017 Results Review January 30th, 2018
5FY 2017 | Summary
(1) Non-GAAP measures (definition and reconciliation in appendix)
Industrial Activities
Net Sales & Operating Margin Adj. Net Income & EPS (1) Net Industrial Debt (1) Available Liquidity (1)
▪ Net Sales at $26.2bn up 10.6%
vs. last year
▪ Operating Margin at 5.8% vs.
5.5% last year
$(0.9)bn $9.4bn
▪ Adjusted Net Income at $669mn up
$187mn or 39% vs. FY 2016
▪ Adjusted Diluted EPS at $0.48
▪ Net Industrial debt at $0.9bn
down 45% from prior year
▪ Net industrial cash flow at
$1.3bn vs. $1.0bn last year
▪ Available liquidity at $9.4bn up
$0.6bn vs. Dec 31, 2016
FY 2016
FY 2017
FY 2016
FY 2017
482
669
0.35
0.48
Dec 31, 2016
Dec 31, 2017
8.7
9.4
Dec 31, 2016
Dec 31, 2017
(1.6)
(0.9)
23.7
26.2
5.5%
5.8%
$26.2bn 5.8% $669mn $0.48

Q4 & FY 2017 Results Review January 30th, 2018
6Net Sales | Industrial Activities
20%
54%
11%
15%
39%
9%
37%
15%
Net Sales split (1)
BY
REGION
BY
SEGMENT
NAFTA
EMEA
LATAM
APAC
AG
CE
CV
PT
(1) Note: Net Sales: Excluding Other Activities, Unallocated Items & Adjustment & Eliminations
BY
CURRENCY
EUR 45%
USD 28%
BRL 6%
CAD 4%
GBP 1%
AUD 4%
OTHER 12%
Note: Numbers may not add due to rounding(*) Note: @CC means at constant currency
($mn)
23,669 806 294 667 589 (310) 25,715 453 26,168
FY 2016 AG CE CV PT ELIM & OTHERFY 2017
@ CC (*)
FX
TRANSLATION FY 2017
CHANGE IN NET SALES AT CONSTANT CURRENCY
2,046
+8.6%
Net Sales walk
6,682 309 193 224 126 (78) 7,456 342 7,798
Q4 2016Q4 2017
@ CC (*) Q4 2017
Q4 & FY 2017 Results Review January 30th, 2018
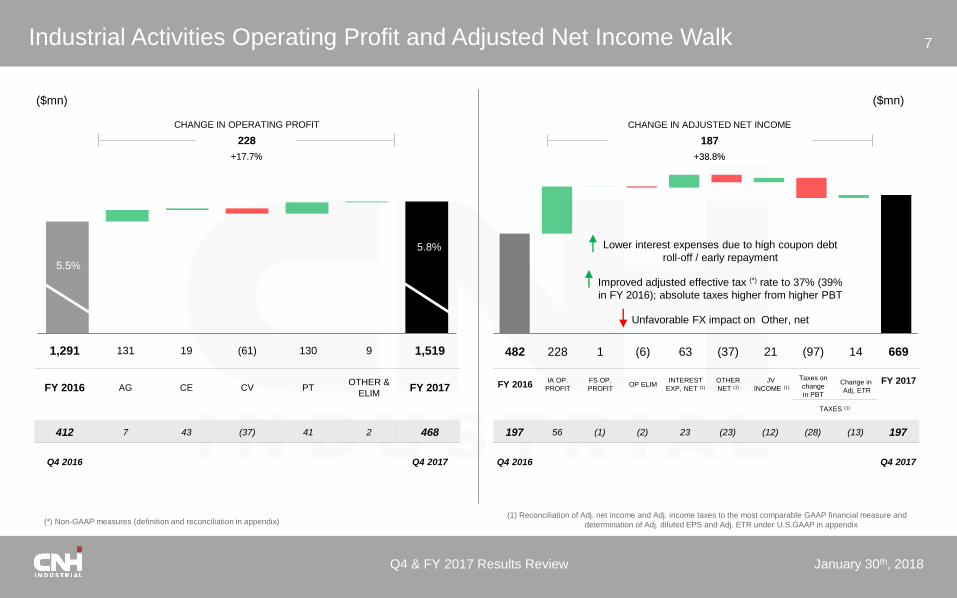
7Industrial Activities Operating Profit and Adjusted Net Income Walk
($mn)
482 228 1 (6) 63 (37) 21 (97) 14 669
FY 2016IA OP.
PROFIT
FS OP.
PROFITOP ELIM
INTEREST
EXP, NET (1)
OTHER
NET (1)
JV
INCOME (1)
Taxes on
change
in PBT
Change in
Adj. ETR
FY 2017
TAXES (1)
CHANGE IN ADJUSTED NET INCOME
187
+38.8%
(1) Reconciliation of Adj. net income and Adj. income taxes to the most comparable GAAP financial measure and
determination of Adj. diluted EPS and Adj. ETR under U.S.GAAP in appendix(*) Non-GAAP measures (definition and reconciliation in appendix)
($mn)
1,291 131 19 (61) 130 9 1,519
FY 2016 AG CE CV PTOTHER &
ELIMFY 2017
CHANGE IN OPERATING PROFIT
228
+17.7%
5.8%
5.5%
Lower interest expenses due to high coupon debt
roll-off / early repayment
Improved adjusted effective tax (*) rate to 37% (39%
in FY 2016); absolute taxes higher from higher PBT
Unfavorable FX impact on Other, net
412 7 43 (37) 41 2 468
Q4 2016 Q4 2017
197 56 (1) (2) 23 (23) (12) (28) (13) 197
Q4 2016 Q4 2017

Q4 & FY 2017 Results Review January 30th, 2018
8Cash Flow | Change in Net Industrial Debt
FY ’17 CHANGE IN NET INDUSTRIAL DEBT
700
FY ’17 NET INDUSTRIAL CASH FLOW
1,289
($mn)
(*) Including $56mn in FY 2017 charge on repurchase/early redemption of Notes
(1,561) 313 720 56 485 130 (488) 73 (193) (396) (*) (861)
Dec 31, 2016 NET INCOME D&A
CHARGE ON
REPURCHASE /
EARLY REDEMPTION
OF NOTES
CHG IN PROVISION
AND SIMILARCHANGE IN WC CAPEX OTHER CHANGES
CAPITAL INCREASE
& DIVIDENDS, NET
FX TRANSLATION
& OTHERDec 31, 2017
(2,575) (40) 184 - 418 1,274 (211) 59 (11) 41 (861)
Sep 30, 2017 Dec 31, 2017
Q4 ’17 NET INDUSTRIAL CASH FLOW
1,684

Q4 & FY 2017 Results Review January 30th, 2018
9Capex | Change in Working Capital | Net Industrial Cash Flow
Capex (1) Change in Working Capital
Net Industrial Cash Flow43%
8%
31%
18%
BY
SEGMENT
AG
CE
28%
67%
5%
BY
CATEGORY
CV
PT
NEW PRODUCT & TECHNOLOGY
MAINTENANCE & OTHER
INDUSTRIAL CAPACITY EXPANSION & LT INVESTMENTS
Cash inflow
Cash outflow
Cash inflow
Cash outflow
TRADE
RECEIVABLESINVENTORIES
TRADE
PAYABLESOTHER
CHG IN WORKING
CAPITAL
FY 2015 FY 2016 FY 2017
(1) Excluding assets sold under buy-back commitments and assets under operating leases
▪ Capex at $488mn down
$13mn vs. last year
130
1,289
FY 2016 FY 2017
501 488
7581,045
($mn)
Q4 & FY 2017 Results Review January 30th, 2018
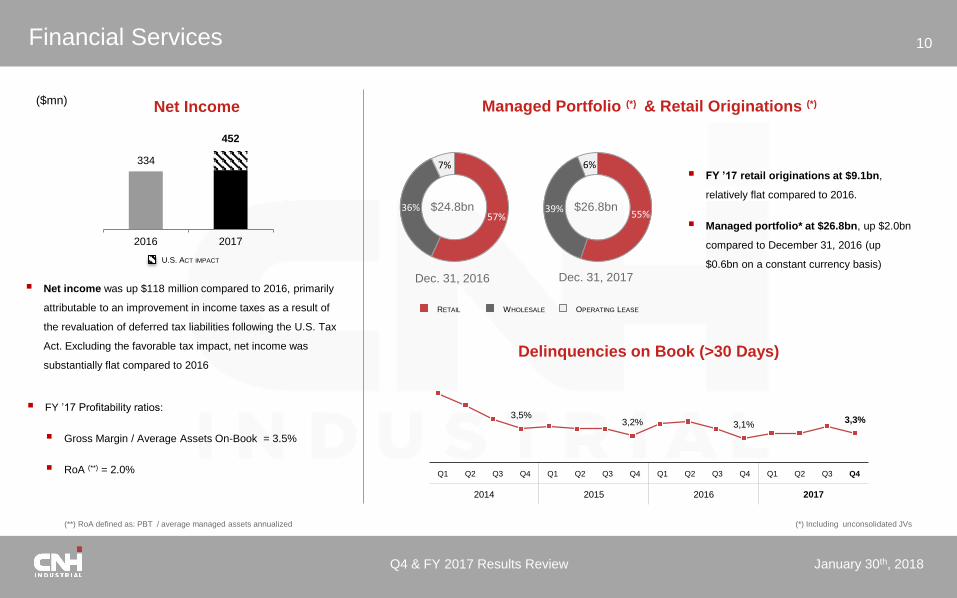
10Financial Services
(*) Including unconsolidated JVs
Managed Portfolio (*) & Retail Originations (*)
57%36%
7%
$24.8bn55%
39%
6%▪ FY ’17 retail originations at $9.1bn,
relatively flat compared to 2016.
▪ Managed portfolio* at $26.8bn, up $2.0bn
compared to December 31, 2016 (up
$0.6bn on a constant currency basis)
$26.8bn
Dec. 31, 2016 Dec. 31, 2017
RETAIL WHOLESALE OPERATING LEASE
Delinquencies on Book (>30 Days)
3,5%3,2% 3,1%
3,3%
Q1 Q2 Q3 Q4 Q1 Q2 Q3 Q4 Q1 Q2 Q3 Q4 Q1 Q2 Q3 Q4
2014 2015 2016 2017
(**) RoA defined as: PBT / average managed assets annualized
Net Income($mn)
▪ FY ’17 Profitability ratios:
▪ Gross Margin / Average Assets On-Book = 3.5%
▪ RoA (**) = 2.0%
2016 2017
334
452
▪ Net income was up $118 million compared to 2016, primarily
attributable to an improvement in income taxes as a result of
the revaluation of deferred tax liabilities following the U.S. Tax
Act. Excluding the favorable tax impact, net income was
substantially flat compared to 2016
U.S. ACT IMPACT

Q4 & FY 2017 Results Review January 30th, 2018
11Liquidity & Debt Maturity
1 Represents cash portion of debt maturities as of 12/31/20172 Of which $0.8bn Restricted Cash
Undrawn M/T Committed Lines Bank Debt
Capital Market
Cash
Other
9.4 3.5 2.3 1.9 2.0 1.4 2.8
As of
12/31/172018 2019 2020 2021 2022 Beyond
Available
Liquidity ($bn)
DEBT MATURITY SCHEDULE (1)
($BN)
▪ Available liquidity at Dec 31, 2017 was $9.4bn, compared to $8.7bn at Dec
31, 2016
▪ $6.2bn of cash & cash equivalents (2)
▪ $3.2bn undrawn under medium-term committed unsecured credit lines
▪ Liquidity to LTM revenue ratio at 34.3%
Company Available Liquidity
Q4 2017 | Highlights
▪ CNH Industrial N.V. issued $500mn in aggregate principal amount of
3.850% Notes due 2027
▪ This was the first bond issued after the Company’s securities became eligible
for the main investment grade indices in the U.S. market and the first 10-year
term public bond ever issued by the Company
▪ CNH Industrial Capital LLC, redeemed all of the outstanding $600mn
aggregate principal amount of its 3.875% Notes due 2018 on December 1,
2017 for approximately $615mn in cash
▪ CNH Industrial Capital LLC, established a new commercial paper program
to issue short-term, unsecured, unsubordinated commercial paper notes
on a private placement basis
▪ Outstanding as of December-end at $115mn

Industrial Activities Overview

Q4 & FY 2017 Results Review January 30th, 2018
13AG | Financial Results
Operating Profit walkNet Sales
818 120 102 (4) (53) (47) 13 949
FY 2016 VOLUME & MIX PRICING NET PROD COST SG&A R&D FX | OTHER FY 2017
($mn)
CHANGE IN OPERATING PROFIT
131
+16.0%
8.1% 8.5%Favorable volume and product mix, in all regions except NAFTA
Positive price realization of 1% more than offsetting raw
material cost increase
SG&A cost increases and R&D spending (*)
(*) R&D up 14% vs. FY 2016
272 62 22 (24) (27) (17) (9) 279
Q4 2016 Q4 2017
34%
36%
15%
15%
CHANGE VS FY 2016
NAFTA (1.5%)
EMEA 11.8%
LATAM 30.8%
APAC 17.6%
▪ Net Sales at $11.1bn up 10% vs. last year (up 8.0% at
constant currency)
BY
REGION
58%21%
21% CHANGE VS FY 2016
TRACTORS 10.5%
COMBINES 14.5%
OTHERS 4.7%
BY
PRODUCT

Q4 & FY 2017 Results Review January 30th, 2018
14AG | Industry performance & Inventory management
| 0-140HP 6%
| 140+ HP (1) 2%
EMEA 2%
LATAM 13%
APAC 6%
Industry Units(For FY 2017)
Tractors
(1) Included in row crop sector definition
▪ FY 2017 overproduction vs. retail
at 2%
▪ NAFTA (140+/4WD) (1)
underproduction vs. retail at 17%
▪ Production up 5% vs. Q4 2016
Combines
Q1 Q2 Q3 Q4 Q1 Q2 Q3 Q4 Q1 Q2 Q3 Q4
2015 2016 2017
NAFTA (1) 10%
EMEA Flat
LATAM 13%
APAC 5%
▪ FY 2017 overproduction vs. retail
at 3%
▪ NAFTA (1) underproduction vs.
retail at 4%
▪ Production up 9% vs. Q4 2016
Industry Units(For FY 2017)
COMPANY INVENTORY DEALER INVENTORY PRODUCTION RETAIL SALES
NAFTA
Q1 Q2 Q3 Q4 Q1 Q2 Q3 Q4 Q1 Q2 Q3 Q4
2015 2016 2017
Q4 & FY 2017 Results Review January 30th, 2018
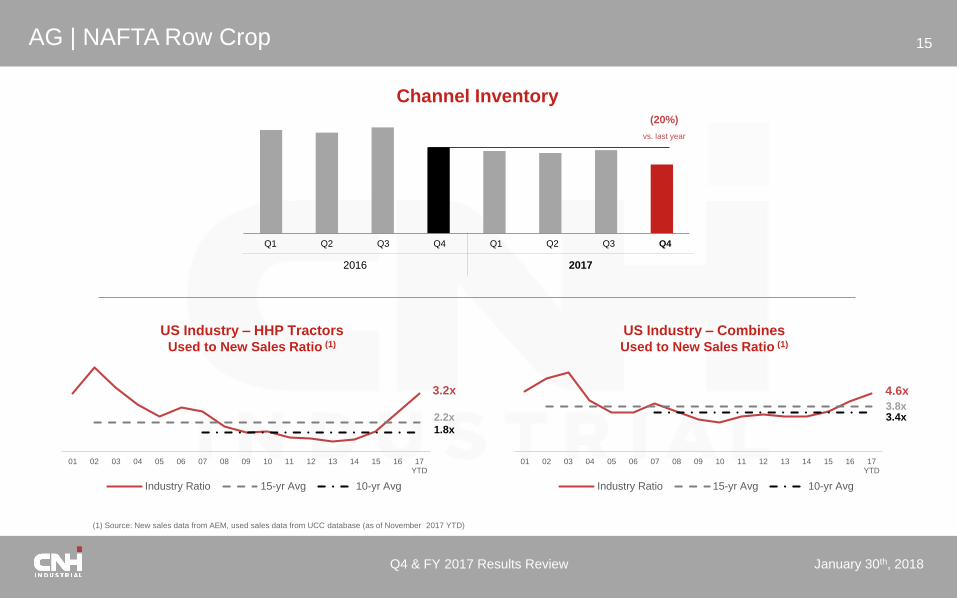
15AG | NAFTA Row Crop
Channel Inventory
Q1 Q2 Q3 Q4 Q1 Q2 Q3 Q4
2016 2017
(20%)
vs. last year
01 02 03 04 05 06 07 08 09 10 11 12 13 14 15 16 17YTD
Industry Ratio 15-yr Avg 10-yr Avg
3.2x
2.2x1.8x
US Industry – HHP TractorsUsed to New Sales Ratio (1)
US Industry – CombinesUsed to New Sales Ratio (1)
4.6x
3.8x3.4x
01 02 03 04 05 06 07 08 09 10 11 12 13 14 15 16 17YTD
Industry Ratio 15-yr Avg 10-yr Avg
(1) Source: New sales data from AEM, used sales data from UCC database (as of November 2017 YTD)

Q4 & FY 2017 Results Review January 30th, 2018
16CE | Financial Results
Operating Profit walk
2 54 18 (28) (21) 11 (15) 21
FY 2016 VOLUME & MIX PRICING NET PROD COST SG&A R&D FX | OTHER FY 2017
($mn)
0.1% 0.8%
CHANGE IN OPERATING PROFIT
19
+10.5X
Higher volume and net price realization, partially offset by
increases in raw material cost, unfavorable FX impacts on
product components, and increased SG&A
(30) 40 21 (7) (11) 2 (2) 13
Q4 2016 Q4 2017
52%
20%
12%
16%
Net Sales
CHANGE VS FY 2016
NAFTA 15.3%
EMEA 0.6%
LATAM 17.1%
APAC 27.9%
▪ Net Sales at $2.6bn up 14.0% vs. last year (up 12.8% at
constant currency)
BY
REGION
53%45%
2%CHANGE VS FY 2016
LIGHT 15.0%
HEAVY 12.0%
OTHERS 32.7%
BY
PRODUCT

Q4 & FY 2017 Results Review January 30th, 2018
17CE | Industry performance & Inventory management
Light
NAFTA 12%
EMEA 12%
LATAM 10%
APAC 26%
Industry Units(For FY 2017)
Heavy
NAFTA 9%
EMEA 11%
LATAM 16%
APAC 54%
▪ Q4 2017 underproduction vs. retail at 3%
▪ Production up 52% vs. Q4 2016
Inventory Management(Light & Heavy)
Q1 Q2 Q3 Q4 Q1 Q2 Q3 Q4 Q1 Q2 Q3 Q4
2015 2016 2017
COMPANY INVENTORY DEALER INVENTORY PRODUCTION RETAIL SALES

Q4 & FY 2017 Results Review January 30th, 2018
18CV | Financial Results
Operating Profit walkNet Sales
333 9 (18) 22 3 (18) (59) 272
FY 2016 VOLUME & MIX PRICING NET PROD COST SG&A R&D FX | OTHER FY 2017
($mn)
77%
15%
8%CHANGE VS FY 2016
TRUCKS 6.2%
BUSES 20.3%
OTHERS (1) 17.9%
▪ Net Sales at $10.4bn up 9.0% vs. last year (up 7.0% at
constant currency)
BY
PRODUCT
(1) Others are “Specialty vehicles”
CHANGE IN OPERATING PROFIT
(61)
(18.3%)
3.5% 2.6%
Unfavorable sales channel mix and Euro 6 emissions
content costs not fully recovered in pricing
Manufacturing efficiencies
Increased spending on R&D (*) for new product programs
and impact of GBP devaluation (**)
(*) R&D up 9% vs. FY 2016(**) GBP devaluation impact at $42mn
131 34 (7) (22) (7) (14) (21) 94
Q4 2016 Q4 2017
82%
8%
10%CHANGE VS FY 2016
NAFTA n.m.
EMEA 6.4%
LATAM 13.8%
APAC 35.4%
BY
REGION

Q4 & FY 2017 Results Review January 30th, 2018
19CV | Industry performance & Inventory management
TRUCKS >3.5T
EMEA (*) 5%
LATAM (*) 16%
APAC (*) 8%
Industry Units(For FY 2017)
Inventory Management(CV – All Equipment)
FY 2017 – Europe Trucks
MKT SHARE(1) CHG VS ‘16 ORDERSChg. Y-o-Y
DELIVERIESChg. Y-o-Y
B-TO-B
Light (3.5-7.49t) 15.0% (0.3) p.p. 9% 4% 1.03
M&H (≥7.5t) 9.4% (0.4) p.p. 2% (2%) 1.03
Europe (*) 12.8% (0.3) p.p. 7% 2% 1.03
▪ Q4 2017 underproduction vs.
retail at 13%
▪ Production level up 11% vs.
Q4 2016
Q1 Q2 Q3 Q4 Q1 Q2 Q3 Q4 Q1 Q2 Q3 Q4
2015 2016 2017
COMPANY INVENTORY
DEALER INVENTORY
PRODUSCTION
RETAIL SALES
(2)
(2)
(*) Reflects aggregate for key markets where the Company competes: EMEA / Europe: EU 27 countries reflecting key markets where the segment competes (excluding United Kingdom and Ireland for market share and TIV reporting purposes);
LATAM: Brazil, Argentina and Venezuela; APAC: Russia, Turkey, South East Asia, Australia, New Zealand (1) Company’s estimated market share in the European truck market (GVW ≥3.5 tons) (2) Reconciliation with old segmentation in Appendix

Q4 & FY 2017 Results Review January 30th, 2018
20PT | Financial Results
Net Sales & Operating Profit
3%
73%
6%
18% CHANGE VS FY 2016
NAFTA 8.3%
EMEA 15.9%
LATAM 25.0%
APAC 26.2%
BY
REGION
Chg. vs. FY ’16
ENGINES 606.7k 13%
TRANSMISSIONS 70.4k (6%)
AXLES 193.9k 2%
Units Sold
Engines sold to third party at
54% vs. 57% in FY 2016
▪ Net Sales at $4.4bn up 18% vs. last year (up 16% at constant currency)
▪ Sales to external customers at 48% (47% in FY 2016)
▪ Operating Profit at $362mn up $130mn or 56% vs. last year17%
3%
26%
54%BY
CUSTOMER
3RD PARTY
CV
CE
AG
Operating Margin Evolution
EN
GIN
ES
SO
LD
(K U
NIT
S)
OP. M
AR
GIN
(%)
90%
2%8% CHANGE VS FY 2016
ENGINES 19.4%
TRANSM. (2.9%)
AXLES 8.8%
BY
PRODUCT
-
3,0
6,0
9,0
12,0
-
150
300
450
6008.3%
FY 2013 FY 2014 FY 2015 FY 2016 FY 2017
40% 47% 55% 57% 54%3RD PARTY
UNITS (%)
3RD PARTYCVCEAG OPERATING MARGIN

Corporate Presentation 2017
FY 2018E US GAAP
Financial Targets

Q4 & FY 2017 Results Review January 30th, 2018
22FY 2018E | Industry Units
TRACTORS COMBINES LIGHT HEAVY TRUCKS >3.5T
NAFTA
Flat - 5%
10% Flat - 5% Flat – 5% -
Flat – 5%
EMEA 5% Flat – 5% Flat Flat (5%) - Flat
LATAM Flat – 5% 5% 5% - 10% 5% - 10% 10% - 15%
APAC Flat Flat - 5% Flat - 5% Flat - 5% (5%) - Flat
AG CE
0-140 HP
140+ HP
1 Reflects aggregate for key markets where Company competes
CV(1)

Q4 & FY 2017 Results Review January 30th, 2018
23FY 2018E | US GAAP Financial Targets
(*) Outlook is not provided on diluted EPS, most comparable GAAP financial measure of this non-GAAP financial measure, as the income or expense excluded from the calculation of adjusted diluted EPS are, by definition, not predictable and uncertain
FY 2018E Guidance:
Net sales of Industrial Activities $27bn - $28bn
Adjusted diluted EPS (*) $0.63 - $0.67
Net industrial debt $0.8bn - $1.0bn
As a result of the forecasted improvement in product demand conditions, and the
positive impact of changes in the Company’s capital structure, the Company is setting
its full year 2018 guidance as follows:

Appendix

Q4 & FY 2017 Results Review January 30th, 2018
25Reconciliation of Operating Profit (loss) to Net Income (Loss) under US GAAP
(1) In the year ended December 31, 2017, Interest expenses includes the charge of $56 million related to the repurchase/early redemption of notes. In the three months and year ended December 31, 2016, this item included the charge of $22mn
and $60 million, respectively, related to the repurchase of notes.
(2) In the three months and year ended December 31, 2017, Other, net includes a non-cash charge of $92 million due to the deconsolidation of Venezuelan operations effective December 31, 2017. In the three months and year ended December
31, 2016, this item included the non-recurring charge of $34 million due to the re-measurement and impairment of certain assets in Venezuela. In the year ended December 31, 2016, Other, net also included the non-recurring charge of
$551mn related to the European Commission settlement.
(3) In the three months and year ended December 31, 2017, Income tax (expense) includes a non-cash tax charge of $123 million due to the U.S. Tax Act and tax legislation changes in the U.K. and certain other countries. In the three months
and year ended December 31, 2016, Income tax (expense) included a non-cash tax charge of $59 million accounted for in connection with the reorganization of Latin American operations, intended to simplify corporate structure and promote
operational efficiencies, and including changes in valuation allowances recorded against deferred tax assets in the region.
(4) In the three months and year ended December 31, 2016, Equity in income of unconsolidated subsidiaries and affiliates included a net positive impact of $19 million and a net negative impact of $9 million, respectively, due to the restructuring of
our joint ventures in China.
Q4 2017 Q4 2016 Δ FY 2017 FY 2016 Δ
Industrial Activities Operating Profit 468 412 56 1,519 1,291 228
Financial Services Operating Profit 114 115 (1) 479 478 1
Elimination & Other (88) (86) (2) (336) (330) (6)
Operating Profit 494 441 53 1,662 1,439 223
Restructuring expenses (16) (13) (3) (93) (44) (49)
Interest expenses of Industrial Activities, net of interest income and eliminations (1) (114) (151) 37 (484) (543) 59
Other, net (2) (196) (115) (81) (405) (861) 456
Income before income taxes and Equity in income of unconsolidated
subsidiaries and affiliates168 162 6 680 (9) 689
Income Taxes (3) (230) (119) (111) (455) (298) (157)
Equity in income of unconsolidated subsidiaries and affiliates (4) 22 53 (31) 88 58 30
Net Income (Loss) (40) 96 (136) 313 (249) 562
Net Income / (Loss) attributable to non-controlling interest 6 1 5 18 3 15
Net Income / (Loss) attributable to CNH Industrial N.V. (46) 95 (141) 295 (252) 547
Adjusted Net Income (reconciliation on next page) 197 197 - 669 482 187
EPS (Basic) (0.03) 0.07 (0.10) 0.22 (0.18) 0.40
EPS (Diluted) (0.03) 0.07 (0.10) 0.22 (0.18) 0.40
Adjusted diluted EPS 0.14 0.14 - 0.48 0.35 0.13

Q4 & FY 2017 Results Review January 30th, 2018
26Q4 & FY 2017
Reconciliation of Adj. net income and Adj. income taxes to the most comparable GAAP financial measure and
determination of Adj. diluted EPS and Adj. ETR under U.S.GAAP
FY 2017 FY 2016 Q4 2017 Q4 2016
313 (249) Net income (loss) (40) 96
249 689Adjustments impacting Income (loss) before income tax (expense) and equity in income of
unconsolidated subsidiaries and affiliates (a)116 69
107 33 Adjustments impacting Income tax (expense) (b) 121 51
- 9 Adjustments impacting Equity in income of unconsolidated subsidiaries and affiliates (c) - (19)
669 482 Adjusted net income 197 197
651 478 Adjusted net income attributable to CNH Industrial N.V. 191 195
1,367 1,364 Weighted average shares outstanding – diluted (million) 1,367 1,364
0.48 0.35 Adjusted diluted EPS ($) 0.14 0.14
680 (9)Income (loss) before income tax (expense) and equity in income of
unconsolidated subsidiaries and affiliates168 162
249 689Adjustments impacting Income (loss) before income tax (expense) and equity in income of
unconsolidated subsidiaries and affiliates (a)116 69
929 680Adjusted income (loss) before income tax (expense) and equity in income of
unconsolidated subsidiaries and affiliates (A)284 231
(455) (298) Income Tax (expense) (230) (119)
107 33 Adjustments impacting Income tax (expense) (b) 121 51
(348) (265) Adjusted income tax (expense) (B) (109) (68)
37% 39% Adjusted Effective Tax Rate (Adjusted ETR) (C=B/A) 38% 29%

Q4 & FY 2017 Results Review January 30th, 2018
27Q4 & FY 2017
Reconciliation of Adj. net income and Adj. income taxes to the most comparable GAAP financial measure and
determination of Adj. diluted EPS and Adj. ETR under U.S.GAAP
FY 2017 FY 2016 Q4 2017 Q4 2016
(a) Adjustments impacting Income (loss) before income tax (expense) and equity in
income of unconsolidated subsidiaries and affiliates
93 44 Restructuring expenses 16 13
92 34Venezuelan re-measurement and impairment of assets, and 2017 year-end deconsolidation of Venezuelan
operations92 34
- 551 European Commission settlement - -
64 60 Cost of repurchase/early redemption of notes 8 22
249 689 Total 116 69
(b) Adjustments impacting Income tax (expense)
(16) (26)Tax effect of adjustments impacting Income (loss) before income tax (expense) and equity in income of
unconsolidated subsidiaries and affiliates(2) (8)
123 - Tax charges due to the U.S. Act and tax legislation changes in the U.K. and certain other countries 123 -
- 59 Tax charge on LATAM corporate reorganization - 59
107 33 Total 121 51
(c) Adjustments' impacting Equity in income of unconsolidated subsidiaries and
affiliates
-9 Chinese JVs restructuring
-(19)
-9 Total
-(19)
Q4 & FY 2017 Results Review January 30th, 2018
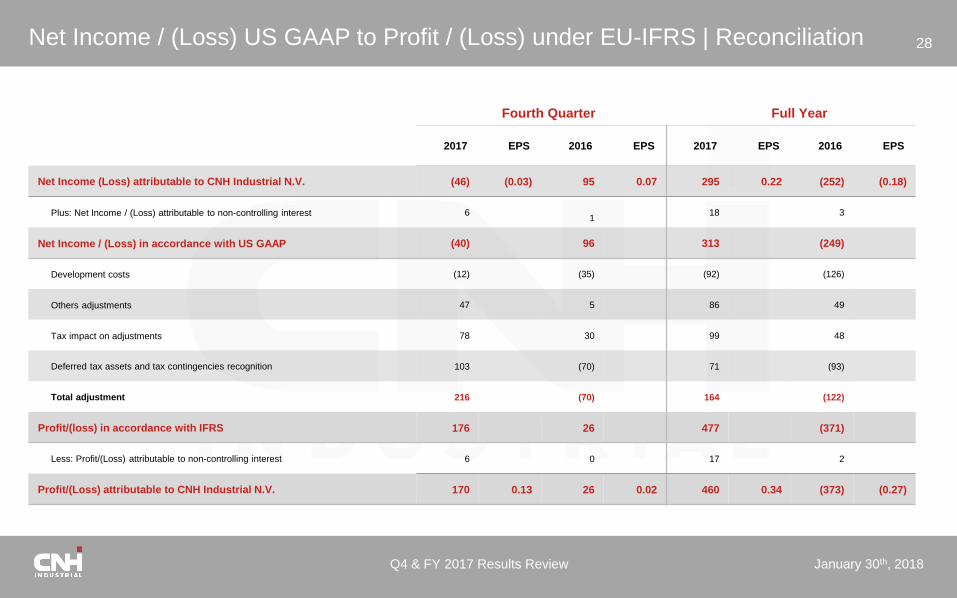
28Net Income / (Loss) US GAAP to Profit / (Loss) under EU-IFRS | Reconciliation
2017 EPS 2016 EPS 2017 EPS 2016 EPS
Net Income (Loss) attributable to CNH Industrial N.V. (46) (0.03) 95 0.07 295 0.22 (252) (0.18)
Plus: Net Income / (Loss) attributable to non-controlling interest 61
18 3
Net Income / (Loss) in accordance with US GAAP (40) 96 313 (249)
Development costs (12) (35) (92) (126)
Others adjustments 47 5 86 49
Tax impact on adjustments 78 30 99 48
Deferred tax assets and tax contingencies recognition 103 (70) 71 (93)
Total adjustment 216 (70) 164 (122)
Profit/(loss) in accordance with IFRS 176 26 477 (371)
Less: Profit/(Loss) attributable to non-controlling interest 6 0 17 2
Profit/(Loss) attributable to CNH Industrial N.V. 170 0.13 26 0.02 460 0.34 (373) (0.27)
Fourth Quarter Full Year
Q4 & FY 2017 Results Review January 30th, 2018
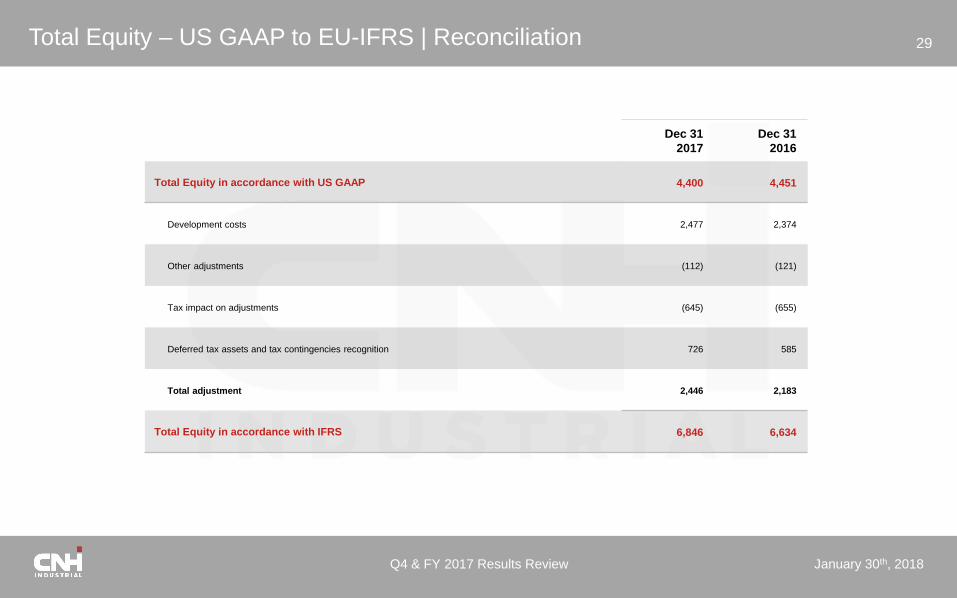
29Total Equity – US GAAP to EU-IFRS | Reconciliation
Dec 31
2017
Dec 31
2016
Total Equity in accordance with US GAAP 4,400 4,451
Development costs 2,477 2,374
Other adjustments (112) (121)
Tax impact on adjustments (645) (655)
Deferred tax assets and tax contingencies recognition 726 585
Total adjustment 2,446 2,183
Total Equity in accordance with IFRS 6,846 6,634

Q4 & FY 2017 Results Review January 30th, 2018
30Reconciliation of Total Debt to Net Debt (US GAAP)
(1) Total Debt of Industrial Activities includes Intersegment notes payable to Financial Services of $935 million and $997 million as of December 31, 2017 and 2016, respectively. Total Debt of Financial Services includes Intersegment notes
payable to Industrial Activities of $1,641 million and $1,479 million as of December 31, 2017 and 2016, respectively.
(2) The net intersegment receivable/payable balance owed by Financial Services to Industrial Activities was $706 million and $482 million as of December 31, 2017 and 2016, respectively
Dec 31,
2017
Dec 31,
2016
Dec 31,
2017
Dec 31,
2016
Dec 31,
2017
Dec 31,
2016
Third party debt 25,895 25,276 6,461 6,694 19,434 18,582
Intersegment notes payable - - 935 997 1,641 1,479
Total Debt (1) 25,895 25,276 7,396 7,691 21,075 20,061
Less:
Cash and cash equivalents 5,430 5,017 4,901 4,649 529 368
Restricted cash 770 837 - - 770 837
Intersegment notes receivables - - 1,641 1,479 935 997
Derivatives hedging debt (7) 2 (7) 2 - -
Net Debt / (Cash) (2) 19,702 19,420 861 1,561 18,841 17,859
Consolidated Industrial Activities Financial Services

Q4 & FY 2017 Results Review January 30th, 2018
31From Total Debt to Net Industrial Debt
Dec 31,
2017
Dec 31,
2016
Total Debt (1) (25,895) (25,276)
Financial Services Third Party Debt 19,434 18,582
Intersegment Note Payables (935) (997)
Intersegment Note Receivables 1,641 1,479
Cash and cash equivalents 4,901 4,649
Restricted cash-
-
Derivatives hedging debt (7) 2
Net Industrial (Debt) / Cash (2) (861) (1,561)
FY
2017
FY
2016
Net Industrial (Debt) / Cash at beginning
of period(1,561) (1,578)
Net income (loss) 313 (249)
Add back European Commission settlement (1) - 551
Add back cost of repurchase/early redemption
of Notes (1)56 60
Amortization and depreciation (2) 720 710
Changes in provisions and similar (3) 485 194
Change in working capital 130 330
Investments in property, plant and equipment,
and intangible assets (2)(488) (501)
Other changes 73 (50)
Net Industrial cash flow 1,289 1,045
Capital increases and dividends (4) (193) (221)
Currency translation differences and other (5) (396) (807)
Change in Net industrial debt 700 17
Net Industrial (Debt) / Cash (861) (1,561)
(1) Total Debt of Industrial Activities includes Intersegment notes payable to Financial Services of
$935mn and $997 million as of December 31, 2017 and 2016, respectively. Total Debt of Financial
Services includes Intersegment notes payable to Industrial Activities of $1,641 million and $1,479
million as of December 31, 2017 and 2016, respectively.
(2) The net intersegment receivable/payable balance owed by Financial Services to Industrial Activities
was $706 million and $482 million as of December 31, 2017 and 2016, respectively (1) Add back item to be excluded from the calculation of net industrial cash flow.
(2) Excluding assets sold under buy-back commitments and assets under operating leases
(3) This item also includes changes in items related to assets sold under buy-back commitments, and assets under operating
leases. In the three months ended December 31, 2016, this item excluded the funds utilization due to the payment of the
$551 million following European Commission settlement.
(4) This item also includes share buy-back transactions.
(5) In the year ended December 31, 2017, this item includes the charge of $56 million related to the repurchase/early redemption
of notes. In the three months and year ended December 31, 2016, this item included the charge of $22 million and $60mn,
respectively, related to the repurchase of notes. In the year ended December 31, 2016, this item also included the payment
of the European Commission settlement

Q4 & FY 2017 Results Review January 30th, 2018
32Debt Maturity Schedule | Breakdown
Outstanding
Dec 31, 2017 2018 2019 2020 2021 2022 Beyond
4.2 Bank Debt 1.4 1.0 1.2 0.2 0.2 0.2
9.4 Capital Market 1.9 1.2 0.6 1.8 1.2 2.7
0.2 Other Debt 0.1 0.0 0.0 0.0 0.0 0.0
13.9 Cash Portion of Debt Maturities 3.5 2.3 1.9 2.0 1.4 2.8
6.2 Cash & Cash Equivalents
0.8 of which restricted cash
3.2 Undrawn Committed credit lines
9.4 Total Available Liquidity
Note: Numbers may not add due to rounding

Q4 & FY 2017 Results Review January 30th, 2018
33CV | Industry performance | Europe Trucks
(*) Europe: EU 27 countries reflecting key markets where the segment competes (excluding United Kingdom and Ireland for market share reporting purposes); (1) Company’s estimated market share in the European truck market (GVW ≥3.5 tons)
Q4 FY
2014 2015 2016 2017 14/15 15/16 16/17 2014 2015 2016 2017 14/15 15/16 16/17
MKT SHARE(1) Light (3.5-7.49t) MKT SHARE(1) 14.2% 14.6% 15.8% 16.3% 0.4 p.p. 1.2 p.p. 0.5 p.p. 13.8% 14.6% 15.3% 15.0% 0.8 p.p. 0.7 p.p. (0.3) p.p.
M&H (≥7.5t) 10.0% 10.6% 11.0% 9.5% 0.6 p.p. 0.4 p.p. (1.5) p.p. 9.8% 9.8% 9.8% 9.4% 0.0 p.p. 0.0 p.p. (0.4) p.p.
Europe (*) 12.5% 12.9% 13.8% 13.6% 0.4 p.p. 0.9 p.p. (0.2) p.p. 12.2% 12.7% 13.1% 12.8% 0.5 p.p. 0.4 p.p. (0.3) p.p.
ORDERS Light (3.5-7.49t) ORDERS 42% (5%) 30% 27% 7% 9%
M&H (≥7.5t) 26% (5%) 22% 33% 2% 2%
Europe (*) 37% (5%) 28% 29% 6% 7%
DELIVERIES Light (3.5-7.49t) DELIVERIES 25% 4% 21% 23% 16% 4%
M&H (≥7.5t) 28% 7% 1% 24% 8% (2%)
Europe (*) 26% 5% 14% 23% 14% 2%
B-TO-B Light (3.5-7.49t) B-TO-B 1.39 0.95 1.02 1.06 0.98 1.03
M&H (≥7.5t) 1.15 0.75 0.91 1.04 0.99 1.03
Europe (*) 1.32 0.88 0.99 1.05 0.98 1.03
MKT SHARE(1) Light MKT SHARE(1) 12.9% 13.3% 14.5% 14.9% 0.4 p.p. 1.2 p.p. 0.4 p.p. 12.5% 13.2% 13.9% 13.5% 0.7 p.p. 0.7 p.p. (0.4) p.p.
Medium 31.4% 27.6% 32.8% 34.1% (3.8) p.p. 5.2 p.p. 1.3 p.p. 29.9% 31.5% 34.0% 35.0% 1.6 p.p. 2.5 p.p. 1.0 p.p.
Heavy 8.5% 9.6% 9.6% 8.3% 1.1 p.p. 0.0 p.p. (1.3) p.p. 8.2% 8.6% 8.5% 8.2% 0.4 p.p. (0.1) p.p. (0.3) p.p.
Europe (*) 12.5% 12.9% 13.8% 13.6% 0.4 p.p. 0.9 p.p. (0.2) p.p. 12.2% 12.7% 13.1% 12.8% 0.5 p.p. 0.4 p.p. (0.3) p.p.
ORDERS Light ORDERS 42% (5%) 30% 27% 7% 9%
Medium 29% (14%) 21% 31% (9%) 4%
Heavy 24% (1%) 22% 34% 7% 1%
Europe (*) 37% (5%) 28% 29% 6% 7%
DELIVERIES Light DELIVERIES 25% 4% 21% 23% 16% 4%
Medium 13% 4% (4%) 13% 4% (7%)
Heavy 35% 8% 3% 30% 9% (0%)
Europe (*) 26% 5% 14% 23% 14% 2%
B-TO-B Light B-TO-B 1.39 0.95 1.02 1.06 0.98 1.03
Medium 1.27 0.72 0.91 1.07 0.93 1.05
Heavy 1.11 0.77 0.91 1.03 1.01 1.02
Europe (*) 1.32 0.88 0.99 1.05 0.98 1.03
OLD
SEGMENTATION
NEW
SEGMENTATION

Q4 & FY 2017 Results Review January 30th, 2018
34Geographic Information
Certain financial and market information in this presentation has been presented by geographic area. CNH Industrial defines its geographic areas as
▪ NAFTA: United States, Canada and Mexico
▪ LATAM: Central and South America, and the Caribbean Islands
▪ APAC: Continental Asia (including Turkey and Russia), Oceania and member countries of the Commonwealth of Independent States (excluding Ukraine)
▪ EMEA: member countries of the European Union, European Free Trade Association, Ukraine, Balkans, African continent, and Middle East (excluding Turkey)
Market Share / Market Position Data
▪ Certain industry and market share information in this report has been presented on a worldwide basis which includes all countries.
▪ In this presentation, management estimates of market share information are generally based on retail unit data in North America, on registrations of equipment in most of Europe,
Brazil, and various APAC markets, and on retail and shipment unit data collected by a central information bureau appointed by equipment manufacturers associations, including
the Association of Equipment Manufacturers’ in North America, the Committee for European Construction Equipment in Europe, the ANFAVEA in Brazil, the Japan Construction
Equipment Manufacturers Association, and the Korea Construction Equipment Manufacturers Association, as well as on other shipment data collected by an independent service
bureaus.
▪ Not all agricultural or construction equipment is registered, and registration data may thus underestimate, perhaps substantially, actual retail industry unit sales demand,
particularly for local manufacturers in China, Southeast Asia, Eastern Europe, Russia, Turkey, Brazil, and any country where local shipments are not reported.
▪ For Commercial Vehicles regions are defined for both market share and TIV reporting purposes as: EMEA / Europe (EU 27 countries reflecting key markets where the segment
competes excluding United Kingdom and Ireland); LATAM (Brazil, Argentina and Venezuela) and APAC (Russia, Turkey, South East Asia, Australia, New Zealand)
▪ In addition, there may also be a period of time between the shipment, delivery, sale and/or registration of a unit, which must be estimated, in making any adjustments to the
shipment, delivery, sale, or registration data to determine our estimates of retail unit data in any period

Q4 & FY 2017 Results Review January 30th, 2018
35Non-GAAP Financial Measures
CNH Industrial monitors its operations through the use of several non-GAAP financial measures. CNH Industrial’s management believes that these non-GAAP financial measures provide useful and relevant information regarding itsresults and allow management and investors to assess CNH Industrial’s operating trends, financial performance and financial position. Management uses these non-GAAP measures to identify operational trends, as well as makedecisions regarding future spending, resource allocations and other operational decisions as they provide additional transparency with respect to our core operations. These non-GAAP financial measures have no standardized meaningpresented in U.S. GAAP or EUIFRS and are unlikely to be comparable to other similarly titled measures used by other companies due to potential differences between the companies in calculations. As a result, the use of these non-GAAPmeasures has limitations and should not be considered as substitutes for measures of financial performance and financial position prepared in accordance with U.S. GAAP and/or EU-IFRS.
CNH Industrial non-GAAP financial measures are defined as follows:
Operating Profit under U.S. GAAP: Operating Profit of Industrial Activities is defined as net sales less cost of goods sold, selling, general and administrative expenses, and research and development expenses. Operating Profit of Financial Services is defined as revenues less selling, general and administrative expenses, interest expenses and certain other operating expenses.
Trading Profit under EU-IFRS: Trading Profit is derived from financial information prepared in accordance with EU-IFRS and is defined as net revenues less cost of sales, selling, general and administrative costs, research and development costs, and other operating income and expenses.
Operating Profit under EU-IFRS: Operating Profit under EU-IFRS is computed starting from Trading Profit under EUIFRS plus/minus restructuring costs, other income (expenses) that are unusual in the ordinary course of business (such as gains and losses on the disposal of investments and other unusual items arising from infrequent external events or market conditions).
Adjusted Net Income (Loss): is defined as net income (loss), less restructuring charges and exceptional items, after tax. In particular, exceptional items are specifically disclosed items that management considers rare or discrete events that are infrequent in nature and not reflective of on-going operational activities.
Adjusted Diluted EPS: is computed by dividing Adjusted Net Income (loss) attributable to CNH Industrial N.V. by a weighted-average number of common shares outstanding during the period that takes into consideration potential common shares outstanding deriving from the CNH Industrial share-based payment awards, when inclusion is not antidilutive. When we provide guidance for adjusted diluted EPS, we do not provide guidance on an earnings per share basis because the GAAP measure will include potentially significant items that have not yet occurred and are difficult to predict with reasonable certainty prior to year-end.
Adjusted income taxes: is defined as income taxes less the tax effect of restructuring expenses and exceptional items and exceptional tax charges.
Adjusted Effective Tax Rate (Adjusted ETR): is computed by dividing a) adjusted income taxes by b) income (loss) before income taxes and equity in income of unconsolidated subsidiaries and affiliates, less restructuring expenses and exceptional items.
Net Debt and Net Debt of Industrial Activities (or Net Industrial Debt): Net Debt is defined as total debt less intersegment notes receivable, cash and cash equivalents, restricted cash and derivative hedging debt. CNH Industrial provides the reconciliation of Net Debt to Total Debt, which is the most directly comparable measure included in the consolidated balance sheets. Due to different sources of cash flows used for the repayment of the debt between Industrial Activities and Financial Services (by cash from operations for Industrial Activities and by collection of financing receivables for Financial Services), management separately evaluates the cash flow performance of Industrial Activities using Net Debt of Industrial Activities.
Available Liquidity: is defined as cash and cash equivalents plus restricted cash and undrawn committed facilities.
Change excl. FX or Constant Currency: CNH Industrial discusses the fluctuations in revenues on a constant currency basis by applying the prior year average exchange rates to current year’s revenues expressed in local currency in order to eliminate the impact of foreign exchange rate fluctuations.

Corporate Presentation 2017
Investor Relations Team
e-mail: [email protected]
website: www.cnhindustrial.com
▪ Federico Donati – Head of Global Investor Relations +44 (207) 76 - 60386
+39 (011) 00 - 71929
▪ Noah Weiss – Investor Relations North America +1 (630) 887 - 3745