q4 2020 results - static.seekingalpha.com
TRANSCRIPT

1
Q4 2020 results
10 February 2021
ESG leader with a
sustainable dividend yield

2
Forward-Looking Statements
This document may contain forward-looking information and statements about Aperam and its subsidiaries. These
statements include financial projections and estimates and their underlying assumptions, statements regarding
plans, objectives and expectations with respect to future operations, products and services, and statements
regarding future performance. Forward-looking statements may be identified by the words “believe,” “expect,”
“anticipate,” “target” or similar expressions. Although Aperam’s management believes that the expectations
reflected in such forward-looking statements are reasonable, investors and holders of Aperam’s securities are
cautioned that forward-looking information and statements are subject to numerous risks and uncertainties, many
of which are difficult to predict and generally beyond the control of Aperam, in particular, the length and severity of
the recent COVID-19 (coronavirus) outbreak, including its impacts in the sector, macroeconomic conditions and in
Aperam's principal local markets, that could cause actual results and developments to differ materially and
adversely from those expressed in, or implied or projected by, the forward-looking information and statements.
These risks and uncertainties include those discussed or identified in Aperam’s filings with the Luxembourg Stock
Market Authority for the Financial Markets (Commission de Surveillance du Secteur Financier). Aperam
undertakes no obligation to publicly update its forward-looking statements or information, whether as a result of
new information, future events, or otherwise.
DisclaimerDisclaimer

3
1. Q4 2020 highlights page 4
2. Financial results page 12
3. Value Strategy page 17
4. ESG page 26
5. Business Overview page 39
• Group Segments & corporate structure page 40
• Stainless & Electrical Steel Europe page 47
• Stainless & Electrical Steel South America page 52
• Services & Solution page 57
• Alloys & Specialties page 60
• Appendix page 64
Content

4
Strong mix in Brazil. Volumes in Europe are up yoy
Continuing positive price momentum from a low base is
needed to offset rising raw material costs
Tight cost control & flexible business model yield
highest Q4 adj EBITDA since 2017
Leadership Journey© phase 3 completed above target
(EUR223m cumulative gains 2018 - 2020)
2030 CO2 reduction target doubled to -30% vs 2015*
Internal CO2 price doubled to EUR60/t to reflect our ESG
ambition**
Economic recovery, cost control and seasonal improvement
yield best Q4 since 2017. Sharper CO2 reduction targets
Q4 2020 Operational highlights
Our downturn proven flexible business model will also deliver in the recovery
Q4 2020 key developments
* Aperam’s CO2 reduction ambition is consistent with the EU reduction target ** used for project evaluation
5
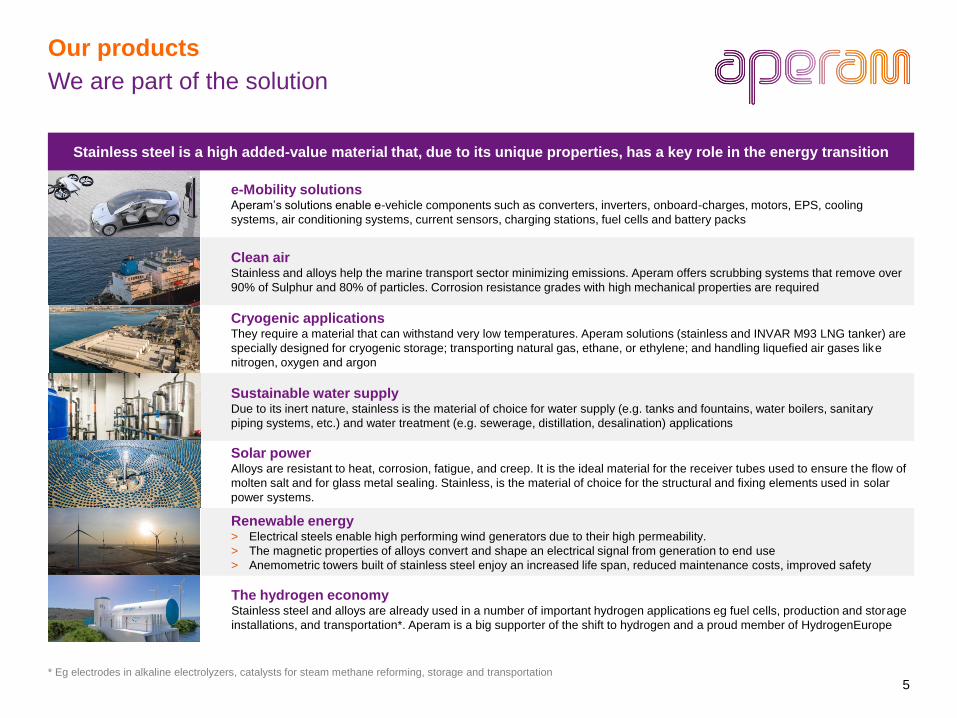
Sustainable water supply Due to its inert nature, stainless is the material of choice for water supply (e.g. tanks and fountains, water boilers, sanitary
piping systems, etc.) and water treatment (e.g. sewerage, distillation, desalination) applications
Renewable energy> Electrical steels enable high performing wind generators due to their high permeability.
> The magnetic properties of alloys convert and shape an electrical signal from generation to end use
> Anemometric towers built of stainless steel enjoy an increased life span, reduced maintenance costs, improved safety
Clean airStainless and alloys help the marine transport sector minimizing emissions. Aperam offers scrubbing systems that remove over
90% of Sulphur and 80% of particles. Corrosion resistance grades with high mechanical properties are required
We are part of the solution
Our products
Solar power Alloys are resistant to heat, corrosion, fatigue, and creep. It is the ideal material for the receiver tubes used to ensure the flow of
molten salt and for glass metal sealing. Stainless, is the material of choice for the structural and fixing elements used in solar
power systems.
The hydrogen economy Stainless steel and alloys are already used in a number of important hydrogen applications eg fuel cells, production and storage
installations, and transportation*. Aperam is a big supporter of the shift to hydrogen and a proud member of HydrogenEurope
Cryogenic applications They require a material that can withstand very low temperatures. Aperam solutions (stainless and INVAR M93 LNG tanker) are
specially designed for cryogenic storage; transporting natural gas, ethane, or ethylene; and handling liquefied air gases like
nitrogen, oxygen and argon
e-Mobility solutions Aperam’s solutions enable e-vehicle components such as converters, inverters, onboard-charges, motors, EPS, cooling
systems, air conditioning systems, current sensors, charging stations, fuel cells and battery packs
* Eg electrodes in alkaline electrolyzers, catalysts for steam methane reforming, storage and transportation
Stainless steel is a high added-value material that, due to its unique properties, has a key role in the energy transition

6
• Shipments were flat qoq as S&S
shipped more Aperam material
• Adj EBITDA increase due to positive
mix, higher volume in Europe and
strict cost control
• Exceptionals: EBITDA: EUR65m
Pis/COFINS*, -EUR15m LJ 4
restructuring provision, Fin. result
EUR51m Pis/COFINS
• EPS increased qoq due to higher
adj EBITDA and exceptional items
• Strong operating CF with 97% adj
EBITDA to cash conversion due to
low cash tax and cash interest
• FCF is solid and more than covers
the dividend despite very sensible
working capital management
• Strong balance sheet with 0.2x
NFD/EBITDA
Aperam‘s flexible business model delivers in the upturn as
well as in downturns
XXXSolid FCF enabled a further net debt reduction
Q4 2020 Financial highlights
Q4 key comments
EURm Q4 20 Q3 20 qoq Q4 19 yoy
Sales 916 841 9% 1,000 -8%
adj. EBITDA 109 65 68% 85 28%
EBITDA 159 65 145% 102 56%
Basic EPS (EUR) 1.26 0.30 319% 0.36 247%
Steel shipments (000t) 431 432 0% 402 7%
adj EBITDA/tonne (EUR) 253 150 68% 211 20%
adj EBITDA margin 11.9% 7.7% 54% 8.5% 40%
Operating cash flow 106 77 38% 162 -35%
CAPEX -19 -22 -14% -52 -63%
Free cash flow* 88 55 60% 140 -37%
Dividends paid -35 -35 0% -35 0%
Net financial debt 67 111 -40% 75 -11%
Solid EBITDA, positive net income & positive FCF

7
Healthy demand drives inventory down and import pressure
eased temporarily
Market update
Weak Below normal Normal Strong number = share of Aperam revenue
• Production has normalized. Outlook remains positive
• Demand is strong with a stable outlook
• Normal demand in food & health. Catering is weak due to COVID effect on tourism & restaurants
• Slightly lower level of activity. Soft pipeline might impact H1-21
• Project pipeline remains light
Automotive & Transport
Consumer Goods
Food, Health & Catering
Construction
Industry, Energy,
Chemical
End markets continue to recover
Import pressure eased in Q4 Inventory is low - both in tonnes as well as in days
50
60
70
80
90
100
55,000
60,000
65,000
70,000
75,000
80,000
85,000
90,000
Q2
17
Q3
17
Q4
17
Q1
18
Q2
18
Q3
18
Q4
18
Q1
19
Q2
19
Q3
19
Q4
19
Q1
20
Q2
20
Q3
20
Q4
20
German distributors inventory (t) Days
XX%
10.0%
20.0%
30.0%
40.0%
50.0%
0
100,000
200,000
300,000
400,000
Q1
-16
Q3
-16
Q1
-17
Q3
-17
Q1
-18
Q3
-18
Q1
-19
Q3
-19
Q1
-20
Q3
-20
ton
nes
Imports CR market share HR market share
XX%
8
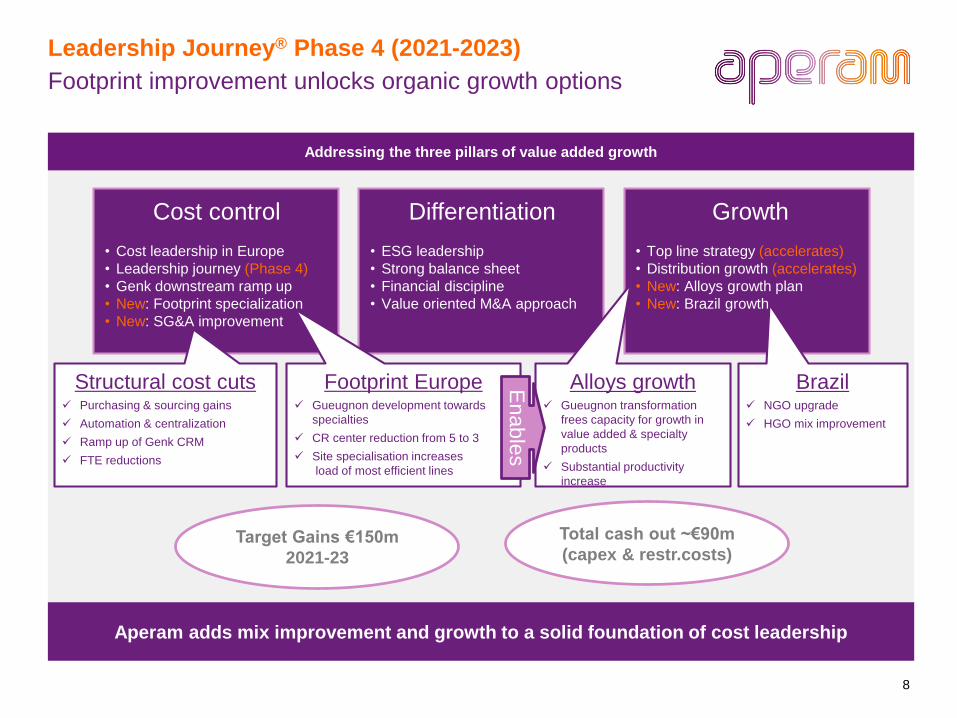
Footprint improvement unlocks organic growth options
Addressing the three pillars of value added growth
Leadership Journey® Phase 4 (2021-2023)
Aperam adds mix improvement and growth to a solid foundation of cost leadership
Cost control
• Cost leadership in Europe
• Leadership journey (Phase 4)
• Genk downstream ramp up
• New: Footprint specialization
• New: SG&A improvement
Growth
• Top line strategy (accelerates)
• Distribution growth (accelerates)
• New: Alloys growth plan
• New: Brazil growth
Differentiation
• ESG leadership
• Strong balance sheet
• Financial discipline
• Value oriented M&A approach
Footprint Europe Gueugnon development towards
specialties
CR center reduction from 5 to 3
Site specialisation increases
load of most efficient lines
Brazil NGO upgrade
HGO mix improvement
Alloys growth Gueugnon transformation
frees capacity for growth in
value added & specialty
products
Substantial productivity
increase
Structural cost cuts Purchasing & sourcing gains
Automation & centralization
Ramp up of Genk CRM
FTE reductions
Enab
les
Target Gains €150m
2021-23
Total cash out ~€90m
(capex & restr.costs)

9
Aperam defends the lowest cost position in Europe via
cost reductions paired with mix improvement & growth
Target savings composition
Leadership Journey® Phase 4 (2021-2023)
A smarter and lower cost footprint opens up growth opportunities
Growth &product portfolio
Raw material &purchasing
Fixed costs
Variable costs
2021 2022 2023
Lea
der
ship
Jou
rney
ga
ins
(EU
Rm
)
Sche-matic
CumulatedEUR150m
Sche-matic
Schematic
Cash outPhase 4 target gains
0
5
10
15
20
25
30
35
40
45
50
2021 2022 2023
EUR
m
Cash out
Σ EUR90m

10
Q1 2021 guidance & other forward looking items
Outlook
• Q1 2021 shipments are expected at a higher level qoq
• Adj. EBITDA is expected at a slightly higher level versus the high Q4 2020 base
– Seasonal trough quarter in Brazil and a softer demand in Alloys
– Higher prices and volumes in Europe
• Net financial debt is expected at a comparable level
2021 is the beginning of the next chapter of Aperam’s transformation
• FY 2021 group capex ~EUR130m (incl. Leadership Journey© phase 4)
• FY 2021 P&L effective tax rate expected at ~20% of which ~ half will be cash tax in CF
• FY 2021 dividend EUR1.75 (amounts to EUR140 million)
• Leadership Journey© Phase 4: EUR150 million savings target by end of 2023
Q1 2021 outlook:
Other items:
* Subject to the approval of the AGM

11
• 15 Feb Investor calls Bank of America
• 16 Feb Investor calls Bank of America
• 17 Feb Investor calls Bank of America
• 16. Mar Sustainable Metals & Mining Seminar Morgan Stanley
• 23. Mar Natural Resources Conference Exane
• 30. Mar Pan-European Midcap Conference Jefferies
We are looking forward to keep up the dialogue with you
Corporate Access
Post Q4 2020 schedule

12
Financial Results
Middle East Training Center, Beirut Rafic Hariri International Airport, Lebanon - Khatib & Alami Executed using grade316L with Uginox Méca 8ND fini

13* Difference with total Aperam’s quarterly adj EBITDA due to Others & Eliminations line
Stainless & Electrical Steel Alloys & Specialties Services & Solutions
• Shipments increased 4% qoq, 7% yoy
due to recovery in Europe and despite
seasonally weaker demand in Brazil
• QoQ: Europe adj EBITDA reflects
higher volumes paired lower costs and
inventory valuation gains. Brazil
benefited from a very favorable mix
and higher prices
• YoY: adj EBITDA improves due to
higher volumes and a better mix
despite lower inventory valuation gains
• Shipments declined by 1% qoq but
improved by 13% yoy
• QoQ higher adj EBITDA mainly reflects
better volumes and an inventory
valuation gain
• YoY: higher adj EBITDA due to higher
volumes, good cost management and
inventory valuation gains
• Shipments increase by 6% qoq but
decline by 26% yoy
• QoQ: higher adj. EBITDA was driven
by higher volume, a better mix, strict
cost management and a positive
inventory valuation
• YoY: higher adj EBITDA was driven by
a positive inventory valuation, a better
mix and cost improvements that
balanced lower volumes
71
42
89
177
101
206
Q4 19 Q3 20 Q4 20
adj EBITDA*(EURm)
adj EBITDA/t (€)
4
10
14
28
61
86
Q4 19 Q3 20 Q4 20
adj EBITDA*(EURm)
adj EBITDA/t (€)
14
10
15
1,489 1,515
2,308
Q4 19 Q3 20 Q4 20
adj EBITDA*(EURm)
adj EBITDA/t (€)
Very strong mix in Brazil, improving demand benefits
Europe together with inventory valuation gains
Adj. EBITDA of 252 EUR/t in Q4 2020 (+ EUR102/t qoq , +EUR41/t yoy)
Q4 2020 Segments

14
Q4 2020: Higher volume in Europe due to good demand
and a strong quarter in Brazil drive EBITDA higher
Financial results
Q4-20 was the best fourth quarter since the 2017 peak
Flat volumes qoq as S&S sells more own material
H2-20 volumes increased by 6% yoy
Q4 adj. EBITDA reflects a strong mix in Brazil and rising
prices in Europe
480
501
465
418
402
438
376
432 431
Q4 18 Q1 19 Q2 19 Q3 19 Q4 19 Q1 20 Q2 20 Q3 20 Q4 20
Shipments (thousand metric tonnes)
9081
95
7985
70
49
65
109
8.0%
6.9%
8.7%8.1%
8.5%
6.7%6.0%
7.7%
11.9%
Q4 18 Q1 19 Q2 19 Q3 19 Q4 19 Q1 20 Q2 20 Q3 20 Q4 20
Adj. EBITDA (m€) Adj. EBITDA as % of Sales
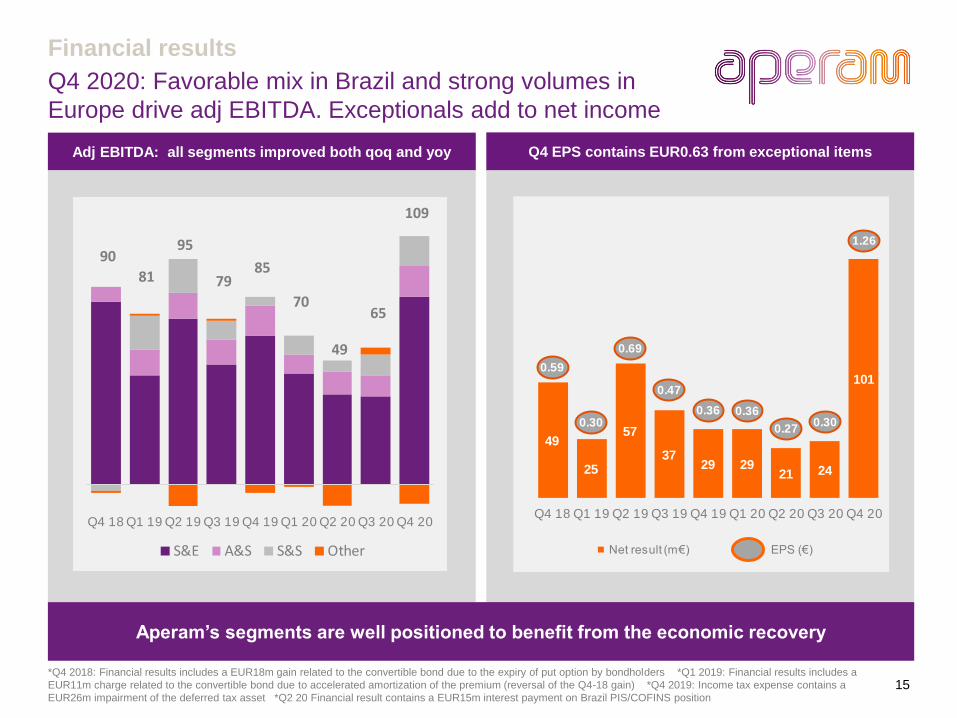
15
Adj EBITDA: all segments improved both qoq and yoy
Q4 2020: Favorable mix in Brazil and strong volumes in
Europe drive adj EBITDA. Exceptionals add to net income
Financial results
Aperam’s segments are well positioned to benefit from the economic recovery
*Q4 2018: Financial results includes a EUR18m gain related to the convertible bond due to the expiry of put option by bondholders *Q1 2019: Financial results includes a
EUR11m charge related to the convertible bond due to accelerated amortization of the premium (reversal of the Q4-18 gain) *Q4 2019: Income tax expense contains a
EUR26m impairment of the deferred tax asset *Q2 20 Financial result contains a EUR15m interest payment on Brazil PIS/COFINS position
Q4 EPS contains EUR0.63 from exceptional items
49
25
57
3729 29
21 24
1010.59
0.30
0.69
0.47
0.36 0.36
0.270.30
1.26
Q4 18 Q1 19 Q2 19 Q3 19 Q4 19 Q1 20 Q2 20 Q3 20 Q4 20
Net result (m€) EPS (€)
90
81
95
79 85
70
49
65
109
Q4 18 Q1 19 Q2 19 Q3 19 Q4 19 Q1 20 Q2 20 Q3 20 Q4 20
S&E A&S S&S Other

16
Q4 2020: Solid free cash flow even without squeezing working
capital results in an almost debt free balance sheet
Financial results
Aperam’s dividend rests on a solid balance sheet and a structurally high FCF generation
* Includes interest, taxes and other items
Higher EBITDA translates into a high FCF despite
Sensible working capital managementStrong balance sheet as NFD decreases qoq and yoy
35
24
72
45
140
18 34
55
88
Q4
18
Q1
19
Q2
19
Q3
19
Q4
19
Q1
20
Q2
20
Q3
20
Q4
20
Change in working capital Capex Free Cash Flow
EURm

17
© Adobe Stock
Value Strategy
Adobe stock
Bodega Irius, Barbastro, Huesca - Spain J. Marino Pascual y Asoc. Arquitectura
© Adriana Landaluce Executed using grade 316L with Uginox Top finish

18
Aperam foundation
Guiding principle: Combining growth, mix and cost
improvements to restore a normal level of profitability
LJ 4 adds new dimensions to a proven cost improving track record
Ow
n d
istrib
utio
n
& e
-busin
ess
Industry
leadin
g
ES
G p
ositio
n
Diffe
rntia
ted, s
table
Allo
ys b
usin
ess
Perfo
rmance &
cost
leader in
Euro
pe
Only
sta
inle
ss m
ill
in S
. Am
eric
a
De-commoditization
High cash generation
Progressive dividend policy
GrowthCost improvement
Solid balance sheet
Value added
distribution
Investment case & value strategy
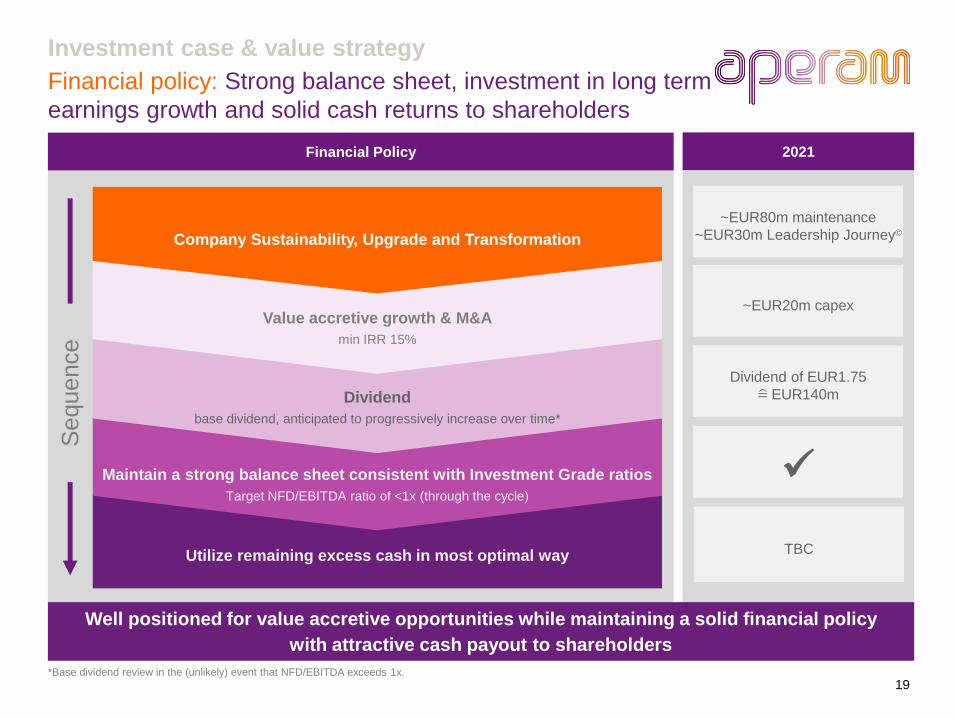
19
~EUR80m maintenance
~EUR30m Leadership Journey©
Dividend of EUR1.75
ෝ= EUR140m
Financial policy: Strong balance sheet, investment in long term
earnings growth and solid cash returns to shareholders
~EUR20m capex
Investment case & value strategy
Financial Policy 2021
Well positioned for value accretive opportunities while maintaining a solid financial policy
with attractive cash payout to shareholders
*Base dividend review in the (unlikely) event that NFD/EBITDA exceeds 1x.
TBCUtilize remaining excess cash in most optimal way
Maintain a strong balance sheet consistent with Investment Grade ratios
Target NFD/EBITDA ratio of <1x (through the cycle)
Dividend
base dividend, anticipated to progressively increase over time*
Value accretive growth & M&A
min IRR 15%
Company Sustainability, Upgrade and Transformation
Sequence
20
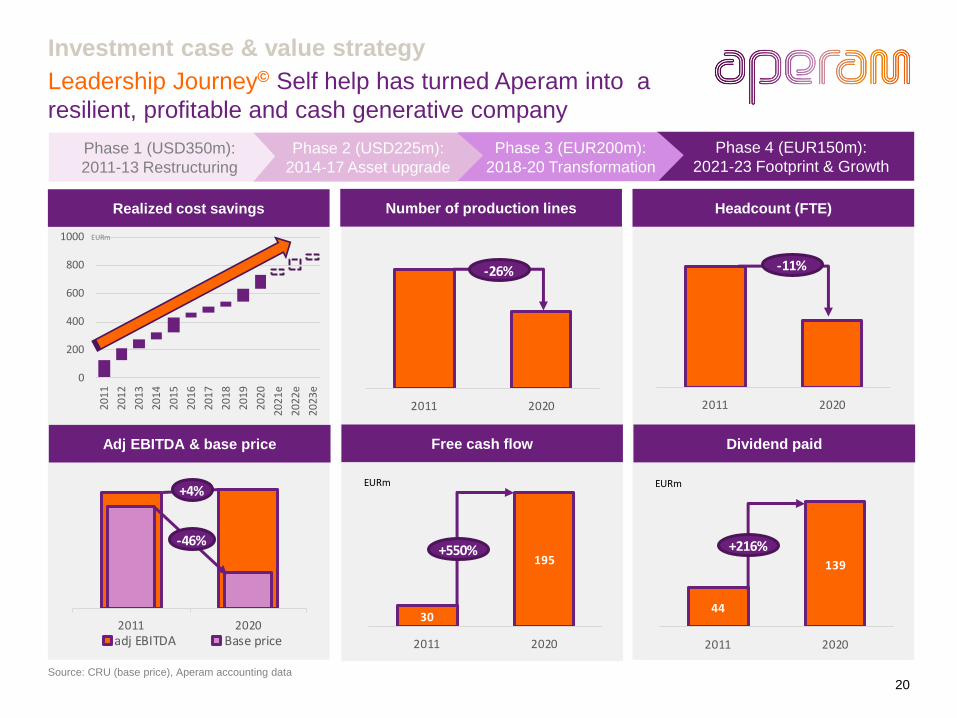
Leadership Journey© Self help has turned Aperam into a
resilient, profitable and cash generative company
Phase 4 (EUR150m):
2021-23 Footprint & Growth
Source: CRU (base price), Aperam accounting data
Investment case & value strategy
Adj EBITDA & base price Dividend paidFree cash flow
Number of production lines
30
195
2011 2020
+550%
EURm
Headcount (FTE)Realized cost savings
0
200
400
600
800
1000
2011
2012
2013
2014
2015
20
16
20
17
20
18
20
19
20
20
20
21
e
20
22
e
20
23
e
EURm
2011 2020
-26%
2011 2020adj EBITDA Base price
-46%
+4%
2011 2020
-11%
44
139
2011 2020
+216%
EURm
Phase 3 (EUR200m):
2018-20 Transformation
Phase 2 (USD225m):
2014-17 Asset upgrade
Phase 1 (USD350m):
2011-13 Restructuring

21
Track record: Aperam a solid performer even in challenging
times
619 501 442
290 147 -63
48 75 67
26%23%
20%
14%
6%
-2%2% 3% 3%
2012 2013 2014 2015 2016 2017 2018 2019 2020
Net debt (m€) Gearing (%)
Investment case & value strategy
168220
368451 455
567504
340293
4.1%
5.7%
8.9%
10.6%11.8%
12.7%
10.8%
8.0% 8.1%
2012 2013 2014 2015 2016 2017 2018 2019 2020
Adj. EBITDA (m€) adj. EBITDA margin
-86 -74
71155 193
320 286
148 175-1.08 -0.96
0.91
1.992.47
4.00 3.39
2.19 2.19
2012 2013 2014 2015 2016 2017 2018 2019 2020
Net result (m€) EPS (€)
1,6
83
1,7
28
1,8
13
1,8
86
1,9
17
1,9
36
1,9
72
1,7
86 1
,677
2012 2013 2014 2015 2016 2017 2018 2019 2020
Aperam shipments (kt)
Solid operating performance despite market headwind
A strong balance sheet is corporate policy2019 volumes reflect soft real demand in both EU and Brazil
and trade war induced imports
Transformation yields a positive net income even
in a recessionary market environment
22
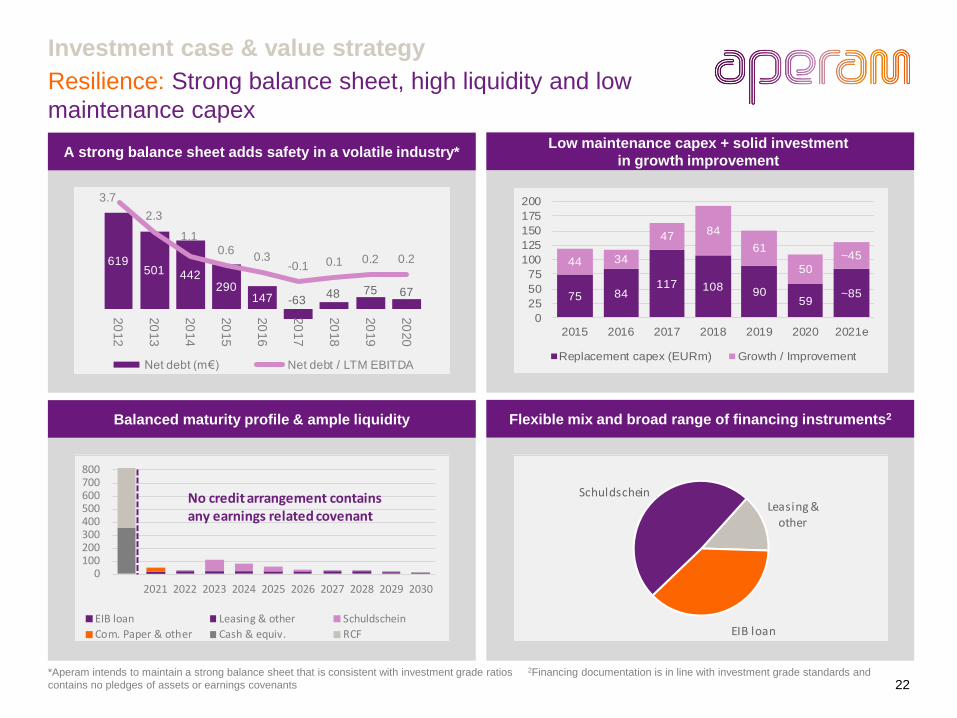
Resilience: Strong balance sheet, high liquidity and low
maintenance capex
Investment case & value strategy
*Aperam intends to maintain a strong balance sheet that is consistent with investment grade ratios 2Financing documentation is in line with investment grade standards and
contains no pledges of assets or earnings covenants
0100200300400500600700800
2021 2022 2023 2024 2025 2026 2027 2028 2029 2030
EIB loan Leasing & other Schuldschein
Com. Paper & other Cash & equiv. RCF
No credit arrangement contains any earnings related covenant
A strong balance sheet adds safety in a volatile industry*Low maintenance capex + solid investment
in growth improvement
Balanced maturity profile & ample liquidity Flexible mix and broad range of financing instruments2
75 84117 108 90
59~85
44 34
4784
61
50
~45
0
25
50
75
100
125
150
175
200
2015 2016 2017 2018 2019 2020 2021e
Replacement capex (EURm) Growth / Improvement
Leasing & other
EIB loan
Schuldschein
619 501 442
290 147 -63
48 75 67
3.7
2.3
1.10.6
0.3-0.1 0.1 0.2 0.2
20
12
20
13
20
14
20
15
20
16
20
17
20
18
20
19
20
20
Net debt (m€) Net debt / LTM EBITDA

23
Shareholder focus: We care about investors and can support
it due to a high & stable FCF
Solid cash generation through the cycle
Solid average 8% free cash flow yield* Best in class cash distribution to shareholders
*at year end 2019 the recognized deferred tax asset on tax losses amounted to EUR144m and the unrecognized deferred tax asset amounted to EUR438m
**The EUR100m 2020 SBB was cancelled due to the uncertainty related to the prolonged COVID crisis
87 106130 142 139 140
9070
93
2016 2017 2018 2019 2020 2021e
Dividends Share buy backs
(EURm)
High profitability
Low cash taxes*
Low cash interest
184
354 377 374
295
400
303
45%
78% 85%67% 59%
112%88%
2014 2015 2016 2017 2018 2019 2020
Cash-flow from operations (m€) Cash flow conversion
Investment case & value strategy
35 24
72
45
140
18 34
5588
Q4
18
Q1
19
Q2
19
Q3
19
Q4
19
Q1
20
Q2
20
Q3
20
Q4
20
Change in working capital Capex Free Cash Flow
EURm

24
Portfolio improvement: Top line strategy
Aperam product areas (size indicates volumes)
Constant innovation to shift portfolio into attractive growth / margin segments
New Asian
competition
NichesMargin management /
demand driven
Margin
Gro
wth
2015 2016 2017 2018 2019
Index 2
015=
100
New products in sales
Guiding principle: strengthen product & service differentiation• Increase competitiveness against other materials by improving existing solutions
• Innovate and apply existing solutions to new target markets
• Develop innovative new products
• Optimize product & customer mix
• Redefine distribution channels
Investment case & value strategy

25
ESG excellence: Take a look at Aperam from an ESG
perspective
Non toxic, long lifespan and 100% infinitely recyclable without loss of quality
We have the lowest CO2 footprint in the stainless industry globally
We are recycling champion and 33% of our energy intake is renewable
We have ambitious ESG targets and a convincing track record
We value our diverse workforce, invest in training & 86% rate us a good employer
The majority of our board is independent
Products
Climate change
Environment
Process
Social
Governance
We have a robust compliance framework and a zero tolerance policyCompliance
Please find our complete ESG presentation & report at: www.aperam.com/sustainability
Our mission is to produce reliable, 100% recyclable, green stainless steel
Investment case & value strategy

26
Aperam produces the greenest stainless steel globally
ESGSilène luminaris sive Muflier de Borges, Miguel Chevalier Fondation Clément, Le François, Martinique – France Fabrication : Serrurerie La Parette, Roquefort-la Bédoule
Aperam stainless steel used : Aperam 316 Hot Rolled

27
ESG is core at Aperam and starts at the top
ESG summary
We take E, S and G seriously
Social
• Our people are colleagues with whom we share
values and a common future
– Their safety is our non-negotiable
priority
– Their motivation and creativity is our
greatest asset
– Their development is a key to our
success.
• We actively promote diversity
• We believe in a positive dialogue and have
collective labour agreements in place throughout
Aperam
Environment
• As an energy-intensive company, we consider environmental consciousness as a necessary prerequisite to our sustainable
profitability
• Recycle: Our products are infinitely recyclable and our main input in Europe is recycled scrap
• We have an industry leading CO2 footprint with the greenest” stainless steel globally due to our FSC-certified forest in Brazil
• We have clear targets in place to improve our environmental performance and are a member of Responsible Steel®
Governance & Stakeholders
• Our high ethical standards are reflected
in our robust corporate governance and
structured compliance program with a
zero tolerance policy for non compliant
behavior
• our Board of directors is composed of a
majority of independent directors
• Board Committees are independent
members only
• We aim to be a partner of choice for our
customers and suppliers
• Our Corporate Responsibility is
reflected by local programs and
stakeholder engagement

28
Product & process: Aperam produces a superior product in
a sustainable and responsible way
Our mission is to produce reliable, 100% recyclable, green stainless steel
Renewable energy
Our blast furnace in Brazil uses only charcoal as fuel - produced from our sustainably cultivated
FSC-certified forests
Renewable energy RecyclingSuperior product
Very long useful life 100% recyclable Non toxic
Fire & acid resistant Magnetic (or not) Aesthethically pleasing
Mechanically strong Abrasion resistantCorrosion resistant
Recycling
Aperam’s main input in Europe is recycled scrap (>80%)
Our Recyco unit recycles dust, sludges & residues for us and third parties
Best practice forest management, recognized by the Forest Stewardship Council’s (FSC®) certification, which standards and principles conciliate ecological protection (flora and
fauna, but also water reserves) with social benefits and economic feasibility. Our forests are made of selected cloned saplings which are considered among the best on the market
and they are separated by firewalls and strips of natural vegetation to take into account both fire-prevention, biodiversity preservation and local development (beekeeping).
ESG summary
Stainless Steel

29
Recycling & scrap: Aperam is at the heart of the European
circular economy. Scrap is our dominating raw material
Source: Aperam, SMR, ISSF
²Europe generated ~3.7mt of scrap in 2019 * see 2019 sustainability report p. 39 for detail **Russia, Ukraine, South Africa, Brazil
Sta
inle
ss
ste
el
End product
Customers(Fabrication &
Manufacturing)
APERAM
Cold
rolling
Hot
rolling
Steel
making
Construction
50 years
85%
18%
Other
Transport
30 years
90%
3%
Machinery
25 years
90%
29%
Appliances,
Electronics
15 years
80%
8%
Metal Goods
15 years
80%
29%
Automotive
14 years
90%
12%
New
sc
rap
5-2
5%
~6 m
on
ths
• Aperam uses more than
85% scrap in its austenitic
grades
• Scrap is sourced
regionally in Europe
• Aperam’s location at the
heart of Europe minimizes
transportation costs &
environmental impact
• Aperam’s Recyco unit
recovers metal content
from waste material*
Recycling content of
stainless steel by region:
Revert scrap
~11%, <1 month
RecycoRecycles metal from dust, mud etc. *
Old scrap~70% Ø 27 years
ESG summary
Scrap is a closed loop in Europe²
Scrap is the primary input in our European operations
Life cycle
Recycling rate
% of end use
Export ~20%
Import ~10%

30
Aperam supports the United Nations’ Sustainable
Development Goals
ESG summary
Environment Social Governance
Research & Development
and innovation are top
priorities for Aperam. We
also help our customers to adapt
their own processes (welding,
stamping, etc.) to make the most of
their tools
Our BioEnergia cultivated
forest produces charcoal
which we use instead of met
coal & coke. The forest also acts as
a FSC certified carbon sink. Aperam
plants are constantly reducing their
energy consumption and participate
in our climate action plan
In our forestry, located on
hydric-stressed areas like
our other plants, lowering
water consumption and improving
the quality of discharge are key
elements of our environmental
strategy
Aperam is committed to a
sustainable cohabitation
with our neighboring
communities, allowing host cities to
thrive and addressing inhabitants’
legitimate requests
Ethics are a key component
to Aperam’s values. We
comply with all applicable
regulations, interact transparently
with authorities and support the fight
against corruption, money laundering
and anti-competitive practices -
among others
Health & Safety is Aperam’s primary
concern and the priority in all our
proceedings
More than 30% of Aperam’s
energy comes from
renewables, mainly as
biomass (charcoal) and, via pilot
projects, wind and solar
Aperam is a recycling
champion: We use the
maximum amount of
recycled material in our production
(eg 85%+ scrap in Europe) and also
take good care to leverage wastes
and by-products in line with our zero-
waste target
Gender balance ranks
highly on our priority list
since 2017 and has a
special commitment from
management. Aperam established
specific objectives for creating more
gender balance in our workforce
We take broad responsibility: our Products and Environmental and Social action

31
Health & safety performance
0.0
0.5
1.0
1.5
2.0
2.5
3.0
3.5
4.0
1Q
07
3Q
07
1Q
08
3Q
08
1Q
09
3Q
09
1Q
10
3Q
10
1Q
11
3Q
11
1Q
12
3Q
12
1Q
13
3Q
13
1Q
14
3Q
14
1Q
15
3Q
15
1Q
16
3Q
16
1Q
17
3Q
17
1Q
18
3Q
18
1Q
19
Q3
19
1Q
20
Q3
20
Health & Safety of our people is our prime objective
ESG summary
Health & Safety frequency rate

32* Heavy manufacturing, Worldsteel 1 For the seventh consecutive year, Aperam S America was selected as one of the best companies to work for by Guia Você S/A, in
recognition of our work on employee health and wellbeing
Criteria Aperam 2019 status2020 Target
Employee satisfaction1
Lost-time injury
frequency rate
Diversity
Training hours/FTE
Absenteeism
<1
N/A
Increase
Increase
2.0
1.7
86%
Women 12% of staff
20% of exempts
35.5
3.1
Steel industry 2017*
2.93
78%
Safety always comes first at Aperam. We rely on our people to transform our company from a
traditional industry into a connected, agile and innovative organization
!
Social: Our people are our asset
ESG summary

33*amounts to -11% on electricity & natural gas **Scope 1+2. An internal CO2 price of €60/t is applied to all investments. We review and adjust this if necessary to maintain
the incentive for CO2 savings ²per ton of slab
CO2 intensity**
Energy intensity*
Water consumption
Dust intensity
Zero Waste target
12.1 GJ/t -11% vs 2015
0.38 t/t -30% vs 2015
5.9 m3 /t -40% vs 2015
70 g/t -70% vs 2015
>97% reused / recycled
13.3 GJ/t +4%
0.48 t/t -11%
11.8 m3 /t +16%
84 g/t -65%
94.3% +0.8pp
0.95 t/t²
We aim to exceed environmental legislation and are committed to continuous improvement
!
!
Environment: A best in class footprint²
ESG summary
Criteria Aperam 2019 statusTarget 2030 Steel industry 2017
Lower production volumes hurt some KPI’s in 2019

34
Environment: Aperam has a convincing environmental track
record and clear improvement targets. Low volumes impacted 2019
ESG summary
target Actual *scope 1 & 2
Dust emissions (g/t crude steel) Water intake (m3/t)
0.78
0.700.72
0.61
0.500.480.48
0.54
0.58
0.490.49 0.48
0.38
20
08
20
09
20
10
20
11
20
12
20
13
20
14
20
15
20
16
20
17
20
18
20
19
20
30
211 213240 242
153
89 84 70
2013 2014 2015 2016 2017 2018 2019 2030
11.5 10.7 10.2 10.1 10.1 9.911.8
5.9
2013 2014 2015 2016 2017 2018 2019 2030
14.014.7
13.814.013.613.6
13.012.812.812.412.5
13.3
12.1
20
08
20
09
20
10
20
11
20
12
20
13
20
14
20
15
20
16
20
17
20
18
20
19
20
30
CO2 emissions (t/t crude steel)* Energy consumption (GJ/t crude steel)

35
ESG summary
Scope 1 – All Direct Emissions from the activities of an organisation or under their control. Scope 2 – Indirect Emissions from electricity purchased and used by the
organisation. Scope 3 – All Other Indirect Emissions from activities of the organisation, occurring from sources that they do not own or control*per tonne of slab, scope 1 + 2
based on ISO14404 **EU Taxonomy* requires 0.352 t CO2/t scope 1+2 or 90% scrap
Scope 2
emissions
Scope 1
emissions
Scope 3
emissionsProduct Process /
equipment
Aperam’s CO2 footprint: Aperam Europe fulfils the EU
Taxonomy = environmentally sustainable economic activity
Raw materials
Stainless scrap
Ferronickel
Ferrochrome
Other alloys
Electricity
Nat. gas
Consumables:
Graphite Electrode
Natural gas
Wood
Charcoal
Raw materials
Iron ore
Limestone
Molte
n
meta
l
Raw materials
SS scrap
Euro
pe
0.4
7t C
O2 /t*
Bra
zil
0.4
0t C
O2 /t*
Co2 neutral Pig
iron
Raw materials
Ferronickel
Ferrochrome
Other alloys
Electric Arc
Furnace
Slab SlabHR
band
Nat. gas
CR
band
Electricity ElectricityNat. gas
Electricity
Consumables
Graphite Electrode
Electricity
Molten
metal
Raw materials
SiliconSlab Slab
HR
band
CR
band
Slab
CasterMolten
metal
Sta
inle
ss
Ele
ctric
al
Nat. gas
Electricity
Second
Metallurgy
Second
Metallurgy
Slab
CasterFurnace
Hot
rollingCold
rolling
Annealing
& Pickling
FurnaceHot
rollingCold
rolling
High temp.
AnnealingDecarb.
Annealing
FSC certified
forest
Charcoal
burning
Blast
Furnace
Electric Arc
Furnace
Slab
CasterHot
rollingCold
rolling
Annealing &
PicklingFurnace
Molten
metalSlab
Electricity
Nat. gasElectricity Electricity
HR
band
EU Taxonomy**Threshold 0.352 t/tAPAM 0.27 t Co2 / t EU ETS (= scope 1)
SlabCR
band
Aperam has a industry leading CO2 footprint and produces the greenest stainless steel globally

36
Environment: Bio Energia & recycling give Aperam a best in
class climate change footprint
ESG summary
Source: Aperam estimates & calculation, ISSF data, CRU *Data is for austenitic HR steel, scope 1+2
**scope 1+ 2 + total raw material emissions and transport
37%
31%
1%
29%
2%
Charcoal Natural Gas Coke
Electricity Other
0.5
1.0
Aperam Stainless Industry
CO2 t/t scope 1+2
Our sustainably cultivated forest in Brazil is a unique asset
~2
>8
EU industry NPI based producers
CO2 t/t **
Factor
>4x
Aperam energy mix 2019 Aperam’s has the smallest CO2 footprint in the industry*
37
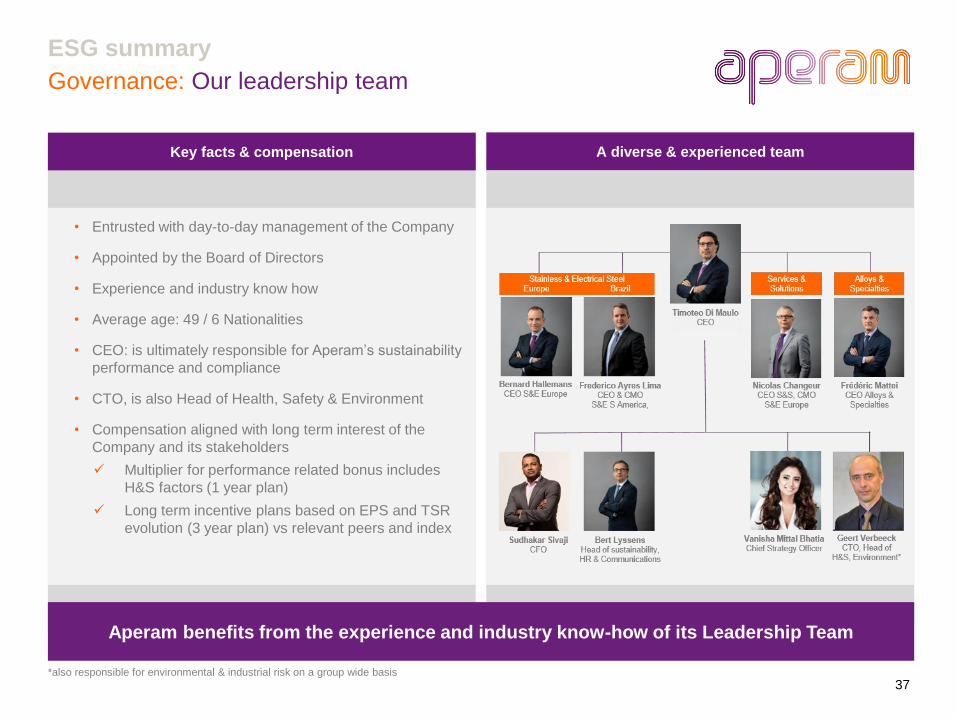
Aperam benefits from the experience and industry know-how of its Leadership Team
• Entrusted with day-to-day management of the Company
• Appointed by the Board of Directors
• Experience and industry know how
• Average age: 49 / 6 Nationalities
• CEO: is ultimately responsible for Aperam’s sustainability
performance and compliance
• CTO, is also Head of Health, Safety & Environment
• Compensation aligned with long term interest of the
Company and its stakeholders
Multiplier for performance related bonus includes
H&S factors (1 year plan)
Long term incentive plans based on EPS and TSR
evolution (3 year plan) vs relevant peers and index
Governance: Our leadership team
ESG summary
Key facts & compensation A diverse & experienced team
*also responsible for environmental & industrial risk on a group wide basis

38
Diverse skills, backgrounds, knowledge, experience, geographic locations, nationalities and
gender are reflected on our board and ensure effective governance
● Responsible for strategic direction and oversight of the
business, as well as for appointing senior management
● Election subject to shareholder approval. Directors are
elected for 3 year terms
● Chairman: Mr. Lakshmi N. Mittal
● 7 members with a majority of independent directors
(4 independent directors out of 7)
● Mrs. Ros Rivaz is lead independent director
● 2 Board Committees composed of 100% of
independent directors and reporting to the Board of
Directors:
▬ Audit and Risk Management Committee
covering also ESG matters ; Chair: Ms.
Bernadette Baudier
▬ Remuneration, Nomination and Corporate
Governance Committee ; Chair: Mr. Alain
Kinsch
Source: IPREO, Bloomberg January 2021
Governance: Board of directors and shareholder structure
ESG summary
Principles of our board Shareholder structure
8%
6%
8%
3%
3%
7%
41%
24%
N America France UK Benelux
Spain Other Europe Mittal Family Private & NA

39
Musée des Confluences, Lyon - France COOP HIMMELB(L)AU © Sergio Pirrone Executed using grade 316L - microblasted finish
Business overview
Musée des Confluences in Lyon, France. Architect: Coop Himmelb(l)au © Sergio Pirrone. Stainless steel used: Aperam 316L/1.4404 with Uginox Me

40
Group segments &
corporate structure
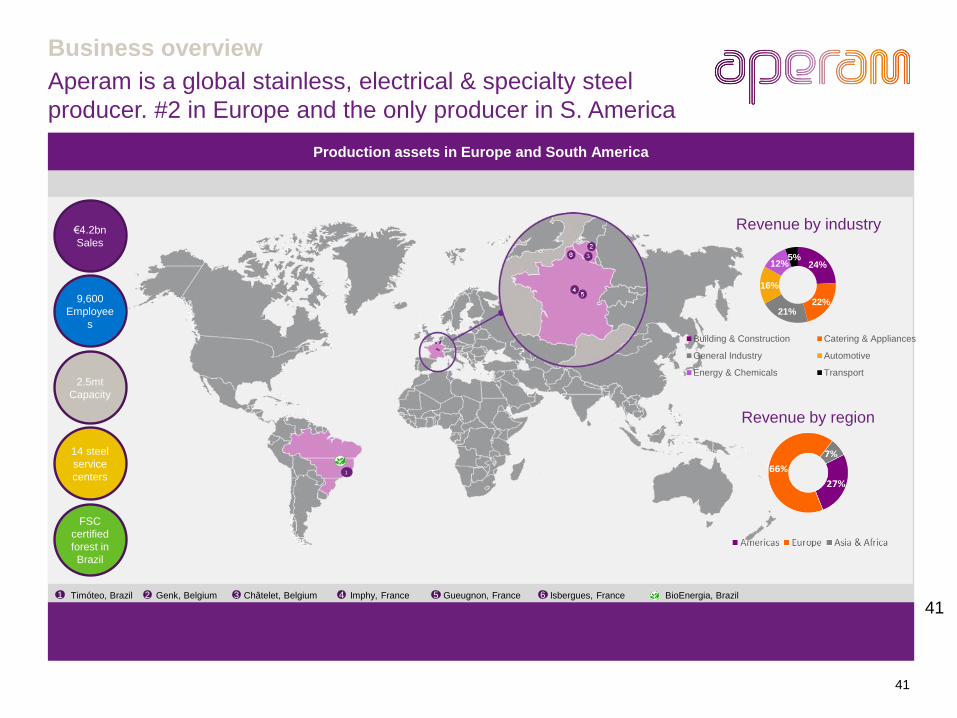
41
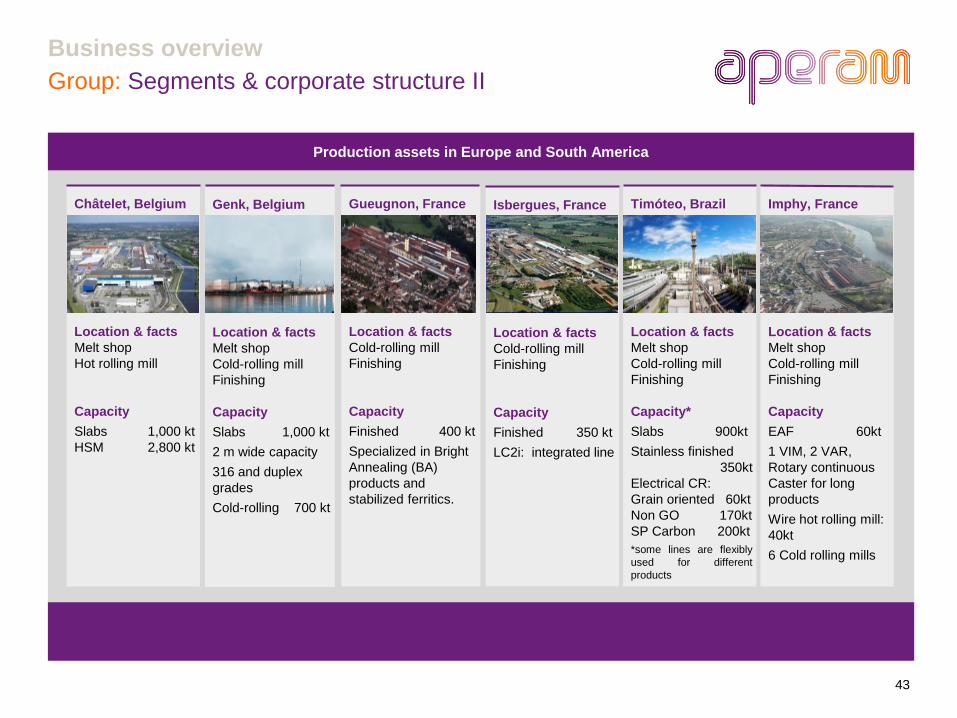
Production assets in Europe and South America
Timóteo, Brazil Genk, Belgium Châtelet, Belgium Imphy, France Gueugnon, France Isbergues, France BioEnergia, Brazil
41
€4.2bn
Sales
2.5mt
Capacity
1 2 4 5 63
14 steel
service
centers
FSC
certified
forest in
Brazil
Revenue by region
Revenue by industry
9,600
Employee
s
24%
22%21%
16%
12%5%
Building & Construction Catering & Appliances
General Industry Automotive
Energy & Chemicals Transport
1
Aperam is a global stainless, electrical & specialty steel
producer. #2 in Europe and the only producer in S. America
Business overview

42
Group: Segments & corporate structure*
Business overview
*gross shipments and adj EBITDA are before eliminations
** By production capacity
One of the largest global producers of
stainless steel**
Europe:
2 Electric Arc Furnaces use scrap as
major input material
Stainless steel flat product output
South America:
2 blast furnace use iron ore and charcoal
produced from own forests
2 EAF use recycled scrap
Stainless flat products & electrical steel
Fourth largest producer of nickel alloys
globally
Aperam specializes in nickel alloys and
specific stainless steels
Our products take the form of bars,
semis, cold-rolled strips, wire and wire
rods, and plates, and are offered in a
wide range of grades
High value items that are often sold on a
kg basis
S&S is Aperam’s distribution arm. S&S
provides value added and customized
solutions through further processing
according to specific customer
requirements. S&S core activities:
• direct sale of Aperam products to end
users
• distribution of Aperam and third party
material
• transformation services, according to
specific customer requirements
2.5mt production capacity
1.7mt of gross shipments
73% of group adj EBITDA
706kt of gross shipments
13% of group adj EBITDA
40 kt production capacity
36kt of gross shipments
14% of group adj EBITDA
Aperam covers the complete stainless value chain with industry leading assets
in Europe and Brazil
Stainless & Electrical Steel Alloys & SpecialtiesServices & Solutions
43
Group: Segments & corporate structure II
Business overview
Isbergues, France
Location & facts
Cold-rolling mill
Finishing
Capacity
Finished 350 kt
LC2i: integrated line
Timóteo, Brazil
Location & facts
Melt shop
Cold-rolling mill
Finishing
Capacity*
Slabs 900kt
Stainless finished
350kt
Electrical CR:
Grain oriented 60kt
Non GO 170kt
SP Carbon 200kt
*some lines are flexibly
used for different
products
Imphy, France
Location & facts
Melt shop
Cold-rolling mill
Finishing
Capacity
EAF 60kt
1 VIM, 2 VAR,
Rotary continuous
Caster for long
products
Wire hot rolling mill:
40kt
6 Cold rolling mills
Gueugnon, France
Location & facts
Cold-rolling mill
Finishing
Capacity
Finished 400 kt
Specialized in Bright
Annealing (BA)
products and
stabilized ferritics.
Genk, Belgium
Location & facts
Melt shop
Cold-rolling mill
Finishing
Capacity
Slabs 1,000 kt
2 m wide capacity
316 and duplex
grades
Cold-rolling 700 kt
Châtelet, Belgium
Location & facts
Melt shop
Hot rolling mill
Capacity
Slabs 1,000 kt
HSM 2,800 kt
Production assets in Europe and South America
44
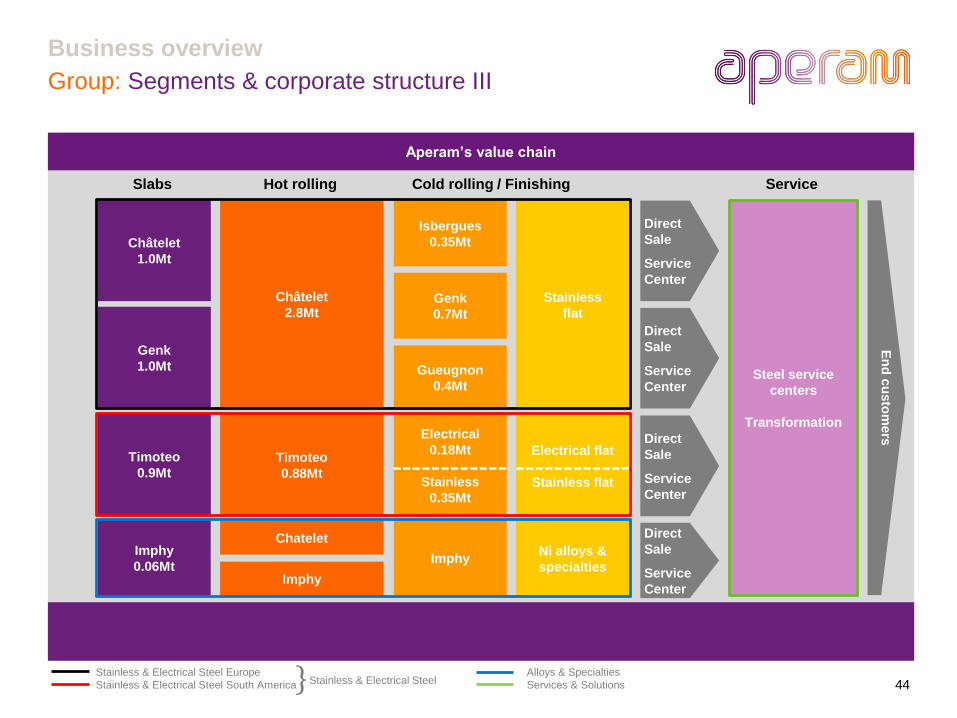
Group: Segments & corporate structure III
Business overview
Stainless & Electrical Steel Europe Alloys & Specialties
Stainless & Electrical Steel South America Services & Solutions
Châtelet
1.0Mt
Genk
1.0Mt
Timoteo
0.9Mt
Imphy
0.06Mt
Châtelet
2.8Mt
Timoteo
0.88Mt
Chatelet
Isbergues
0.35Mt
Gueugnon
0.4Mt
Electrical
0.18Mt
Stainless
0.35Mt
Imphy
Stainless
flat
Electrical flat
Stainless flat
Ni alloys &
specialties
Steel service
centers
Transformation
En
d c
usto
mers
Genk
0.7Mt
Direct
Sale
Service
Center
Direct
Sale
Service
Center
Direct
Sale
Service
Center
Direct
Sale
Service
CenterImphy
}Stainless & Electrical Steel
Slabs Hot rolling Cold rolling / Finishing Service
Aperam’s value chain

45
Group: A balanced risk profile and customer structure
33%
41%
14%
12%
S&E Europe
S&E S. America
A&S
S&S
45%
26%
1%
28% S&E Europe
S&E S. America
A&S
S&S
18%
4%22%
12%
7%
27%8%
24%
68%
8%
Brazil
US
Other Americas
Germany
Italy
France
Other Europe
Europe
Asia &Africa
Americas
* Calculated on segmental data before eliminations
Business overview
Shipment split by segment 2020* Adj EBITDA contribution by segment 2020*
Revenue by region 2020 Revenue by customer industry 2020
27%
18%21%
17%
10%7%
Building & Construction
Catering & Appliances
General Industry
Automotive
Energy & Chemicals
Transport

46
Group: Self help has transformed the group. Higher cash
generation and profitability even in adverse market conditions
Business overview
1,6831,728
1,813
1,8861,917 1,936 1,972
1,786
1,677
2012 2013 2014 2015 2016 2017 2018 2019 2020
S&E A&S S&S Group Net Shipments
168 220
368
451 455 559 504
340 293
2012 2013 2014 2015 2016 2017 2018 2019 2020
S&E A&S S&S Group Adj. EBITDA
10
0
12
7
20
3
23
9
23
7
28
9
25
6
19
0
17
5
2012 2013 2014 2015 2016 2017 2018 2019
S&E S&S A&S Group Adj. EBITDA/t
4.1%5.7%
8.9%10.6%
11.8% 12.5%10.8%
8.0% 8.1%
2012 2013 2014 2015 2016 2017 2018 2019 2020
S&E A&S S&S Group adj EBITDA margin
Adj EBITDA by segment (EURm) Shipment by segment (kt)
Adj EBITDA/t (EUR) Adj EBITDA margin

47
Stainless & Electrical Steel
Europe

48
S&E Steel Europe: Self-help measures yield a robust
operational performance despite a price and volume squeeze
Business overview
Major adj EBITDA contributor 2020 Robust profitability capitalizing on restructuring
European shipments reflect import pressure, destocking
and weak real demand
33%
41%
14%
12%
S&E Europe
S&E S. America
A&S
S&S
European stainless steel demand came
under cyclical pressure in 2019
12 57
153
220258
352
260
150
101
0.5%2.7%
6.7%8.8%
11.1%12.8%
9.1%
6.0%4.6%
2012 2013 2014 2015 2016 2017 2018 2019 2020
Adj. EBITDA (m€) Adj. EBITDA margin (%)
0.0
2.0
4.0
6.0
200
7
200
8
200
9
201
0
201
1
201
2
201
3
201
4
201
5
201
6
201
7
201
8
201
9
202
0
Pre-crisis level (2016)
Stainless European ap. consumption (mt - slab equivalent)
994
1,0
04
1,0
82
1,1
90
1,2
41
1,2
53
1,2
67
1,1
13
1,0
50
2012 2013 2014 2015 2016 2017 2018 2019 2020
EU S&E Shipments (kt)

49
European stainless steel industrial footprint Aperam key competitive advantage
S&E Steel Europe: Leverage Aperam’s unique position
Outokumpu
Acerinox
Aperam
Finishing line
Steel making
Terni
Sourcing
Logistics
Production
49
• The only integrated upstream
operations in the heart of Europe
• Superior access to raw material flows
Sourcing
• Best location to serve the biggest
consumption areas of Europe
• Efficient logistics between sites
results in industry leading working
capital management
Logistics
• Full range of products with flexible
capacity
• Increase scrap recycling to minimize
environmental impact
• Aim to become cost leader in the key
products
Production
Business overview
Located in the heart of European scrap generation and stainless consumption

50*Effective quota from 1 July 2020 to 30 June 2021. Quotas are quarterly from 07/20. There is one global SS Hot Rolled quotas since July 2020
SS CR: country quotas S. Korea, Taiwan, India, USA, Turkey, Malaysia, Vietnam **could be difference between domestic market price and export price or cost based
EU trade action: Further actions against unfair trade have
been initiated
Safeguard
• Duty on imports that are priced below fair market value
• Price focused
Anti-dumping (AD)
Safeguard quotas are excessively generous. AD is effective in levelling the playing field
• Hot rolled: China, Indonesia, Taiwan since 8 October 2020
for 5 years
• Cold rolled: China , Taiwan since 2015
• HR: China 9.2% - 19.5%, Indonesia 17.3%,
Taiwan 4.1% - 7.5%
• CR: China 25.3%, Taiwan 6.8%
• Renewal: of cold rolled duty against China & Taiwan
• Initiation: of cold rolled duty against Indonesia & India
the two accounted for ~25% of CR imports
• Maintain traditional trade flows
• Volume focused
• All countries globally (if not explicitly exempt)
• Effective since February 2019 till July 2021
(Indonesia included from 1 Oct. 2019)
• HR quota 364kt pa*
CR quota 861kt pa*
• Largest importers have a country quota. A residual quota
for all others
• 25% duty for shipments > quota
Aim
Co
un
trie
s
aff
ecte
dM
eas
ure
Ne
w
init
iati
ve
s
WTO dispute has been lodged officially
Business overview

51
Hot rolled imports, yoy & market share
EU stainless steel imports: Anti dumping is effective in HR
products. Safeguard with minimal effect only in CR products
SS Hot Rolled products have one global quota. Countries with a SS CR quota: S. Korea, Taiwan, India, USA, Turkey, Malaysia, Vietnam. All other countries if not exempt fall
under the residual quota
Cold rolled imports, yoy & market share
Total stainless imports, yoy & market share
-100%-75%-50%-25%0%25%50%
0
50,000
100,000
150,000
Q1-1
6
Q3-1
6
Q1-1
7
Q3-1
7
Q1-1
8
Q3-1
8
Q1-1
9
Q3-1
9
Q1-2
0
Q3-2
0
Ho
t ro
lled
(t)
Indonesia Other countries YoY % Market share %
-60%
-40%
-20%
0%
20%
40%
0
100,000
200,000
300,000
Q1
-16
Q3
-16
Q1
-17
Q3
-17
Q1
-18
Q3
-18
Q1
-19
Q3
-19
Q1
-20
Q3
-20
Co
ld r
olle
d (
t)
Indonesia & India All other YoY % Market share %
-60%
-50%
-40%
-30%
-20%
-10%
0%
10%
20%
30%
40%
0
50,000
100,000
150,000
200,000
250,000
300,000
350,000
400,000
450,000
Q1-16
Q3-16
Q1-17
Q3-17
Q1-18
Q3-18
Q1-19
Q3
-19
Q1-20
Q3-20
ton
nes
Indonesia & India All other YoY % Market share %
Business overview

52
Stainless & Electrical Steel
South America

53
S&E Steel South America: A flexible, agile and highly
profitable asset
Business overview
A significant adj EBITDA contributor 2020 despite
demanding conditionsEarnings reflect weak domestic economic environment
Stable shipments due to mix of domestic and exports
33%
41%
14%
12%
S&E Europe
S&E S. America
A&S
S&S
Weak economic growth continues to weigh on
stainless steel consumption in Brazil
0.0
0.1
0.2
0.3
0.4
0.5
200
7
200
8
200
9
201
0
201
1
201
2
201
3
201
4
201
5
201
6
201
7
201
8
201
9
Stainless BRA ap. consumption (mt - slab equivalent)
Pre-crisis level (2014)
82
120
167176
113 118
162
109126
8%
13%
17% 19%
14% 13%
17%
13%
17%
2012 2013 2014 2015 2016 2017 2018 2019 2020
Adj. EBITDA (m€) Adj. EBITDA margin (%)
617649 654 652 656 638 656
610 591
2012 2013 2014 2015 2016 2017 2018 2019 2020
Brazil S&E shipments (kt)
54
Cost competitive & environ-mentally
friendly charcoal from own cultivated
forests is used to heat blast furnace
Cost competitive & CO2 neutral
charcoal from our FSC certified
forests heats the blast furnace
Complete stainless steel range
austenitic, ferritic, duplex, martensitic
used eg in stationary machines and
transformers due to its magnetic
properties*
used in electric motors and
generators**
High or medium alloyed & other
specialties complete the product
portfolio
S&E Steel South America: Our Brazil asset is unique – flexibly
switches between products and markets to maximize profitability
Rep offices, sales agencies
Melt shop, Hot/Cold rolling
Service Centers
Tubes mills and Cutting centers
Montevideo (Uruguay)
Ribeirão Pires
Buenos Aires (Argentina)
Campinas
Timoteo
Caxias do Sul
Peru
Ecuador
Colombia
Sumaré
Caracas
(Venezuela)
Product range:
Business overview
Sustained solid double digit adj EBITDA margin proves the flexibility & agility
of our operations in Brazil
*Grain oriented steel (GO & HGO) has the magnetic properties optimized in one direction during hot rolling. **Non-grain oriented steel (NGO) has identical magnetic properties
in all directions ²schematic only
Aperam South America footprint Upstream integration
Bio Energia
Stainless Steel
Grain oriented
electrical steel
Non grain
oriented
electrical steel
Special
carbon steel
Raw material:
Tim
ote
o m
elt
sh
op
~9
00
kt
ca
pa
cit
y
Dec
linin
g m
arg
in
Mix²
Domestic
Business
(incl S. America)
Exports

55
S&E Steel South America: Brazil offers ample opportunity
for both cyclical and structural growth
Business overview
Source: IMF, CRU, Aperam
Short term: reviving the economy. Large scale infrastructure &
energy projects have been missing + Aperam LJ4 growth strategy
with investment into high margin products (HGO)
Medium term: Tax reform that put our customers in a position to
compete on a global level will drive volume and yield a positive
mix effect
Long term: Higher standard of living will drive stainless steel
consumption. Currently Brazil at 1.4kg / capita vs China
>9kg/capita and a GDP implied consumption of >3.5kg/capita
Examples of stainless steel solutions in the Agrobusiness:
Slats of metallic
conveyor belt for
the transport of
sugarcane
Equipment for
washing gases
from biomass
burning
Equipment for the
transport and
sterilization of Palm
fruits
Largest global producer of:
• Coffee Orange
• Sugarcane and sugar
Largest global exporter of:
• Meat Poultry
• Sugar Ethanol
Brazil has tremendous potential for volume & mix improvement
Brazil consumes substantially below the global trend line Brazil opportunities
Egypt
S. Africa
Africa Argentina
BrazilL America
Mexico
China
IndiaS. Asia
Indonesia
Malaysia
Thailand
Vietnam
S.E Asia
Asia
Russia
Ukraine
Poland
Romania
Turkey
IranMiddle East
World
0
2
4
6
8
10
1,000 6,000 11,000 16,000
Stai
nle
ss C
R c
on
sum
pti
on
pe
r ca
pit
a (k
g)
GDP per capita (USD)
EU
N America
56
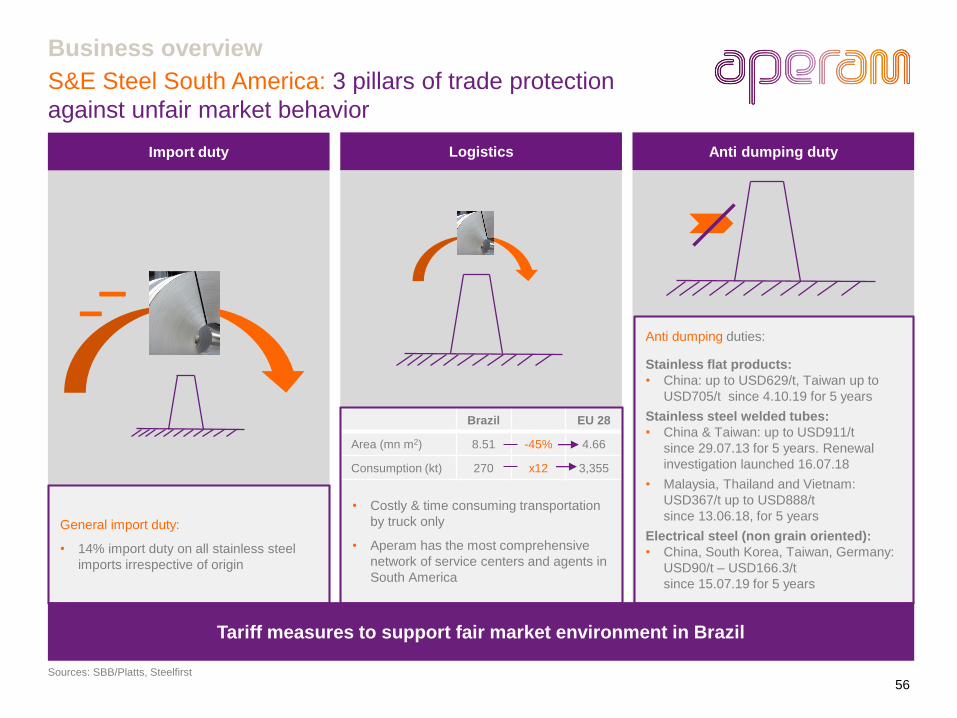
S&E Steel South America: 3 pillars of trade protection
against unfair market behavior
Business overview
Sources: SBB/Platts, Steelfirst
General import duty:
• 14% import duty on all stainless steel
imports irrespective of origin
• Costly & time consuming transportation
by truck only
• Aperam has the most comprehensive
network of service centers and agents in
South America
Anti dumping duties:
Stainless flat products:
• China: up to USD629/t, Taiwan up to
USD705/t since 4.10.19 for 5 years
Stainless steel welded tubes:
• China & Taiwan: up to USD911/t
since 29.07.13 for 5 years. Renewal
investigation launched 16.07.18
• Malaysia, Thailand and Vietnam:
USD367/t up to USD888/t
since 13.06.18, for 5 years
Electrical steel (non grain oriented):
• China, South Korea, Taiwan, Germany:
USD90/t – USD166.3/t
since 15.07.19 for 5 years
Brazil EU 28
Area (mn m2) 8.51 -45% 4.66
Consumption (kt) 270 x12 3,355
Anti dumping dutyLogisticsImport duty
Tariff measures to support fair market environment in Brazil

57
Services & Solutions

58
Services & Solutions: stronger partnership with customers
enhances margins
Business overview
661 679721 746
799 818 819
706646
2012 2013 2014 2015 2016 2017 2018 2019 2020
S&S shipments (kt)
Direct distributionApera
m
Stainle
ss &
Electric
al
Steel
End
-
user
s
Aperam
Services &
Solutions
Independent
distributors
and other
Aperam
Stainless
&
Electrical
Steel
End-
users
33%
41%
14%
12%
S&E Europe
S&E S. America
A&S
S&S 167
65
38
8370
43 4538
7,000
9,000
11,000
13,000
15,000
17,000
19,000
0
20
40
60
80
100
2012 2013 2014 2015 2016 2017 2018 2019 2020
EBITDA €m Nickel LME price
A significant adj EBITDA contributor 2020 despite trough
conditions
A profitable Services & Solutions thanks to its focus on
service oriented customers
Increasing focus on downstream value added services
and solutions
A majority of “in house“ exposure to end users to best
serve their needs and provide best services & solutions

59
Customer
Customer
Services & Solutions: Adding value downstream
Business overview
LogisticsPackagingPolishing
Brushing
Logistics
Cutting/
Slitting
Packaging
Expanding
Cutting
Bending
Hot rolled coil /
Cold rolled coil
Forming
Welding
Pickling
Annealing
Hot rolled coil /
Cold rolled coil
Input - - - - - - - - Service Centers - - - - - - - -
- - - - - - - Tube making - - - - - - -
Services & Solutions value chain
SlitSlit /
deburred
Machined
deburred Square Round&

60
Alloys & Specialties

61
Aperam’s high value-added segment 2020High profitability due to end products & end user
orientation
Stable shipments but markedly improved mix Nickel Alloys a growing and premium niche market
Alloys & Specialties: attractive niche market with high margins
Business overview
33%
41%
14%
12%
S&E Europe
S&E S. America
A&S
S&S
Source: SMR, Aperam
0
50
100
150
200
250
300
350
400
199
0
199
2
199
4
199
6
199
8
200
0
200
2
200
4
200
6
200
8
201
0
201
2
201
4
201
6
201
8
202
0
kt
CAGR 2.2% pa
36 36 35 3430 33 36 36
32
2012 2013 2014 2015 2016 2017 2018 2019 2020
A&S shipments (kt)
43 44 4439
26
46 4650
45
1,191 1,219 1,2641,147
864
1,407 1,278 1,385 1,456
2012 2013 2014 2015 2016 2017 2018 2019 2020
Adj. EBITDA (m€) Adj. EBITDA/t

62
Alloys & Specialties: attractive niche market with high margins
Business overview
Source: SMR, Aperam
*PCC (Special Metals) NYK (Nippon Yakin Kogyo)
Aperam is global top player in nickel alloys and strong in
long products (kt)Aperam Alloys & Specialties geographical footprint
Alloys & Specialties sales by industry 2020
Major products
Up
str
eam
Do
wn
str
eam
n n n
n n
Melt shop, wire rod mill,
cold rolling, bars, R&D
Amilly
The magnetic parts
company
Rescal
Wire
drawing
ICS (JV)
Diversification into
industrial clads
Imhua
n
n n
Imphy
28%
29%
16%
6%
14%
6%
Marine
Oil & Gas
Chemical industry /welding / environmentAerospace
E&E
Automotive /TransportationOthers
Wire rod ~45% Plates ~5% Strips ~40% Bars ~10%

63
R&D intensive industry
Intensive technical effort required to
market new products
Benchmark customers in advanced
industries require tailored, certified and
highly sophisticated solutions
A very profitable, growing and stable niche market
Alloys & Specialties: Specialty alloys add stability and
profitable growth element
Business overview
EBITDA margins by Aperam division
Innovation is key for premium
specialties…
…to cater for highly sophisticated
and evolving needs…
…yielding growth opportunities and
margin stability
High growth end market applications
“Kilogram” market: unique products
designed to enable precision and high-
tech solutions globally
Highly diversified end-markets
Key R&D figures (based on 2019)
Less exposed to commodity cycles
Cost of raw materials passed through to
customers
Long-standing client relationships
Good visibility on volumes with high
proportion of recurring revenue
Key end-markets / application types
LNG tankers,
special welding
Gas turbines,
heat
exchangers
Fasteners,
landing gears,
turbine
engines
Electrical
safety,
sensors
Smart
phones,
LED TV,
seals
Gearbox,
fasteners,
turbo
chargers
Heating
resistance,
watchesCooperation contracts 26
Total registered patents 341
Sales of new products 14%
0%2%4%6%8%
10%12%14%
2010
2011
2012
2013
2014
2015
2016
2017
2018
2019
2020
S&S A&S S&E

64Résidence Hôtelière du Rail, Montparnasse station, Paris - France
- aasb_agence d‘architecture suzelbrout - Executed using grade 304L, with Uginox Mat finish
Appendix

65
Key prices and exchange rates
Appendix
Source: Bloomberg, Fastmarkets
Nickel
Ferrochrome
Nickel pig iron
Stainless steel 304
Stainless scrap
BRL / USD
9,000
11,000
13,000
15,000
17,000
19,000
Jan 1
9
Jul 19
Jan 2
0
Jul 20
Jan 21
Nickel LME (USD/t)
100
120
140
160
180
200
Jan 1
9
Jul 1
9
Jan 2
0
Jul 20
Jan 21
NPI 10-15% (USD/unit)
700
900
1,100
1,300
1,500
1,700
Jan 1
9
Jul 1
9
Jan 20
Jul 20
Jan 2
1
EU 18/8 scrap (USD/t)
1,500
2,000
2,500
3,000
Jan 1
9
Jul 1
9
Jan 20
Jul 20
Jan 2
1
CR304 Europe (USD/t)
CR304 Asia (USD/t)
3.50
4.00
4.50
5.00
5.50
6.00
Jan 19
Jul 19
Jan 20
Jul 20
Jan 21
BRL/USD
0.50
1.00
1.50
2.00
2.50
Jan 19
Jul 19
Jan 20
Jul 20
Jan 21
EU FeCr benchmark (USD/lb)

66
Cutlery, cutting tools, construction tools…
Car exhausts, conveyor chains, cooking utensils,
boilers, electrical appliances, trim, dishware,
heating, tanks, tubes…
Boiler, aeronautics, electronic components,
railway equipment, tubes, chemical tanks, food
vats, marine applications, furnace, heating…
<1.5%
17%<0.1%
<4.5%
10.5-30%
<0.1%
<7%
6-26%
16-21%<0.1%
Martensitic Austenitic (300 series)Ferritic (400 series)
Asphalt tankers, tubes, food containers, silos,
conveyor chains, safety soles…
Oil & gas equipment, papermaking, pulp,
desalination sector, chemical plants…
By weight
Iron
Molybdenum, Al, Cu
Nickel
Chromium
Manganese
Carbon
<2%
1-6%
15-19%
4-16%<1%
<4%
1-7%
21-26%
<1%
Austenitic with Manganese (200 series) Austeno-ferritics (Duplex)
Key stainless product categories by alloy content
Appendix