new picture - static.seekingalpha.com
TRANSCRIPT

November 2021
Investor Presentation
New Picture

Forward Looking Statements & Industry Information
This presentation contains forward-looking statements that are subject to risks and uncertainties. All statements other than statements of historical fact or relating to present facts or current conditions included in this presentation are forward- looking statements. Forward-looking statements give the Company’s current expectations and projections relating to its financial condition, results of operations, plans, objectives, future performance and business, including statements relating to the impact of the COVID-19 global pandemic; future sales, expenses, and profitability; future development and expected growth of our business and industry; our ability to execute our business model and our business strategy; having available sufficient cash and borrowing capacity to meet working capital, debt service and capital expenditure requirements for the next twelve months; and projected capital spending. You can identify forward-looking statements by the fact that they do not relate strictly to historical or current facts. These statements may include words such “anticipate,” “believe,” “continue,” “could,” “estimate,” “expect,” “intend,” “may,” “ongoing,” “plan,” “potential,” “predict,” “project,” “should,” “will,” “would,” or the negative of these terms or other comparable terminology, although not all forward-looking statements contain these words. The forward-looking statements contained in this presentation are based on assumptions that the Company has made in light of its industry experience and perceptions of historical trends, current conditions, expected future developments and other factors it believes are appropriate under the circumstances. As you read and consider this presentation, you should understand that these statements are not guarantees of performance or results. They involve risks, uncertainties (many of which are beyond the Company’s control) and assumptions. Although the Company believes that these forward-looking statements are based on reasonable assumptions, you should be aware that many factors could affect its actual operating and financial performance and cause its performance to differ materially from the performance anticipated in the forward-looking statements. The Company believes these factors include, but are not limited to: the Company’s ability to effectively compete in a highly competitive industry; the Company’s ability to respond to consumer demands, spending and tastes; the Company’s ability to respond to any current or future health epidemic or other adverse public health development, such as the COVID-19 pandemic; the Company’s ability to acquire new customers and retain existing customers; consumers of luxury products may not choose to shop online in sufficient numbers; the volatility and difficulty in predicting the luxury fashion industry; the Company’s reliance on consumer discretionary spending; and the Company’s ability to maintain average order levels and other factors. Should one or more of these risks or uncertainties materialize, or should any of these assumptions prove incorrect, the Company’s actual operating and financial performance may vary in material respects from the performance projected in these forward-looking statements.
Any forward-looking statement made by the Company in this presentation speaks only as of the date on which it is made. Factors or events that could cause the Company’s actual operating and financial performance to differ may emerge from time to time, and it is not possible for the Company to predict all of them. We caution you therefore against relying on these forward-looking statements, and we qualify all of our forward-looking statements by these cautionary statements. The Company undertakes no obligation to publicly update any forward-looking statement, whether as a result of new information, future developments or otherwise, except as may be required by law.
We are not able to forecast net income (loss) on a forward-looking basis without unreasonable efforts due to the high variability and difficulty in predicting certain items that affect net income (loss), including, but not limited to, Income taxes and Interest expense and, as a result, are unable to provide a reconciliation to forecasted Adjusted EBITDA.
Unless otherwise indicated, information contained in this presentation concerning our industry, competitive position and the markets in which we operate is based on information from independent industry and research organizations, other third- party sources and management estimates. Management estimates are derived from publicly available information released by independent industry analysts and other third-party sources, as well as data from our internal research, and are based on assumptions made by us upon reviewing such data, and our experience in, and knowledge of, such industry and markets, which we believe to be reasonable. In addition, projections, assumptions and estimates of the future performance of the industry in which we operate and our future performance are necessarily subject to uncertainty and risk due to a variety of factors, including those described above. These and other factors could cause results to differ materially from those expressed in the estimates made by independent parties and by us. Industry publications, research, surveys and studies generally state that the information they contain has been obtained from sources believed to be reliable, but that the accuracy and completeness of such information is not guaranteed. Forecasts and other forward-looking information obtained from these sources are subject to the same qualifications and uncertainties as the other forward-looking statements in this presentation.
Non-IFRS Measures; Trademarks
This presentation includes certain financial measures not presented in accordance with IFRS including but not limited to Adjusted EBITDA, Adjusted Net Income and Adjusted Operating Income. These financial measures are not measures of financial performance in accordance with IFRS and may exclude items that are significant in understanding and assessing the Company’s financial results. Therefore, these measures should not be considered in isolation or as an alternative to loss after tax, net sales, gross profit or other measures of profitability, liquidity or performance under IFRS. You should be aware that the Company’s presentation of these measures may not be comparable to similarly titled measures used by other companies, which may be defined and calculated differently. See the appendix for a reconciliation of certain of these non-IFRS measures to the most directly comparable IFRS measure.
The trademarks included herein are the property of the owners thereof and are used for reference purposes only. Such use should not be construed as an endorsement of the products or services of the Company or the proposed offering.
Legal Disclaimer
2

What You Need to Know about Mytheresa
3
A Unique Business … … with Unique Performance
Leading curated top luxury fashion digital platform truly differentiated in terms of assortment and customer focus
Globally present with a complete offering of luxury womenswear, menswear and kidswear
Finest edit only from top luxury brands with constant offering of capsules, exclusives and events only available at Mytheresa
Focus on the true high-end of luxury, wardrobe-building customers with industry-leading AOVs, repurchase rates and multi-year loyalty
Fully committed to full-price business supported by in-house campaign production and industry-leading customer satisfaction
Combining consistent net sales growth > 20% p.a. outpacing overall online luxury fashion market with high quality financial KPIs
Stable gross profit margin driven by full-price focus and consistent merchandise sell-out rates
First-year pay-back of customer acquisition costs (CAC) and proven track record of CAC reduction over time
Consistent and multi-year track record of positive EBITDA profitability
Moderate CapEx requirements for growth with Technology investments fully reflected in OpEx

Mytheresa Offers a Unique Investment Opportunity
4
Outstanding Market Fundamentals Given Resilience of Luxury and High
Growth Potential of Online
A Unique and Differentiated Value Proposition Recognized Both by Brand Partners and Customers
A Highly Loyal and Engaged Luxury Customer Base Delivering
Excellent Economics
A Unique Business Model Achieving Excellent Business KPIs as well as Strong Growth and Profitability
New Picture

Business Highlights Q1 FY22

Our Business Highlights Q1 FY22
6
Strong Global Expansion
• Strong GMV growth across all geographies with +29.7% vs. Q1 FY21 and +65.3% vs. Q1 FY20
• Strongest net sales growth in the US with +48.7% vs. Q1 FY21 as market presence continues to grow
• High-impact top customer events in Europe, China and the United States
Continued Brand Support
• Launch of exclusive capsule collections and pre-launches in collaboration with Saint Laurent, Gucci, The Row, Christian Louboutin, Tom Ford, Chloé and many more
• “Money-can’t-buy” physical brand experiences together with Givenchy and Tod’s
• Successful start of Curated Platform Model (CPM) with first major brand partner
Consistent Strong OperationalPerformance
• Maintained business continuity in all operations with focus on health and well-being of all Mytheresa employees as top priority
• Introduced animal welfare policy and carbon neutrality as of Q1 FY22
• Continued to have very high customer satisfaction with a Net Promoter Score of 83.0% in Q1 FY22
• Achieved strong gross profit margin based on high full-price share of sales
High-Quality Customer Growth
• LTM growth of active customers of 35.2% reaching 705,000 customers
• Continued strong repurchase rates of new customer cohorts in FY21 vs. FY20
• Strong growth of number of top customers with 41% in Q1 FY22 vs. Q1 FY21
• Successful roll-out and expansion of new partnership with Vestiaire Collective offering a unique resale service for Mytheresa’s high-end luxury customers

Strong GMV Momentum Continuing in Q1 FY22 Evidenced by Strong Two-Year Growth Rates
(%)Gross Merchandise Value (GMV)
Yo2Y GrowthYoY Growth
+36.2+29.7
Full FY21 Q1 FY22
+61.5+65.3
Full FY21 Q1 FY22
7

Continued Success with High-End Luxury Brand Collaborations in Q1 FY22 Underpinning Our Unique Value Proposition
Guerilla activation in Puglia, Capri and St. Tropez to support the launch
of the exclusive Escape capsule
Exclusive capsule collection only available on Mytheresa
Exclusive pre-launch of key styles giving first access only on Mytheresa
Exclusive capsule collection only available on Mytheresa
Exclusive capsule collection (menswear) only available on
Mytheresa
Exclusive launch of Edith bag as part of first collection of Gabriela Hearst
for Chloé only available on Mytheresa
THE ROW
VALENTINO SAINT LAURENT TOM FORD
CHLOÉ
8
CHRISTIAN LOUBOUTIN
Exclusive bag launch only available at Gucci and Mytheresa
GUCCI
„MONEY CAN‘T BUY“ EXPERIENCES

Cologne (10/4)
High Impact, Exclusive Events for Mytheresa Top Customers Deepening Client Relationships all over the World
9
41%
New Jersey (8/9)
Hamptons
Troutbeck (7/10)
Dublin (9/22)
London (9/7)
ParisMilan
Brancadoro
Hamburg (9/7)
Frankfurt (9/20)Munich
Kitzbühel (9/4)
Chengdu
Style Suites: shopping eventswith personal shopping
9/29: Dinner & Talk Hosted by Ye Ming Zi
10/7: Experience the World of Tod‘s
10/23: Cocktail at Bar Basso
7/20: Lunch hosted by Gucci Westman & Naomi Watts
8/12: Kids Activation at Mobys
Money can‘t buy experiences
10/5: Dinner with the Designer
9/28: Pre-opening dinner at Tantris
Manchester (10/5)
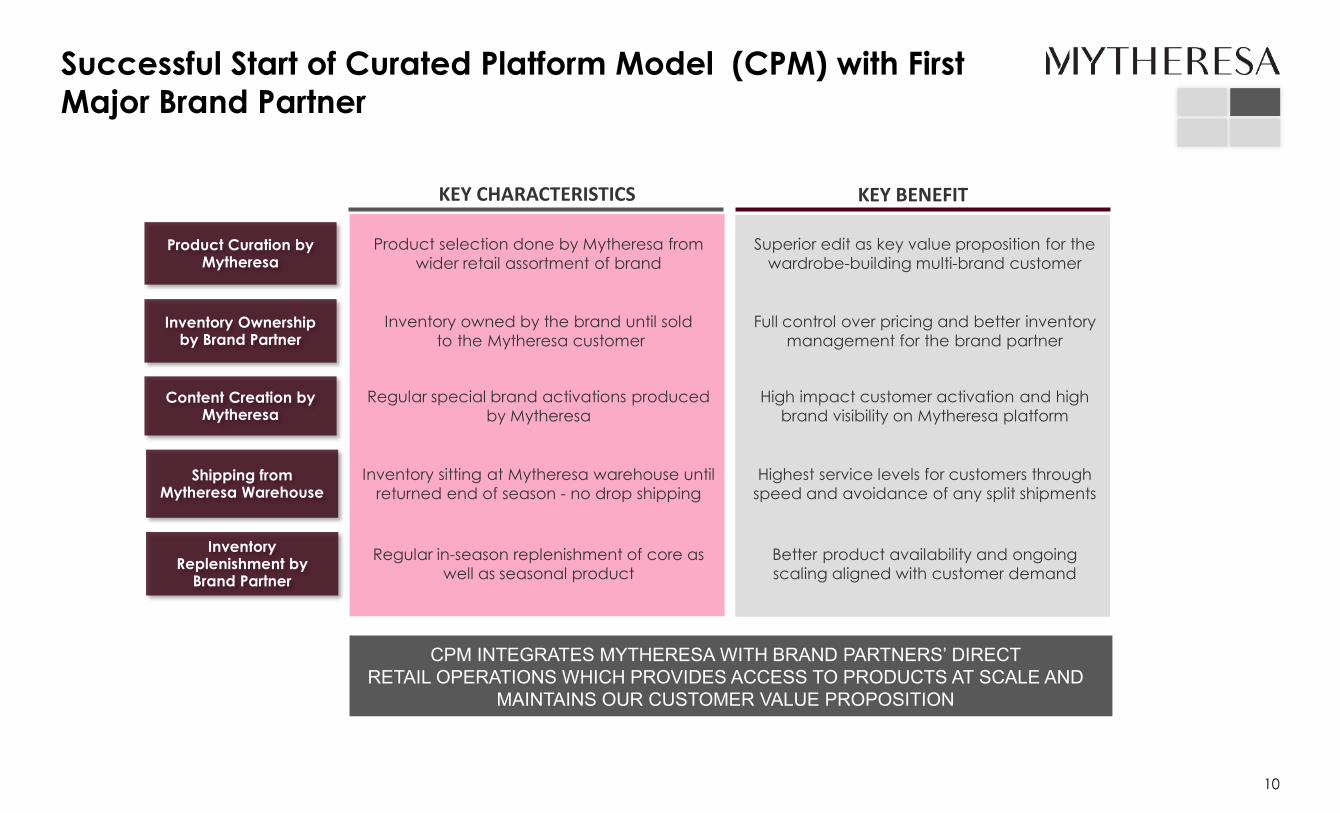
Successful Start of Curated Platform Model (CPM) with First Major Brand Partner
10
Shipping from Mytheresa Warehouse
Product Curation by Mytheresa
Inventory Replenishment by
Brand Partner
Content Creation by Mytheresa
Superior edit as key value proposition for the wardrobe-building multi-brand customer
High impact customer activation and high brand visibility on Mytheresa platform
Better product availability and ongoing scaling aligned with customer demand
Highest service levels for customers through speed and avoidance of any split shipments
KEY BENEFIT
Inventory Ownership by Brand Partner
Full control over pricing and better inventory management for the brand partner
Product selection done by Mytheresa from wider retail assortment of brand
Regular special brand activations produced by Mytheresa
Regular in-season replenishment of core as well as seasonal product
Inventory sitting at Mytheresa warehouse until returned end of season - no drop shipping
KEY CHARACTERISTICS
Inventory owned by the brand until soldto the Mytheresa customer
CPM INTEGRATES MYTHERESA WITH BRAND PARTNERS’ DIRECT RETAIL OPERATIONS WHICH PROVIDES ACCESS TO PRODUCTS AT SCALE AND
MAINTAINS OUR CUSTOMER VALUE PROPOSITION

Strong Interest for New Resale Service and Measurable Increase in Customer Spend
11
Performance KPI’s for Resale Service (June 7th to September 30th)
3
26%
3%• 26% of targeted
customers registered• 3% of targeted
customers already used the new service
• 40 % of users have already used the service more than once
60%
LTM beforeresale
AOV with store credit from resale
40%
60%
TARGETED MYTE CUSTOMERS
ACTUAL RESELLERS
AOV OF CUSTOMERSON MYTHERESA
1.6Resale items per
customer
TRANSACTIONS RESELLERS
+700Avg. EUR resale value
PARTNERSHIP WITH VESTIAIRE COLLECTIVE ALLOWS HIGH-VALUE CUSTOMERS TO PARTICIPATE IN THE CIRCULAR ECONOMY WITH MINIMAL FRICTION AND TIME INVESTMENT. CUSTOMERS RECEIV FOR
THEIR PRE-LOVED ITEMS IMMEDIATE PAYMENT IN THE FORM OF MYTHERESA STORE CREDIT.

Continued Strong Repurchase Behavior by New Customer Cohorts Acquired in FY21 vs. FY20
FY20
FY21
12
MayApril June
Percent of Customer Repurchasing 3 Months after Acquisition
AugustJuly September
Percent of Customer Repurchasing 3 Months after Acquisition
January1 February1 March1
April1 May1 June1
Notes:1 Month of acquisition for new customer cohort

Strong Growth of Top Customer Numbers in Q1 FY22 and Still Stable Average Order Value per Customer
% Q1 FY22 vs. Q1 FY21Growth of customers
% Q1 FY22 vs. Q1 FY21
Average Order Value
+41.0%
+26.4%
Top Customers
AllCustomers
0.0%
+2.3%
13

Mytheresa’s Business Model Continues to Demonstrate Uniquely Consistent Performance in Q1 FY22
14
1Q FY21 1Q FY22
Operational Indicators
+4%
+0.5pp
-2,5%
+4.3 pp
AOV WomenswearIn EUR
Return Rate WomenswearIn %
CAC In EUR
NPSIn %
Financial Indicators
Gross Profit Margin
Shipping & Payment Cost Margin
Marketing Cost Margin
SG&A Margin(1)
+2.6pp
+0.5pp
-0.1pp
+0.5pp
Notes:1. Adjusted to exclude IPO preparation and transaction costs and share-based compensation expense.2. Gross Profit Margin is calculated in relation to Net Sales. Shipping & Payment Cost Margin, Marketing Cost Margin and SG&A Margin is calculated in relation to GMV.

Financial Highlights Q1 FY22

Strong Performance in Q1 FY22
Notes:1. Represents the three months ended September 30, 2021
Q1 FY22 (1) YoY Change
Gross Merchandise Value (GMV) (€MM) 163.9 29.7%
LTM Active Customers ('000) 705 35.2%
LTM Total Orders Shipped ('000) 1,580 35.3%
Net Sales (€MM) 157.8 24.9%
Gross Profit Margin 49.0% 260 bps
Adjusted Operating Income (€MM) 11.8 40.7%
Adjusted Operating Income Margin 7.5% 80 bps
Adjusted EBITDA (€MM) 14.0 34.4%
Adjusted EBITDA Margin 8.9% 60 bps
Adjusted Net Income (€MM) 8.2 51.7%
16

126.4
163.9
Q1 - FY21 Q1 - FY22
Strong GMV Growth in Q1 FY22
29.7%Q1 FY22
YoY Growth
Notes:1. Represents the three months ended September 30, 20212. Represents the twelve months ended September 30, 2021
(€MM)
Gross Merchandise Value (GMV)
Q1 FY22 (1) YoY Change
Gross Merchandise Value (GMV) (€MM) 163.9 29.7%
LTM Active Customers ('000) 705 35.2%
LTM Total Orders Shipped ('000) 1,580 35.3%
Net Sales (€MM) 157.8 24.9%
17
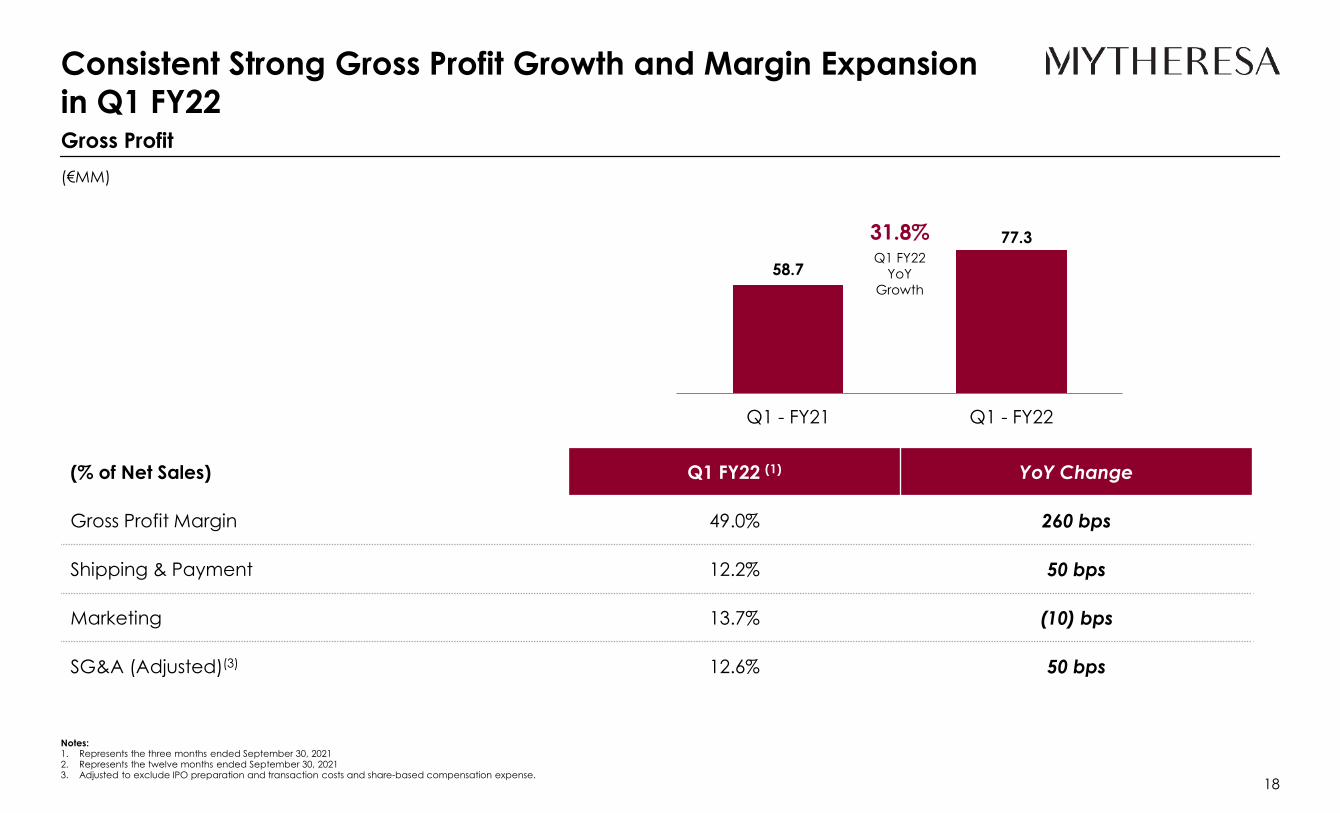
Consistent Strong Gross Profit Growth and Margin Expansionin Q1 FY22
Notes:1. Represents the three months ended September 30, 20212. Represents the twelve months ended September 30, 20213. Adjusted to exclude IPO preparation and transaction costs and share-based compensation expense.
(% of Net Sales) Q1 FY22 (1) YoY Change
Gross Profit Margin 49.0% 260 bps
Shipping & Payment 12.2% 50 bps
Marketing 13.7% (10) bps
SG&A (Adjusted)(3) 12.6% 50 bps
(€MM)
Gross Profit
58.7
77.3
Q1 - FY21 Q1 - FY22
31.8%Q1 FY22
YoY Growth
18

Strong Profitability Growth Achieved for Q1 FY22
10.4 14.0
Q1-FY21 Q1-FY22
(€MM)
8.3%% Margin
34.4%Q1 FY22
YoY Growth
8.9%
Adjusted EBITDA Adjusted Operating Income
8.4 11.8
Q1-FY21 Q1-FY22
(€MM)
6.7%% Margin
40.7%Q1 FY22
YoY Growth
7.5%
Notes:1. Represents the three months ended September 30, 2021
Q1 FY22 (1) YoY Change
Adjusted Operating Income (€MM) 11.8 40.7%
Adjusted Operating Income Margin 7.5% 80 bps
Adjusted EBITDA (€MM) 14.0 34.4%
Adjusted EBITDA Margin 8.9% 60 bps
Adjusted Net Income (€MM) 8.2 51.7%
19
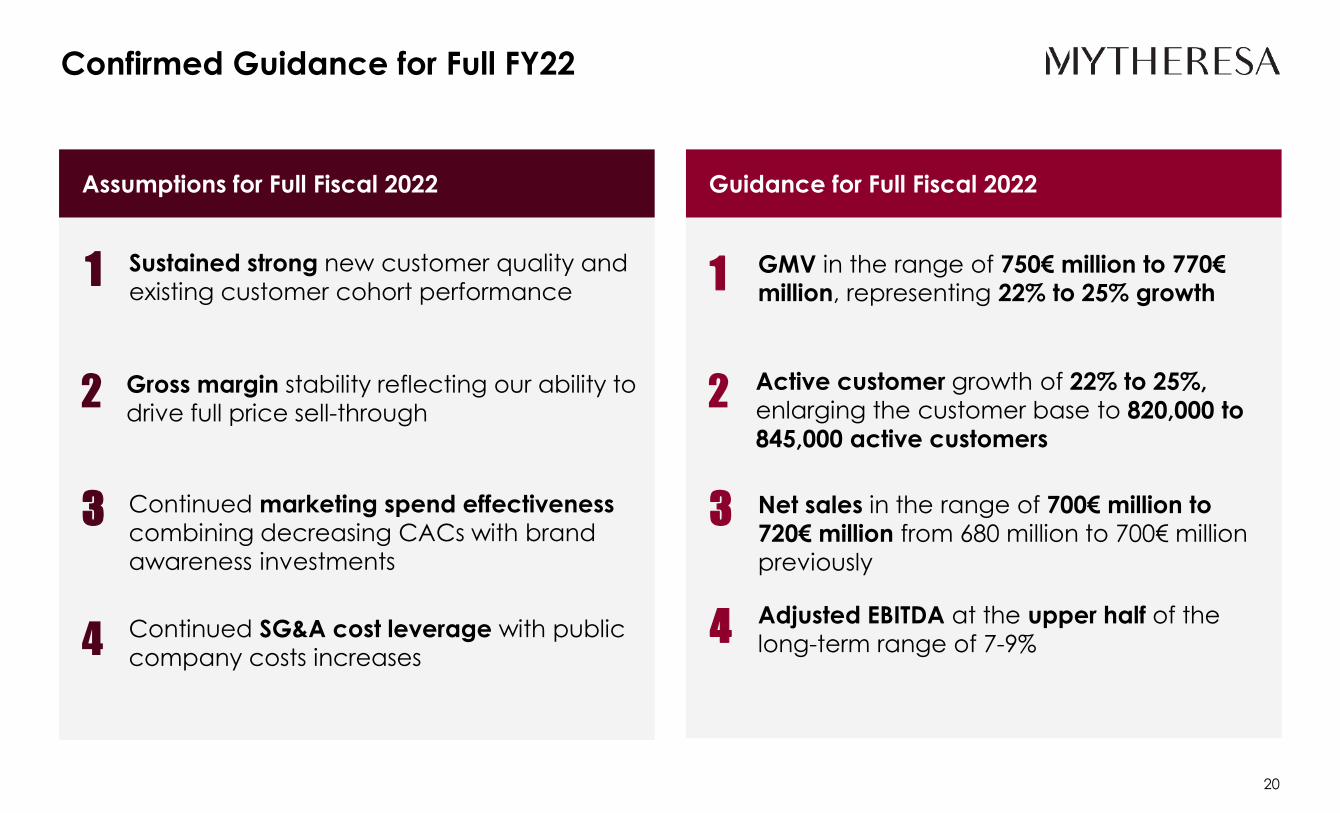
Confirmed Guidance for Full FY22
20
Guidance for Full Fiscal 2022Assumptions for Full Fiscal 2022
Active customer growth of 22% to 25%, enlarging the customer base to 820,000 to 845,000 active customers
2 Gross margin stability reflecting our ability to drive full price sell-through 2
GMV in the range of 750€ million to 770€ million, representing 22% to 25% growth1Sustained strong new customer quality and
existing customer cohort performance1
Net sales in the range of 700€ million to 720€ million from 680 million to 700€ million previously
3 Continued marketing spend effectiveness combining decreasing CACs with brand awareness investments
3
Continued SG&A cost leverage with public company costs increases4 Adjusted EBITDA at the upper half of the
long-term range of 7-9%4

Confirmed guidance for FY 22 and medium-term targets
21
GMV
Adj. EBITDA Margin*
CPM Share
Active Customers
Net Sales
Gross Profit
(€MM)
*The Adjusted EBITDA is relative to Net Sales
Notes:1. These are not projections; they are goals / targets and are forward-looking, subject to significant business, economic, regulatory and competitive uncertainties and contingencies, many of which are beyond the control of the Company and its management,
and are based upon assumptions with respect to future decisions, which are subject to change. Actual results will vary and those variations may be material. For discussion of some of the important factors that could cause these variations, please consult the "Risk Factors" section of a prospectus to be issued by the Company in relation to a specific offering. Nothing in this presentation should be regarded as a representation by any person that these goals / targets will be achieved and the Company undertakes no duty to update its goals
2. Fiscal year ended June 303. Adjusted for US Sales Tax, IPO preparation cost, any strategic investor sale preparation costs, and share-based payments4. We present Adjusted EBITDA per IFRS16 guidance. Right-of-use assets, including leases, are capitalized and amortized according to this accounting convention resulting in an increase in our amortization and interest expense not found with Non-IFRS reporting
companies. We suggest analysts and investors evaluate all profitability measures, including net income, when comparing Mytheresa to other companies5. “Gross Merchandise Value” (“GMV”) is an operative measure and means the total Euro value of orders processed. GMV is inclusive of product value, shipping and duty. It is net of returns, value added taxes and cancellations. GMV does not represent revenue
earned by us, although GMV and revenue are correlated.
Medium-Term Targets FY24+Guidance FY22
+22-25%
7-9%
< 35%
+22-25%
+22-25%
+22-25%
750-770+22-25%
8.0-9.0%
< 20%
820K-845K+22-25%
700-720+14-18%
345-355+21-24%

Mytheresa Offers a Unique Investment Opportunity
22
Outstanding Market Fundamentals Given Resilience of Luxury and High
Growth Potential of Online
A Unique and Differentiated Value Proposition Recognized Both by Brand Partners and Customers
A Highly Loyal and Engaged Luxury Customer Base Delivering
Excellent Economics
A Unique Business Model Achieving Excellent Business KPIs as well as Strong Growth and Profitability
New Picture

Appendix

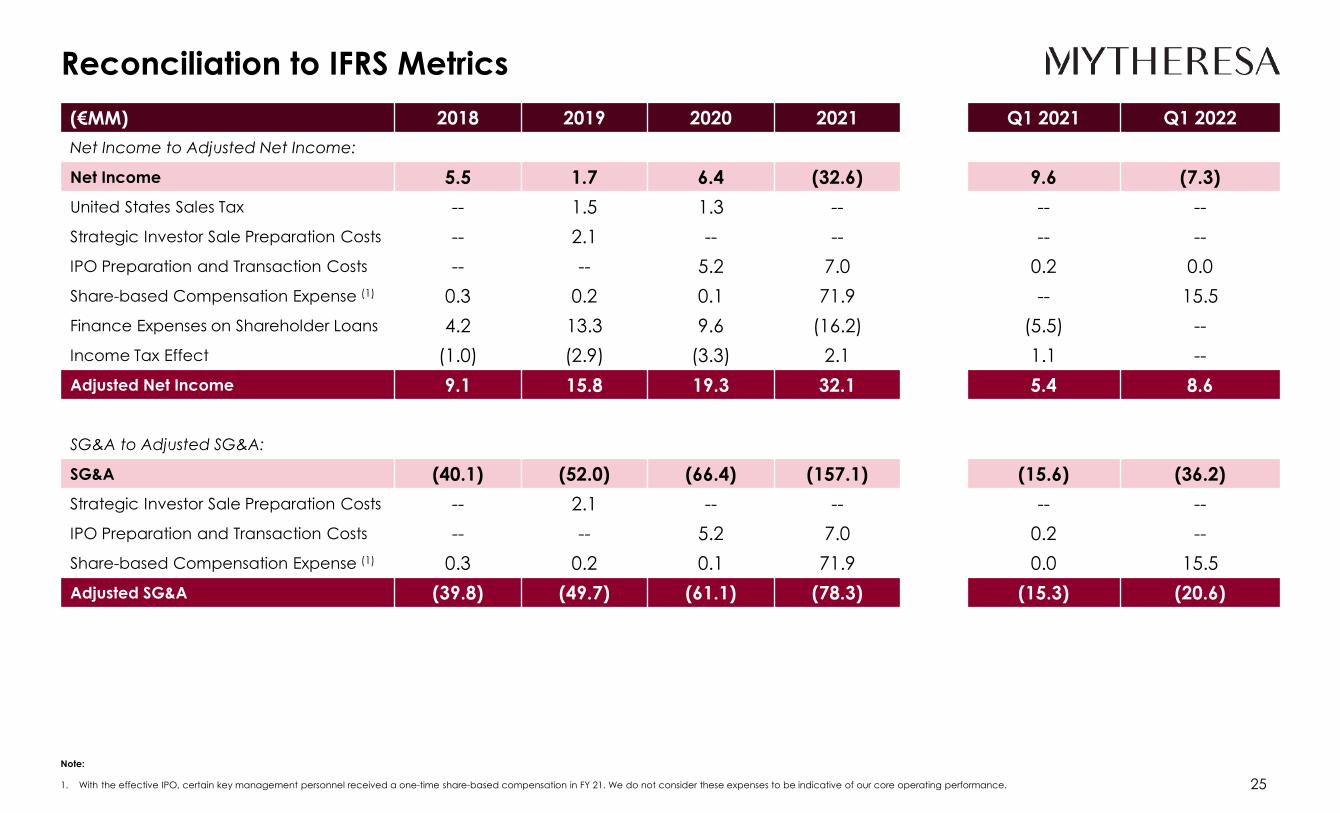
Reconciliation to IFRS Metrics
24Note:1. With the effective IPO, certain key management personnel received a one-time share-based compensation. We do not consider these expenses to be indicative of our core operating performance.
(€MM) 2018 2019 2020 2021 Q1 2021 Q1 2022Net Income to Adjusted EBITDA:
Net Income 5.5 1.7 6.4 (32.6) 9.6 (7.3)Finance Expenses, Net 4.8 14.0 11.1 (15.1) (5.2) 0.2Income Tax Expense 3.5 3.4 3.4 15.5 3.8 3.4Depreciation & Amortization 6.8 7.7 7.9 8.2 2.0 2.2EBITDA 20.6 26.8 28.8 (23.9) 10.2 (1.5)United States Sales Tax -- 1.5 1.3 -- -- --Strategic Investor Sale Preparation Costs -- 2.1 -- -- -- --IPO Preparation and Transaction Costs -- -- 5.2 7.0 0.2 0.0Share-based Compensation Expense (1) 0.3 0.2 0.1 71.9 0.0 15.5Adjusted EBITDA 20.9 30.5 35.4 54.9 10,4 14.0Net Income to Adjusted Operating Income:Net Income 5.5 1.7 6.4 (32.6) 9.6 (7.3)Finance Expenses, Net 4.8 14.0 11.1 (15.1) (5.2) (0.2)Income Tax Expense 3.5 3.4 3.4 15.5 3.8 3.4Operating Income 13.8 19.1 20.9 (32.2) 8.2 (3.7)United States Sales Tax -- 1.5 1.3 -- -- --Strategic Investor Sale Preparation Costs -- 2.1 -- -- -- --IPO Preparation and Transaction Costs -- -- 5.2 7.0 0.2 0.0Share-based Compensation Expense (1) 0.3 0.2 0.1 71.9 0.0 15.5Adjusted Operating Income 14.1 22.8 27.5 46.7 8.4 11.8
Reconciliation to IFRS Metrics
25
(€MM) 2018 2019 2020 2021 Q1 2021 Q1 2022Net Income to Adjusted Net Income:
Net Income 5.5 1.7 6.4 (32.6) 9.6 (7.3)United States Sales Tax -- 1.5 1.3 -- -- --Strategic Investor Sale Preparation Costs -- 2.1 -- -- -- --IPO Preparation and Transaction Costs -- -- 5.2 7.0 0.2 0.0Share-based Compensation Expense (1) 0.3 0.2 0.1 71.9 -- 15.5Finance Expenses on Shareholder Loans 4.2 13.3 9.6 (16.2) (5.5) --Income Tax Effect (1.0) (2.9) (3.3) 2.1 1.1 --Adjusted Net Income 9.1 15.8 19.3 32.1 5.4 8.6
SG&A to Adjusted SG&A:
SG&A (40.1) (52.0) (66.4) (157.1) (15.6) (36.2)Strategic Investor Sale Preparation Costs -- 2.1 -- -- -- --IPO Preparation and Transaction Costs -- -- 5.2 7.0 0.2 --Share-based Compensation Expense (1) 0.3 0.2 0.1 71.9 0.0 15.5Adjusted SG&A (39.8) (49.7) (61.1) (78.3) (15.3) (20.6)
Note:
1. With the effective IPO, certain key management personnel received a one-time share-based compensation in FY 21. We do not consider these expenses to be indicative of our core operating performance.