q317 earnings slides
TRANSCRIPT
Bruker Corporation (NASDAQ: BRKR)
Q3 2017 Earnings Presentation
Frank Laukien, President & CEO
Anthony Mattacchione, SVP & CFO
Miroslava Minkova, Head of Investor Relations November 2, 2017
Innovation with Integrity

BRUKER CORPORATION
Safe Harbor & Reg. G Statement
Any statements contained in this presentation that do not describe historical facts may constitute
forward-looking statements within the meaning of the Private Securities Litigation Reform Act of 1995.
Any forward-looking statements contained herein are based on current expectations, but are subject to
risks and uncertainties that could cause actual results to differ materially from those indicated, including,
but not limited to, risks and uncertainties relating to adverse changes in conditions in the global economy
and volatility in the capital markets, the integration of businesses we have acquired or may acquire in the
future, fluctuations in foreign currency exchange rates, our ability to successfully implement restructuring
initiatives, changing technologies, product development and market acceptance of our products, the cost
and pricing of our products, manufacturing, competition, dependence on collaborative partners, key
suppliers and contract manufacturers, capital spending and government funding policies, changes in
governmental regulations, the use and protection of intellectual property rights, litigation, and other risk
factors discussed from time to time in our filings with the Securities and Exchange Commission, or SEC.
These and other factors are identified and described in more detail in our filings with the SEC, including,
without limitation, our annual report on Form 10-K for the year ended December 31, 2016 and
subsequently filed Quarterly reports on Form 10-Q. We expressly disclaim any intent or obligation to
update these forward-looking statements other than as required by law. We will also be referencing non-
GAAP financial measures in this presentation. A reconciliation of non-GAAP to GAAP results is available in
our earnings press release and in this presentation.
2

Business Update
Q3 2017 & YTD Q3-2017
3

Q3-2017 Performance
Revenue increase of +$42M, or +10.6% y-o-y
− Acquisitions add +4.8% y-o-y
− FX translation adds +2.4% y-o-y
− Organic revenue up +3.4% y-o-y, driven by CALID
and NANO, as academic markets, particularly Europe,
and global industrial markets improve
Non-GAAP gross margin decreases -130 bps y-o-y due
to expected M&A dilution, FX and mix
Non-GAAP operating margin decreases -10 bps y-o-y
Non-GAAP operating profit grows +10% y-o-y
GAAP EPS of $0.23, compared to $0.29 in Q3-16
Non-GAAP EPS of $0.29, compared to $0.32 in Q3-16
− Non-GAAP eff. tax rate 22.6%, vs. 6.3% in Q3-16
Q3 Financials
4
Revenues [$M]
394 436
Q3-16 Q3-17
Non-GAAP EPS
Q3-2017: Good revenue and operating profit growth,
EPS declines on tax comparisons
+10.6%
-9%
$0.32
$0.29
Q3-16
Q3-17
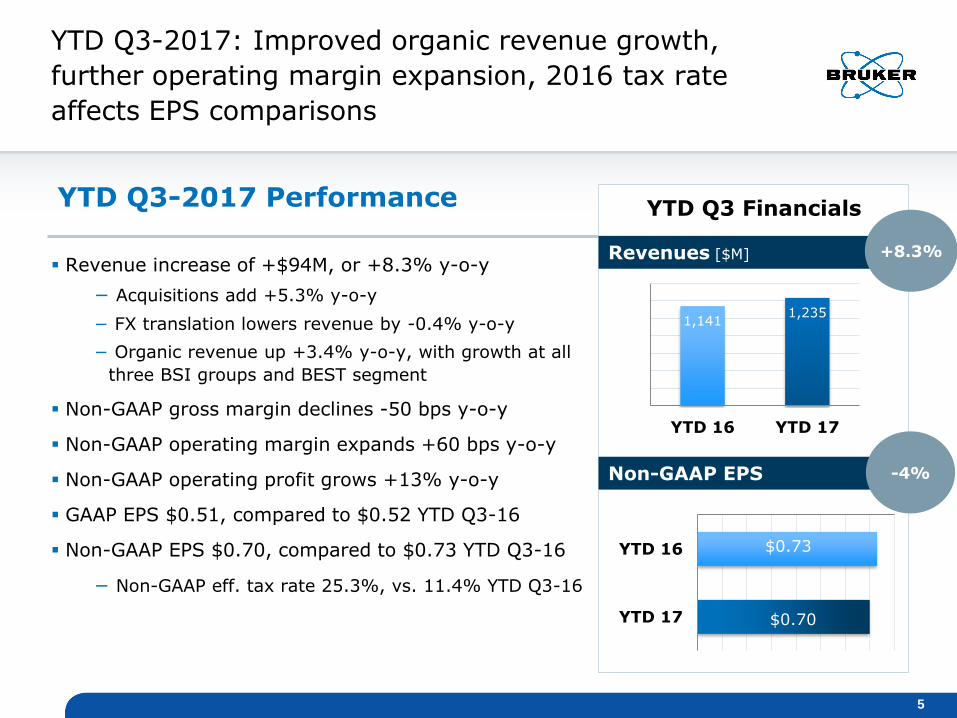
YTD Q3-2017 Performance
Revenue increase of +$94M, or +8.3% y-o-y
− Acquisitions add +5.3% y-o-y
− FX translation lowers revenue by -0.4% y-o-y
− Organic revenue up +3.4% y-o-y, with growth at all
three BSI groups and BEST segment
Non-GAAP gross margin declines -50 bps y-o-y
Non-GAAP operating margin expands +60 bps y-o-y
Non-GAAP operating profit grows +13% y-o-y
GAAP EPS $0.51, compared to $0.52 YTD Q3-16
Non-GAAP EPS $0.70, compared to $0.73 YTD Q3-16
− Non-GAAP eff. tax rate 25.3%, vs. 11.4% YTD Q3-16
YTD Q3 Financials
5
Revenues [$M]
1,141 1,235
YTD 16 YTD 17
Non-GAAP EPS
YTD Q3-2017: Improved organic revenue growth,
further operating margin expansion, 2016 tax rate
affects EPS comparisons
+8.3%
-4%
$0.73
$0.70
YTD 16
YTD 17

Bruker BIOSPIN Group
BIOSPIN low single digit constant currency revenue growth; operating
margins lower, due primarily to less favorable mix
NMR revenue slightly higher despite 1GHz system revenue in Q1-16
PCI grows with good Q2/Q3 execution and PCI market recovery
Continued strong after-market revenue growth with LabScapeTM
CALID mid-single digit constant currency revenue growth, including
InVivo acquisition; operating margins higher y-o-y on better revenue
performance and 2016 factory restructuring
Daltonics revenue up; improved European academic and microbiology
businesses
Optics revenue grows; improved applied and industrial demand
Detection revenue down on comparison with large contract in Q1-16
GROUP OVERVIEW:
YTD Q3-2017 Operating Performance
6
Bruker CALID Group

Bruker NANO Group
NANO high single digit constant currency revenue growth, driven by
academic and industrial market improvements and Hysitron acquisition;
AXS revenue higher on industrial growth and European recovery
Semicon metrology revenue higher on technology buys and market
strength
Nano Surfaces higher, primarily due to Hysitron acquisition
BEST Segment
BEST revenue substantially higher, driven by B-OST acquisition in
November 2016, and strong Q2-17 organic growth; BEST gross margin
inherently lower than Scientific Instruments segment gross margins;
MRI demand for superconductors and ‘Big Science’ projects drive BEST
results
B-OST performance ahead of target; productivity investments on-going
GROUP OVERVIEW:
YTD Q3-2017 Operating Performance
7
Innovation with Integrity
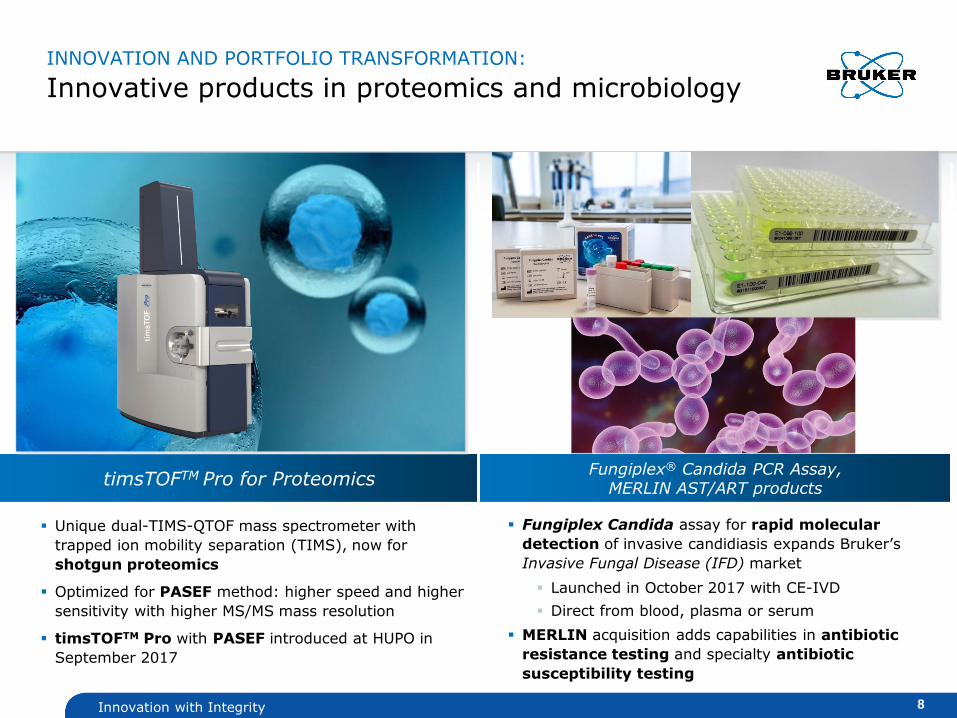
INNOVATION AND PORTFOLIO TRANSFORMATION:
Innovative products in proteomics and microbiology
8
Unique dual-TIMS-QTOF mass spectrometer with
trapped ion mobility separation (TIMS), now for
shotgun proteomics
Optimized for PASEF method: higher speed and higher
sensitivity with higher MS/MS mass resolution
timsTOFTM Pro with PASEF introduced at HUPO in
September 2017
Fungiplex Candida assay for rapid molecular
detection of invasive candidiasis expands Bruker’s
Invasive Fungal Disease (IFD) market
Launched in October 2017 with CE-IVD
Direct from blood, plasma or serum
MERLIN acquisition adds capabilities in antibiotic
resistance testing and specialty antibiotic
susceptibility testing
timsTOFTM Pro for Proteomics Fungiplex® Candida PCR Assay, MERLIN AST/ART products

2017 Key Priorities
Accelerate Revenue Growth via a combination of
organic growth and M&A contributions
Sustain Margin Expansion as we continue our
Operational & Commercial Excellence journey
Continue to Strengthen Systems and insights by
harmonizing processes, ERP and CRM platforms
Invest in profitable growth: six key high-growth,
high-margin initiatives for portfolio transformation
Thoughtfully Deploy Capital for sustainable
shareholder returns
9

Financial Update
Q3-2017 & YTD Q3-2017
10

NON-GAAP FINANCIAL PERFORMANCE:
Q3-2017 Overview
[$ m, except EPS] Q3-2017 Q3-2016 Δ
Revenues 435.6 393.9 +10.6%
Operating Profit 64.4 58.6 +10%
Margin (%) 14.8% 14.9% -10bps
Non-GAAP EPS $0.29 $0.32 -9%
Free Cash Flow 25.1 27.1 -2.0M
[$ m] Sept 30, 2017 Sept 30, 2016 Δ
Net (Debt)/ Cash (51.3) 76.6 -167%
Working capital (WC)* 690.3 613.4 +13%
WC-to-revenue ratio $0.40 $0.38 -5%
11
COMMENTS
Reported revenue +10.6%,
organic growth +3.4%
Operating profit up +10%
Operating margin -10 bps:
volume and operational
improvement at CALID &
NANO, offset by dilution from
M&A, FX and BioSpin mix
Free cash flow +$25.1M
Use of cash for buybacks,
dividends and M&A, and
credit facility borrowings,
result in a net debt position
vs. a net cash position in
Q3-16
Working capital up +13%
with acquisitions and FX
* WC = (Accounts Receivable + Inventory - Accounts Payable)

Q3 2016 Organic Currency Portfolio Q3 2017
$393.9M $435.6M
Q3-2017 Revenue Bridge
Organic Currency Portfolio Total
+3.4% +2.4% +4.8% +10.6%
Reported revenue +10.6%
Organic revenue up
+3.4%, reflecting y-o-y
increases at NANO and
CALID
Acquisitions add +4.8% to
revenue growth, primarily
from B-OST, Hysitron and
InVivo
FX positive by $9M, or
+2.4%
12
Q3-2017 DRIVERS
Q3-2017 Revenue Bridge [$M]
+$13.6M +$9.0M +$19.1M
Q3-2017 Revenue

Q3-2017 Non-GAAP Results
[$ m, except EPS] Q3-2017 Q3-2016 Δ
Total Revenues 435.6 393.9 +10.6%
Gross Profit 207.4 192.6 +8% Margin (% of revenues) 47.6% 48.9% -130 bps
SG&A -102.1 -96.1 +6%
(% of revenues) 23.4%
24.4%
R&D -40.9 -37.9 +8% (% of revenues) 9.4% 9.6%
Operating Profit 64.4 58.6 +10%
(% of revenues) 14.8% 14.9% -10 bps
Tax Rate 22.6% 6.3% +1630 bps
Net Income* 46.4 51.7 -10%
EPS $0.29 $0.32 -9%
Shares Outstanding 158.7 161.5 -2%
Gross margin down -130 bps:
– Dilution from OST acq. and FX
– BioSpin product and geographic mix
SG&A and R&D increases driven by acquisitions and FX
Operating margin down -10 bps: gross margin dilution offset by operational improvements at CALID & NANO
Operating profit +10% with revenue growth
Q3-2017 tax rate 22.6% vs. 6.3% in Q3-16 (on 2016 tax reversals)
EPS down -9% due to y-o-y tax comparison
Share count lower on share repurchases
13
COMMENTS
* Attributable to Bruker Sum of items may not total due to rounding

YTD 2016 Organic Currency Portfolio YTD 2017
$1,141.0M $1,235.4M
YTD Q3-2017 Revenue Bridge
Organic Currency Portfolio Total
+3.4% -0.4% +5.3% +8.3%
Reported revenue +8.3%
Organic revenue growth
+3.4%, reflecting growth
at all three Scientific
Instruments Groups and
the BEST segment
Acquisitions add +5.3% to
revenue growth, primarily
from B-OST, Hysitron and
InVivo
FX negative by -$5.1M, or
-0.4%
14
YTD Q3-2017 DRIVERS
YTD Q3-2017 Revenue Bridge [$M]
+$39.1M -$5.1M +$60.4M
YTD Q3-2017 Revenue

YTD Q3-2017 Non-GAAP Results
[$ m, except EPS] YTD Q3-17 YTD Q3-16 Δ
Total Revenues 1,235.4 1,141.0 +8.3%
Gross Profit 584.1 544.9 +7% Margin (% of revenues) 47.3% 47.8% -50 bps
SG&A -299.6 -288.2 +4%
(% of revenues) 24.3%
25.3%
R&D -119.2 -110.8 +8% (% of revenues) 9.6% 9.7%
Operating Income 165.3 145.9 +13%
(% of revenues) 13.4% 12.8% +60 bps
Tax Rate 25.3% 11.4% 1390 bps
Net Income* 112.4 118.6 -5%
EPS $0.70 $0.73 -4%
Shares Outstanding 159.9 162.7 -2%
Gross margin down -50 bps y-o-y. Operational improvements at CALID and NANO more than offset by higher BEST revenue, BioSpin mix and FX
Operating margin +60 bps: CALID and NANO volume leverage and operational improvements, partially offset by dilution from acquisitions & FX
YTD Q3-2017 effective tax rate 25.3% vs. 11.4% in YTD Q3-16 (on 2016 tax reversals)
EPS down -4% due to y-o-y tax effects
Share count lower on share repurchases
15
COMMENTS
* Attributable to Bruker Sum of items may not total due to rounding

YTD Q3-2017 Cash Flow
[$ m] YTD Q3-17 YTD Q3-16 Δ
Net Income 83.3 85.4 -2.1
Depreciation & amortization 48.2 40.4 +7.8
Changes in working capital* -44.4 -38.7 -5.7
Other -36.4 -47.1 +10.7
Operating cash flow 50.7 40.0 +10.7
Capital expenditures -31.3 -26.0 -5.3
Free cash flow 19.4 14.0 +5.4
Y-o-y free cash flow
improvement driven by:
– Higher operating cash
flow
– Partially offset by an
uptick in capital
expenditures
16
COMMENTS
* WC = (Accounts Receivable + Inventory - Accounts Payable)

FY 2017 Outlook
17

FY 2017 Guidance
Revenue Growth y-o-y +8% to +8.5%
Non-GAAP Operating Margin Expansion y-o-y(1)(2)
+70 bps to +100 bps
Non-GAAP EPS $1.17 to $1.20
18
FY 2017 Guidance: Raising Outlook for Operating
Performance and Updates in FX
Organic revenue growth of
+2.5% to +3%
Acquisition revenue
growth: +4.5%
FX revenue tailwind: +1%
Non-GAAP tax rate: ~25%
Fully diluted share count:
~159M shares
Capex: ~$45M
FX assumptions as of
September 30, 2017:
USD = 112.7 Yen
EUR = 1.18 USD
CHF = 1.03 USD
2017 ASSUMPTIONS
(1) From a FY16 non-GAAP operating margin of 14.8%.
(2) Includes approximately -40 bps cumulative negative effect from 2016 and 2017
acquisitions.

Appendix
19

Q3-2017 GAAP Results
[$M, except EPS] Q3 2017 Q3 2016 Δ
Total Revenues 435.6 393.9 +11%
Gross Profit 198.0 185.2 +7%
Margin (% of sales) 45.5% 47.0%
SG&A -102.9 -96.8 +6%
(% of revenues) 23.6% 24.6%
R&D -40.9 -37.9 +8%
(% of revenues) 9.4% 9.6%
Operating Income 49.9 45.9 +9%
(% of revenues) 11.5% 11.7%
Net Income* 37.0 46.5 -20%
EPS $0.23 $0.29 -21%
Shares Outstanding 158.7 161.5 -2%
20
* Attributable to Bruker Sum of items may not total due to rounding

Q3-2017 Reconciliation of GAAP and
Non-GAAP Results
[$M, except EPS] Q3 2017 Q3 2016
GAAP Operating Income 49.9 45.9
Restructuring Costs 4.6 5.3
Acquisition-Related Costs 0.7 0.4
Purchased Intangible Amortization 8.2 5.4
Other Costs 1.0 1.6
TOTAL 14.5 12.7
Non-GAAP Operating Income 64.4 58.6
Non-GAAP Interest & Other Expense, net -3.6 -2.9
Non GAAP Profit Before Tax 60.8 55.7
Non-GAAP Income Tax Provision -13.8 -3.5
Non-GAAP Tax Rate 22.7% 6.3%
Minority Interest -0.6 -0.5
Non-GAAP Net Income* 46.4 51.7
Non-GAAP EPS $0.29 $0.32
21
Sum of items may not total due to rounding *Attributable to Bruker

YTD Q3-2017 GAAP Results
[$M, except EPS] YTD Q3-2017 YTD Q3-2016 Δ
Total Revenues 1,235.4 1,141.0 +8%
Gross Profit 557.8 522.1 +7%
Margin (% of sales) 45.2% 45.8%
SG&A -303.8 -290.4 +5%
(% of revenues) 24.6% 25.5%
R&D -119.2 -110.8 +8%
(% of revenues) 9.6% 9.7%
Operating Income 121.0 100.3 +21%
(% of revenues) 9.8% 8.8%
Net Income* 82.0 84.6 -3%
EPS $0.51 $0.52 -2%
Shares Outstanding 159.9 162.7 -2%
22
* Attributable to Bruker Sum of items may not total due to rounding

YTD Q3-2017 Reconciliation of GAAP and
Non-GAAP Results
[$M, except EPS] YTD Q3-2017 YTD Q3-2016
GAAP Operating Income 121.0 100.3
Restructuring Costs 8.5 12.8
Acquisition-Related Costs 9.4 10.4
Purchased Intangible Amortization 22.6 16.2
Other Costs 3.8 6.2
TOTAL 44.3 45.6
Non-GAAP Operating Income 165.3 145.9
Non-GAAP Interest & Other Expense, net -12.9 -11.1
Non GAAP Profit Before Tax 152.4 134.8
Non-GAAP Income Tax Provision -38.7 -15.4
Non-GAAP Tax Rate 25.4% 11.4%
Minority Interest -1.3 -0.8
Non-GAAP Net Income* 112.4 118.6
Non-GAAP EPS $0.70 $0.73
23
Sum of items may not total due to rounding *Attributable to Bruker

Q3-2017 Cash Flow
[$ m] Q3 2017 Q3 2016 Δ
Net Income 37.6 47.0 -9.4
Depreciation & amortization 17.1 13.7 +3.4
Changes in working capital* -24.4 -23.7 -0.7
Other 5.0 -1.1 +6.1
Operating cash flow 35.3 35.9 -0.6
Capital expenditures -10.2 -8.8 -1.4
Free cash flow 25.1 27.1 -2.0
Free cash modestly below
Q3-16:
– Change in deferred
income tax balances in
Q3-16
– Increased use of cash for
accounts receivable
– Timing of customer
advances
– Timing of payroll and
accruals
24
COMMENTS
* WC = (Accounts Receivable + Inventory - Accounts Payable)

Balance Sheet
[$M] Sept 30,
2017 Dec 31,
2016 Sept 30,
2016
Cash, Cash Equivalents & Short-term Investments
429.2 500.3 441.5
Financial Debt 480.5 411.7 364.9
Net (Debt) Cash (51.3) 88.6 76.6
25
[$M] Sept 30,
2017 Dec 31,
2016 Sept 30,
2016
Total Assets 1,961.5 1,808.4 1,797.9
Working Capital* 690.3 598.2 613.4
Intangibles, Net & Other Long-Term Assets
364.3 293.4 291.8
* WC = (Accounts Receivable + Inventory - Accounts Payable)
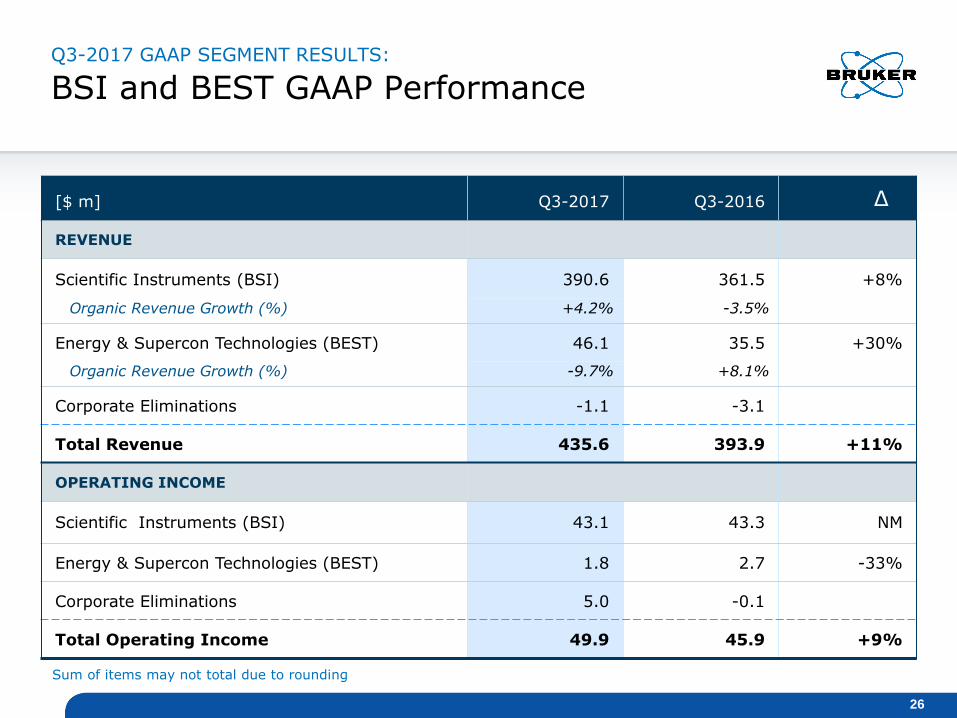
Q3-2017 GAAP SEGMENT RESULTS:
BSI and BEST GAAP Performance
[$ m] Q3-2017 Q3-2016 Δ
REVENUE
Scientific Instruments (BSI) 390.6 361.5 +8%
Organic Revenue Growth (%) +4.2% -3.5%
Energy & Supercon Technologies (BEST) 46.1 35.5 +30%
Organic Revenue Growth (%) -9.7% +8.1%
Corporate Eliminations -1.1 -3.1
Total Revenue 435.6 393.9 +11%
OPERATING INCOME
Scientific Instruments (BSI) 43.1 43.3 NM
Energy & Supercon Technologies (BEST) 1.8 2.7 -33%
Corporate Eliminations 5.0 -0.1
Total Operating Income 49.9 45.9 +9%
26
Sum of items may not total due to rounding