q3 2021 coingecko crypto report
TRANSCRIPT
CoinGecko Q3 2021 Cryptocurrency Report

CoinGecko Q3 2021 Cryptocurrency Report
DeFi Analysis
- Q3 2021 DeFi Overview
- Q3 2021 DeFi Multichain Dominance
- DeFi Ecosystem
- Performance of Top-5 Tokens from Various Categories
- Solana Ecosystem
- Avalanche Ecosystem
15
2
Index
Analysts:
Market Landscape
- Q3 2021 Spot Markets Overview
- Q3 2021 Top-5 Crypto Returns
- Q3 2021 Top-30 Coins Dominance
- Q3 2021 Top-5 Stablecoins
4
Founders’ Note 3 Non-Fungible Tokens (NFTs)
- General Overview
- Top 5 Collectibles by Aggregate Sales Volume
- Top 5 New NFTs in Q3 2021
- Rise of the JPEGs and Texts?
- Profile Pictures are leading the JPEG trend
- Loot (for Adventurers)
24
Bitcoin Analysis
- Bitcoin Price vs. Trading Volume
- Bitcoin Mining Hash Rate
- Price Returns: Bitcoin vs. Major Asset Classes
- Bitcoin Treasuries in Public Traded Companies
- Market Capitalization: Bitcoin vs. Gold vs. Top-5 S&P 500
Stocks
9
Benjamin HorWin Win
Exchanges
- Q3 2021 Top-10 Cryptocurrency Exchanges
- Q3 2021 Top-10 Centralized Exchanges (CEX)
- Q3 2021 Top-10 Decentralized Exchanges (DEX)
- Q3 2021 Derivatives Exchanges – Bitcoin Perpetual Swaps
Volume
- Q3 2021 Derivatives Exchanges – Bitcoin Perpetual Swaps
Open Interest
- Q3 2021 Derivatives Exchanges – Bitcoin Perpetual Swaps
Funding Rate
32
CoinGecko Highlights
- NFT Collection Tracker
- GeckoCon – NFTs Gone Wild
41
Shaun Lee Dillon Yap Stacy Kew Yi Hong Daniel Lew

CoinGecko Q3 2021 Cryptocurrency Report
Founders’ Note
“NFTs are redefining value and culture ”
3
Bobby OngCOO
TM LeeCEO
After a relatively hard-hitting Q2, the total crypto market capitalization has slowly clawed its way back to
$1.7 trillion from May’s correction. In Q3, traders and investors remained cautious lest a massive liquidation
event would happen again in such a short time.
Crypto continues to draw the scrutiny of regulators globally, with the Chinese government cracking down
the hardest, banning crypto mining and transactions in Q3. This Chinese crackdown seems like the harshest
to date and has practically forced all miners and exchanges to move out of China.
Decentralized Finance (DeFi) rose from the ashes of Q2 and into a new multichain reality as Avalanche,
Harmony, and Celo announced large incentive programs. As we enter a multichain world, cross-chain
bridges such as Solana’s Wormhole and Celer Network’s cBridge are becoming fundamental pieces of DeFi
infrastructure in helping liquidity migrate between blockchains.
Non-Fungible Tokens (NFTs) blasted into the stratosphere as VCs endorsed digital collectibles as investable
asset classes. Three Arrows Capital led the pack, sweeping prized digital artworks from CryptoPunks and Art
Blocks. Even VISA was not immune from the CryptoPunk train and purchased one.
NFT hype peaked in August when OpenSea achieved $3.4 billion in monthly trading volume. A new wave of
NFT collectibles entered the scene as virtual avatars repeatedly grabbed news headlines. Many people
started to change their profile pictures to NFT-based JPEGs, forming new communities and ushering in a
new era of crypto culture.
Even text-based NFTs were popularized, forcing us to reconsider the notions of what constitutes value in
this new digital age. We have already seen the impact of the Play-to-Earn movement, but NFTs continue to
surprise us in new ways with far-reaching implications.
NFTs are here to stay and have proven themselves to be the gateway drug for mainstream adoption. We
have been big fans of NFTs since learning about them in 2016. To celebrate the coming of age for NFTs, we
are happy to announce GeckoCon, our first NFT conference, on 17-19 November 2021. Join us as we explore
the NFT narrative deeper with NFT celebrities, thought leaders, and side events!

CoinGecko Q3 2021 Cryptocurrency Report
MARKET LANDSCAPE
4

CoinGecko Q3 2021 Cryptocurrency Report
$0.17T $0.15T
$1.3T
$1.7T
$-
$0.5T
$1.0T
$1.5T
$2.0T
$2.5T
Apr-21 May-21 Jun-21 Jul-21 Aug-21 Sep-21 Oct-21
Total Volume Traded Total Market Cap
5
Q3 2021 Spot Market Overview
Crypto market cap has recovered since infamous May crash, reaching $1.7 trillion
Top-30 Market Cap & Spot Trading Volume (Apr – Sep 2021)
Top-30 Coins Market Cap Growth in Q3 2021
+31%Market Cap
Q3 2021 Market Cap
+31%
Q3 2021 Vol.
-47%
Q2 2021 Market Cap
-20%
Q2 2021 Vol.
-33%
Alternate chains to Ethereum continue to exert dominance as their ecosystems flourish.
Compared to Q2 2021, the crypto market experienced a 31% increase in market cap but experienced a 47% drop in trading volume.
The huge discrepancy between the higher market cap and lower trading volume suggests that the market entered an accumulation stage where HODLersstepped in.
Trading volumes have remained relatively stagnant, likely because many market entrants were either liquidated or remain apprehensive since the May 2021 crash.
Data source: CoinGecko

CoinGecko Q3 2021 Cryptocurrency Report
Price Return
6
Q3 2021 Top-5 Crypto Returns
Cardano led the pack as it started implementing smart contracts and NFTs
Data source: CoinGecko*Top-5 Cryptocurrencies exclude Tether (USDT) stablecoin as of 1 October 2021
Top-5 Cryptocurrencies Average Price Returns Q3 2021
+35%
+32%
+36%
+53%
Price returns Q3 2021 (vs. Q2 2021)
+25%(-40%)
(+19%)
(+16%)
(+22%)
In Q3 2021, Cardano performed the strongest and led the top-5 pack with a 53% gain. Meanwhile, Bitcoin was still the weakest performing asset, despite increasing by 25%.
+28%(+0.3%)
Top-5 Cryptocurrency Price Returns (Jul – Sep 2021)
-40%
-20%
0%
20%
40%
60%
80%
100%
120%
140%
Jul-21 Aug-21 Sep-21 Oct-21
BTC ETH ADA BNB XRP

CoinGecko Q3 2021 Cryptocurrency Report
Top-30 Coins Dominance (Jul – Sep 2021)
Dominance
7
Q3 2021 Top-30 Coins Dominance
Altcoins continued to show signs of decoupling, especially from alternative chains
Market Dominance Q3 2021(% change vs Q2 2021)
4.0%
20.5%
47.8%
3.9% 13.4%*
(-4.5%)
(+1.6%)
(-15.7%)
(+16.3%) (+4.0%)
2.6%(5.1%)
3.5%(-2.9%)
2.4%(+226.9%)
Altcoins’ dominance continue to outperform Bitcoin’s which declined by as much as 4.5% , signifying the growingsentiment that altcoins are decoupling from Bitcoin. The exceptions, however, are Cardano and Tether. Tethermarked the biggest decline with a 15.7% drop.
Data source: CoinGecko* Others (8 - 30) refers to top 8 - 30 coins by market capitalization on CoinGecko as of 1 October 2021
0%
10%
20%
30%
40%
50%
60%
70%
80%
90%
100%
Jul-21 Aug-21 Sep-21 Oct-21
BTC ETH USDT ADA BNB XRP SOL Others (8-30)*Solana entered the top-8 for the firsttime and dethroned Doge with aremarkable 226.9% increase in marketshare. Binance Coin (BNB) has alsoperformed relatively well with a 16.3%increase.
Coupled with Ethereum’s stagnatingdominance (1.6%), it is clear thatalternative chains are growing strong.
Solana entered the top-8 for the firsttime and dethroned Doge with aremarkable 226.9% increase in marketshare. Binance Coin (BNB) has alsoperformed relatively well with a 16.3%increase.
Coupled with Ethereum’s stagnatingdominance (1.6%), it is clear thatalternative chains are growing strong.
CoinGecko Q3 2021 Cryptocurrency Report
Market Cap.Top-5 Stablecoins Market Cap
in Q3 2021
+$18B
8
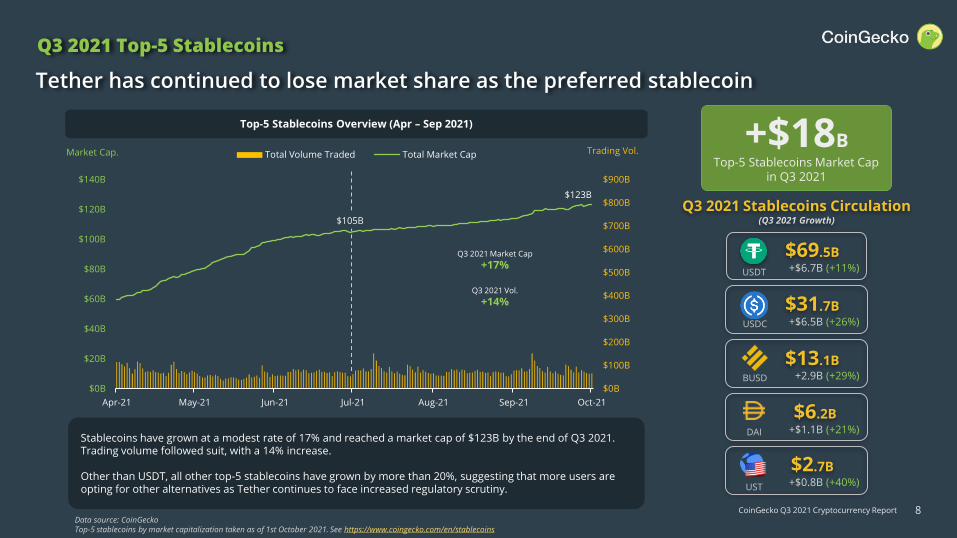
Q3 2021 Top-5 Stablecoins
Tether has continued to lose market share as the preferred stablecoin
Top-5 Stablecoins Overview (Apr – Sep 2021)
Stablecoins have grown at a modest rate of 17% and reached a market cap of $123B by the end of Q3 2021. Trading volume followed suit, with a 14% increase.
Other than USDT, all other top-5 stablecoins have grown by more than 20%, suggesting that more users are opting for other alternatives as Tether continues to face increased regulatory scrutiny.
$31.7B
$2.7B
$6.2B
$13.1B
Q3 2021 Stablecoins Circulation(Q3 2021 Growth)
$69.5B
USDT
USDC
BUSD
DAI
UST
Data source: CoinGeckoTop-5 stablecoins by market capitalization taken as of 1st October 2021. See https://www.coingecko.com/en/stablecoins
Trading Vol.
+$6.7B (+11%)
+$6.5B (+26%)
+$1.1B (+21%)
+$0.8B (+40%)
+2.9B (+29%)
$105B
$123B
$0B
$100B
$200B
$300B
$400B
$500B
$600B
$700B
$800B
$900B
$0B
$20B
$40B
$60B
$80B
$100B
$120B
$140B
Apr-21 May-21 Jun-21 Jul-21 Aug-21 Sep-21 Oct-21
Total Volume Traded Total Market Cap
Q3 2021 Market Cap
+17%
Q3 2021 Vol.
+14%

CoinGecko Q3 2021 Cryptocurrency Report
BITCOIN ANALYSIS
9

CoinGecko Q3 2021 Cryptocurrency Report 10
Bitcoin Price vs. Trading Volume
Bitcoin gaining its lost ground?
BTC was trending downwards throughout Q2 and the start of Q3. This trend was reversed in August, and BTC has since breached the $50,000 mark. The price increase in Q3 came on the back of rather muted trading volume.
BTC Price Trading Vol.
Bitcoin ended Q3 2021 at $43,859, a 25% increase quarter-on-quarter and had consolidated since its retracement from Q3's peak.
There were a few noteworthy events in Q3:
• El Salvador BTC payments going live• Institutional interest in BTC is
increasing, with many seeing it as a hedge against inflation
• China outlawed cryptocurrency mining and transactions
$52,740
$43,859
$0B
$100B
$200B
$300B
$400B
$500B
$600B
$0
$10,000
$20,000
$30,000
$40,000
$50,000
$60,000
$70,000
Apr-21 May-21 Jun-21 Jul-21 Aug-21 Sep-21 Oct-21
Volume Price
Q3 2021 Price
+25%
Q3 2021 Vol.
-1%
Bitcoin Price and Spot Trading Volume Apr ‘21 - Oct '21
+25%BTC Price return in Q3 2021
Bitcoin Price and Spot Trading Volume (Apr – Sep 2021)
Data source: CoinGecko
CoinGecko Q3 2021 Cryptocurrency Report
85M TH/s
145M TH/s
80M TH/s
100M TH/s
120M TH/s
140M TH/s
160M TH/s
180M TH/s
200M TH/s
Oct-20 Nov-20 Dec-20 Jan-21 Feb-21 Mar-21 Apr-21 May-21 Jun-21 Jul-21 Aug-21 Sep-21
+70.6%from
the lows
11
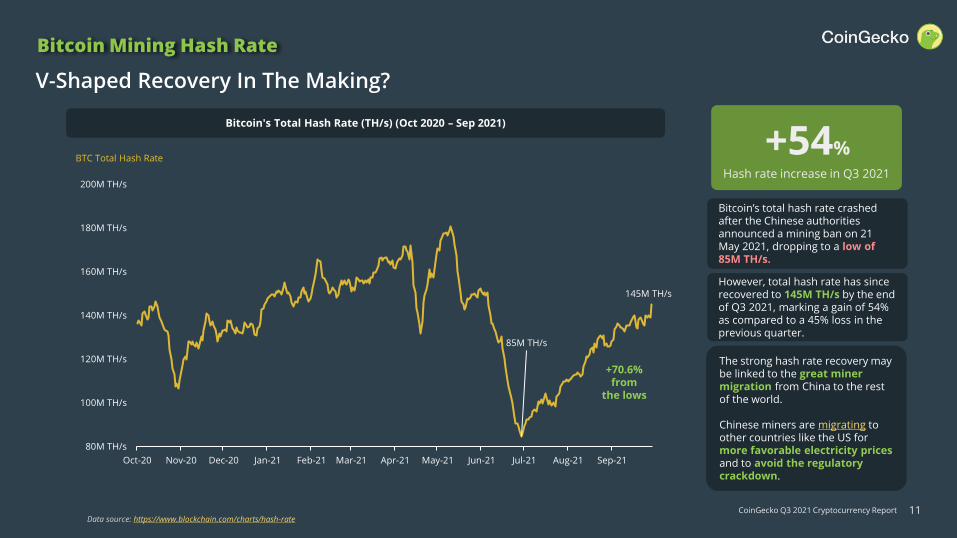
Bitcoin's Total Hash Rate (TH/s) (Oct 2020 – Sep 2021)
Bitcoin’s total hash rate crashed after the Chinese authorities announced a mining ban on 21 May 2021, dropping to a low of 85M TH/s.
However, total hash rate has since recovered to 145M TH/s by the end of Q3 2021, marking a gain of 54% as compared to a 45% loss in the previous quarter.
BTC Total Hash Rate
Data source: https://www.blockchain.com/charts/hash-rate
+54%Hash rate increase in Q3 2021
The strong hash rate recovery may be linked to the great miner migration from China to the rest of the world.
Chinese miners are migrating to other countries like the US for more favorable electricity pricesand to avoid the regulatory crackdown.
V-Shaped Recovery In The Making?
Bitcoin Mining Hash Rate

CoinGecko Q3 2021 Cryptocurrency Report 12
Bitcoin vs. Major Asset Classes (Jul – Sep 2021)
Bitcoin has outperformed major asset classes in Q3 2021, posting a climb of 25%.
All major assets classes and indices performed worse in Q3 2021 relative to Q3 2020 except for DXY and the Nasdaq index.
Price Returns: Bitcoin vs. Major Asset Classes
Bitcoin has climbed 25% and outperformed all other major asset classes
Price Return
Prices of Major Asset Classes were sourced from: https://finance.yahoo.com/
Revisiting Q3 2020, Bitcoin was seeing a wave of interest, which saw the price climb throughout the quarter. We see this price climb being mirrored in Q3 2021.
25%
-1%
2%
-30%
-20%
-10%
0%
10%
20%
30%
40%
50%
60%
Jul-21 Aug-21 Sep-21 Oct-21
BTC S&P 500 Nasdaq Gold Crude Oil TLT DXY
CoinGecko Q3 2021 Cryptocurrency ReportData source: https://www.coingecko.com/en/public-companies-bitcoin 13
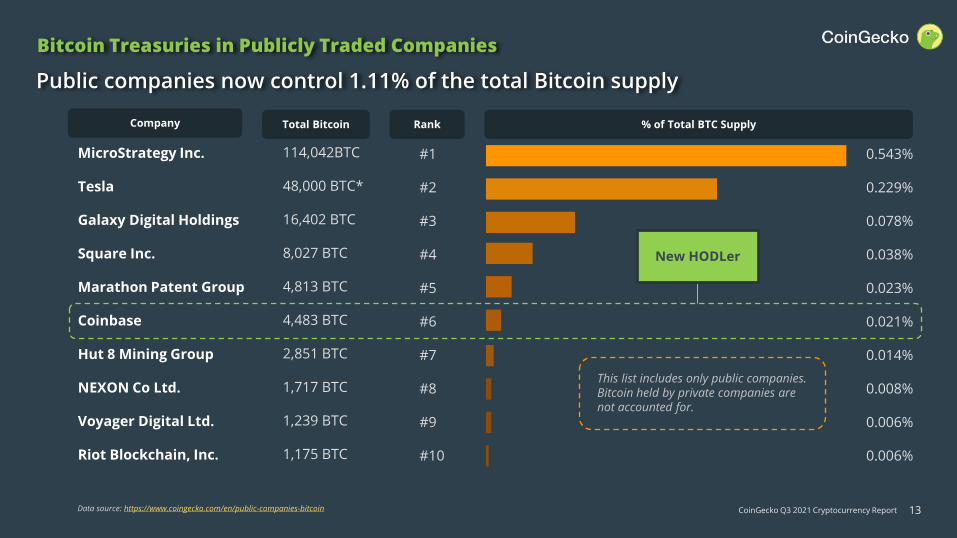
Bitcoin Treasuries in Publicly Traded Companies
Public companies now control 1.11% of the total Bitcoin supply
#1
#2
#3
#4
#5
#6
#7
#8
#9
#10
This list includes only public companies. Bitcoin held by private companies are not accounted for.
Total Bitcoin Rank % of Total BTC SupplyCompany
MicroStrategy Inc.
Tesla
Galaxy Digital Holdings
Square Inc.
Marathon Patent Group
Coinbase
Hut 8 Mining Group
NEXON Co Ltd.
Voyager Digital Ltd.
Riot Blockchain, Inc.
114,042BTC
48,000 BTC*
16,402 BTC
8,027 BTC
4,813 BTC
4,483 BTC
2,851 BTC
1,717 BTC
1,239 BTC
1,175 BTC
0.543%
0.229%
0.078%
0.038%
0.023%
0.021%
0.014%
0.008%
0.006%
0.006%
New HODLer
CoinGecko Q3 2021 Cryptocurrency Report
Assets(Market Cap)
14
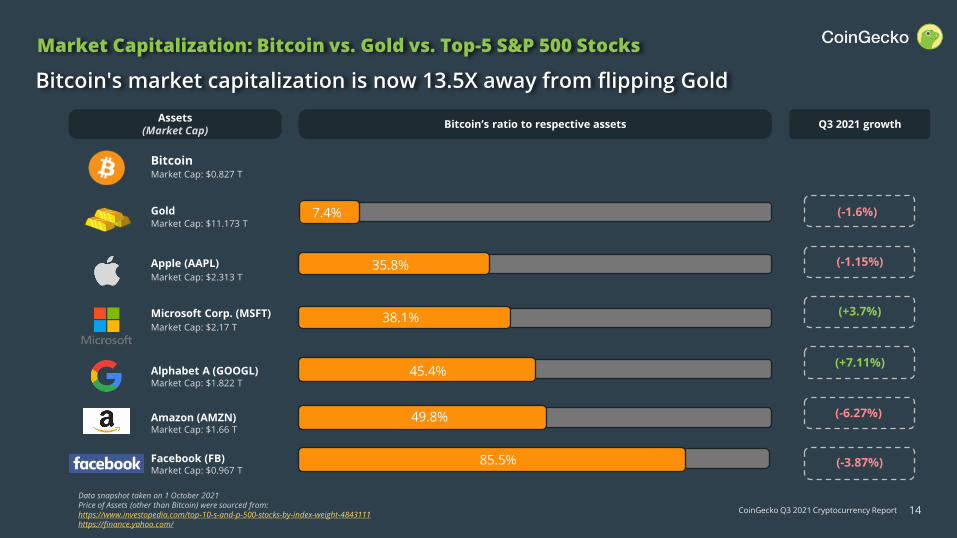
Market Capitalization: Bitcoin vs. Gold vs. Top-5 S&P 500 Stocks
7.4%Gold
Apple (AAPL)
Microsoft Corp. (MSFT)
Alphabet A (GOOGL)
Amazon (AMZN)
Facebook (FB)
Bitcoin's market capitalization is now 13.5X away from flipping Gold
35.8%
38.1%
45.4%
49.8%
85.5%
BitcoinMarket Cap: $0.827 T
Market Cap: $11.173 T
Market Cap: $2.313 T
Market Cap: $2.17 T
Market Cap: $1.822 T
Market Cap: $1.66 T
Market Cap: $0.967 T
Bitcoin’s ratio to respective assets
(-1.6%)
Q3 2021 growth
(-1.15%)
(+3.7%)
(+7.11%)
(-6.27%)
(-3.87%)
Data snapshot taken on 1 October 2021Price of Assets (other than Bitcoin) were sourced from: https://www.investopedia.com/top-10-s-and-p-500-stocks-by-index-weight-4843111https://finance.yahoo.com/
CoinGecko Q3 2021 Cryptocurrency Report
DEFI ANALYSIS
15

CoinGecko Q3 2021 Cryptocurrency Report 16
Q3 2021 DeFi Overview
DeFi is on the path to recovery
DeFi Market Cap and DeFi Dominance (Jan – Sep 2021)
DeFi market cap rebounded by 91% from $67B to $128B. Quarter-on-quarter, DeFi has increased its dominance from 4.7% and settled at 5.8%.
The increasing demand for DeFi is likely driven by the rise of native DeFi products on other alternative chains like Avalanche, Solana, and Terra.
It is also worth mentioning that the SEC has been heavily scrutinizing CeFi products. Notably, Coinbase was forced to cancel its crypto lending product (Lend) after a lawsuit threat from the SEC.
Data source: https://www.coingecko.com/en/defi
0%
1%
2%
3%
4%
5%
6%
7%
$0B
$50B
$100B
$150B
$200B
$250B
$300B
Jan-21 Feb-21 Mar-21 Apr-21 May-21 Jun-21 Jul-21 Aug-21 Sep-21 Oct-21
DeFi Market Cap DeFi Dominance (DeFi / Global Market Cap)
DeFi Market Cap DeFi Dominance
12 May 20211 Sep 2021
1 Apr 2021
DeFi Run-Up 2021 Recovery
Nonetheless, DeFi has not reclaimed its all-time high dominance since May 2021.
CoinGecko Q3 2021 Cryptocurrency Report
99% 99%96%
88%
74%79% 80% 79% 76%
10%
20% 11% 11% 11%11%
4%
6% 5% 5%
0%
10%
20%
30%
40%
50%
60%
70%
80%
90%
100%
Jan-21 Feb-21 Mar-21 Apr-21 May-21 Jun-21 Jul-21 Aug-21 Sep-21
Klaytn
Arbitrum
Waves
Fantom
Avalanche
Polygon
Terra
Solana
BSC
ETH
17
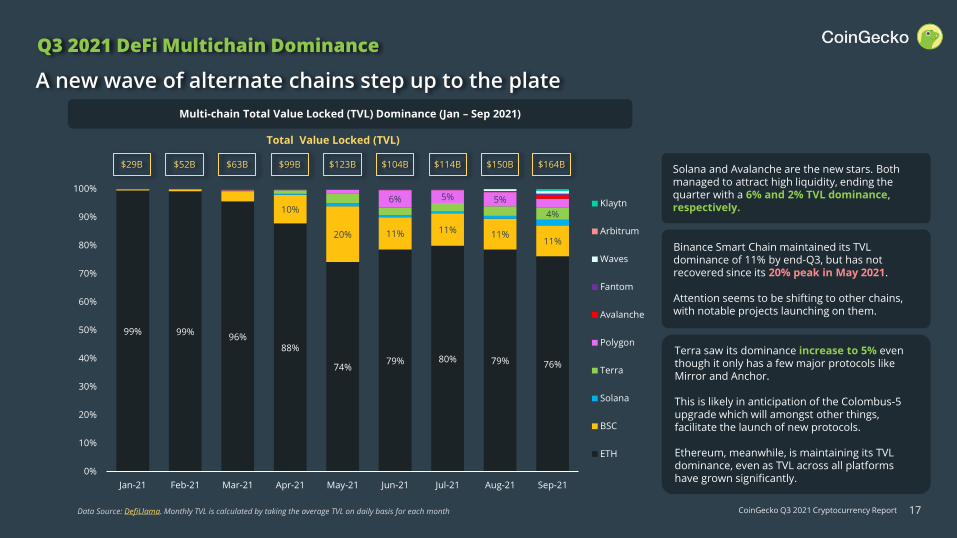
Q3 2021 DeFi Multichain Dominance
A new wave of alternate chains step up to the plate
Multi-chain Total Value Locked (TVL) Dominance (Jan – Sep 2021)
Data Source: DefiLlama. Monthly TVL is calculated by taking the average TVL on daily basis for each month
Solana and Avalanche are the new stars. Both managed to attract high liquidity, ending the quarter with a 6% and 2% TVL dominance, respectively.
$29B $52B $63B $99B $123B $104B
Total Value Locked (TVL)
Terra saw its dominance increase to 5% even though it only has a few major protocols like Mirror and Anchor.
This is likely in anticipation of the Colombus-5 upgrade which will amongst other things, facilitate the launch of new protocols.
Ethereum, meanwhile, is maintaining its TVL dominance, even as TVL across all platforms have grown significantly.
Binance Smart Chain maintained its TVL dominance of 11% by end-Q3, but has not recovered since its 20% peak in May 2021.
Attention seems to be shifting to other chains, with notable projects launching on them.
$114B $150B $164B

CoinGecko Q3 2021 Cryptocurrency Report 18
AssetManagement
$0.46B
Fixed Interest$0.20B
The DeFi sector regains some of its strength as the overall market capitalization of the industry increased by 37%. The main contributors include DEXs, oracles and lending platforms, with each segment recording a 28%-40% increase. The market cap of DEXs itself increased by nearly $10 billion.
Both lending platforms and oracles are still going neck-and-neck in terms of DeFi market share. Although oracles experienced 7% lower growth compared to lending, the total market cap of each sector saw a similar increase of approximately $3 billion.
Although fixed interest and insurance projects had the weakest growthcompared to other DeFi sectors, the asset management sector had an overwhelming increase in market capitalization by 91%.
Market Cap of each DeFi Category (Jul – Sep 2021)
The DeFi sector roars back to life from May’s low
DeFi Ecosystem
Data snapshot taken on 1 October 2021* Categorical market cap includes only governance and utility tokens (excluding stablecoins and wrapped tokens)
DeFi Total Market Capitalization as of 1st October 2021*
$66.3B
(+37.0%)
CoinGecko Q3 2021 Cryptocurrency Report
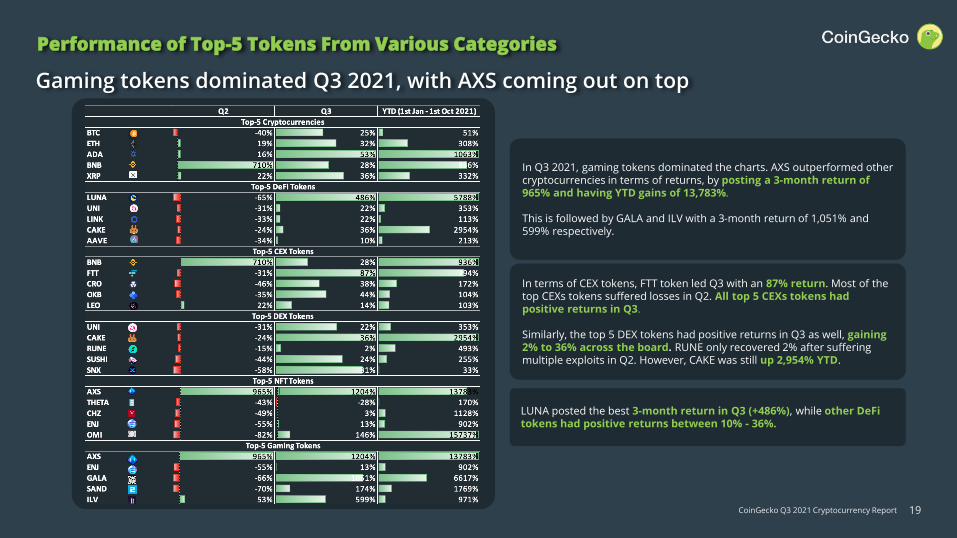
Gaming tokens dominated Q3 2021, with AXS coming out on top
Performance of Top-5 Tokens From Various Categories
In Q3 2021, gaming tokens dominated the charts. AXS outperformed other cryptocurrencies in terms of returns, by posting a 3-month return of 965% and having YTD gains of 13,783%.
This is followed by GALA and ILV with a 3-month return of 1,051% and 599% respectively.
In terms of CEX tokens, FTT token led Q3 with an 87% return. Most of the top CEXs tokens suffered losses in Q2. All top 5 CEXs tokens had positive returns in Q3.
Similarly, the top 5 DEX tokens had positive returns in Q3 as well, gaining 2% to 36% across the board. RUNE only recovered 2% after suffering multiple exploits in Q2. However, CAKE was still up 2,954% YTD.
19
LUNA posted the best 3-month return in Q3 (+486%), while other DeFitokens had positive returns between 10% - 36%.
CoinGecko Q3 2021 Cryptocurrency Report 20
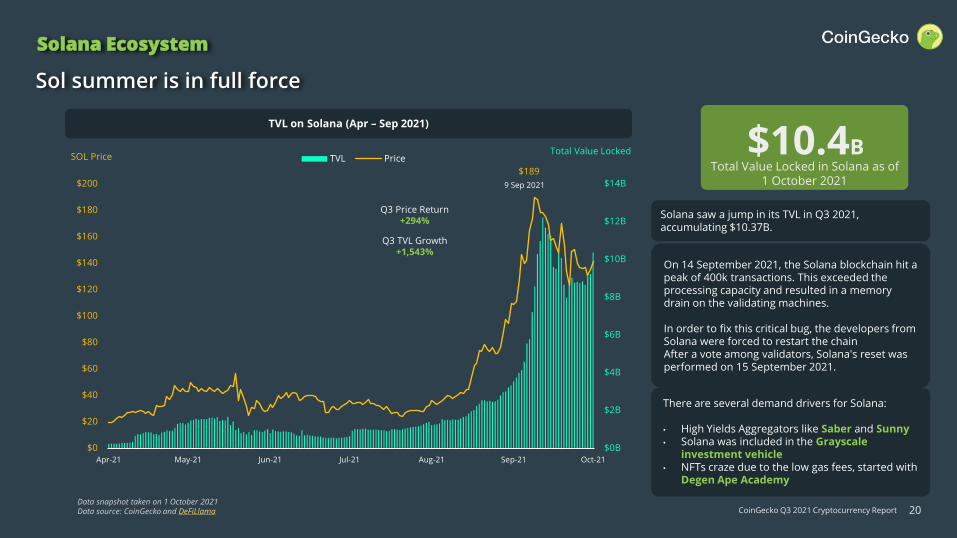
Solana saw a jump in its TVL in Q3 2021, accumulating $10.37B.
Sol summer is in full force
Solana Ecosystem
$189
$0B
$2B
$4B
$6B
$8B
$10B
$12B
$14B
$0
$20
$40
$60
$80
$100
$120
$140
$160
$180
$200
Apr-21 May-21 Jun-21 Jul-21 Aug-21 Sep-21 Oct-21
TVL Price
9 Sep 2021
Total Value Locked
Data snapshot taken on 1 October 2021Data source: CoinGecko and DeFiLlama
On 14 September 2021, the Solana blockchain hit a peak of 400k transactions. This exceeded the processing capacity and resulted in a memory drain on the validating machines.
In order to fix this critical bug, the developers from Solana were forced to restart the chainAfter a vote among validators, Solana's reset was performed on 15 September 2021.
There are several demand drivers for Solana:
• High Yields Aggregators like Saber and Sunny• Solana was included in the Grayscale
investment vehicle• NFTs craze due to the low gas fees, started with
Degen Ape Academy
Q3 Price Return+294%
Q3 TVL Growth+1,543%
$10.4BTotal Value Locked in Solana as of
1 October 2021
TVL on Solana (Apr – Sep 2021)
SOL Price

CoinGecko Q3 2021 Cryptocurrency Report 21
Solana ecosystem soars in growth, with more protocols hopping onboard
Solana Ecosystem
The Solana ecosystem experienced a massive growth in Q3 2021, flirting close to $10.37 billion TVL by the end of the quarter, making it the 3rd largest ecosystem, behind Ethereum and Binance Smart Chain.
The introduction of a native ETH-SOL bridge also helped facilitate cross-chain asset transfers.
Users can now use Wormhole Networkto bridge their assets from Ethereum to the Solana ecosystem.
Data source: DefiLlama
Lending & Borrowing
SolendPort Finance
Decentralized Exchange
SerumRaydium Orca
DeFi Options
Yield Aggregator
Saber Sunny
PsyOptionsZeta Market
Solfarm
Wallet
Phantom
Oracle
Chainlink
Parrot Protocol
MangoMarket
Sollet Solfare GravityPythNetwork
NFT Market
Solanart DigitalEyes SolSea
Saber, the DEX has brought in a TVL of $3.01B on Solana, followed by Sunny with $2.38B TVL.
CoinGecko Q3 2021 Cryptocurrency Report
$76
$0B
$1B
$2B
$3B
$4B
$5B
$6B
$0
$10
$20
$30
$40
$50
$60
$70
$80
$90
Apr-21 May-21 Jun-21 Jul-21 Aug-21 Sep-21 Oct-21
TVL Price Total Value Locked
22
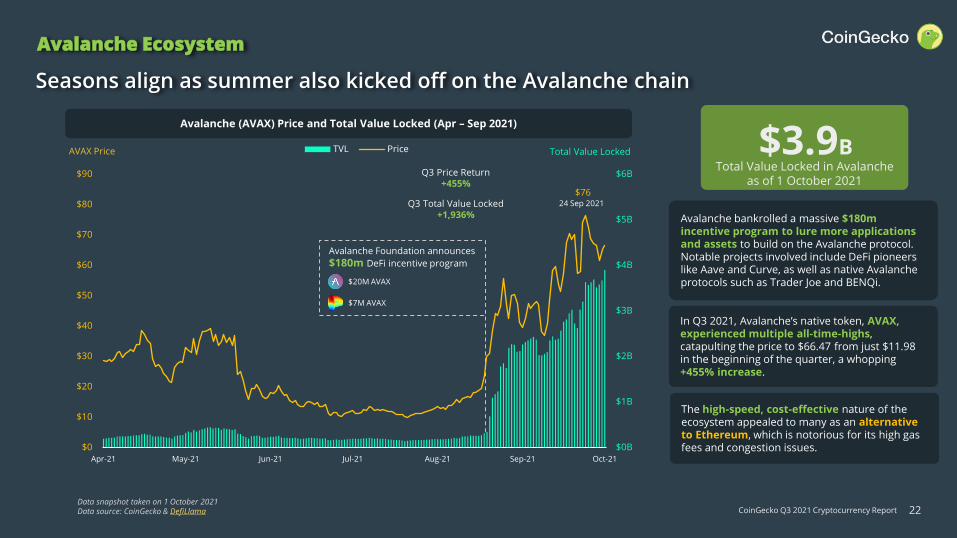
Seasons align as summer also kicked off on the Avalanche chain
Avalanche Ecosystem
In Q3 2021, Avalanche’s native token, AVAX, experienced multiple all-time-highs, catapulting the price to $66.47 from just $11.98 in the beginning of the quarter, a whopping +455% increase.
Avalanche bankrolled a massive $180m incentive program to lure more applications and assets to build on the Avalanche protocol. Notable projects involved include DeFi pioneers like Aave and Curve, as well as native Avalanche protocols such as Trader Joe and BENQi.
Avalanche Foundation announces
$180m DeFi incentive program
$20M AVAX
$7M AVAX
Q3 Price Return+455%
Q3 Total Value Locked+1,936%
The high-speed, cost-effective nature of the ecosystem appealed to many as an alternative to Ethereum, which is notorious for its high gas fees and congestion issues.
$3.9BTotal Value Locked in Avalanche
as of 1 October 2021
AVAX Price
Data snapshot taken on 1 October 2021Data source: CoinGecko & DefiLlama
24 Sep 2021
Avalanche (AVAX) Price and Total Value Locked (Apr – Sep 2021)

CoinGecko Q3 2021 Cryptocurrency Report 23
Like Solana, more and more protocols are sprouting up on Avalanche
Avalanche Ecosystem
The Avalanche ecosystem experienced a massive growth in Q3 2021, flirting close to $4 billion TVL by the end - making it the 6th largest ecosystem, right behind Polygon.
Native protocols like Trader Joe and BENQialso partnered with The Avalanche Foundation in running liquidity mining incentives, co-leading the charge in Avalanche’s growth.
Lending & Borrowing
*Aave(Q4)
BENQi
Decentralized Exchange
*Curve(Q4)
Trader Joe
Pangolin
Bridge
Yield Aggregator
Beefy Finance
Yield Yak
Snowball
AvaxBridge
Anyswap
Penguin Finance
Collateralized Stablecoin
Abracadabra Money
Asset-backed Token
Wonderland
The introduction of a native ETH-AVAX bridge also helped facilitate cross-chain asset transfers.
Users who bridged >$75 worth of assets will be airdropped up to 0.1 AVAX (enough for ~15 swaps), which helped entice newcomers to enter the ecosystem.
*Launching in Q4 2021Data Source: DefiLlama
Synapse
CoinGecko Q3 2021 Cryptocurrency Report 24
Non-Fungible Tokens (NFTs)
CoinGecko Q3 2021 Cryptocurrency Report 25
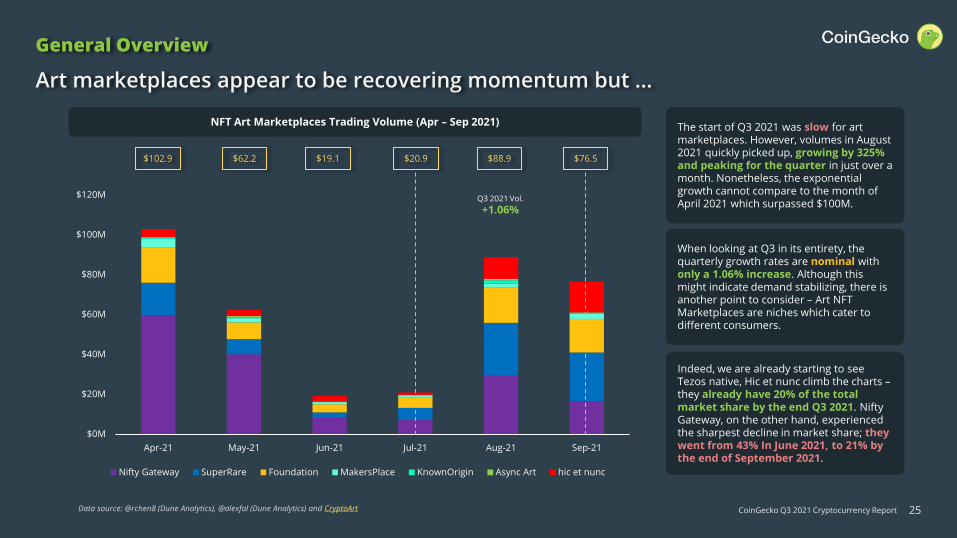
Art marketplaces appear to be recovering momentum but …
General Overview
Indeed, we are already starting to see Tezos native, Hic et nunc climb the charts –they already have 20% of the total market share by the end Q3 2021. Nifty Gateway, on the other hand, experienced the sharpest decline in market share; they went from 43% In June 2021, to 21% by the end of September 2021.
The start of Q3 2021 was slow for art marketplaces. However, volumes in August 2021 quickly picked up, growing by 325% and peaking for the quarter in just over a month. Nonetheless, the exponential growth cannot compare to the month of April 2021 which surpassed $100M.
When looking at Q3 in its entirety, the quarterly growth rates are nominal with only a 1.06% increase. Although this might indicate demand stabilizing, there is another point to consider – Art NFT Marketplaces are niches which cater to different consumers.
NFT Art Marketplaces Trading Volume (Apr – Sep 2021)
Data source: @rchen8 (Dune Analytics), @alexfal (Dune Analytics) and CryptoArt
$0M
$20M
$40M
$60M
$80M
$100M
$120M
Apr-21 May-21 Jun-21 Jul-21 Aug-21 Sep-21
Nifty Gateway SuperRare Foundation MakersPlace KnownOrigin Async Art hic et nunc
Q3 2021 Vol.
+1.06%
$62.2 $19.1 $20.9 $88.9 $76.5$102.9

CoinGecko Q3 2021 Cryptocurrency Report 26
… the reality is that OpenSea is monopolizing the entire NFT market in NFT Summer
General Overview
A big reason why OpenSea has been so successful is also because it is the home ground for Art Blocks which captures a large market share of generative art enthusiasts. The reality is that all NFT Marketplaces (including Art Marketplaces) are losing ground to the behemoth that is OpenSea.
We are clearly in NFT Summer as NFT trading volumes reached all time highs, shattering previous records. Both OpenSeaand Rarible hit a combined trading volume of $6.8B in Q3 2021.
OpenSea continues to exert its monopoly status, contributing more than 99% of the total trading volume by the end of September 2021. Rarible only contributed $21M in the month of September 2021 which is less than 1%.
Data source: @rchen8 (Dune Analytics), @alexfal (Dune Analytics)
Many attribute the summer to a variety of factors such as the growing maturity of the market. However, the big catalyst came about when institutions legitimized NFTs as an investable asset through their own investments.
OpenSea and Rarible Trading Volume (Apr – Sep 2021)
$0B
$1B
$2B
$2B
$3B
$4B
Apr-21 May-21 Jun-21 Jul-21 Aug-21 Sep-21
Opensea Rarible
$0.16 $0.16 $0.34 $3.48 $3.02$0.13
Q3 2021 Vol.
+1389%

CoinGecko Q3 2021 Cryptocurrency Report
Apr-21 May-21 Jun-21 Jul-21 Aug-21 Sep-21
0% -18% 15% 76% -7% -38%
4% 29% -47% 99% 176% 56%
-4% -21% 14% 95% 246% 32%
-58% -52% -12% -20% 107% -32%
565% 259% 84% 551% 86%
27
Art and avatars saw the highest returns while non-JPEGs plateaued
Top 5 Collectibles by Aggregate Sales Volume
$2.2B
963,119Unique Buyers
Top-5 Collectibles Aggregate Sales Volume Since Inception (As of 1 October 2021)
AxieInfinity
NBA Top Shot
CryptoPunks Art Blocks Bored Ape Yacht Club
Data source: CryptoSlam
Top-5 Collectibles Average Sales Price Monthly Growth Rate (Apr – Sep 2021) At the start of the quarter, the top-5 collectibles (except NBA Top Shot which had a 20% drawdown), saw positive price returns of more than 70%.
Three Arrows Capital, one of the most successful crypto hedge funds, galvanized the marketafter announcing their CryptoPunk purchases (amongst other NFTs) in late July 2021.
The NFT mania hit its peak in August 2021. Bored Ape Yacht Club stands out with its impressive 551% return in anticipation of its auction sale at Sotheby’s in early September. Notably, the auction would later go on to sell a bundle of 107 Apes for $24.4M.
$1.4B
6,869 Unique Buyers
$925.0M
25,881 Unique Buyers
$723.9M
779,635 Unique Buyers
$527.9M
9,706 Unique Buyers

CoinGecko Q3 2021 Cryptocurrency Report
JPEGs and texts blew up the market
Top 5 New NFTs in Q3 2021
Data source: CryptoSlam and Nansen as of 30 September 2021
Q3 2021 saw the birth of new NFT projects that drew global attention. No one could have predicted what a bunch of NFTs would have done. From cutesy creatures to just plain old words, many projects took their cue from them Bored Ape Yacht Club (BAYC) and showed how a picture or even texts can be so much more. Out of the five projects listed below, four currently have the top-10 highest trading volumes ever for NFTs, with Pudgy Penguins following closely behind in 11th place. This is an impressive feat, considering that all of them are less than 3-months old.
4,706Holders
Cool Cats are a collection 10,000 randomly assembled cats that have a variety of outfits, faces andcolors. Each cat has a pre-determined score from 3-10, based on their traits. The score is importantbecause they affect community events such as contests and Gen 2 breeding mechanics. Notably, famouscelebrities like Mike Tyson have acquired one, and the project even appeared on Times Magazine.
Cool CatsJuly 2021
0N1 ForceAugust 2021
0N1 Force is a set of 7,777 generative side-profile lo-fi avatars that drew heavy inspiration fromJapanese anime. The collection is divided into three clans: 0K-A1, B4K3M0-N0, and 0N1. Many buyerswere drawn in by the detailed and intricate art styles of each avatar, including Logan Paul, whoset the record for the highest purchased NFT for 188 ETH.
Pudgy Penguins consists of 8,888 penguins that are designed to be pudgy, cute, fun, and a little goofy.After receiving widespread attention on Crypto Twitter through a deluge of memes, the communitycrystallized and started developing a proper roadmap. Since then, the project has donated over$100,000 to a penguin charity and made headlines for newspapers like the New York Times.
Pudgy PenguinsJuly 2021
Loot is a series of 8,000 NFTs that was created by Dom Hoffman, co-founder of Vine. Unlike any otherproject before, the collection was designed to be a social experiment. Rather than any image or plan,the entire project was meant to be community-driven and centered on fantasy-themed words ontop of a black background. As the project exploded, even VCs like Multicoin entered the foray.
Mutant Ape Yacht Club (MAYC) is a collection of 20,000 mutant apes that were created by the foundersof BAYC. Every BAYC Ape (total of 10,000) received a random serum based on three tiers (M1-M3) thatcould be used to mint a new Mutant Ape NFT. Each serum used creates an MAYC modelled after theoriginal Ape while another 10,000 randomized MAYCs went up for sale in a Dutch Auction.
4,714Holders
$122.9MTotal Sales Volume
4,237Holders
$138.8MTotal Sales Volume
2,373Holders
$250.0MTotal Sales Volume
8,951Holders
$276.7MTotal Sales Volume
Mutant Ape Yacht ClubAugust 2020
LootAugust 2021
$126.0MTotal Sales Volume
28
CoinGecko Q3 2021 Cryptocurrency Report
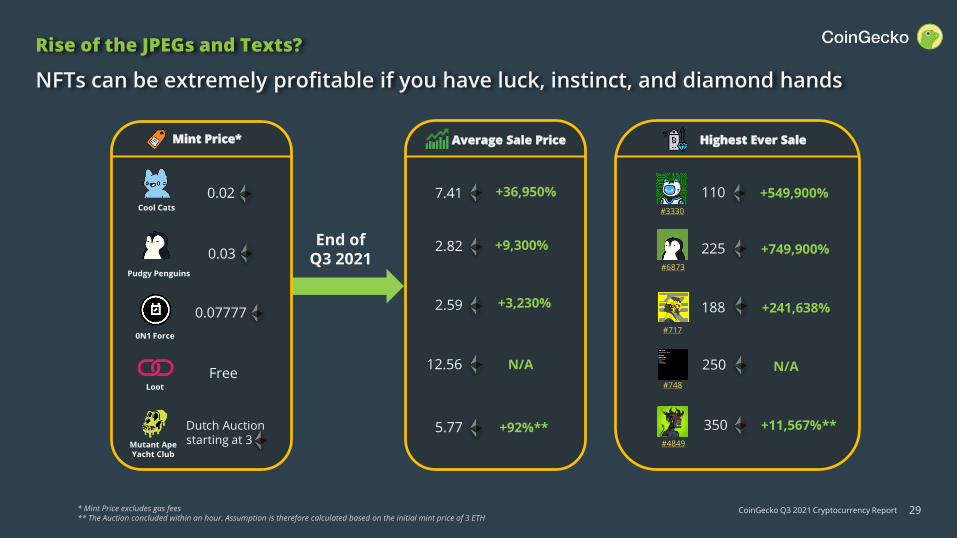
NFTs can be extremely profitable if you have luck, instinct, and diamond hands
Rise of the JPEGs and Texts?
* Mint Price excludes gas fees** The Auction concluded within an hour. Assumption is therefore calculated based on the initial mint price of 3 ETH
Mint Price*
0.02
End of Q3 20210.03
0.07777
Free
Dutch Auctionstarting at 3
Average Sale Price
2.82
5.77
7.41
2.59
12.56
+36,950%
N/A
+9,300%
+3,230%
+92%**
Highest Ever Sale
110
225
188
250
350
+549,900%
N/A
+749,900%
+241,638%
+11,567%**
#3330
#6873
#717
#748
#4849
Cool Cats
0N1 Force
Pudgy Penguins
Mutant Ape Yacht Club
Loot
29
CoinGecko Q3 2021 Cryptocurrency Report
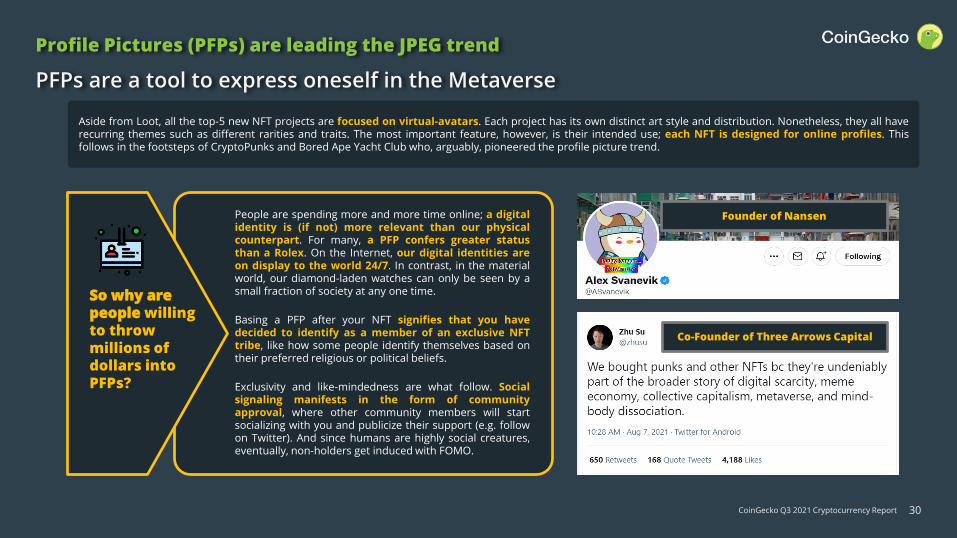
PFPs are a tool to express oneself in the Metaverse
Profile Pictures (PFPs) are leading the JPEG trend
People are spending more and more time online; a digitalidentity is (if not) more relevant than our physicalcounterpart. For many, a PFP confers greater statusthan a Rolex. On the Internet, our digital identities areon display to the world 24/7. In contrast, in the materialworld, our diamond-laden watches can only be seen by asmall fraction of society at any one time.
Basing a PFP after your NFT signifies that you havedecided to identify as a member of an exclusive NFTtribe, like how some people identify themselves based ontheir preferred religious or political beliefs.
Exclusivity and like-mindedness are what follow. Socialsignaling manifests in the form of communityapproval, where other community members will startsocializing with you and publicize their support (e.g. followon Twitter). And since humans are highly social creatures,eventually, non-holders get induced with FOMO.
So why are people willing to throw millions of dollars into PFPs?
Aside from Loot, all the top-5 new NFT projects are focused on virtual-avatars. Each project has its own distinct art style and distribution. Nonetheless, they all haverecurring themes such as different rarities and traits. The most important feature, however, is their intended use; each NFT is designed for online profiles. Thisfollows in the footsteps of CryptoPunks and Bored Ape Yacht Club who, arguably, pioneered the profile picture trend.
Co-Founder of Three Arrows Capital
Founder of Nansen
30
CoinGecko Q3 2021 Cryptocurrency Report
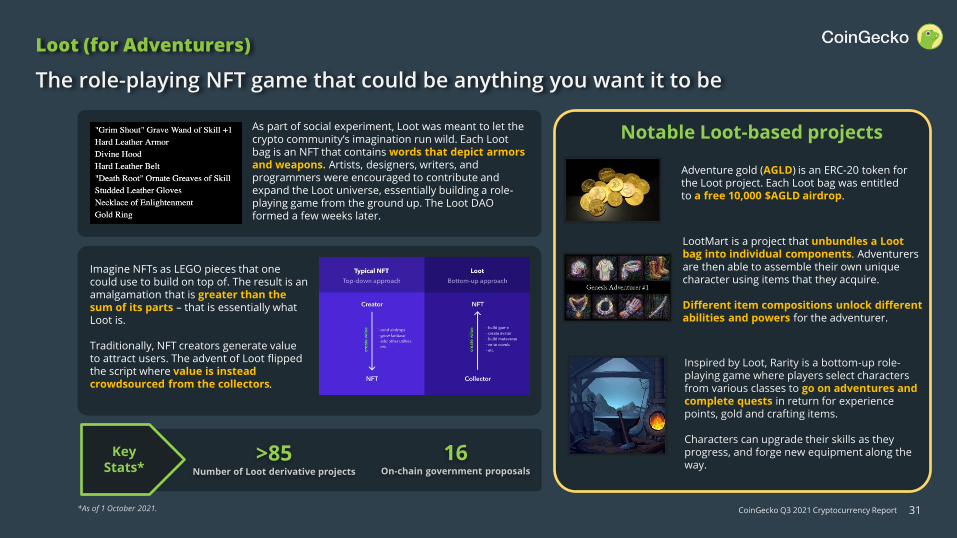
The role-playing NFT game that could be anything you want it to be
Loot (for Adventurers)
Notable Loot-based projects
Adventure gold (AGLD) is an ERC-20 token for the Loot project. Each Loot bag was entitled to a free 10,000 $AGLD airdrop.
LootMart is a project that unbundles a Loot bag into individual components. Adventurers are then able to assemble their own unique character using items that they acquire.
Different item compositions unlock different abilities and powers for the adventurer.
Inspired by Loot, Rarity is a bottom-up role-playing game where players select characters from various classes to go on adventures and complete quests in return for experience points, gold and crafting items.
Characters can upgrade their skills as they progress, and forge new equipment along the way.
As part of social experiment, Loot was meant to let the crypto community’s imagination run wild. Each Loot bag is an NFT that contains words that depict armorsand weapons. Artists, designers, writers, and programmers were encouraged to contribute and expand the Loot universe, essentially building a role-playing game from the ground up. The Loot DAO formed a few weeks later.
Imagine NFTs as LEGO pieces that one could use to build on top of. The result is an amalgamation that is greater than the sum of its parts – that is essentially what Loot is.
Traditionally, NFT creators generate value to attract users. The advent of Loot flipped the script where value is instead crowdsourced from the collectors.
Loot (for Adventurers)
Key Stats*
>85Number of Loot derivative projects
16On-chain government proposals
*As of 1 October 2021. 31

CoinGecko Q3 2021 Cryptocurrency Report 32
EXCHANGES

CoinGecko Q3 2021 Cryptocurrency Report
Overall, Q3 spot trading volume across the top-10 centralized and decentralized exchanges decreased from $6.74 trillion to $3.90 trillion (-42.17%).
Q3 2021 initially trended downwards but rebounded strongly in August 2021 to reach $1.3 trillion.
September’s trading volume for both CEXs and DEXs increased by 214.96% and 171.94% respectively as compared to July. However, both exchanges struggled to reclaim May’s all-time-high.
The DEX-CEX ratio has decreased from 10.44% in Q2 2021 to 8.74% in Q3 2021.
Q3 2021 Top-10 Cryptocurrency Exchanges
Data source: CoinGeckoTop-10 CEX as of 1 October 2021 – Binance, Huobi, Coinbase, Crypto.com, FTX, KuCoin, Gate.io, Kraken, Bitfinex, Gemini. Ranked by CoinGecko Q3 Top Cryptocurrency Exchanges RankingTop-10 DEX as of 1 October 2021 - Uniswap (v3), Uniswap (v2), PancakeSwap (v2), SushiSwap, Raydium, 1inch, Trader Joe, Curve, WaultSwap, QuickSwap
33
$1.30 $0.81 $1.37 $1.71$3.23$2.21Trading Vol.
$2.0T
$2.9T
$1.1T
$0.7T
$1.3T
$1.6T
$0.2T
$0.3T
$0.2T
$0.1T
$0.1T
$0.1T
$0.0T
$0.5T
$1.0T
$1.5T
$2.0T
$2.5T
$3.0T
$3.5T
Apr-21 May-21 Jun-21 Jul-21 Aug-21 Sep-21
Centralized Exchanges (CEXs) Decentralized Exchanges (DEXs)
Total Trading Volume ($ Trillion)
Total spot trading volume is still far from May’s highs
Top-10 DEX+CEX Trading Volume (Apr – Sep 2021)
-42%Top-10 (CEXs + DEXs) Total Trading
Volume Growth in Q3 2021 vs. Q2 2021

CoinGecko Q3 2021 Cryptocurrency Report 34
Top-10 CEX Trading Volume Dominance (Apr – Sep 2021)
Binance’s dominance shrinks as CEXs recorded a 41% drop in trading volume
Q3 2021 Top-10 Centralized Exchanges (CEX)
Binance’s dominance dipped from 62% in July to 54% in September amid increasing global regulatory scrutiny. However, Binance remains the top centralized exchange.
Top-10 centralized exchanges recorded a total of $3.58 trillion spot trading volume in Q3 2021. The quarter started with $0.74 trillion in July (-35% as compared to June), but recovered in August and September.
As China continued its crypto crackdown, Huobi’s dominance scaled back from 19% in Q2 to 13% in Q3, while its Q3 trading volume decreased by nearly 60% as compared to Q2.
-41% Top-10 CEXs Total Trading Volume Growth
in Q3 2021 vs. Q2 2021
62%56% 59% 62% 59%
54%
20%
19%17% 14%
14%
13%
6%9% 8% 8%
9%
10%
0%
10%
20%
30%
40%
50%
60%
70%
80%
90%
100%
Apr-21 May-21 Jun-21 Jul-21 Aug-21 Sep-21
Gemini
Bitfinex
Kraken
Gate.io
KuCoin
FTX
Crypto.com
Coinbase
Huobi
Binance
Total Trading Volume ($ Trillion)
$2.04 $2.92 $1.14 $0.74 $1.25 $1.59
Data source: CoinGeckoTop-10 CEX as of 1 October 2021 – Binance, Huobi, Coinbase, Crypto.com, FTX, KuCoin, Gate.io, Kraken, Bitfinex, Gemini
Dominance
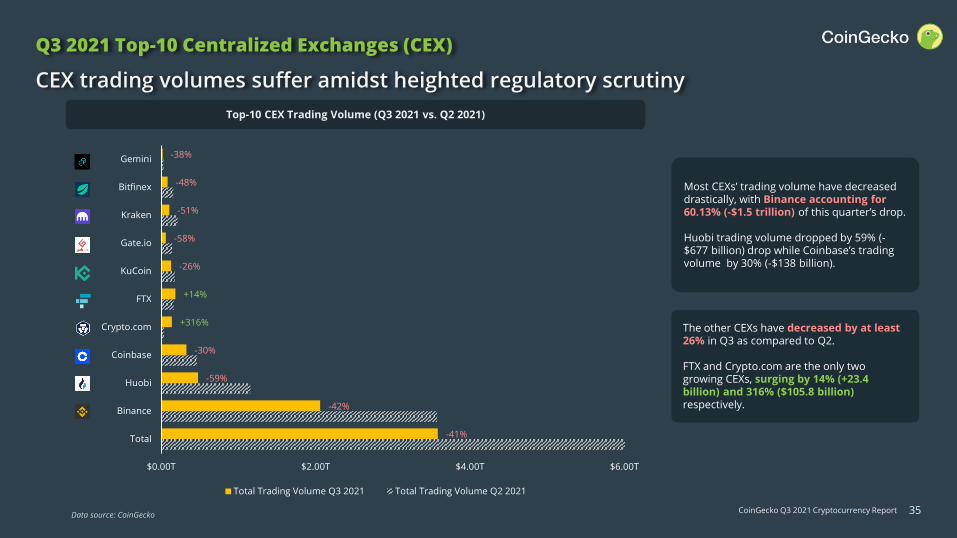
CoinGecko Q3 2021 Cryptocurrency Report 35
CEX trading volumes suffer amidst heighted regulatory scrutiny
Q3 2021 Top-10 Centralized Exchanges (CEX)
Most CEXs’ trading volume have decreased drastically, with Binance accounting for 60.13% (-$1.5 trillion) of this quarter’s drop.
Huobi trading volume dropped by 59% (-$677 billion) drop while Coinbase’s trading volume by 30% (-$138 billion).
The other CEXs have decreased by at least 26% in Q3 as compared to Q2.
FTX and Crypto.com are the only two growing CEXs, surging by 14% (+23.4 billion) and 316% ($105.8 billion) respectively.
-41%
-42%
-59%
-30%
+316%
+14%
-26%
-58%
-51%
-48%
-38%
$0.00T $2.00T $4.00T $6.00T
Total
Binance
Huobi
Coinbase
Crypto.com
FTX
KuCoin
Gate.io
Kraken
Bitfinex
Gemini
Total Trading Volume Q3 2021 Total Trading Volume Q2 2021
Top-10 CEX Trading Volume (Q3 2021 vs. Q2 2021)
Data source: CoinGecko

CoinGecko Q3 2021 Cryptocurrency Report 36
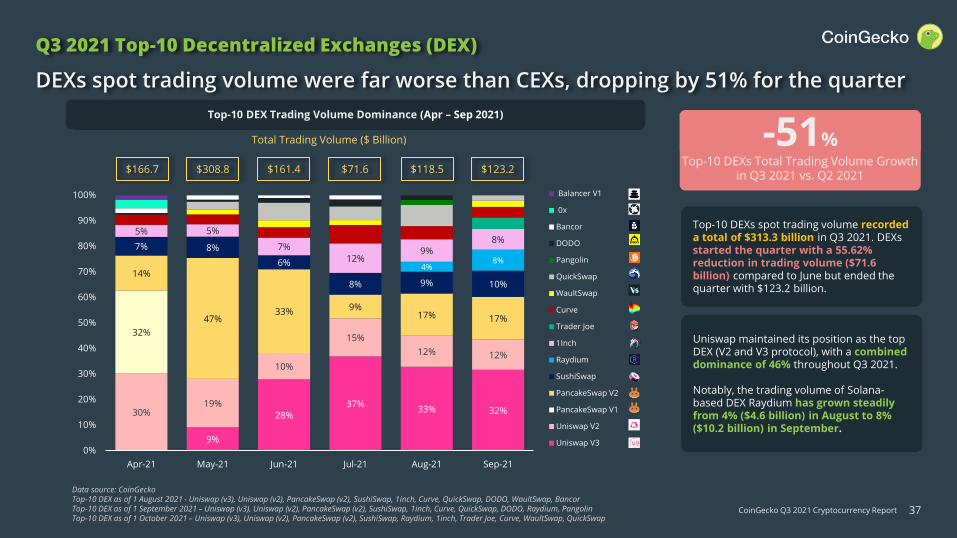
Non-Ethereum-based DEXs carve their way to the top
Q3 2021 Top-10 Decentralized Exchanges (DEX)
July August September
1 Uniswap (v3) Uniswap (v3) Uniswap (v3)
2 Uniswap (v2) PancakeSwap (v2) PancakeSwap (v2)
3 PancakeSwap (v2) Uniswap (v2) Uniswap (v2)
4 1inch 1inch SushiSwap
5 SushiSwap SushiSwap Raydium
6 Curve QuickSwap 1inch
7 QuickSwap Curve Trader Joe
8 DODO Raydium Curve
9 WaultSwap Pangolin WaultSwap
10 Bancor DODO QuickSwap
The ranking of the Top-10 decentralized exchanges is rebalanced in August and September to show the entry of Solana-based and Avalanche-based exchanges into the Top-10 ranking.
The entrance of Raydium, Trader Joe, and Pangolin into the top-10 DEXs list in Q2 2021 may signal that traders favor DEXs with low latency and costs over the other DEXs that reside on chains with higher transaction fees.
In August, Bancor and WaultSwap were replaced by Avalanche-based Pangolin and Solana-based Raydium, with both of the latter overtaking the trading volume of DODO.
However, Pangolin fell out of the top-10 in September 2021 as traders began flocking to Trader Joe as an alternative.
Data source: CoinGecko
CoinGecko Q3 2021 Cryptocurrency Report 37
Total Trading Volume ($ Billion)
Top-10 DEXs spot trading volume recorded a total of $313.3 billion in Q3 2021. DEXs started the quarter with a 55.62%reduction in trading volume ($71.6 billion) compared to June but ended the quarter with $123.2 billion.
Uniswap maintained its position as the top DEX (V2 and V3 protocol), with a combined dominance of 46% throughout Q3 2021.
Notably, the trading volume of Solana-based DEX Raydium has grown steadily from 4% ($4.6 billion) in August to 8% ($10.2 billion) in September.
DEXs spot trading volume were far worse than CEXs, dropping by 51% for the quarter
Q3 2021 Top-10 Decentralized Exchanges (DEX)
Data source: CoinGeckoTop-10 DEX as of 1 August 2021 - Uniswap (v3), Uniswap (v2), PancakeSwap (v2), SushiSwap, 1inch, Curve, QuickSwap, DODO, WaultSwap, BancorTop-10 DEX as of 1 September 2021 – Uniswap (v3), Uniswap (v2), PancakeSwap (v2), SushiSwap, 1inch, Curve, QuickSwap, DODO, Raydium, PangolinTop-10 DEX as of 1 October 2021 – Uniswap (v3), Uniswap (v2), PancakeSwap (v2), SushiSwap, Raydium, 1inch, Trader Joe, Curve, WaultSwap, QuickSwap
9%
28%37%
33% 32%30%19%
10%
15%
12% 12%
32%
14%
47%33% 9%
17% 17%
7% 8%
6%
8% 9% 10%
4%8%
5% 5%
7%
12%9%
8%
0%
10%
20%
30%
40%
50%
60%
70%
80%
90%
100%
Apr-21 May-21 Jun-21 Jul-21 Aug-21 Sep-21
Balancer V1
0x
Bancor
DODO
Pangolin
QuickSwap
WaultSwap
Curve
Trader Joe
1Inch
Raydium
SushiSwap
PancakeSwap V2
PancakeSwap V1
Uniswap V2
Uniswap V3
$166.7 $123.2$308.8 $161.4 $71.6 $118.5
Top-10 DEX Trading Volume Dominance (Apr – Sep 2021)
-51% Top-10 DEXs Total Trading Volume Growth
in Q3 2021 vs. Q2 2021
Top-10 DEX Trading Volume Dominance (Apr – Sep 2021)

CoinGecko Q3 2021 Cryptocurrency Report
44%50%
58% 59% 57% 54%
17%
14%
13%15% 16%
15%
18%16%
11%9%
8%9%
7% 7% 6% 6% 7%8%
6% 6% 5% 3% 3% 4%
6% 4% 3% 6% 6% 7%
0%
10%
20%
30%
40%
50%
60%
70%
80%
90%
100%
Apr-21 May-21 Jun-21 Jul-21 Aug-21 Sep-21
Bitfinex
Kucoin
Deribit
OKEx
Bitmex
FTX
Huobi
Bybit
Binance
Bitcoin perpetual swaps trading volume across the top-9 derivative exchanges saw a net decrease of approximately 25% to $1.37 trillion.
BTC perpetual swaps trading volume reduced to just over $4 trillion
Q3 2021 Derivatives Exchanges – Bitcoin Perpetual Swaps Volume
38
$1.83
Although the top 3 dominant exchanges saw little change in volume throughout Q3, trading volume on other exchanges surged. Kucoin and Bitmex recorded a 59% and 47% increase respectively.
In terms of dominance, Binance continues to lead the pack, although it is starting to lose some ground. FTX, Bitmex and OKEX continue to increase their dominance ever so slightly.
Total Trading Volume ($ Trillion)
Data source: CoinGeckoTop-9 Derivative Exchanges for Bitcoin Perpetual Swaps as of 1 October 2021 – Binance, FTX, Bybit, Huobi, OKEx, Bitfinex, Kucoin, Deribit, BitMEX
$1.96$1.47 $1.27 $1.45 $1.37
Aggregate Monthly Bitcoin Perpetual Trading Volume Dominance (Apr – Sep 2021)
-25% Top-9 Bitcoin Perpetual Swap
Trading Volume Growth in Q3 2021

CoinGecko Q3 2021 Cryptocurrency Report
25%29%
35% 35% 33% 31%
27%23%
20% 19%18% 19%
16% 14%12% 13% 18% 18%
8%8% 8% 7% 7% 6%
7%7% 6% 5% 6% 6%
6% 7% 6%5%
6% 6%
6% 6% 5%6% 5% 5%
4% 4%4% 5% 5% 5%
0%
10%
20%
30%
40%
50%
60%
70%
80%
90%
100%
Apr-21 May-21 Jun-21 Jul-21 Aug-21 Sep-21
Kucoin
OKEx
Huobi
Bitfinex
Deribit
Bitmex
FTX
Bybit
Binance
FTX gains significant ground in the Open Interest (OI) battle
Q3 2021 Derivatives Exchanges – Bitcoin Perpetual Swaps Open Interest
39
$358 $259 $209
Bitcoin perpetual swaps open interest (OI) across top-9 derivative exchanges recorded a total of $867 billion ending September 2021.
Open Interest saw a net decrease by 50% to $313 billion in Q3 2021.
FTX (32%), Binance (21%), and Bybit (19%) accounted for 72% ($74 billion) of the net growth in Q3.
In a similar trend to trading volume, Binance’sopen interest dominance decreased from 35% to 31%, while FTX increased its dominance by 5%.
Open interest on FTX has increased by a whopping 133% since Q2 2021.
Total Open Interest ($ Billion)
Data source: CoinGeckoTop-9 Derivative Exchanges for Bitcoin Perpetual Swaps as of 1 October 2021 – Binance, FTX, Bybit, Huobi, OKEx, Bitfinex, Kucoin, Deribit, BitMEX
$236 $313$318
Aggregate Monthly Bitcoin Perpetual OI Dominance (Apr – Sep 2021)
+50% Top-9 Bitcoin Perpetual Swap
Open Interest Growth in Q3 2021
CoinGecko Q3 2021 Cryptocurrency Report 40
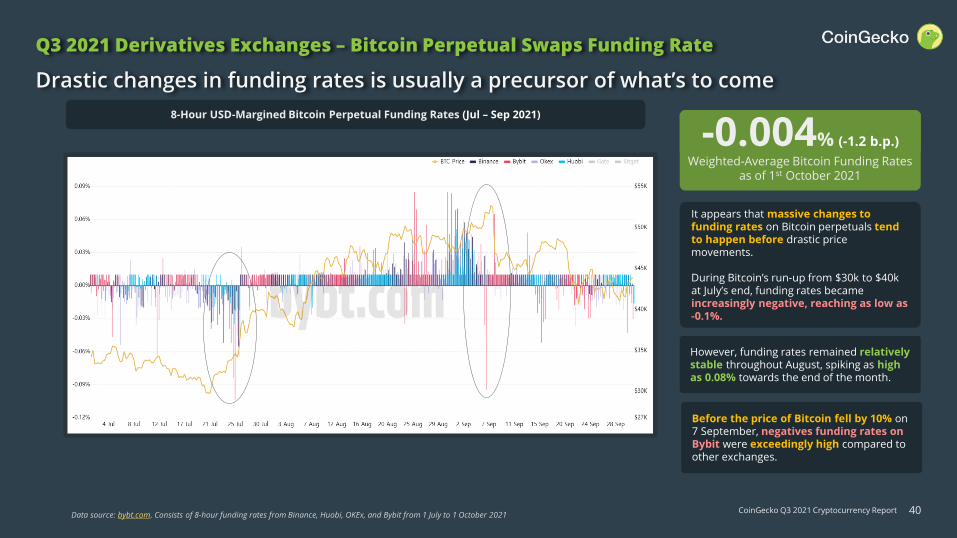
Q3 2021 Derivatives Exchanges – Bitcoin Perpetual Swaps Funding Rate
Drastic changes in funding rates is usually a precursor of what’s to come
Data source: bybt.com. Consists of 8-hour funding rates from Binance, Huobi, OKEx, and Bybit from 1 July to 1 October 2021
It appears that massive changes to funding rates on Bitcoin perpetuals tend to happen before drastic price movements.
During Bitcoin’s run-up from $30k to $40k at July’s end, funding rates became increasingly negative, reaching as low as -0.1%.
However, funding rates remained relatively stable throughout August, spiking as high as 0.08% towards the end of the month.
Before the price of Bitcoin fell by 10% on 7 September, negatives funding rates on Bybit were exceedingly high compared to other exchanges.
-0.004% (-1.2 b.p.)
Weighted-Average Bitcoin Funding Rates as of 1st October 2021
8-Hour USD-Margined Bitcoin Perpetual Funding Rates (Jul – Sep 2021)

CoinGecko Q3 2021 Cryptocurrency Report 41
CoinGecko Highlights
CoinGecko Q3 2021 Cryptocurrency Report 42
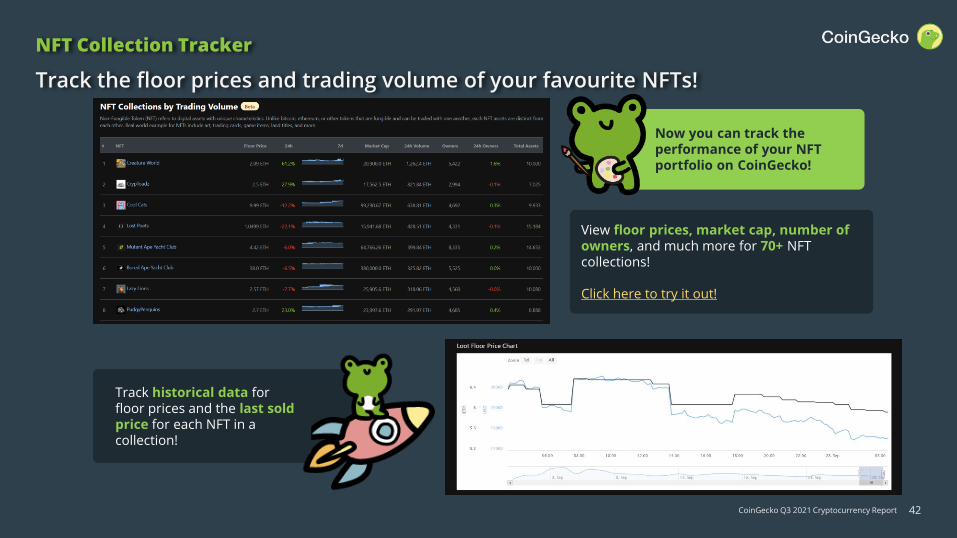
NFT Collection Tracker
Track the floor prices and trading volume of your favourite NFTs!
View floor prices, market cap, number of owners, and much more for 70+ NFT collections!
Click here to try it out!
Now you can track the performance of your NFT portfolio on CoinGecko!
Track historical data for floor prices and the last sold price for each NFT in a collection!

CoinGecko Q3 2021 Cryptocurrency Report 43
GeckoCon – NFTs Gone Wild
Our first conference ever – and its going to be huge!
NFTs Gone Wild brings together key minds and voices of the NFT space to enlighten enthusiasts on the now and future of all things non-fungible.
Join us as we cover a wide range of NFT-related topics from art, music, collectables, gaming, sports, monetization and more!
To top it off, GeckoCon will bring you Otherworldly activities showcasing DJs from around the world in our Afterparties, and powwows in the Metaverse.
Meet Our Speakers
And many more….

CoinGecko Q3 2021 Cryptocurrency Report
FOLLOW US
44

CoinGecko Q3 2021 Cryptocurrency Report
THAT’S ALL! THANK YOU FOR READING :)Take a 1-minute survey and let us know how you feel!
45