q3 2015production (boe/d) - acumen capital exploration perpetual energy northern blizzard nuvista...
TRANSCRIPT

The following charts summarize the Q3/15 results of the Canadian Intermediate and Junior E&P universe. We breakout comps
by production, with Intermediate’s producing between 10,000-175,000 boe/d and Junior’s producing less than 10,000 boe/d.
Information used is a historical snapshot as of quarter end, and doesn't take into account subsequent financings or M&A.
Trevor Reynolds | Oil & Gas Research Analyst | (403) 410-6842 | [email protected]
Mike McMeeken | Research Associate | (403) 571-0530 | [email protected]
ACUMEN CAPITAL FINANCE PARTNERS LIMITED | SUITE 700 – 404 – 6th AVENUE SW | CALGARY, AB | T2P 0R9
MAIN PHONE: 403.571.0300 | TOLL FREE: 1.888.422.8636
December 3, 2015 ACUMEN CAPITAL | RESEARCH
IDEAS. GROWTH. OPPORTUNITY.
Intermediate Charts:
Source: Company Reports, Acumen Capital
*Figures Subject to Rounding
ACU-DATA: Q3/15 OIL & GAS COMPARABLES
11,000
11,219
12,504
13,129
13,418
13,523
15,523
16,303
16,773
17,709
18,695
19,758
20,445
21,367
24,808
25,090
30,255
30,734
38,433
40,277
41,821
49,990
60,600
74,238
78,599
81,208
82,170
82,198
107,261
110,794
150,298
172,579
0 20,000 40,000 60,000 80,000 100,000 120,000 140,000 160,000 180,000
RMP Energy
Cardinal Energy
Pine Cliff Energy
Bonterra Energy
Raging River Exploration
Surge Energy
Painted Pony Petroleum
Twin Butte Energy
Crew Energy
TORC O&G
Kelt Exploration
Perpetual Energy
Northern Blizzard
NuVista Energy
Advantage Oil & Gas
Trilogy Energy
Lightstream Resources
Long Run Exploration
Birchcliff Energy
Bellatrix Exploration
Whitecap Resources
Paramount Resources
Seven Generations
Pengrowth Energy
Bonavista Energy
Peyto Exploration
Baytex Energy
Penn West Exploration
ARC Resources
Enerplus Corp
Tourmaline Oil Corp
Crescent Point Energy
Q3 2015Production (boe/d)Median: 27,672 boe/d

December 3, 2015 ACUMEN CAPITAL | RESEARCH
IDEAS. GROWTH. OPPORTUNITY.
Page 2 of 31
Trevor Reynolds | Oil & Gas Research Analyst| (403) 410-6842| [email protected] Mike McMeeken | Research Associate| (403) 571-0530| [email protected]
Acumen Capital Finance Partners Limited #700, 404 – 6 Avenue SW | Calgary, AB | T2P 0R9| Main Phone: 403-571-0300
1%
5%
6%
7%
11%
13%
13%
30%
30%
31%
34%
35%
36%
38%
39%
40%
45%
48%
60%
61%
67%
71%
76%
76%
81%
83%
88%
88%
90%
92%
96%
97%
0% 10% 20% 30% 40% 50% 60% 70% 80% 90% 100%
Advantage Oil & Gas
Painted Pony Petroleum
Pine Cliff Energy
Peyto Exploration
Perpetual Energy
Tourmaline Oil Corp
Birchcliff Energy
NuVista Energy
Bellatrix Exploration
Bonavista Energy
ARC Resources
Kelt Exploration
Trilogy Energy
Crew Energy
Paramount Resources
Long Run Exploration
Enerplus Corp
RMP Energy
Pengrowth Energy
Seven Generations
Penn West Exploration
Lightstream Resources
Bonterra Energy
Whitecap Resources
Baytex Energy
Surge Energy
TORC O&G
Twin Butte Energy
Crescent Point Energy
Cardinal Energy
Northern Blizzard
Raging River Exploration
Q3/15 Production Mix - Oil & NGL Weighting (%)Median: 42%

December 3, 2015 ACUMEN CAPITAL | RESEARCH
IDEAS. GROWTH. OPPORTUNITY.
Page 3 of 31
Trevor Reynolds | Oil & Gas Research Analyst| (403) 410-6842| [email protected] Mike McMeeken | Research Associate| (403) 571-0530| [email protected]
Acumen Capital Finance Partners Limited #700, 404 – 6 Avenue SW | Calgary, AB | T2P 0R9| Main Phone: 403-571-0300
5.95
7.10
7.92
9.31
9.84
10.89
11.00
11.30
11.72
11.98
12.99
13.10
13.32
13.35
13.57
15.05
15.08
15.20
15.50
15.56
15.57
16.10
16.14
16.45
17.68
21.71
22.14
23.55
24.15
28.06
29.77
36.42
$0.00 $5.00 $10.00 $15.00 $20.00 $25.00 $30.00 $35.00 $40.00
Painted Pony Petroleum
Perpetual Energy
Pine Cliff Energy
Enerplus Corp
Crew Energy
Penn West Exploration
Bonavista Energy
Long Run Exploration
Bellatrix Exploration
Kelt Exploration
Twin Butte Energy
Pengrowth Energy
Advantage Oil & Gas
NuVista Energy
Paramount Resources
Tourmaline Oil Corp
Surge Energy
Trilogy Energy
Birchcliff Energy
Cardinal Energy
Baytex Energy
ARC Resources
Peyto Exploration
Seven Generations
Northern Blizzard
TORC O&G
Lightstream Resources
Crescent Point Energy
Whitecap Resources
Bonterra Energy
RMP Energy
Raging River Exploration
Q3/15 Field Netback ($/boe)Median: $15.07/boe
Formula:Revenue less: Royalties, Operating & Transportation Exp
Total Production in the Period

December 3, 2015 ACUMEN CAPITAL | RESEARCH
IDEAS. GROWTH. OPPORTUNITY.
Page 4 of 31
Trevor Reynolds | Oil & Gas Research Analyst| (403) 410-6842| [email protected] Mike McMeeken | Research Associate| (403) 571-0530| [email protected]
Acumen Capital Finance Partners Limited #700, 404 – 6 Avenue SW | Calgary, AB | T2P 0R9| Main Phone: 403-571-0300
5.41
6.52
6.85
8.00
9.20
9.57
9.83
9.91
11.18
12.59
12.61
12.92
13.41
14.94
15.95
16.03
16.56
16.97
17.31
17.56
17.98
18.18
20.76
20.95
22.60
23.84
27.99
30.16
30.40
35.33
-$5.00 $0.00 $5.00 $10.00 $15.00 $20.00 $25.00 $30.00 $35.00 $40.00
Penn West Exploration
Pine Cliff Energy
Bellatrix Exploration
Paramount Resources
Kelt Exploration
Trilogy Energy
Bonavista Energy
Enerplus Corp
Crew Energy
Long Run Exploration
Birchcliff Energy
Surge Energy
Baytex Energy
Advantage Oil & Gas
NuVista Energy
Lightstream Resources
Seven Generations
Tourmaline Oil Corp
ARC Resources
Pengrowth Energy
Peyto Exploration
Northern Blizzard
TORC O&G
Twin Butte Energy
Cardinal Energy
Bonterra Energy
RMP Energy
Whitecap Resources
Crescent Point Energy
Raging River Exploration
Q3/15 Corporate Netbacks with Hedging Breakdown ($/boe)Netback Median: $15.45/boe Hedging Median: $3.31/boe
Formula:Operating Netback Less: G&A & Interest Exp
Tota l Production in the Period
Corporate Netback
Hedging Netback
Not Shown:Perpetual Energy:Corp Netback -$1.14/boe
Hedging Netback -$1.24/boe

December 3, 2015 ACUMEN CAPITAL | RESEARCH
IDEAS. GROWTH. OPPORTUNITY.
Page 5 of 31
Trevor Reynolds | Oil & Gas Research Analyst| (403) 410-6842| [email protected] Mike McMeeken | Research Associate| (403) 571-0530| [email protected]
Acumen Capital Finance Partners Limited #700, 404 – 6 Avenue SW | Calgary, AB | T2P 0R9| Main Phone: 403-571-0300
-5%
-2%
-1%
0%
0%
0%
2%
3%
13%
14%
14%
17%
19%
21%
23%
23%
25%
32%
36%
36%
38%
38%
51%
52%
54%
55%
55%
55%
58%
63%
71%
-10% 0% 10% 20% 30% 40% 50% 60% 70% 80%
Kelt Exploration
Bellatrix Exploration
Trilogy Energy
Pine Cliff Energy
Birchcliff Energy
Bonterra Energy
Raging River Exploration
RMP Energy
Surge Energy
Painted Pony Petroleum
TORC O&G
Peyto Exploration
Tourmaline Oil Corp
Paramount Resources
ARC Resources
Advantage Oil & Gas
Baytex Energy
Whitecap Resources
NuVista Energy
Crescent Point Energy
Northern Blizzard
Seven Generations
Cardinal Energy
Penn West Exploration
Enerplus Corp
Bonavista Energy
Lightstream Resources
Crew Energy
Long Run Exploration
Twin Butte Energy
Pengrowth Energy
Q3/15 Hedging Gains as a % of Corporate NetbacksMedian: 23%

December 3, 2015 ACUMEN CAPITAL | RESEARCH
IDEAS. GROWTH. OPPORTUNITY.
Page 6 of 31
Trevor Reynolds | Oil & Gas Research Analyst| (403) 410-6842| [email protected] Mike McMeeken | Research Associate| (403) 571-0530| [email protected]
Acumen Capital Finance Partners Limited #700, 404 – 6 Avenue SW | Calgary, AB | T2P 0R9| Main Phone: 403-571-0300
2.16
2.64
6.49
6.83
7.23
7.74
7.81
8.72
8.96
9.62
9.84
9.90
10.38
10.45
10.51
11.03
11.52
11.72
11.77
11.79
12.03
12.06
12.76
13.71
15.12
15.18
15.25
15.60
18.27
20.15
20.60
22.44
$0.00 $5.00 $10.00 $15.00 $20.00 $25.00
Advantage Oil & Gas
Peyto Exploration
Tourmaline Oil Corp
Birchcliff Energy
Seven Generations
Bonavista Energy
Painted Pony Petroleum
Bellatrix Exploration
Pine Cliff Energy
ARC Resources
Perpetual Energy
Paramount Resources
Crew Energy
RMP Energy
Raging River Exploration
Whitecap Resources
Trilogy Energy
Enerplus Corp
Baytex Energy
Kelt Exploration
Long Run Exploration
Bonterra Energy
Lightstream Resources
NuVista Energy
Pengrowth Energy
Crescent Point Energy
Surge Energy
TORC O&G
Northern Blizzard
Twin Butte Energy
Cardinal Energy
Penn West Exploration
Q3/15 Operating & Transportation Expenses ($/boe)Median: $11.27/boe
Formula:Operating and Transportation Expenses
Tota l Production in the Period

December 3, 2015 ACUMEN CAPITAL | RESEARCH
IDEAS. GROWTH. OPPORTUNITY.
Page 7 of 31
Trevor Reynolds | Oil & Gas Research Analyst| (403) 410-6842| [email protected] Mike McMeeken | Research Associate| (403) 571-0530| [email protected]
Acumen Capital Finance Partners Limited #700, 404 – 6 Avenue SW | Calgary, AB | T2P 0R9| Main Phone: 403-571-0300
0.11
0.56
0.66
0.82
0.97
0.98
1.08
1.18
1.19
1.21
1.34
1.41
1.43
1.45
1.57
1.59
1.62
1.70
1.73
1.76
1.85
2.06
2.21
2.24
2.29
2.37
2.43
2.53
2.71
3.02
3.55
3.75
$0.00 $0.50 $1.00 $1.50 $2.00 $2.50 $3.00 $3.50 $4.00
Peyto Exploration
Tourmaline Oil Corp
Advantage Oil & Gas
Kelt Exploration
Paramount Resources
Seven Generations
Pine Cliff Energy
Raging River Exploration
Birchcliff Energy
Bonavista Energy
Bellatrix Exploration
Whitecap Resources
ARC Resources
Trilogy Energy
Painted Pony Petroleum
Bonterra Energy
RMP Energy
Crescent Point Energy
TORC O&G
Surge Energy
Baytex Energy
Crew Energy
Twin Butte Energy
Enerplus Corp
Northern Blizzard
Perpetual Energy
NuVista Energy
Cardinal Energy
Long Run Exploration
Penn West Exploration
Lightstream Resources
Pengrowth Energy
Q3/15 G&A Expense ($/boe)Median: $1.61/boe

December 3, 2015 ACUMEN CAPITAL | RESEARCH
IDEAS. GROWTH. OPPORTUNITY.
Page 8 of 31
Trevor Reynolds | Oil & Gas Research Analyst| (403) 410-6842| [email protected] Mike McMeeken | Research Associate| (403) 571-0530| [email protected]
Acumen Capital Finance Partners Limited #700, 404 – 6 Avenue SW | Calgary, AB | T2P 0R9| Main Phone: 403-571-0300
7.63
9.82
10.26
10.37
11.70
11.81
12.35
12.69
12.90
13.64
14.82
14.83
15.13
17.13
17.69
18.53
18.55
19.23
19.46
20.38
21.40
21.50
21.56
21.75
22.01
22.19
23.09
26.13
26.73
28.99
30.25
$0.00 $5.00 $10.00 $15.00 $20.00 $25.00 $30.00 $35.00
Painted Pony Petroleum
Birchcliff Energy
Peyto Exploration
Advantage Oil & Gas
Tourmaline Oil Corp
Bellatrix Exploration
Bonavista Energy
Perpetual Energy
Enerplus Corp
Seven Generations
NuVista Energy
ARC Resources
Crew Energy
Pine Cliff Energy
Pengrowth Energy
Trilogy Energy
Northern Blizzard
Long Run Exploration
Surge Energy
Penn West Exploration
Twin Butte Energy
Baytex Energy
Cardinal Energy
Kelt Exploration
Bonterra Energy
Whitecap Resources
Raging River Exploration
TORC O&G
Paramount Resources
Lightstream Resources
Crescent Point Energy
Q3/15 Depletion, Depreciation & Accretion Expenses ($/boe)Median: $18.54/boe
Formula:Depletion, Depreciation & Accretion Expenses
Tota l Production in the Period
*Not including impairment charges

December 3, 2015 ACUMEN CAPITAL | RESEARCH
IDEAS. GROWTH. OPPORTUNITY.
Page 9 of 31
Trevor Reynolds | Oil & Gas Research Analyst| (403) 410-6842| [email protected] Mike McMeeken | Research Associate| (403) 571-0530| [email protected]
Acumen Capital Finance Partners Limited #700, 404 – 6 Avenue SW | Calgary, AB | T2P 0R9| Main Phone: 403-571-0300
11,554
23,089
23,376
23,416
23,692
23,774
28,877
29,015
32,739
33,168
33,882
37,928
38,388
38,733
41,508
47,177
49,632
50,700
50,801
51,804
55,229
55,618
59,918
60,456
65,718
67,633
73,717
75,406
81,560
83,110
101,966
136,865
$0 $20,000 $40,000 $60,000 $80,000 $100,000 $120,000 $140,000
Perpetual Energy
Pine Cliff Energy
Long Run Exploration
Bonavista Energy
Twin Butte Energy
Enerplus Corp
RMP Energy
Bellatrix Exploration
Penn West Exploration
Painted Pony Petroleum
Pengrowth Energy
Baytex Energy
Birchcliff Energy
NuVista Energy
Northern Blizzard
Tourmaline Oil Corp
Kelt Exploration
Crew Energy
Trilogy Energy
Surge Energy
Lightstream Resources
Paramount Resources
Cardinal Energy
Advantage Oil & Gas
Peyto Exploration
ARC Resources
TORC O&G
Crescent Point Energy
Seven Generations
Bonterra Energy
Whitecap Resources
Raging River Exploration
Q3/15 Production Multiples ($/boe/d)EV/boe/d Median: $48,404/boe MC/boe/d Median: $26,441/boe
Definition:The blue bars show the company's enterprise value in
relation to Q3 production. The red bars indicate the market capi talization to Q3 production. The difference between the two bars is the comapny's net debt.
Formula:Market Cap + Net Debt
Average Production in BOE
Note: Share price at close on November 30, 2015

December 3, 2015 ACUMEN CAPITAL | RESEARCH
IDEAS. GROWTH. OPPORTUNITY.
Page 10 of 31
Trevor Reynolds | Oil & Gas Research Analyst| (403) 410-6842| [email protected] Mike McMeeken | Research Associate| (403) 571-0530| [email protected]
Acumen Capital Finance Partners Limited #700, 404 – 6 Avenue SW | Calgary, AB | T2P 0R9| Main Phone: 403-571-0300
2.9x
4.7x
4.8x
5.1x
5.2x
5.4x
5.5x
6.5x
6.7x
6.8x
7.4x
8.3x
9.0x
9.2x
9.3x
9.4x
9.5x
9.6x
9.9x
10.3x
10.4x
10.5x
10.9x
11.0x
12.3x
13.0x
14.0x
14.4x
15.0x
18.2x
18.8x
0.0x 2.0x 4.0x 6.0x 8.0x 10.0x 12.0x 14.0x 16.0x 18.0x 20.0x
Twin Butte Energy
RMP Energy
Bonavista Energy
Long Run Exploration
Pengrowth Energy
Enerplus Corp
Northern Blizzard
NuVista Energy
Crescent Point Energy
Cardinal Energy
Baytex Energy
Birchcliff Energy
Tourmaline Oil Corp
Whitecap Resources
TORC O&G
Lightstream Resources
Bonterra Energy
Pine Cliff Energy
Peyto Exploration
Surge Energy
ARC Resources
Raging River Exploration
Advantage Oil & Gas
Bellatrix Exploration
Crew Energy
Seven Generations
Kelt Exploration
Trilogy Energy
Penn West Exploration
Painted Pony Petroleum
Paramount Resources
Annualized Q3/15 Cash Flow MultiplesEnterprise Value/CF Median: 9.4x Market Cap/CF Median: 6.3x
Definition:The blue bars show the company's enterprise value in
relation to annualized cash flow. The red bars indicate the market capitalization to annualized cash flow. The difference between the two bars i s the comapny's net debt.
Formula:Enterprise Value
Cash Flow for Period x 4
Note: Share price at close on November 30, 2015
Annualized CF Multiple (Not Shown):Perpetual EnergyEV/CF: -22.7x
MC/CF: -3.5x
December 3, 2015 ACUMEN CAPITAL | RESEARCH
IDEAS. GROWTH. OPPORTUNITY.
Page 11 of 31
Trevor Reynolds | Oil & Gas Research Analyst| (403) 410-6842| [email protected] Mike McMeeken | Research Associate| (403) 571-0530| [email protected]
Acumen Capital Finance Partners Limited #700, 404 – 6 Avenue SW | Calgary, AB | T2P 0R9| Main Phone: 403-571-0300
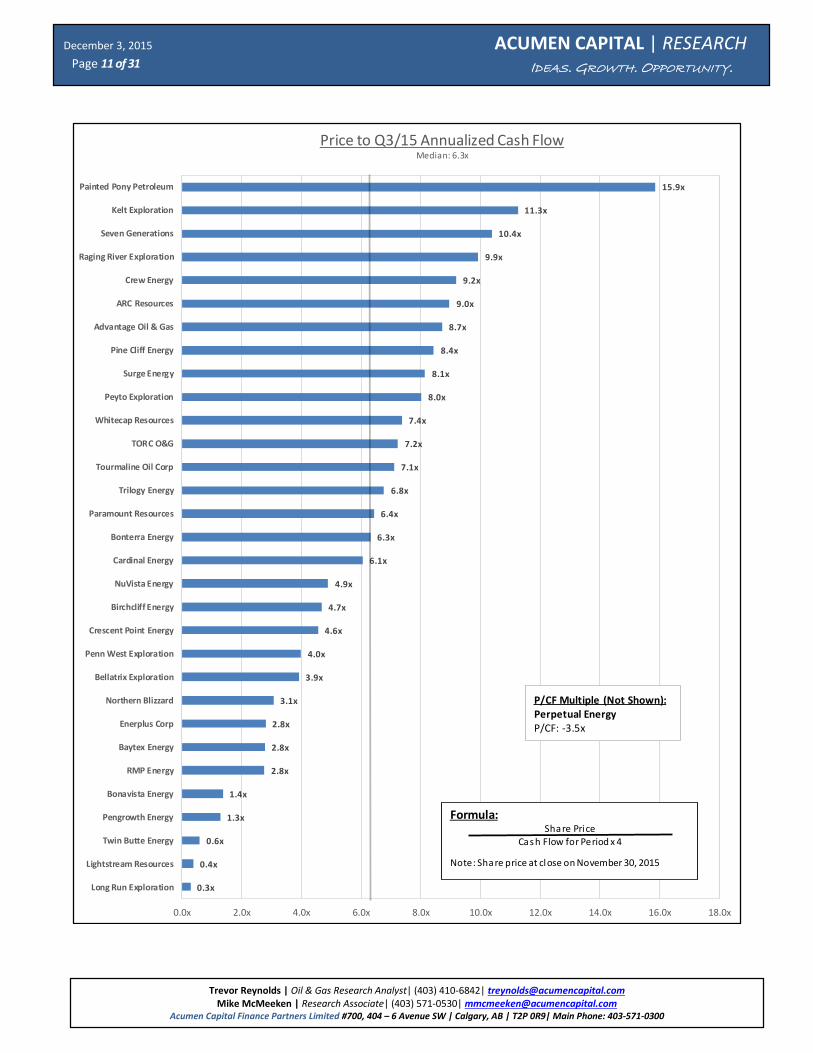
0.3x
0.4x
0.6x
1.3x
1.4x
2.8x
2.8x
2.8x
3.1x
3.9x
4.0x
4.6x
4.7x
4.9x
6.1x
6.3x
6.4x
6.8x
7.1x
7.2x
7.4x
8.0x
8.1x
8.4x
8.7x
9.0x
9.2x
9.9x
10.4x
11.3x
15.9x
0.0x 2.0x 4.0x 6.0x 8.0x 10.0x 12.0x 14.0x 16.0x 18.0x
Long Run Exploration
Lightstream Resources
Twin Butte Energy
Pengrowth Energy
Bonavista Energy
RMP Energy
Baytex Energy
Enerplus Corp
Northern Blizzard
Bellatrix Exploration
Penn West Exploration
Crescent Point Energy
Birchcliff Energy
NuVista Energy
Cardinal Energy
Bonterra Energy
Paramount Resources
Trilogy Energy
Tourmaline Oil Corp
TORC O&G
Whitecap Resources
Peyto Exploration
Surge Energy
Pine Cliff Energy
Advantage Oil & Gas
ARC Resources
Crew Energy
Raging River Exploration
Seven Generations
Kelt Exploration
Painted Pony Petroleum
Price to Q3/15 Annualized Cash FlowMedian: 6.3x
Formula:Share Price
Cash Flow for Period x 4
Note: Share price at close on November 30, 2015
P/CF Multiple (Not Shown):Perpetual EnergyP/CF: -3.5x

December 3, 2015 ACUMEN CAPITAL | RESEARCH
IDEAS. GROWTH. OPPORTUNITY.
Page 12 of 31
Trevor Reynolds | Oil & Gas Research Analyst| (403) 410-6842| [email protected] Mike McMeeken | Research Associate| (403) 571-0530| [email protected]
Acumen Capital Finance Partners Limited #700, 404 – 6 Avenue SW | Calgary, AB | T2P 0R9| Main Phone: 403-571-0300
0.6x
0.7x
1.2x
1.4x
1.6x
1.8x
1.9x
1.9x
1.9x
2.0x
2.1x
2.2x
2.2x
2.3x
2.3x
2.4x
2.6x
2.7x
2.7x
3.1x
3.2x
3.4x
3.6x
3.9x
4.6x
4.8x
6.8x
7.6x
9.0x
11.0x
12.4x
0.0x 2.0x 4.0x 6.0x 8.0x 10.0x 12.0x 14.0x
Raging River Exploration
Cardinal Energy
Pine Cliff Energy
ARC Resources
NuVista Energy
Whitecap Resources
Tourmaline Oil Corp
Peyto Exploration
RMP Energy
TORC O&G
Surge Energy
Advantage Oil & Gas
Crescent Point Energy
Painted Pony Petroleum
Twin Butte Energy
Northern Blizzard
Seven Generations
Enerplus Corp
Kelt Exploration
Crew Energy
Bonterra Energy
Bonavista Energy
Birchcliff Energy
Pengrowth Energy
Baytex Energy
Long Run Exploration
Bellatrix Exploration
Trilogy Energy
Lightstream Resources
Penn West Exploration
Paramount Resources
Q3/15 Net Debt to Annualized Cash FlowMedian: 2.4x
Formula:Net Debt
Cash Flow for Period x 4
D/CF Multiple (Not Shown):Perpetual Energy: -19.2

December 3, 2015 ACUMEN CAPITAL | RESEARCH
IDEAS. GROWTH. OPPORTUNITY.
Page 13 of 31
Trevor Reynolds | Oil & Gas Research Analyst| (403) 410-6842| [email protected] Mike McMeeken | Research Associate| (403) 571-0530| [email protected]
Acumen Capital Finance Partners Limited #700, 404 – 6 Avenue SW | Calgary, AB | T2P 0R9| Main Phone: 403-571-0300
0.0x
2.0x
4.0x
6.0x
8.0x
10.0x
12.0x
14.0x
16.0x
0.00 5.00 10.00 15.00 20.00 25.00 30.00 35.00 40.00
Pri
ce /
Ca
sh F
low
Corporate Netback ($/boe)
Price/CF vs Corporate NetbackCorp Netback Median: $15.95/boe Price/CF Median: 6.31x
NVA
KEL
LTSTBE
CR
BNE
LRE
ERF
BNP
AAV
PEY
TOU
POU
TET
BXE
ARX
SGY
BIR
PGF
PWT
CPG
BTE
TOG
VII
RMP
PPY
WCP
Perpetual Energy (Not Shown):P/CF: -3.5xCorporate Netback: $-1.14/boe
NBZ
CJ
RRX
PNE

December 3, 2015 ACUMEN CAPITAL | RESEARCH
IDEAS. GROWTH. OPPORTUNITY.
Page 14 of 31
Trevor Reynolds | Oil & Gas Research Analyst| (403) 410-6842| [email protected] Mike McMeeken | Research Associate| (403) 571-0530| [email protected]
Acumen Capital Finance Partners Limited #700, 404 – 6 Avenue SW | Calgary, AB | T2P 0R9| Main Phone: 403-571-0300
0
20,000
40,000
60,000
80,000
100,000
120,000
140,000
0.00 5.00 10.00 15.00 20.00 25.00 30.00 35.00 40.00
EV /
Pro
du
ctio
n
Field Netback ($/boe)
Field Netback vs EV/Boe/dNetback Median: $15.07/boe EV/Boe/d Median: $48,404/boe
ERF
LTS
BXE
PGF
VII
PWT
ARX
BTE
SGYTET
BNE
TOU
CPG
POU
PMT
AAV
NVA
PEY
TBE
BIR
BNP
CRKEL
TOG
WCP
PPY
RMP
LRE
CJ
NBZ
RRX
PNE

December 3, 2015 ACUMEN CAPITAL | RESEARCH
IDEAS. GROWTH. OPPORTUNITY.
Page 15 of 31
Trevor Reynolds | Oil & Gas Research Analyst| (403) 410-6842| [email protected] Mike McMeeken | Research Associate| (403) 571-0530| [email protected]
Acumen Capital Finance Partners Limited #700, 404 – 6 Avenue SW | Calgary, AB | T2P 0R9| Main Phone: 403-571-0300
0.0x
2.0x
4.0x
6.0x
8.0x
10.0x
12.0x
14.0x
16.0x
18.0x
20.0x
0.00 5.00 10.00 15.00 20.00 25.00 30.00 35.00 40.00
EV/D
AC
F (L
ess
Hed
gin
g)
Field Netback ($/boe)
EV/DACF (Less Hedging) vs Field NetbackEV/Adj. DACF Median: 9.4x Field Netback Median: $15.08/boe
NVA
KEL
LTS
TBE
CR
BNE
LREERF
BNP
AAV
PMT
PEY
TOU
POU
TET
BXE
ARX
SGY
BIR
PGF
PWT
CPGBTE
TOG
VII
RMP
PPY
WCP
Perpetual Energy (Not Shown):EV/Adj. DACF: 374.9xField Netback: $7.10/boe
NBZ
CJ
RRX
PNE

December 3, 2015 ACUMEN CAPITAL | RESEARCH
IDEAS. GROWTH. OPPORTUNITY.
Page 16 of 31
Trevor Reynolds | Oil & Gas Research Analyst| (403) 410-6842| [email protected] Mike McMeeken | Research Associate| (403) 571-0530| [email protected]
Acumen Capital Finance Partners Limited #700, 404 – 6 Avenue SW | Calgary, AB | T2P 0R9| Main Phone: 403-571-0300
531
679
703
710
762
799
951
1,244
1,470
1,476
1,934
2,113
2,157
2,167
2,842
3,585
3,607
3,644
3,933
4,435
4,513
4,596
4,703
4,900
5,430
6,542
6,974
7,888
8,042
8,717
8,822
9,293
9,655
9,787
0 2,000 4,000 6,000 8,000 10,000 12,000
Leucrotta Exploration
Hemisphere Energy
Hawk Exploration
Toro Oil & Gas
Tuscany Energy
LGX O&G
Traverse Energy
Canamax Energy
Virginia Hills Oil Corp
Quattro Exploration
Questerre Energy
Strategic O&G
Yangarra Resources
Anderson Energy
Striker Exploration
Arsenal Energy
Eagle Energy Trust
Granite Oil Corp
Rock Energy
Manitok Energy
Zargon O&G
Questfire Energy
Marquee Energy
Chinook Energy
Gear Energy
Ikkuma Resources
Boulder Energy
Delphi Energy
Spartan Energy
Tamarack Valley
Cequence Energy
Spyglass Resources
Storm Resources
Journey Energy
Q3/15 Production (boe/d)Median: 3,625 boe/d
Junior Charts:
Source: Company Reports, Acumen Capital
*Figures Subject to Rounding

December 3, 2015 ACUMEN CAPITAL | RESEARCH
IDEAS. GROWTH. OPPORTUNITY.
Page 17 of 31
Trevor Reynolds | Oil & Gas Research Analyst| (403) 410-6842| [email protected] Mike McMeeken | Research Associate| (403) 571-0530| [email protected]
Acumen Capital Finance Partners Limited #700, 404 – 6 Avenue SW | Calgary, AB | T2P 0R9| Main Phone: 403-571-0300
3%
17%
18%
23%
25%
28%
30%
30%
40%
45%
45%
48%
49%
53%
54%
57%
58%
58%
62%
62%
75%
75%
76%
77%
78%
79%
81%
92%
95%
95%
96%
97%
97%
98%
0% 10% 20% 30% 40% 50% 60% 70% 80% 90% 100%
Ikkuma Resources
Cequence Energy
Storm Resources
Quattro Exploration
Questfire Energy
Delphi Energy
Leucrotta Exploration
Chinook Energy
Spyglass Resources
Anderson Energy
Marquee Energy
Yangarra Resources
Traverse Energy
Manitok Energy
Journey Energy
Questerre Energy
Tamarack Valley
Toro Oil & Gas
Striker Exploration
Canamax Energy
Hemisphere Energy
Tuscany Energy
Strategic O&G
LGX O&G
Boulder Energy
Arsenal Energy
Zargon O&G
Granite Oil Corp
Eagle Energy Trust
Spartan Energy
Virginia Hills Oil Corp
Rock Energy
Hawk Exploration
Gear Energy
Q3/15 Production Mix - Oil & NGL Weighting (%)Median: 58%

December 3, 2015 ACUMEN CAPITAL | RESEARCH
IDEAS. GROWTH. OPPORTUNITY.
Page 18 of 31
Trevor Reynolds | Oil & Gas Research Analyst| (403) 410-6842| [email protected] Mike McMeeken | Research Associate| (403) 571-0530| [email protected]
Acumen Capital Finance Partners Limited #700, 404 – 6 Avenue SW | Calgary, AB | T2P 0R9| Main Phone: 403-571-0300
1.38
2.42
5.81
5.97
6.47
8.09
8.22
8.36
8.65
8.71
8.81
9.32
11.22
11.33
11.61
11.70
12.60
12.96
16.57
16.61
16.66
16.78
17.53
17.98
18.08
18.92
19.27
19.41
20.96
21.91
22.06
22.29
23.17
24.61
$0.00 $5.00 $10.00 $15.00 $20.00 $25.00 $30.00
Toro Oil & Gas
Leucrotta Exploration
Ikkuma Resources
Delphi Energy
Chinook Energy
Manitok Energy
Storm Resources
Marquee Energy
Questfire Energy
Cequence Energy
Hawk Exploration
Spyglass Resources
Zargon O&G
Strategic O&G
Journey Energy
Quattro Exploration
Canamax Energy
Tuscany Energy
Gear Energy
Arsenal Energy
LGX O&G
Tamarack Valley
Hemisphere Energy
Yangarra Resources
Striker Exploration
Anderson Energy
Virginia Hills Oil Corp
Traverse Energy
Eagle Energy Trust
Questerre Energy
Boulder Energy
Spartan Energy
Rock Energy
Granite Oil Corp
Q3/15 Field Netback ($/boe)Median: $12.78/boe
Formula:Revenue less: Royalties, Operating & Transportation Exp
Tota l Production in the Period

December 3, 2015 ACUMEN CAPITAL | RESEARCH
IDEAS. GROWTH. OPPORTUNITY.
Page 19 of 31
Trevor Reynolds | Oil & Gas Research Analyst| (403) 410-6842| [email protected] Mike McMeeken | Research Associate| (403) 571-0530| [email protected]
Acumen Capital Finance Partners Limited #700, 404 – 6 Avenue SW | Calgary, AB | T2P 0R9| Main Phone: 403-571-0300
0.06
1.55
3.52
3.59
3.94
3.97
4.31
5.38
5.75
6.18
6.54
6.69
8.46
8.55
8.90
8.98
10.95
13.12
13.53
14.37
14.39
15.52
16.48
17.59
17.91
18.11
19.39
20.67
21.68
23.77
26.00
44.18
$0.00 $5.00 $10.00 $15.00 $20.00 $25.00 $30.00 $35.00 $40.00 $45.00
Anderson Energy
Chinook Energy
Tuscany Energy
Questfire Energy
Ikkuma Resources
Virginia Hills Oil Corp
Strategic O&G
Marquee Energy
Spyglass Resources
Cequence Energy
Hawk Exploration
Quattro Exploration
LGX O&G
Journey Energy
Zargon O&G
Storm Resources
Hemisphere Energy
Canamax Energy
Delphi Energy
Gear Energy
Striker Exploration
Manitok Energy
Traverse Energy
Arsenal Energy
Tamarack Valley
Questerre Energy
Spartan Energy
Yangarra Resources
Eagle Energy Trust
Boulder Energy
Rock Energy
Granite Oil Corp
Q3/15 Corporate Netbacks with Hedging Breakdown ($/boe)Netback Median: $9.97/boe Hedging Median: $2.14/boe
Corporate Netbacks <$0/boe:Toro Oil & GasLeucrotta Exploration
Formula:Operating Netback Less: G&A & Interest Exp
Total Production in the Period
Corporate Netback
Hedging Netback

December 3, 2015 ACUMEN CAPITAL | RESEARCH
IDEAS. GROWTH. OPPORTUNITY.
Page 20 of 31
Trevor Reynolds | Oil & Gas Research Analyst| (403) 410-6842| [email protected] Mike McMeeken | Research Associate| (403) 571-0530| [email protected]
Acumen Capital Finance Partners Limited #700, 404 – 6 Avenue SW | Calgary, AB | T2P 0R9| Main Phone: 403-571-0300
0%
0%
0%
0%
0%
0%
0%
0%
0%
0%
6%
13%
19%
22%
24%
25%
30%
31%
32%
33%
33%
38%
46%
51%
52%
55%
56%
56%
63%
70%
84%
-10% 0% 10% 20% 30% 40% 50% 60% 70% 80% 90% 100%
Quattro Exploration
Leucrotta Exploration
Anderson Energy
Traverse Energy
Toro Oil & Gas
Hemisphere Energy
Tuscany Energy
LGX O&G
Spartan Energy
Striker Exploration
Questerre Energy
Gear Energy
Journey Energy
Boulder Energy
Ikkuma Resources
Storm Resources
Tamarack Valley
Rock Energy
Arsenal Energy
Yangarra Resources
Cequence Energy
Questfire Energy
Hawk Exploration
Granite Oil Corp
Eagle Energy Trust
Canamax Energy
Marquee Energy
Chinook Energy
Zargon O&G
Spyglass Resources
Delphi Energy
Q3/15 Hedging Gains as a % of Corporate NetbacksMedian: 25%
Hedging Gains Greater than 100% of Corporate Netbacks:Manitok Energy
Strategic Oil & GasVirginia Hills Oil Corp

December 3, 2015 ACUMEN CAPITAL | RESEARCH
IDEAS. GROWTH. OPPORTUNITY.
Page 21 of 31
Trevor Reynolds | Oil & Gas Research Analyst| (403) 410-6842| [email protected] Mike McMeeken | Research Associate| (403) 571-0530| [email protected]
Acumen Capital Finance Partners Limited #700, 404 – 6 Avenue SW | Calgary, AB | T2P 0R9| Main Phone: 403-571-0300
6.93
8.77
8.83
8.87
11.08
11.67
12.33
12.50
12.66
12.71
12.89
13.09
13.24
14.05
14.29
14.41
14.63
15.25
15.89
16.30
16.88
17.43
17.44
17.53
17.69
18.40
19.51
19.82
20.06
21.95
22.67
23.53
29.84
29.85
$0.00 $5.00 $10.00 $15.00 $20.00 $25.00 $30.00 $35.00
Granite Oil Corp
Yangarra Resources
Storm Resources
Anderson Energy
Ikkuma Resources
Boulder Energy
Questerre Energy
Striker Exploration
Cequence Energy
Hemisphere Energy
Questfire Energy
Quattro Exploration
Traverse Energy
Tamarack Valley
Delphi Energy
Rock Energy
Leucrotta Exploration
Journey Energy
Spyglass Resources
Arsenal Energy
Chinook Energy
Manitok Energy
Spartan Energy
Gear Energy
Marquee Energy
Tuscany Energy
Eagle Energy Trust
Canamax Energy
Hawk Exploration
Zargon O&G
Strategic O&G
LGX O&G
Toro Oil & Gas
Virginia Hills Oil Corp
Q3/15 Operating & Transportation Expenses ($/boe)Median: $14.94/boe
Formula:Operating and Transportation Expenses
Total Production in the Period

December 3, 2015 ACUMEN CAPITAL | RESEARCH
IDEAS. GROWTH. OPPORTUNITY.
Page 22 of 31
Trevor Reynolds | Oil & Gas Research Analyst| (403) 410-6842| [email protected] Mike McMeeken | Research Associate| (403) 571-0530| [email protected]
Acumen Capital Finance Partners Limited #700, 404 – 6 Avenue SW | Calgary, AB | T2P 0R9| Main Phone: 403-571-0300
1.07
1.30
1.50
1.67
1.80
1.90
1.93
2.16
2.53
2.60
2.66
2.76
2.80
2.86
2.94
2.94
3.09
3.25
3.51
3.63
4.15
4.28
4.32
4.38
4.38
4.39
5.66
5.74
6.47
6.85
8.08
8.68
12.8124.38
$0.00 $5.00 $10.00 $15.00 $20.00 $25.00
Storm Resources
Yangarra Resources
Delphi Energy
Boulder Energy
Ikkuma Resources
Granite Oil Corp
Spartan Energy
Tamarack Valley
Cequence Energy
Traverse Energy
Gear Energy
LGX O&G
Journey Energy
Questfire Energy
Rock Energy
Arsenal Energy
Striker Exploration
Spyglass Resources
Quattro Exploration
Hawk Exploration
Marquee Energy
Zargon O&G
Questerre Energy
Manitok Energy
Hemisphere Energy
Chinook Energy
Canamax Energy
Anderson Energy
Strategic O&G
Virginia Hills Oil Corp
Tuscany Energy
Eagle Energy Trust
Toro Oil & Gas
Leucrotta Exploration
Q3/15 G&A Expense ($/boe)Median: $3.17/boe

December 3, 2015 ACUMEN CAPITAL | RESEARCH
IDEAS. GROWTH. OPPORTUNITY.
Page 23 of 31
Trevor Reynolds | Oil & Gas Research Analyst| (403) 410-6842| [email protected] Mike McMeeken | Research Associate| (403) 571-0530| [email protected]
Acumen Capital Finance Partners Limited #700, 404 – 6 Avenue SW | Calgary, AB | T2P 0R9| Main Phone: 403-571-0300
6.64
7.09
7.78
9.43
10.27
10.71
11.78
12.85
12.95
14.17
14.31
16.11
16.54
16.55
16.76
17.55
18.28
18.83
19.00
19.14
19.47
19.66
20.38
20.78
21.14
21.38
21.66
22.37
22.82
24.63
26.18
27.53
30.03
37.12
$0.00 $5.00 $10.00 $15.00 $20.00 $25.00 $30.00 $35.00 $40.00
Questfire Energy
Quattro Exploration
Ikkuma Resources
Storm Resources
Delphi Energy
Spyglass Resources
Cequence Energy
Yangarra Resources
Journey Energy
Manitok Energy
Leucrotta Exploration
Canamax Energy
Chinook Energy
Questerre Energy
Hawk Exploration
Tamarack Valley
Marquee Energy
Tuscany Energy
Granite Oil Corp
Boulder Energy
Rock Energy
Hemisphere Energy
Zargon O&G
Arsenal Energy
Traverse Energy
Anderson Energy
Striker Exploration
Gear Energy
LGX O&G
Eagle Energy Trust
Strategic O&G
Virginia Hills Oil Corp
Spartan Energy
Toro Oil & Gas
Q3/15 Depletion, Depreciation & Accretion Expenses ($/boe)Median: $18.55/boe
Formula:Depletion, Depreciation & Accretion Expenses
Tota l Production in the Period
*Not including Impairment charges

December 3, 2015 ACUMEN CAPITAL | RESEARCH
IDEAS. GROWTH. OPPORTUNITY.
Page 24 of 31
Trevor Reynolds | Oil & Gas Research Analyst| (403) 410-6842| [email protected] Mike McMeeken | Research Associate| (403) 571-0530| [email protected]
Acumen Capital Finance Partners Limited #700, 404 – 6 Avenue SW | Calgary, AB | T2P 0R9| Main Phone: 403-571-0300
164,174
304,939
7,289
12,255
12,425
14,001
14,561
15,127
17,687
17,767
19,504
19,656
20,778
21,512
22,319
23,320
28,481
30,977
31,317
31,554
32,111
32,442
33,219
33,499
40,384
40,631
42,094
43,629
45,046
46,264
51,131
52,233
77,479
85,091
90,991
$0 $10,000 $20,000 $30,000 $40,000 $50,000 $60,000 $70,000 $80,000 $90,000 $100,000
Quattro Exploration
Ikkuma Resources
Striker Exploration
Chinook Energy
Cequence Energy
Tuscany Energy
Journey Energy
Questfire Energy
Spyglass Resources
Hawk Exploration
Gear Energy
Manitok Energy
Arsenal Energy
Marquee Energy
Hemisphere Energy
Toro Oil & Gas
Traverse Energy
Delphi Energy
Eagle Energy Trust
Canamax Energy
Rock Energy
Zargon O&G
Anderson Energy
Boulder Energy
LGX O&G
Questerre Energy
Tamarack Valley
Yangarra Resources
Strategic O&G
Storm Resources
Virginia Hills Oil Corp
Granite Oil Corp
Spartan Energy
Q3/15 Production Multiples ($/boe/d)EV/Boe/d Median: $31,436/boe MC/Boe/d Median: $12,561/boe
Definition:The blue bars show the company's enterprise value in
relation to Q3 production. The red bars indicate the market
capitalization to Q3 production. The difference between the two bars is the comapny's net debt.
Formula:Market Cap + Net Debt
Average Production in BOE
Note: Share price at close on December 2, 2015
Not Shown:Leucrotta ExplorationEV/Boe/d: $164,174
MC/Boe/d: $304,939

December 3, 2015 ACUMEN CAPITAL | RESEARCH
IDEAS. GROWTH. OPPORTUNITY.
Page 25 of 31
Trevor Reynolds | Oil & Gas Research Analyst| (403) 410-6842| [email protected] Mike McMeeken | Research Associate| (403) 571-0530| [email protected]
Acumen Capital Finance Partners Limited #700, 404 – 6 Avenue SW | Calgary, AB | T2P 0R9| Main Phone: 403-571-0300
2.4x
3.0x
3.3x
3.6x
3.6x
3.8x
4.0x
4.2x
4.6x
5.0x
5.2x
5.3x
6.0x
6.2x
6.7x
6.7x
6.8x
6.8x
7.4x
7.8x
7.9x
9.2x
10.5x
10.9x
11.5x
12.8x
14.0x
15.0x
15.8x
24.1x
26.3x
26.4x
0.0x 5.0x 10.0x 15.0x 20.0x 25.0x 30.0x
Striker Exploration
Quattro Exploration
Rock Energy
Arsenal Energy
Manitok Energy
Gear Energy
Eagle Energy Trust
Traverse Energy
Boulder Energy
Journey Energy
Chinook Energy
Granite Oil Corp
Yangarra Resources
Cequence Energy
Delphi Energy
Tamarack Valley
Hemisphere Energy
Questerre Energy
Ikkuma Resources
Questfire Energy
Hawk Exploration
Spyglass Resources
Marquee Energy
Tuscany Energy
Zargon O&G
Spartan Energy
LGX O&G
Canamax Energy
Storm Resources
Strategic O&G
Anderson Energy
Virginia Hills Oil Corp
Annualized Q3/15 Cash Flow MultiplesEnterprise Value/CF Median: 6.8x Market Cap/CF Median: 2.8x
Definition:The blue bars show the company's enterprise value in
relation to annualized cash flow. The red bars indicate the market capitalization to annualized cash flow. The difference between the two bars i s the comapny's net debt.
Formula:Enterprise Value
Cash Flow for Period x 4
Note: Share price at close on December 2, 2015
Negligible Cash Flow from Operations:Leucrotta ExplorationToro Oil & Gas
December 3, 2015 ACUMEN CAPITAL | RESEARCH
IDEAS. GROWTH. OPPORTUNITY.
Page 26 of 31
Trevor Reynolds | Oil & Gas Research Analyst| (403) 410-6842| [email protected] Mike McMeeken | Research Associate| (403) 571-0530| [email protected]
Acumen Capital Finance Partners Limited #700, 404 – 6 Avenue SW | Calgary, AB | T2P 0R9| Main Phone: 403-571-0300
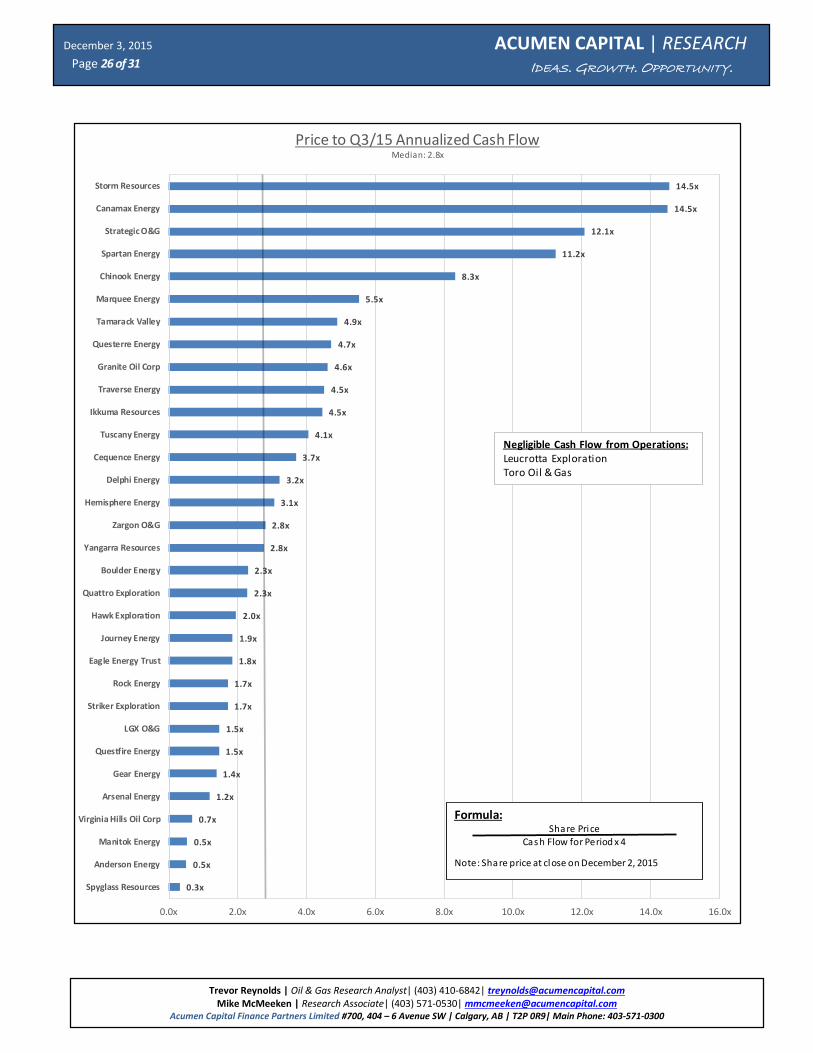
0.3x
0.5x
0.5x
0.7x
1.2x
1.4x
1.5x
1.5x
1.7x
1.7x
1.8x
1.9x
2.0x
2.3x
2.3x
2.8x
2.8x
3.1x
3.2x
3.7x
4.1x
4.5x
4.5x
4.6x
4.7x
4.9x
5.5x
8.3x
11.2x
12.1x
14.5x
14.5x
0.0x 2.0x 4.0x 6.0x 8.0x 10.0x 12.0x 14.0x 16.0x
Spyglass Resources
Anderson Energy
Manitok Energy
Virginia Hills Oil Corp
Arsenal Energy
Gear Energy
Questfire Energy
LGX O&G
Striker Exploration
Rock Energy
Eagle Energy Trust
Journey Energy
Hawk Exploration
Quattro Exploration
Boulder Energy
Yangarra Resources
Zargon O&G
Hemisphere Energy
Delphi Energy
Cequence Energy
Tuscany Energy
Ikkuma Resources
Traverse Energy
Granite Oil Corp
Questerre Energy
Tamarack Valley
Marquee Energy
Chinook Energy
Spartan Energy
Strategic O&G
Canamax Energy
Storm Resources
Price to Q3/15 Annualized Cash FlowMedian: 2.8x
Formula:Share Price
Cash Flow for Period x 4
Note: Share price at close on December 2, 2015
Negligible Cash Flow from Operations:Leucrotta ExplorationToro Oil & Gas

December 3, 2015 ACUMEN CAPITAL | RESEARCH
IDEAS. GROWTH. OPPORTUNITY.
Page 27 of 31
Trevor Reynolds | Oil & Gas Research Analyst| (403) 410-6842| [email protected] Mike McMeeken | Research Associate| (403) 571-0530| [email protected]
Acumen Capital Finance Partners Limited #700, 404 – 6 Avenue SW | Calgary, AB | T2P 0R9| Main Phone: 403-571-0300
0.5x
0.7x
0.7x
0.7x
1.3x
1.5x
1.6x
1.8x
2.1x
2.1x
2.3x
2.4x
2.4x
2.6x
3.0x
3.0x
3.2x
3.2x
3.5x
3.7x
5.0x
6.0x
6.3x
6.8x
8.7x
8.9x
12.0x
12.6x
25.7x
25.8x
0.0x 5.0x 10.0x 15.0x 20.0x 25.0x 30.0x
Chinook Energy
Leucrotta Exploration
Toro Oil & Gas
Traverse Energy
Canamax Energy
Quattro Exploration
Striker Exploration
Granite Oil Corp
Storm Resources
Spartan Energy
Rock Energy
Tamarack Valley
Eagle Energy Trust
Questerre Energy
Boulder Energy
Arsenal Energy
Gear Energy
Cequence Energy
Ikkuma Resources
Manitok Energy
Journey Energy
Yangarra Resources
Delphi Energy
Hemisphere Energy
Marquee Energy
Hawk Exploration
Questfire Energy
Tuscany Energy
Zargon O&G
Spyglass Resources
Strategic O&G
LGX O&G
Virginia Hills Oil Corp
Anderson Energy
Q3/15 Net Debt to Annualized Cash FlowMedian: 3.0x
Formula:Net Debt
Cash Flow for Period x 4 Pos i tive Working Capital

December 3, 2015 ACUMEN CAPITAL | RESEARCH
IDEAS. GROWTH. OPPORTUNITY.
Page 28 of 31
Trevor Reynolds | Oil & Gas Research Analyst| (403) 410-6842| [email protected] Mike McMeeken | Research Associate| (403) 571-0530| [email protected]
Acumen Capital Finance Partners Limited #700, 404 – 6 Avenue SW | Calgary, AB | T2P 0R9| Main Phone: 403-571-0300
0.0x
2.0x
4.0x
6.0x
8.0x
10.0x
12.0x
14.0x
16.0x
0.00 5.00 10.00 15.00 20.00 25.00 30.00 35.00 40.00 45.00
Pri
ce /
Ca
sh F
low
Corporate Netback ($/boe)
Price/CF vs Corporate NetbackCorp Netback Median: $9.97/boe Price/CF Median: 2.7x
MEI
ZAR
TVL
RE
TVE
AEI
YO
MQL
YGR
EGLJOY
DEE
TUS QEC
Q/A
HME
CAC
SPESOG
OIL
SRX
HWK
GXE
CKE
QXP
Negative or Negligible Cash Flow from Operations:Leucrotta Exploration
Toro Oil & Gas
IKM
VHO
SGLAXL
SKX
GXO
CQE
BXO

December 3, 2015 ACUMEN CAPITAL | RESEARCH
IDEAS. GROWTH. OPPORTUNITY.
Page 29 of 31
Trevor Reynolds | Oil & Gas Research Analyst| (403) 410-6842| [email protected] Mike McMeeken | Research Associate| (403) 571-0530| [email protected]
Acumen Capital Finance Partners Limited #700, 404 – 6 Avenue SW | Calgary, AB | T2P 0R9| Main Phone: 403-571-0300
0
10,000
20,000
30,000
40,000
50,000
60,000
70,000
80,000
90,000
0.00 5.00 10.00 15.00 20.00 25.00
EV /
Pro
du
ctio
n
Field Netback ($/boe)
Field Netback vs EV/boe/dNetback Median: $12.78/boe EV/boe/d Median: $31,002/boe
MEI
ZAR
TVL
RE
TVE
AEIMQL
YGR
EGLDEE
JOY
HWK
QEC
TOO
Q/A
HME
CQE
AXL
VHO
SOG
CKE
OIL
BXO
SRX
QXP
TUS
GXE
GXO
CAC
Not Shown on Chart:Leucrotta ExplorationField Netback: $2.42/boe
EV/Production: $148,616/boe/d
SPE
IKM SKX
SGL

December 3, 2015 ACUMEN CAPITAL | RESEARCH
IDEAS. GROWTH. OPPORTUNITY.
Page 30 of 31
Trevor Reynolds | Oil & Gas Research Analyst| (403) 410-6842| [email protected] Mike McMeeken | Research Associate| (403) 571-0530| [email protected]
Acumen Capital Finance Partners Limited #700, 404 – 6 Avenue SW | Calgary, AB | T2P 0R9| Main Phone: 403-571-0300
EV/DACF (less hedging)
0.0x
5.0x
10.0x
15.0x
20.0x
0.00 5.00 10.00 15.00 20.00 25.00
EV/D
AC
F (L
ess
Hed
gin
g)
Field Netback ($/boe)
EV/DACF (Less Hedging) vs Field NetbackEV/Adj. DACF Median: 7.0x Field Netback Median: $14.77/boe
MEI
ZAR
TVL
RE
TVE
AEI
MQL
YGR
EGL
DEE
TUS
QEC
JOY
Q/A
HME
CAC
SPE
SOG
OIL
SRX
HWK
GXE
CKE
QXP
Negative or Negligible Cash Flow from Operations:Leucrotta Exploration
Toro Oil & Gas
IKM
VHO
SGL
AXL
SKX
GXOCQE
BXO

December 3, 2015 ACUMEN CAPITAL | RESEARCH
IDEAS. GROWTH. OPPORTUNITY.
Page 31 of 31
Trevor Reynolds | Oil & Gas Research Analyst| (403) 410-6842| [email protected] Mike McMeeken | Research Associate| (403) 571-0530| [email protected]
Acumen Capital Finance Partners Limited #700, 404 – 6 Avenue SW | Calgary, AB | T2P 0R9| Main Phone: 403-571-0300
ACUMEN CAPITAL | STAFF LIST
RESEARCH
Brian D. Pow, MBA Vice President Research, Equity Analyst (403) 571-0303 [email protected]
Trevor Reynolds Oil and Gas Research Analyst (403) 410-6842 [email protected]
Mike McMeeken Research Associate (403) 571-0530 [email protected]
Oliver Shao Research Associate (403) 410-6840 [email protected]
INSTITUTIONAL SALES
Brian Parker President & CEO, Institutional Sales (403) 571-2514 [email protected]
Douglas S. Gowland, C.A., CFA Vice President, Institutional Sales (403) 571-0317 [email protected]
Andre Drouillard, CFA Vice President, Institutional Sales (403) 571-0685 [email protected]
Robert Cooper, CFA Institutional Sales (403) 571-0324 [email protected]
TRADING
Liam Farrell Head Trader (403) 571-0318 [email protected]
David Waite Institutional Trading (403) 410-6730 [email protected]
Jesse Ahlan Institutional Trading (403) 571-0148 [email protected]
Crystal Bellefountaine Associate (403) 571-0314 [email protected]
INVESTMENT BANKING
Kelly Hughes Vice President, Investment Banking (403) 571-5036 [email protected]
Ian Thomson Vice President, Investment Banking (403) 571-0301 [email protected]
Shawn Ostrow Investment Banking Associate (403) 571-0319 [email protected]
RETAIL SALES
Robert Laidlaw Vice President (403) 571-2522 [email protected]
Imran Mulji Investment Advisor (403) 571-0112 [email protected]
Margaret Samson Investment Advisor Assistant (403) 441-0536 [email protected]
Sheldon LeLievre Vice President, Sr. Investment Advisor (403) 571-0315 [email protected]
Craig Madill Investment Advisor (403) 410-6018 [email protected]
Erin Williams Investment Advisor Assistant (403) 571-2416 [email protected]
Donny Woo Vice President, Sr. Investment Advisor (403) 571-2510 [email protected]
Darren Fong Investment Advisor (403) 441-2754 [email protected]
Alan Tolg Investment Advisor (403) 410-2042 [email protected]
Ron Cairns Investment Advisor (403) 410-2040 [email protected]
Scott Barnett Investment Advisor (403) 571-0532 [email protected]
Curtis Schirrmacher Investment Advisor (403) 571-0113 [email protected]
Grant Gowland Associate (403) 441-0537 [email protected]
Matthew Wiens Associate (403) 441-5672 [email protected]
TREASURY AND OPERATIONS
Cindy Marthaller Operations Manager (403) 571-8045 [email protected]
Myja Miller CFO, COO (403) 571-0308 [email protected]
Govind Achyuthan Chief Compliance Officer (403) 571-0689 [email protected]
Krystine Hebert Client Services (403) 571-0300 [email protected]
Acumen Capital Finance Partners Limited | Main Phone: 403-571-0300 | Trading Toll Free: 1-866-410-9039
www.acumencapital.com
| Suite 700, 404 – 6 Avenue SW Calgary, AB T2P 0R9 |