q3 2015 results - · pdf fileusd 1 000 q2 2015 acquired organic q3 2015 q/q ... *cxense...
TRANSCRIPT

Q3 2015 results20 November 2015

2
Cxense enables businesses to increase digital revenue
> INCREASE CONVERSION
> INCREASE DIGITAL REVENUE
..to create more more personalized
and engaging user experinces
Enables businesses to gather,
analyze and use data…
CUSTOMER BENEFITS

3
Operational data reflect increasing impact
Events = page-views Sessions= Continuous browsing event (less
than 30 minutes pause) with one browser
Device = Browser with unique history. A user
using Opera, Firefox and Chrome on one PC
equals 3 devices. Mobile, iPad and so on are
devices, as is one PC with several unique logins
# Events interacting with Cxense # Sessions interacting with Cxense # Devices interacting with Cxense
0
5
10
15
20
25
30
35
40
45
Q3'1
1Q
4'1
1Q
1'1
2Q
2'1
2Q
3'1
2Q
4'1
2Q
1'1
3Q
2'1
3Q
3'1
3Q
4'1
3Q
1'1
4Q
2'1
4Q
3'1
4Q
4'1
4Q
1'1
5Q
2'1
5Q
3'1
5
Billion
0
2000
4000
6000
8000
10000
12000
14000
Q3'1
1Q
4'1
1Q
1'1
2Q
2'1
2Q
3'1
2Q
4'1
2Q
1'1
3Q
2'1
3Q
3'1
3Q
4'1
3Q
1'1
4Q
2'1
4Q
3'1
4Q
4'1
4Q
1'1
5Q
2'1
5Q
3'1
5
Million
0
200
400
600
800
1000
1200
1400
Q3'1
1Q
4'1
1Q
1'1
2Q
2'1
2Q
3'1
2Q
4'1
2Q
1'1
3Q
2'1
3Q
3'1
3Q
4'1
3Q
1'1
4Q
2'1
4Q
3'1
4Q
4'1
4Q
1'1
5Q
2'1
5Q
3'1
5
Million
4
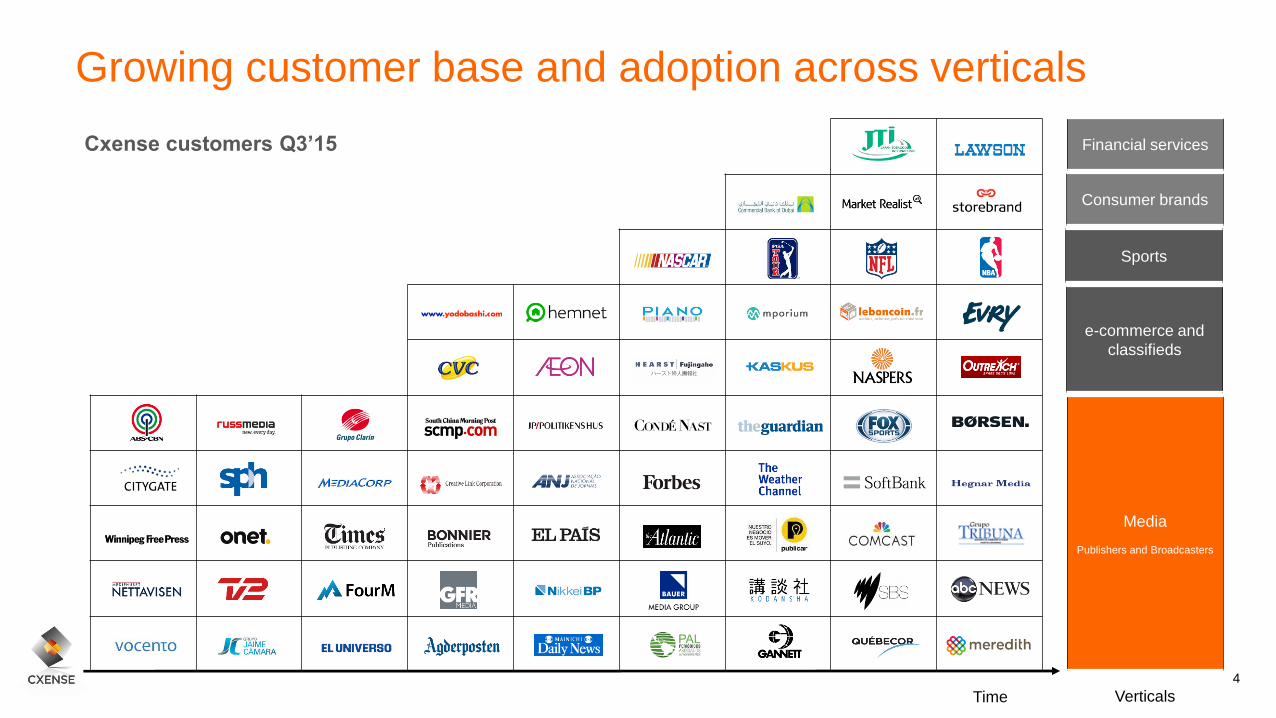
Growing customer base and adoption across verticals
VerticalsTime
Media
Publishers and Broadcasters
Sports
Financial services
Consumer brands
e-commerce and
classifieds
Cxense customers Q3’15

5
389
619
8871 065 1 110
1 500
1 708
3 212
4 174 4 115 4 140 4 152
3 881
3 540
4 818
Q1'12 Q2'12 Q3'12 Q4'12 Q1'13 Q2'13 Q3'13 Q4'13 Q1'14 Q2'14 Q3'14 Q4'14 Q1'15 Q2'15 Q3'15
Group revenue*USD 1 000
Revenue development
*Figures for period Q2’12 to Q1’13 are restated to exclude the discontinued operations of PPN AG

6
Strategic development
…market leading technologies, offerings and people
• Acquired in Q3’15
• Strengthens Cxense’s video platform
• Drive monetization of tier-one media sites
• Accelerates North America expansion
• Acquired in Q2’15
• Enables businesses to optimize advertising campaigns
• Complements product offerings and technology competence
• Complements customer base
Combining Cxense DMP with…
• Acquired minority stake in Q2’15
• Signed 3 year OEM licensing agreement in Q2’15
• Strengthens mobile ecommerce offering
• mporium a marketing channel for the entire Cxense SaaS suite
+
+
+

7
Recent contracts
Vertical Publisher e-commerce Online media e-commerce/publisher
Region EMEA EMEA Japan North America
Cxense
deliveries
• Cxense Maxifier (advertising
optimization) products
• Cxense Insight (real-time
analytics)
• Cxense DMP (Data
Management Platform)
solutions
• Cxense Insight (real-time
analytics)
• Cxense DMP (Data
Management
• Platform)
• Cxense Advertising products
• Cxense DMP (Data
Management Platform)
• Cxense Content (site
personalization)
• Cxense Maxifier (advertising
optimization) products

8
Financials

9
Growth effects Change
USD 1 000 Q2 2015 Acquired Organic Q3 2015 q/q
Revenues 3 540 4 818 36 %
SaaS segment 2 954 712 517 4 183 42 %
PCAN segment 620 55 675 9 %
Inter-segment elimination (34) (5) (39)
Gross profit 2 426 655 565 3 646 50 %
Gross margin SaaS segment 78 % 83 %
Gross margin PCAN segment 24 % 24 %
OPEX 5 518 5 779
Non-IFRS OPEX adjustments (901) (523)
OPEX adjusted 4 617 1 470 (831) 5 256 14 %
EBITDA (3 092) (2 134)
EBITDA adjusted (2 191) (815) 1 396 (1 611) 26 %
Revenue increase and profitability improvement vs last quarter

10
3 530
4 183
553
0
1 000
2 000
3 000
4 000
5 000
SaaS segment: Q3 2015 revenues vs Q3 2014
USD 1 000
Q3’14
4 736
18%
34%
Q3’15
Accumulated currency effect - add back
Reported SaaS segment revenue
• USD appreciation vs other
currencies masks year-over-year
growth
• 34% year-over-year growth when
accumulated currency effect is added
back
*Cxense presentation currency is USD, but the majority of contracts are denoted in other currencies. When the
USD appreciates against all other currencies, as is the case for the period Q3’14 to Q3’15 the value of recurring
revenues presented in USD decreases. See Q3’15 report page 4 for currency effect per quarter.

11
Underlying organic growth with positive trend
• Annualized revenue on contracts
closed in Q3’15 at second highest
level so far
• Increasing trend over last 4 quarters
• Churn declined
• Q3’15 net value of new contracts and
churn translates to 10% quarterly
organic growth
876
1 320 1 404 1 476
2 652
1 716
804 964
1 100
1 784
1 032
2 441
(1 084)
(212)(308)
(1 668)
(892)
(520)
(2 000)
(1 500)
(1 000)
(500)
-
500
1 000
1 500
2 000
2 500
3 000
Q2'14 Q3'14 Q4'14 Q1'15 Q2'15 Q3'15
Recurring revenue on contracts closed in qtr. 1)
New recurring revenue effect in reported figures
Lost recurring revenue (churn)
1 Annualized recurring revenue effect of quarterly performance

12
New contracts
Quarterly number of new contracts
11
14
11
7
11
2122
34
31
37
31
Q1'13 Q2'13 Q3'13 Q4'13 Q1'14 Q2'14 Q3'14 Q4'14 Q1'15 Q2'15 Q3'15
Sales efficiency per sales representative*USD 1 000
240
288312 300
528
404
Q2'14 Q3'14 Q4'14 Q1'15 Q2'15 Q3'15
1) Sales efficiency: Annualized recurring revenue effect of contracts closed on a yearly basis per sales rep

13
Acquisition of Ramp Media adds to North American revenue base
2 954
712
517 4 183 290
800
400 5 633
0
1 000
2 000
3 000
4 000
5 000
(40)
Q3’15
reported
Q2’15
reported
revenue
SaaS
segment
revenue
"run-rate"
estimate
Acquired
revenue
Organic
growth
Quarterly SaaS segment revenues – reported vs “run-rate” USD 1 000
Full effect
of known
churn until
30 October
2105
Full effect
of
contracts
closed until
30 October
2015
Estimated
Q4 effect
of Ramp
Media
Estimated
additional
full effect
Ramp
Media
• Asset Carve out transaction
• Consideration: USD 10m +/- closing adjustments + revenue growth dependent earn-out structure (max USD 9m)
• Annualized revenue of ~ USD 5m
• Minor part of portfolio expected to be discontinued business
• North American customer portfolio with
up-sell potential
• Stronger North American organizational
foot-print
• Attractive Video Software offering
The Ramp Media acquisition closed 22 October 2015
Will partly effect in Q4’15 – full effect from Q1’16

14
5 744
4 417
5 056
5 6351 470
(831)
(396)
975
0
1 000
2 000
3 000
4 000
5 000
6 000
Significant OPEX reductions realized
Q2 2015
OPEX
adjusted
Realized
OPEX
reduction
Maxifier
integration
Q3 OPEX
adjusted
Q3 2014
OPEX
adjusted
Maxifier
Q2 run-
rate OPEX
Estimated
OPEX from
Ramp Carve
out at take-
over
OPEX
run-rate
Expected
full effect
from
Maxifier
integration
50% by end of
Q4 and 100%
by end of Q1
2016
• Cxense continues to focus on
profitable growth
• Modest net OPEX increase from
Maxifier acquisition due to cost
synergy realization
• According to plan
• Even after the Maxifier and Ramp
Media acquisitions, the OPEX run-
rate is lower than OPEX one year
ago
SaaS segment: Quarterly OPEX – reported vs “run-rate” USD 1 000
15
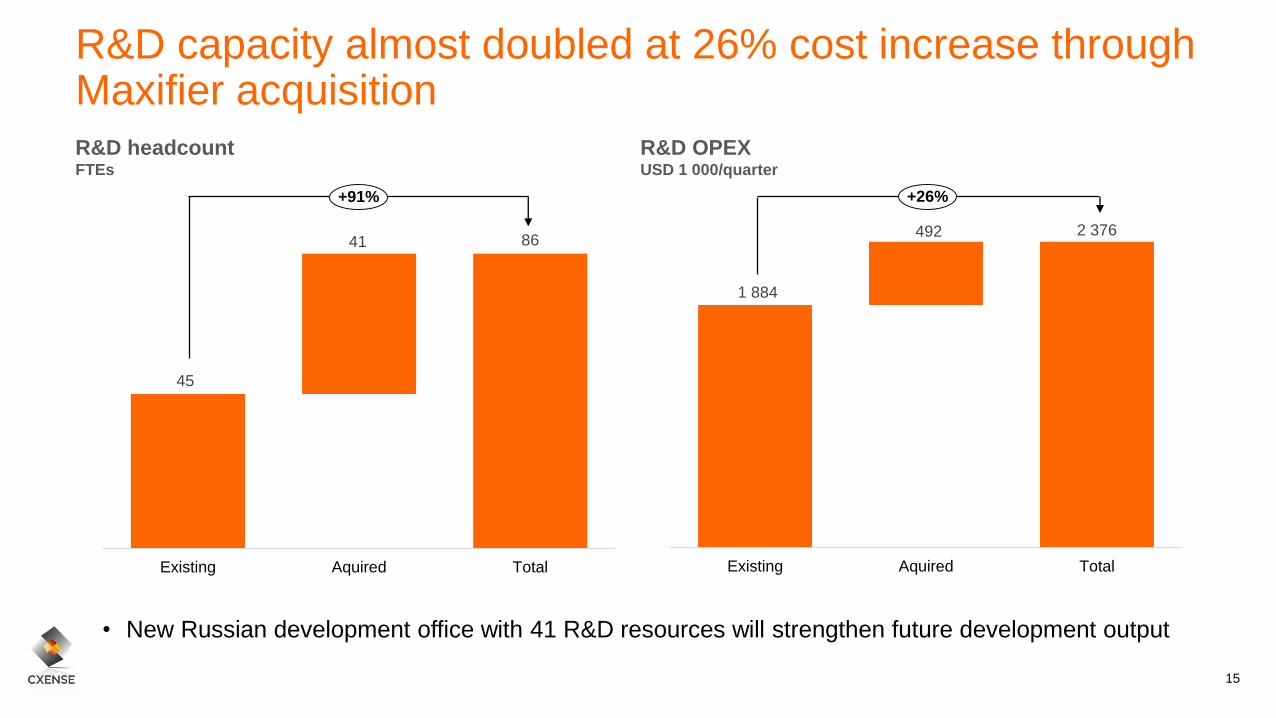
1 884
2 376492
Existing Aquired Total
45
8641
Existing Aquired Total
R&D capacity almost doubled at 26% cost increase through Maxifier acquisition
+91% +26%
• New Russian development office with 41 R&D resources will strengthen future development output
R&D headcountFTEs
R&D OPEXUSD 1 000/quarter

16
Cash flow
• The Q3’15 cash flow used in operations is higher than
EBITDA due to transaction costs paid, but accrued in
previous quarter
• Over time the cash flow from operations will reflect reported
EBITDA
• Investment in intangible assets reflects capitalized R&D
cost for the quarter
• Capitalization of R&D costs started in 2015
• Investments in subsidiary line includes the addition of the
Maxifier cash position
Cash flow statement Q3 2015 Q3 2014
Cash flow from operating activities
P/(L) before income tax (2 894) (3 009)
Adjustments:
Income tax payable (104) (66)
Share- based payments 156 137
Result from investment in associates 692 -
Depreciation and amortization 566 335
Currency translation effects (864) 17
Change in trade receivables (191) (500)
Change in trade payables 380 (650)
Change in other accrual and non-current items (732) (1 321)
Net cash flow from / (used in) op. activities (2 990) (5 058)
Cash flow from investing activities
Investment in fixed assets (68) (331)
Investment in intangible assets (378) -
Investment in associated companies - 5
Investment in subsidiary (1) 193 -
Sale of subsidiary (1) - -
Net cash flow from / (used in) investing activities (254) (326)
Cash flow from financing activities
Net proceeds from share issues - (338)
Proceeds from minority interest - -
Net cash flow from / (used in) finaning activities - (338)
Net inc / (dec) in cash and cash equivalents (3 244) (5 722)
(1) Cash effects are net of cash received on sale of subsidiary,
and cash held by the subsidiary.

17
Financial position
• Non-current asset increased due to:
• Maxifier and mporium acquisitions
• Capitalization of RnD costs, ~20% of 2015 R&D cost
• Current liabilities increased
• Maxifier deferred revenue consideration (potential earn-out payment to be paid in shares)
• Deferred revenue from mporium transaction
• Cash position strengthened by equity issues completed
after end of Q3’15
• USD 11.4m raised to finance USD 4.5m Ramp cash consideration and general working capital purposes
USD 1 000 As at 30 Sep 2015 As at 30 Sep 2014
Total non-current assets 20 845 9 235
Total current assets 5 841 10 441
Total Assets 26 686 19 676
Total Equity 13 940 14 219
Total non-current liabilities 1417 562
Total current liabilities 11 328 4 894
Total equity and liabilities 26 686 19 676

18
Operations

19
Cxense is well positioned for further growth
CxVideo - Patented video
metadata capabilities CxenseCxense
CxVideo – Award-Winning MetaPlayer
Cxense
1) Source: Cisco Systems
By 2017 video will account for 69% of all consumer internet traffic*

20
Solid portfolio with large upsell opportunities
Value at signing Value end Q3'15
Value at signing Value end Q3'15
Value at signing Value end Q3'15
Meredith (NORTH-AMERICA)
• Existing RAMP customer
• Upsell to Cxense personalization engine to drive more engagement
Commercial Bank of Dubai (EMEA)
• Signed in march 2015
• Rapid and cost-effective implementation simplified the buying process
• Strong results over six months, CBD expanded the contract to more use cases
DISCO (JAPAN)
• Signed DMP in May 2014
• Upsell on Cxense personalization engine to to drive more engagement
+63%
+41%
+26%

21
Cxense delivers extraordinary results for our customers
38CLICK THROUGH
RATE ON FRONT
PAGE WITH CXENSE
RECOMMENDATIONS
+ %42
CREDIT CARD
APPLICATIONS
+ %

Summary and outlook

23
Summary and Outlook
• Record revenue driven by recurring SaaS business growth
• Maxifier integration completed with widened product offering and cost reductions
• Adjusted EBITDA improvement
• Raised USD 11.4m in new equity to acquire SaaS company Ramp Media
• Strengthening video solution offering and adding clients in North America
• Continuing expansion into new verticals with organic and acquired growth

24
Appendix

25
Global footprint established to support regional customers
The Group`s software solutions are sold by a global sales organization organized in five regions: EMEA, North America, Latin America, Japan and APAC. The regional sales
organizations include functional areas such as Sales, Sales Support and Onboarding / Implementation.
OSLO
ZURICH
LONDON
MADRIDNEW YORK
MIAMI
BUENOS AIRES
TOKYO
SINGAPORE
Organization of 17 sales people:
• High end sales ”The Elephant Hunters”
• Regional sales
• Online sales Cxense.com
MOSCOWBOSTON

26
Income Statement
USD 1 000 Q3 2015 Q3 2014
Revenues consolidated 4 818 4 142
Cost of goods sold 1 173 1 114
Employee benefit expense 3 970 4 188
Depreciation & Amortisation expense 566 335
Other operating expense 1 809 1 722
Total operating expense 7 518 7 359
Net operating income/(loss) (2 700) (3 217)
Net financial income/(expense) 523 74
Share of profit from associated companies (692) -
Net income/(loss) before taxes (2 869) (3 143)
Income tax expense 25 (62)
Net income/(loss) for the period (2 894) (3 081)

27
Consolidated Statement of Financial Position
USD 1 000 As at 30 Sep 2015 As at 30 Sep 2014
Non-current assets
Goodwill 9 329 3 807
Deferred tax asset 36 10
Intangible assets 7 215 4 778
Office machinery, equipment,etc. 690 561
Investments in associated companies 3 307 -
Other financial assets 268 79
Total non-current assets 20 845 9 235
Current assets
Trade receivables 2 712 2 716
Other short-term assets 997 2 201
Cash and cash equivalents 2 131 5 524
Total current assets 5 841 10 441
Assets classified as "held for sale" - -
Total Assets 26 686 19 676
Total Equity 13 940 14 219
Non-current liabilities
Deferred tax liabilities 1 417 562
Total non-current liabilities 1417 562
Non-current liabilities
Trade payables 1 524 1 191
Current taxes 123 99
Other short-term liabilities 9 681 3 604
Total current liabilities 11 328 4 894
Liabilities related to assets "held for sale" - -
Total equity and liabilities 26 686 19 676

28
Cash Flow Statement
Cash flow statement Q3 2015 Q3 2014
Cash flow from operating activities
P/(L) before income tax (inc. disposal group) (2 894) (3 009)
Adjustments:
Income tax payable (104) (66)
Share- based payments 156 137
Result from investment in associates 692 -
Depreciation and amortization 566 335
Currency translation effects (864) 17
Change in trade receivables (191) (500)
Change in trade payables 380 (650)
Change in other accrual and non-current items (732) (1 321)
Net cash flow from / (used in) op. activities (2 990) (5 058)
Cash flow from investing activities
Investment in fixed assets (68) (331)
Investment in intangible assets (378) -
Investment in associated companies - 5
Investment in subsidiary (1) 193 -
Sale of subsidiary (1) - -
Net cash flow from / (used in) investing activities (254) (326)
Cash flow from financing activities
Net proceeds from share issues - (338)
Proceeds from minority interest - -
Net cash flow from / (used in) finaning activities - (338)
Net inc / (dec) in cash and cash equivalents (3 244) (5 722)
(1) Cash effects are net of cash received on sale of subsidiary,
and cash held by the subsidiary.

29
Important notice
THIS PRESENTATION AND ITS ENCLOSURES AND APPENDICES (HEREINAFTER JOINTLY REFERRED TO AS THE “PRESENTATION”) HAVE BEEN PREPARED BY CXENSE ASA
(THE”COMPANY”) EXCLUSIVELY FOR INFORMATION PURPOSES. THIS PRESENTATION HAS NOT BEEN REVIEWED OR REGISTERED WITH ANY PUBLIC AUTHORITY OR STOCK
EXCHANGE. RECIPIENTS OF THIS PRESENTATION MAY NOT REPRODUCE, REDISTRIBUTE OR PASS ON, IN WHOLE OR IN PART, THE PRESENTATION TO ANY OTHER PERSON.
THE CONTENTS OF THIS PRESENTATION ARE NOT TO BE CONSTRUED AS LEGAL, BUSINESS, INVESTMENT OR TAX ADVICE. EACH RECIPIENT SHOULD CONSULT WITH ITS
OWN LEGAL, BUSINESS, INVESTMENT AND TAX ADVISER AS TO LEGAL, BUSINESS, INVESTMENT AND TAX ADVICE. THERE MAY HAVE BEEN CHANGES IN MATTERS, WHICH
AFFECT THE COMPANY SUBSEQUENT TO THE DATE OF THIS PRESENTATION. NEITHER THE ISSUE NOR DELIVERY OF THIS PRESENTATION SHALL UNDER ANY
CIRCUMSTANCE CREATE ANY IMPLICATION THAT THE INFORMATION CONTAINED HEREIN IS CORRECT AS OF ANY TIME SUBSEQUENT TO THE DATE HEREOF OR THAT THE
AFFAIRS OF THE COMPANY HAVE NOT SINCE CHANGED, AND THE COMPANY DOES NOT INTEND, AND DOES NOT ASSUME ANY OBLIGATION, TO UPDATE OR CORRECT ANY
INFORMATION INCLUDED IN THIS PRESENTATION.
THIS PRESENTATION INCLUDES AND IS BASED ON, AMONG OTHER THINGS, FORWARD-LOOKING INFORMATION AND STATEMENTS. SUCH FORWARD-LOOKING
INFORMATION AND STATEMENTS ARE BASED ON THE CURRENT EXPECTATIONS, ESTIMATES AND PROJECTIONS OF THE COMPANY OR ASSUMPTIONS BASED ON
INFORMATION AVAILABLE TO THE COMPANY. SUCH FORWARD-LOOKING INFORMATION AND STATEMENTS REFLECT CURRENT VIEWS WITH RESPECT TO FUTURE EVENTS
AND ARE SUBJECT TO RISKS, UNCERTAINTIES AND ASSUMPTIONS. THE COMPANY CANNOT GIVE ANY ASSURANCE AS TO THE CORRECTNESS OF SUCH INFORMATION AND
STATEMENTS. AN INVESTMENT IN THE COMPANY INVOLVES RISK, AND SEVERAL FACTORS COULD CAUSE THE ACTUAL RESULTS, PERFORMANCE OR ACHIEVEMENTS OF
THE COMPANY TO BE MATERIALLY DIFFERENT FROM ANY FUTURE RESULTS, PERFORMANCE OR ACHIEVEMENTS THAT MAY BE EXPRESSED OR IMPLIED BY STATEMENTS
AND INFORMATION IN THIS PRESENTATION, INCLUDING, AMONG OTHERS, RISKS OR UNCERTAINTIES ASSOCIATED WITH THE COMPANY’S BUSINESS, SEGMENTS,
DEVELOPMENT, GROWTH MANAGEMENT, FINANCING, MARKET ACCEPTANCE AND RELATIONS WITH CUSTOMERS, AND, MORE GENERALLY, GENERAL ECONOMIC AND
BUSINESS CONDITIONS, CHANGES IN DOMESTIC AND FOREIGN LAWS AND REGULATIONS, TAXES, CHANGES IN COMPETITION AND PRICING ENVIRONMENTS,
FLUCTUATIONS IN CURRENCY EXCHANGE RATES AND INTEREST RATES AND OTHER FACTORS. SHOULD ONE OR MORE OF THESE RISKS OR UNCERTAINTIES MATERIALISE,
OR SHOULD UNDERLYING ASSUMPTIONS PROVE INCORRECT, ACTUAL RESULTS MAY VARY MATERIALLY FROM THOSE DESCRIBED IN THIS DOCUMENT. THE COMPANY
DOES NOT INTEND, AND DOES NOT ASSUME ANY OBLIGATION, TO UPDATE OR CORRECT THE INFORMATION INCLUDED IN THIS PRESENTATION.
THIS PRESENTATION IS SUBJECT TO NORWEGIAN LAW, AND ANY DISPUTE ARISING IN RESPECT OF THIS PRESENTATION IS SUBJECT TO THE EXCLUSIVE JURISDICTION OF
NORWEGIAN COURTS