q2 2021 ir deck
TRANSCRIPT
CYBER EXPOSUREMANAGING AND MEASURING CYBER RISK IN THE DIGITAL ERAJuly 2021
Forward-Looking Statements
2
This presentation includes forward-looking statements. All statements contained in this presentation other than statements of historical facts, including statements regarding our future results of operations and financial position, our business strategy and plans and our objectives for future operations, are forward-looking statements. The words “anticipate,” believe,” “continue,” “estimate,” “expect,” “intend,” “may,” “will” and similar expressions are intended to identify forward-looking statements. We have based these forward-looking statements on our current expectations and projections about future events and financial trends that we believe may affect our financial condition, results of operations, business strategy, short-term and long-term business operations and objectives and financial needs. These forward-looking statements are subject to a number of risks, uncertainties and assumptions. These risks and uncertainties are detailed in the sections titled "Risk Factors" and "Management's Discussion and Analysis of Financial Condition and Results of Operations" in our Annual Report on Form 10-K and other filings that we make from time to time with the SEC, which are available on the SEC's website at sec.gov. Moreover, we operate in a very competitive and rapidly changing environment. New risks emerge from time to time. It is not possible for our management to predict all risks, nor can we assess the impact of all factors on our business or the extent to which any factor, or combination of factors, may cause actual results to differ materially from those contained in any forward-looking statements we may make. Such risks and uncertainties may be amplified by the COVID-19 pandemic and its potential impact on our business and the global economy. In light of these risks, uncertainties and assumptions, the future events and trends discussed in this presentation may not occur and actual results could differ materially and adversely from those anticipated or implied in any forward-looking statements we make. You should not rely on forward-looking statements as predictions of future events. Although we believe that the expectations reflected in the forward-looking statements are reasonable, we cannot guarantee future results, levels of activity, performance, achievements or events and circumstances reflected in the forward-looking statements will occur. Neither we, nor any other person, are under any duty to update any of these forward-looking statements after the date of this presentation to conform these statements to actual results or revised expectations, except as required by law. You should, therefore, not rely on these forward-looking statements as representing our views as of any date subsequent to the date of this presentation. Moreover, except as required by law, neither we nor any other person assumes responsibility for the accuracy and completeness of the forward-looking statements contained in this presentation. This presentation also contains estimates and other statistical data made by independent parties and by us relating to market size and growth and other data about our industry. This data involves a number of assumptions and limitations, and you are cautioned not to give undue weight to such estimates. Neither we nor any other person makes any representation as to the accuracy or completeness of such data or undertakes any obligation to update such data after the date of this presentation. In addition, projections, assumptions and estimates of our future performance and the future performance of the markets in which we operate are necessarily subject to a high degree of uncertainty and risk. By receiving this presentation you acknowledge that you will be solely responsible for your own assessment of the market and our market position and that you will conduct your own analysis and be solely responsible for forming your own view of the potential future performance of our business. This presentation includes non-GAAP financial measures which have certain limitations and should not be considered in isolation, or as alternatives to or substitutes for, financial measures determined in accordance with GAAP. The non-GAAP measures as defined by us may not be comparable to similar non-GAAP measures presented by other companies. Our presentation of such measures, which may include adjustments to exclude unusual or non-recurring items, should not be construed as an inference that our future results will be unaffected by these or other unusual or non-recurring items. See the GAAP to Non-GAAP Reconciliation section for a reconciliation of these non-GAAP financial measures to the most directly comparable GAAP financial measures.
All third-party trademarks, including names, logos and brands, referenced by us in this presentation are property of their respective owners. All references to third-party trademarks are for identification purposes only. Such use should not be construed as an endorsement of our products or services.
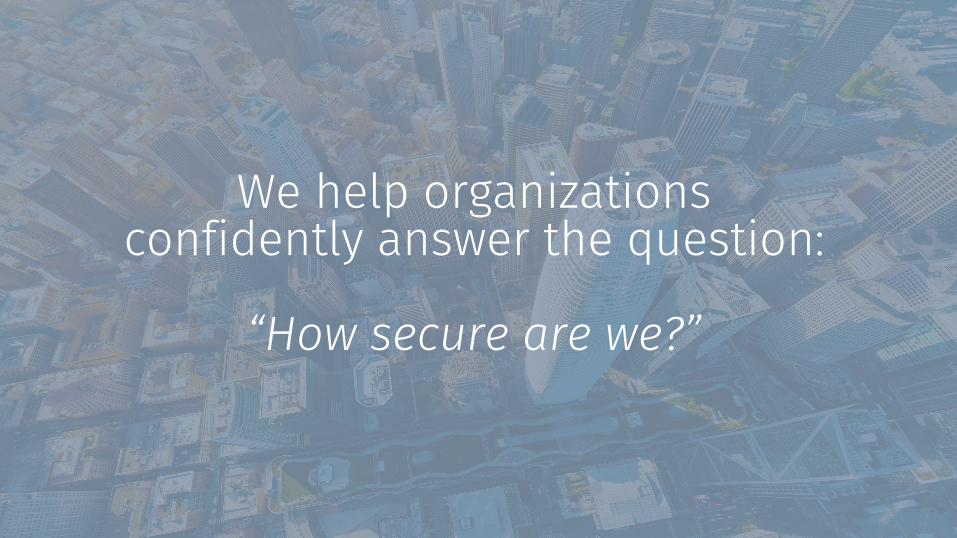
We help organizations confidently answer the question:
“How secure are we?”

506578
43066
092185
0121221
2539825
0131151
164194244
109158235
Tenable at a Glance
4
94% Q2 Recurring Rev. 82% Q2 Non-GAAP Gross Margin(2)
12% Q2 Free Cash Flow Margin(2)
1. Vulnerability Management: IDC Worldwide Device Vulnerability Management Market Shares 2019: Finding the Transitional Elements Between Device Assessment Scanning and Risk-Based Remediation" - May 20202. Refer to Appendix for the definitions of non-GAAP financial measures and a reconciliation from the GAAP measures to the non-GAAP measures.
$130.3 mm Q2 Rev.22% Rev. Growth
30K+ Customers50%+ of Fortune 500 30%+ of Global 2000
#1 Market Share in Vulnerability Management(1)
Category-leader in strategically important Cyber Exposure market with focus on enterprise customers
Holistic approach to Cyber Exposure focusing on measuring and managing cyber risk
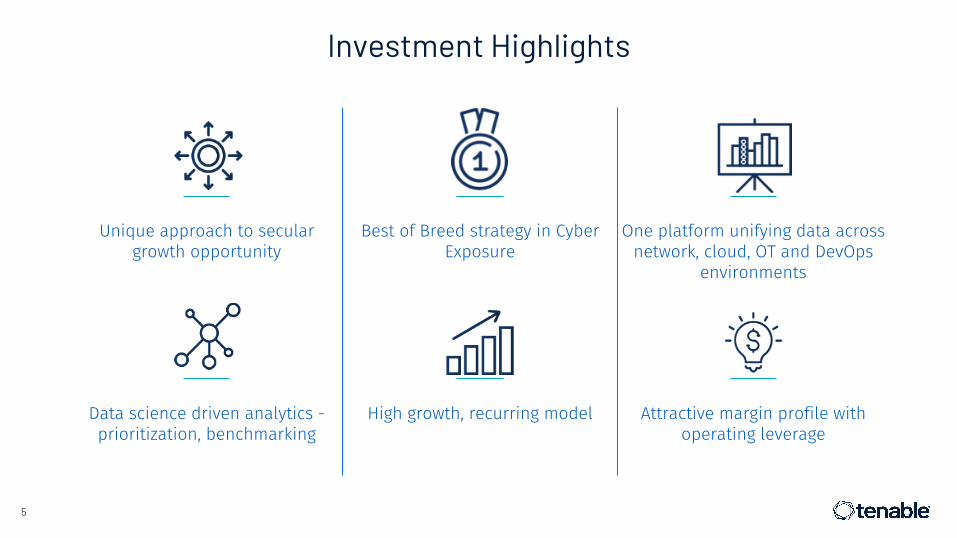
Investment Highlights
5
Unique approach to secular growth opportunity
Best of Breed strategy in Cyber Exposure
One platform unifying data across network, cloud, OT and DevOps
environments
Data science driven analytics - prioritization, benchmarking
High growth, recurring model Attractive margin profile with operating leverage
506578
43066
092185
0121221
2539825
0131151
164194244
109158235
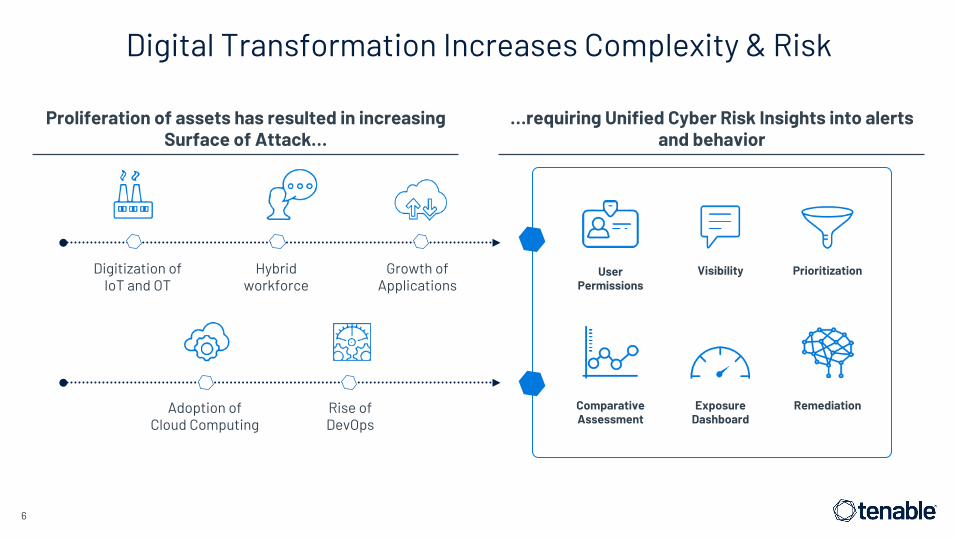
Digital Transformation Increases Complexity & Risk
6
Exposure Dashboard
PrioritizationVisibility
Comparative Assessment
Adoption of Cloud Computing
Rise ofDevOps
Growth of Applications
Digitization of IoT and OT
Hybridworkforce
User Permissions
Remediation
Proliferation of assets has resulted in increasing Surface of Attack…
…requiring Unified Cyber Risk Insights into alerts and behavior
506578
43066
092185
0121221
2539825
0131151
164194244
109158235
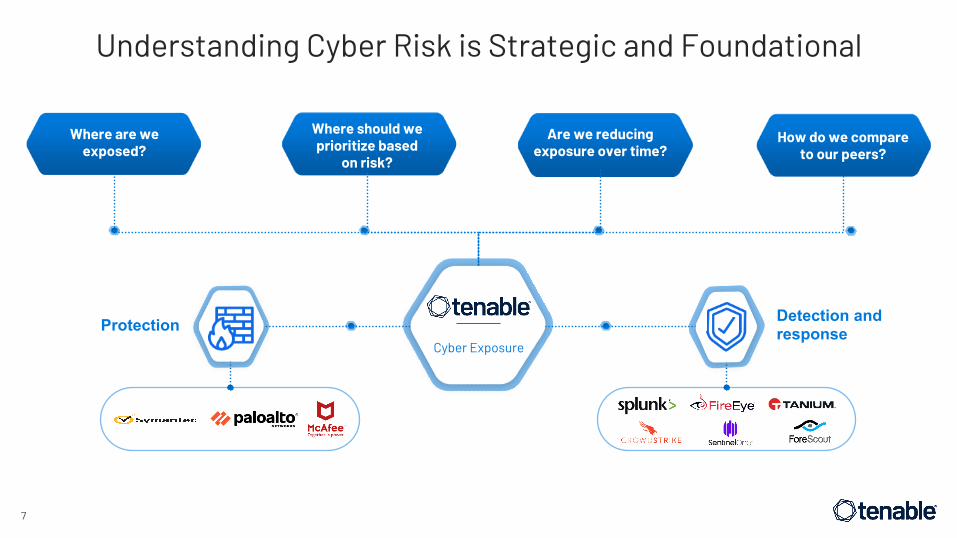
Understanding Cyber Risk is Strategic and Foundational
7
Where are we exposed?
Where should we prioritize based
on risk?
Are we reducing exposure over time?
How do we compare to our peers?
ProtectionCyber Exposure
Detection and response
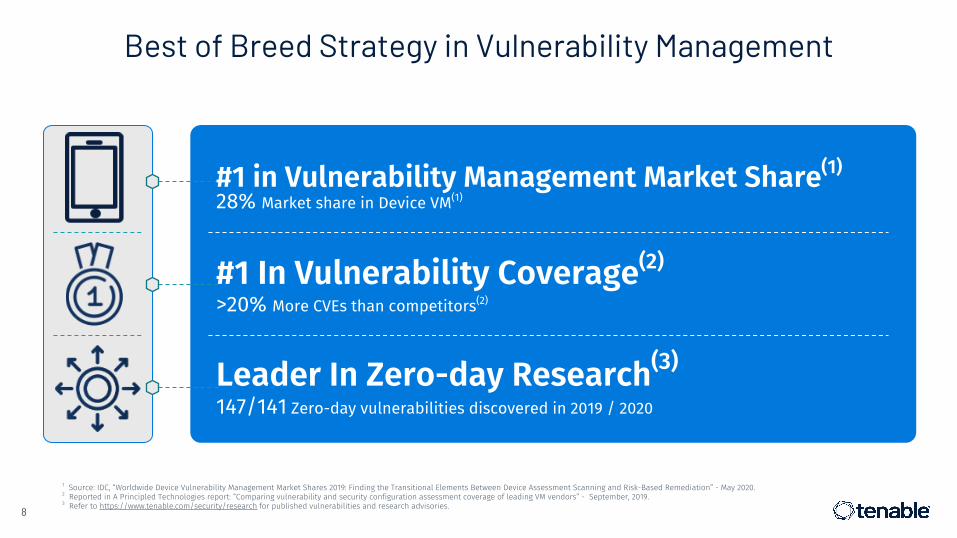
Best of Breed Strategy in Vulnerability Management
8
Leader In Zero-day Research(3)
147/141 Zero-day vulnerabilities discovered in 2019 / 2020
#1 In Vulnerability Coverage(2)
>20% More CVEs than competitors(2)
#1 in Vulnerability Management Market Share(1)
28% Market share in Device VM(1)
1 Source: IDC, “Worldwide Device Vulnerability Management Market Shares 2019: Finding the Transitional Elements Between Device Assessment Scanning and Risk-Based Remediation” - May 2020.2 Reported in A Principled Technologies report: “Comparing vulnerability and security configuration assessment coverage of leading VM vendors” - September, 2019.3 Refer to https://www.tenable.com/security/research for published vulnerabilities and research advisories.
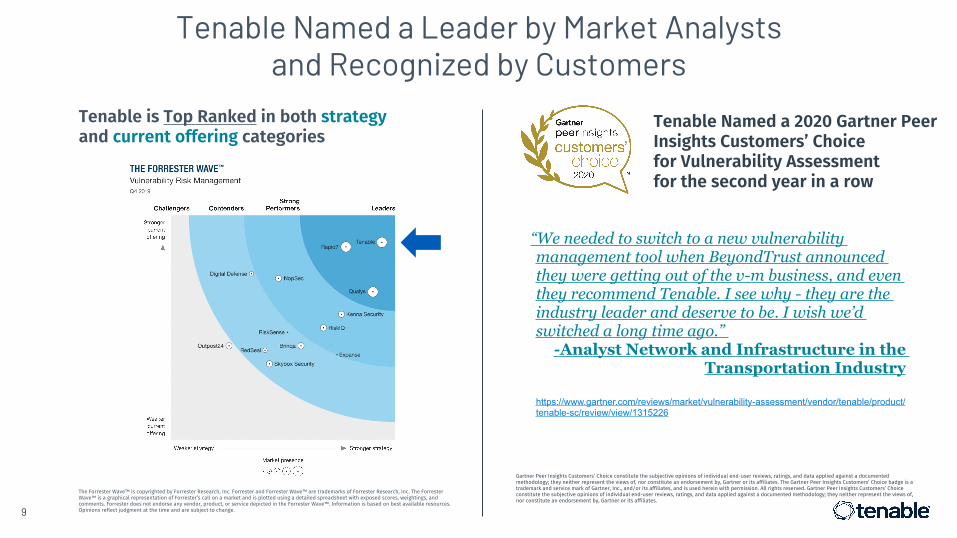
Tenable is Top Ranked in both strategy and current offering categories
The Forrester Wave™ is copyrighted by Forrester Research, Inc. Forrester and Forrester Wave™ are trademarks of Forrester Research, Inc. The Forrester Wave™ is a graphical representation of Forrester’s call on a market and is plotted using a detailed spreadsheet with exposed scores, weightings, and comments. Forrester does not endorse any vendor, product, or service depicted in the Forrester Wave™. Information is based on best available resources. Opinions reflect judgment at the time and are subject to change.
Tenable Named a 2020 Gartner Peer Insights Customers’ Choice for Vulnerability Assessment for the second year in a row
“We needed to switch to a new vulnerability management tool when BeyondTrust announced they were getting out of the v-m business, and even they recommend Tenable. I see why - they are the industry leader and deserve to be. I wish we’d switched a long time ago.”
-Analyst Network and Infrastructure in the Transportation Industry
https://www.gartner.com/reviews/market/vulnerability-assessment/vendor/tenable/product/tenable-sc/review/view/1315226
Tenable Named a Leader by Market Analysts and Recognized by Customers
9
Gartner Peer Insights Customers’ Choice constitute the subjective opinions of individual end-user reviews, ratings, and data applied against a documented methodology; they neither represent the views of, nor constitute an endorsement by, Gartner or its affiliates. The Gartner Peer Insights Customers’ Choice badge is a trademark and service mark of Gartner, Inc., and/or its affiliates, and is used herein with permission. All rights reserved. Gartner Peer Insights Customers’ Choice constitute the subjective opinions of individual end-user reviews, ratings, and data applied against a documented methodology; they neither represent the views of, nor constitute an endorsement by, Gartner or its affiliates.
506578
43066
092185
0121221
2539825
0131151
164194244
109158235
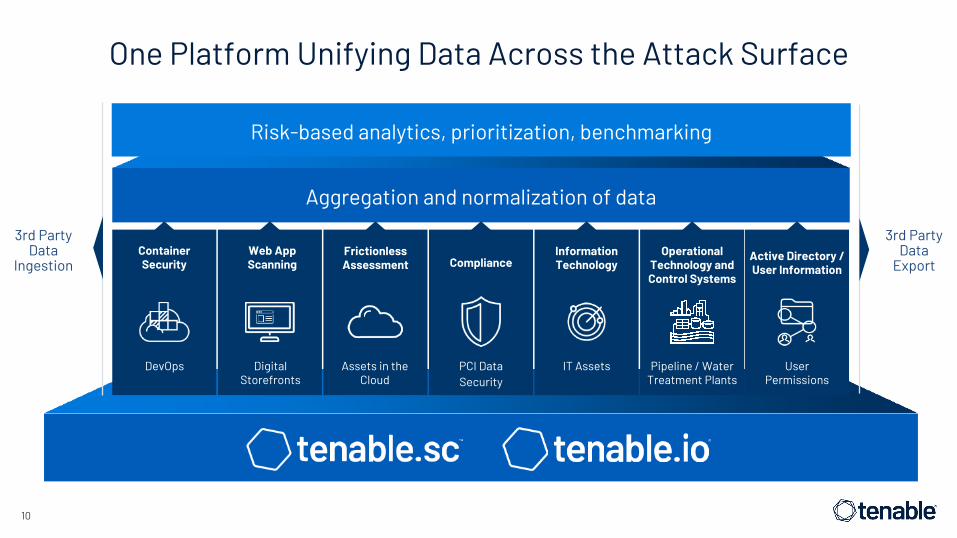
3rd Party Data
Ingestion
One Platform Unifying Data Across the Attack Surface
3rd Party Data
Export
10
Aggregation and normalization of data
Risk-based analytics, prioritization, benchmarking
DevOps
Container Security
Digital Storefronts
Web App Scanning
Assets in the Cloud
Frictionless Assessment
PCI Data Security
Compliance
IT Assets
Information Technology
Pipeline / Water Treatment Plants
Operational Technology and Control Systems
User Permissions
Active Directory / User Information
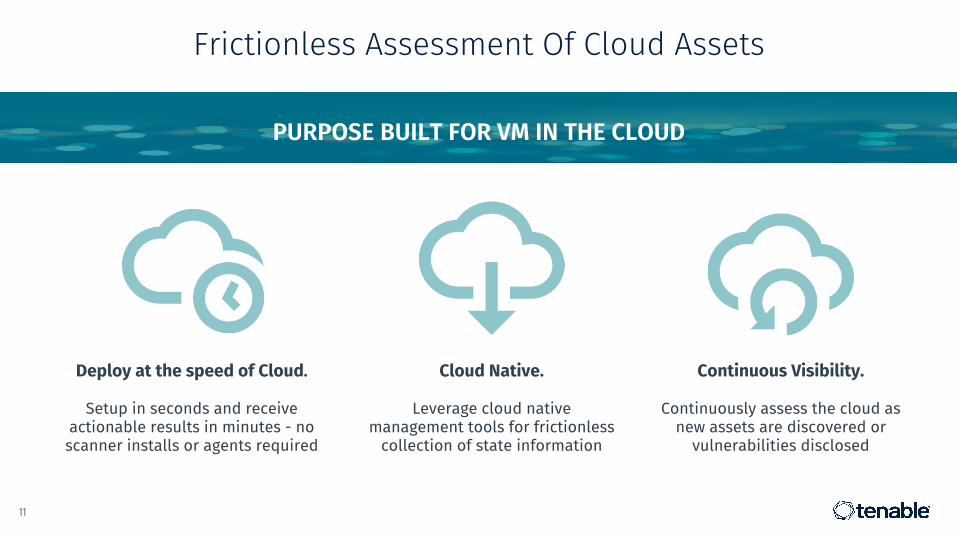
Frictionless Assessment Of Cloud Assets
11
PURPOSE BUILT FOR VM IN THE CLOUD
Deploy at the speed of Cloud.
Setup in seconds and receive actionable results in minutes - no scanner installs or agents required
Cloud Native.
Leverage cloud native management tools for frictionless
collection of state information
Continuous Visibility.
Continuously assess the cloud as new assets are discovered or
vulnerabilities disclosed
506578
43066
092185
0121221
2539825
0131151
164194244
109158235
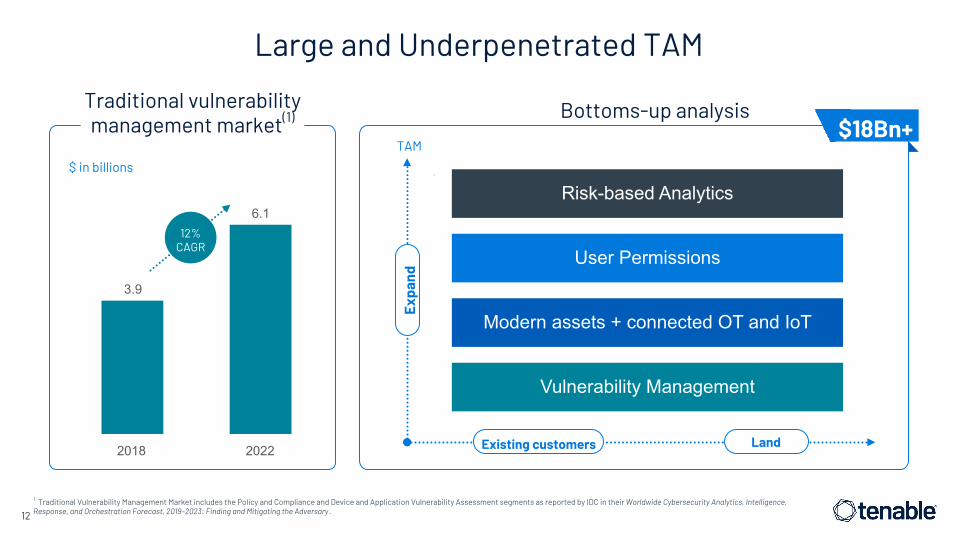
Large and Underpenetrated TAM
12
$ in billions
Bottoms-up analysisTAM
12% CAGR
Traditional vulnerability management market(1)
Expa
nd
$18Bn+
LandExisting customers
1 Traditional Vulnerability Management Market includes the Policy and Compliance and Device and Application Vulnerability Assessment segments as reported by IDC in their Worldwide Cybersecurity Analytics, Intelligence, Response, and Orchestration Forecast, 2019–2023: Finding and Mitigating the Adversary .
Risk-based Analytics
User Permissions
Modern assets + connected OT and IoT
Vulnerability Management
3.9
6.1
2018 2022
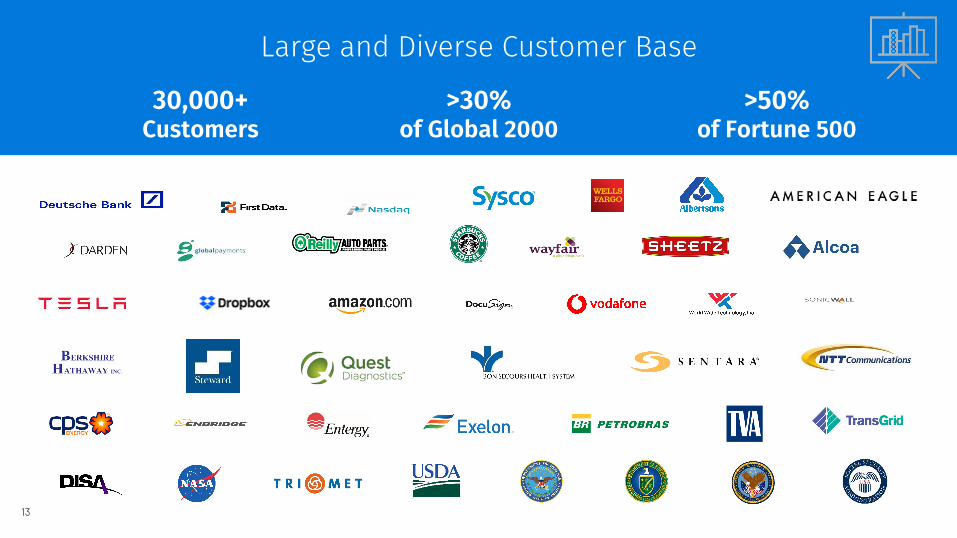
13
Large and Diverse Customer Base
30,000+ Customers
>30% of Global 2000
>50% of Fortune 500
13
USDA DOD DOE VA SSA
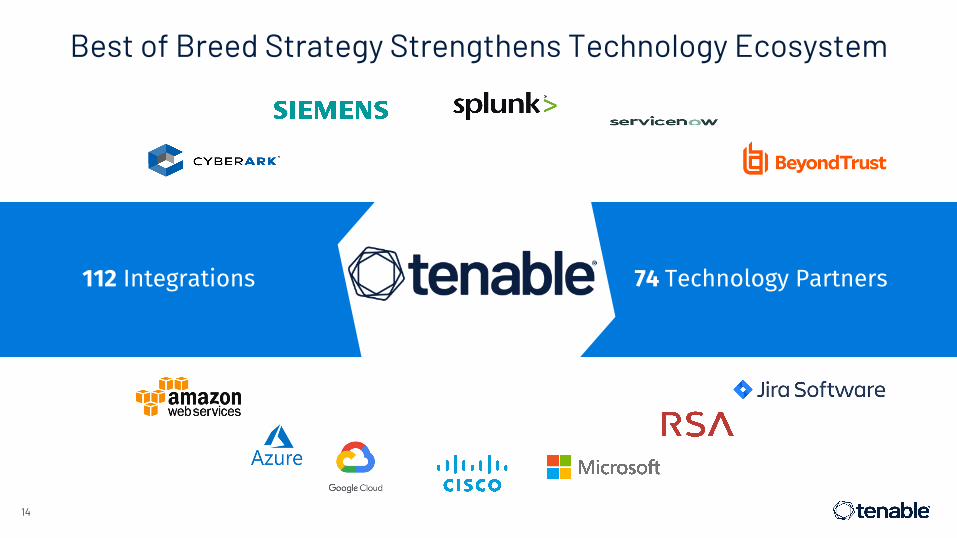
Best of Breed Strategy Strengthens Technology Ecosystem
14
112 Integrations 74 Technology Partners
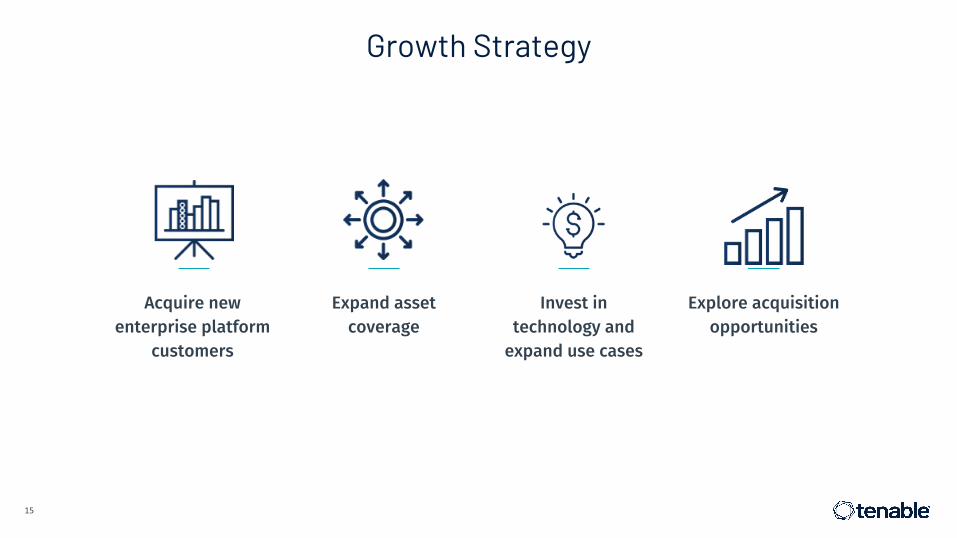
Growth Strategy
15
Acquire new enterprise platform
customers
Expand asset coverage
Invest in technology and
expand use cases
Explore acquisition opportunities
15
506578
43066
092185
0121221
2539825
0131151
164194244
109158235
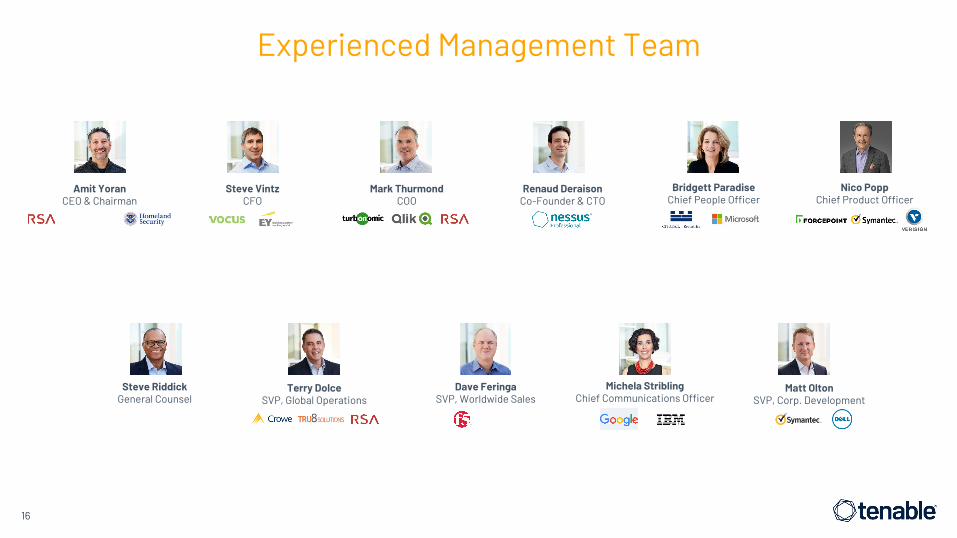
Bridgett ParadiseChief People Officer
Renaud Deraison Co-Founder & CTO
Experienced Management Team
16
Amit YoranCEO & Chairman
Mark ThurmondCOO
Steve VintzCFO
Matt OltonSVP, Corp. Development
Michela StriblingChief Communications Officer
Nico PoppChief Product Officer
Dave FeringaSVP, Worldwide Sales
Terry DolceSVP, Global Operations
Steve RiddickGeneral Counsel
17
Financial Overview
506578
43066
092185
0121221
2539825
0131151
164194244
109158235
Key Business Model Highlights
18
Rapid revenue growth via
attractive, recurring model
Balanced and diversified business
mix
Strong land and expand dynamic
Balanced philosophy between
growth and profitability
506578
43066
092185
0121221
2539825
0131151
164194244
109158235
Revenue
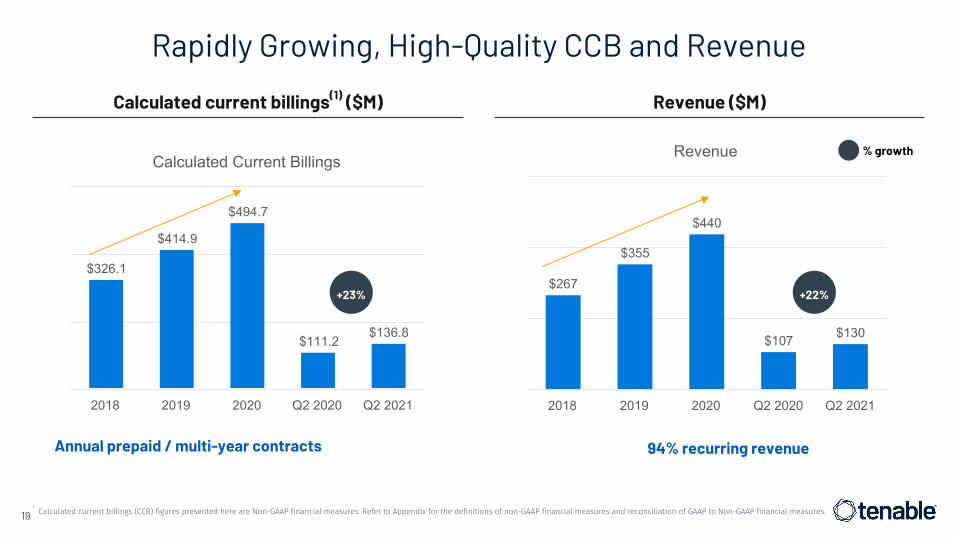
$267
$355
$440
$107 $130
2018 2019 2020 Q2 2020 Q2 2021
Calculated Current Billings
$326.1
$414.9
$494.7
$111.2$136.8
2018 2019 2020 Q2 2020 Q2 2021
Rapidly Growing, High-Quality CCB and Revenue
19
Revenue ($M)
94% recurring revenueAnnual prepaid / multi-year contracts
¹ Calculated current billings (CCB) figures presented here are Non-GAAP financial measures. Refer to Appendix for the definitions of non-GAAP financial measures and reconciliation of GAAP to Non-GAAP financial measures.
Calculated current billings(1) ($M)
% growth
+23% +22%

Attractive Composition of Revenue
20
Q2 2021 Revenue by Geography
Americas65%
EMEA24%
APAC11%
Recurring Revenue
93% 94%
Q2 2020 Q2 2021
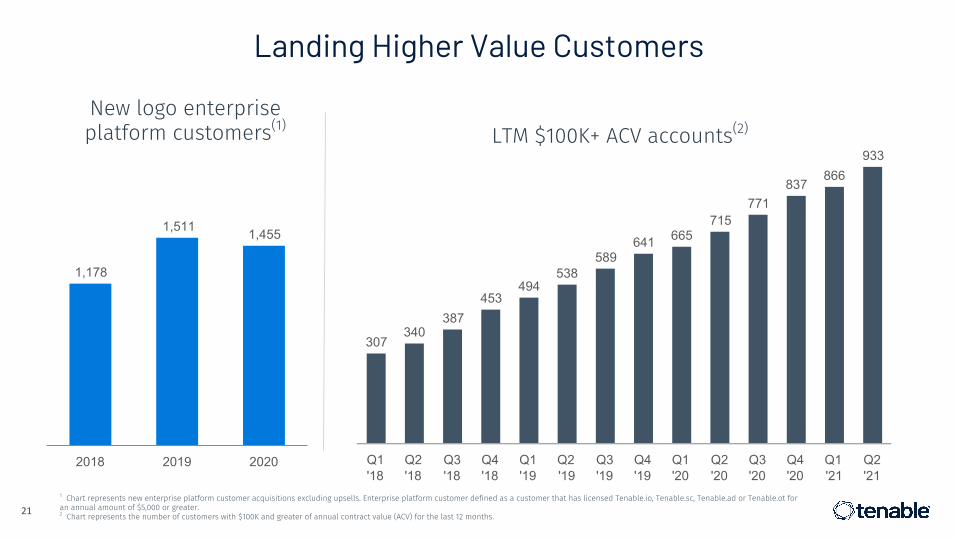
Landing Higher Value Customers
21
1 Chart represents new enterprise platform customer acquisitions excluding upsells. Enterprise platform customer defined as a customer that has licensed Tenable.io, Tenable.sc, Tenable.ad or Tenable.ot for an annual amount of $5,000 or greater.2 Chart represents the number of customers with $100K and greater of annual contract value (ACV) for the last 12 months.
New logo enterprise platform customers(1) LTM $100K+ ACV accounts(2)
307340
387453
494538
589641 665
715771
837866
933
Q1'18
Q2'18
Q3'18
Q4'18
Q1'19
Q2'19
Q3'19
Q4'19
Q1'20
Q2'20
Q3'20
Q4'20
Q1'21
Q2'21
1,178
1,511 1,455
2018 2019 2020
506578
43066
092185
0121221
2539825
0131151
164194244
109158235
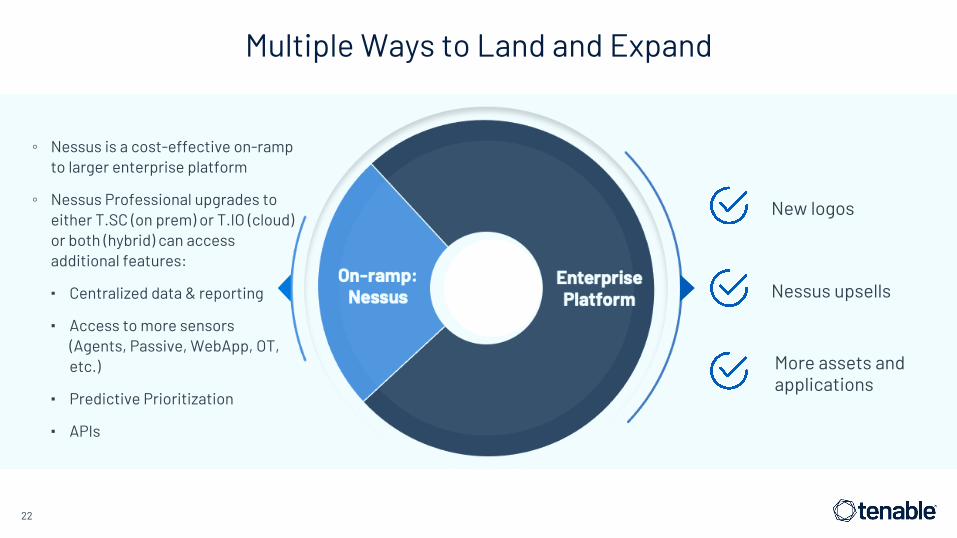
Multiple Ways to Land and Expand
22
◦ Nessus is a cost-effective on-ramp to larger enterprise platform
◦ Nessus Professional upgrades to either T.SC (on prem) or T.IO (cloud) or both (hybrid) can access additional features:
▪ Centralized data & reporting
▪ Access to more sensors (Agents, Passive, WebApp, OT, etc.)
▪ Predictive Prioritization
▪ APIs
Nessus upsells
New logos
More assets and applications
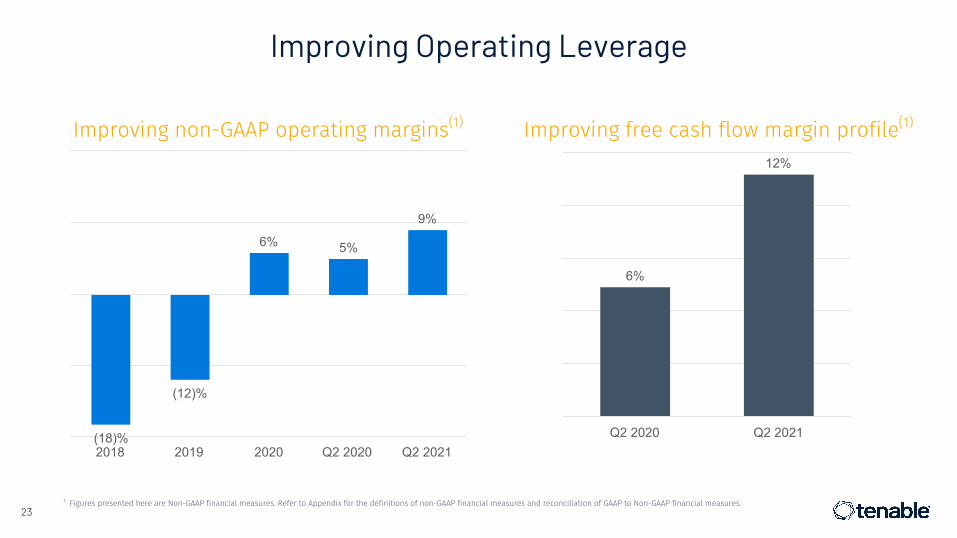
Improving Operating Leverage
231 Figures presented here are Non-GAAP financial measures. Refer to Appendix for the definitions of non-GAAP financial measures and reconciliation of GAAP to Non-GAAP financial measures.
Improving non-GAAP operating margins(1) Improving free cash flow margin profile(1)
(18)%
(12)%
6% 5%
9%
2018 2019 2020 Q2 2020 Q2 2021
6%
12%
Q2 2020 Q2 2021
24
Appendix
Non-GAAP Reconciliations
25
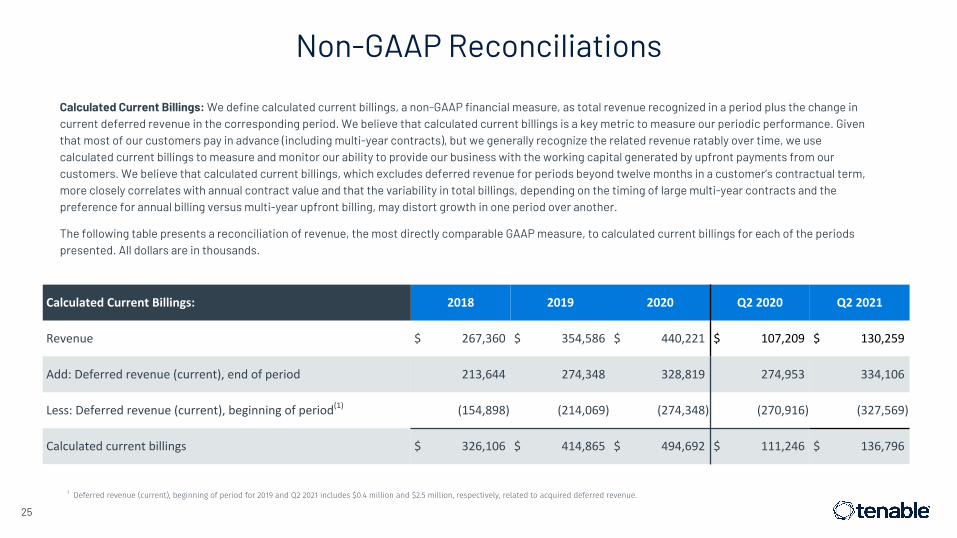
Calculated Current Billings: We define calculated current billings, a non-GAAP financial measure, as total revenue recognized in a period plus the change in current deferred revenue in the corresponding period. We believe that calculated current billings is a key metric to measure our periodic performance. Given that most of our customers pay in advance (including multi-year contracts), but we generally recognize the related revenue ratably over time, we use calculated current billings to measure and monitor our ability to provide our business with the working capital generated by upfront payments from our customers. We believe that calculated current billings, which excludes deferred revenue for periods beyond twelve months in a customer’s contractual term, more closely correlates with annual contract value and that the variability in total billings, depending on the timing of large multi-year contracts and the preference for annual billing versus multi-year upfront billing, may distort growth in one period over another.
The following table presents a reconciliation of revenue, the most directly comparable GAAP measure, to calculated current billings for each of the periods presented. All dollars are in thousands.
CalculatedCurrentBillings: 2018 2019 2020 Q22020 Q22021
Revenue $ 267,360 $ 354,586 $ 440,221 $ 107,209 $ 130,259
Add:Deferredrevenue(current),endofperiod 213,644 274,348 328,819 274,953 334,106
Less:Deferredrevenue(current),beginningofperiod(1) (154,898) (214,069) (274,348) (270,916) (327,569)
Calculatedcurrentbillings $ 326,106 $ 414,865 $ 494,692 $ 111,246 $ 136,796
1 Deferred revenue (current), beginning of period for 2019 and Q2 2021 includes $0.4 million and $2.5 million, respectively, related to acquired deferred revenue.
Non-GAAP Reconciliations (continued)
26
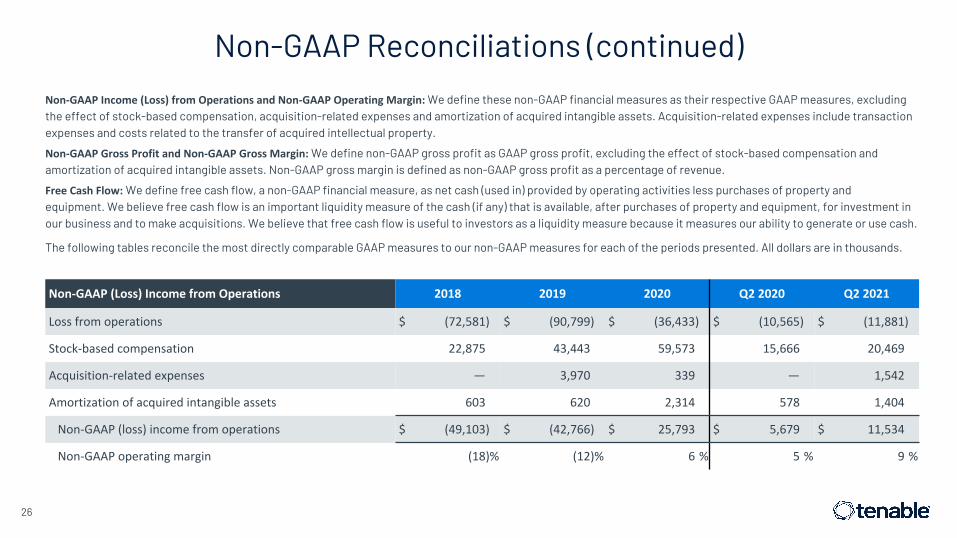
Non-GAAPIncome(Loss)fromOperationsandNon-GAAPOperatingMargin:We define these non-GAAP financial measures as their respective GAAP measures, excluding the effect of stock-based compensation, acquisition-related expenses and amortization of acquired intangible assets. Acquisition-related expenses include transaction expenses and costs related to the transfer of acquired intellectual property.
Non-GAAPGrossProfitandNon-GAAPGrossMargin:We define non-GAAP gross profit as GAAP gross profit, excluding the effect of stock-based compensation and amortization of acquired intangible assets. Non-GAAP gross margin is defined as non-GAAP gross profit as a percentage of revenue.
FreeCashFlow:We define free cash flow, a non-GAAP financial measure, as net cash (used in) provided by operating activities less purchases of property and equipment. We believe free cash flow is an important liquidity measure of the cash (if any) that is available, after purchases of property and equipment, for investment in our business and to make acquisitions. We believe that free cash flow is useful to investors as a liquidity measure because it measures our ability to generate or use cash.
The following tables reconcile the most directly comparable GAAP measures to our non-GAAP measures for each of the periods presented. All dollars are in thousands.
Non-GAAP(Loss)IncomefromOperations 2018 2019 2020 Q22020 Q22021
Lossfromoperations $ (72,581) $ (90,799) $ (36,433) $ (10,565) $ (11,881)
Stock-basedcompensation 22,875 43,443 59,573 15,666 20,469
Acquisition-relatedexpenses — 3,970 339 — 1,542
Amortizationofacquiredintangibleassets 603 620 2,314 578 1,404
Non-GAAP(loss)incomefromoperations $ (49,103) $ (42,766) $ 25,793 $ 5,679 $ 11,534
Non-GAAPoperatingmargin (18)% (12)% 6% 5% 9%

Non-GAAPGrossProfit Q22021
GrossProfit $ 103,834
Stock-basedcompensation(1) 1,202
Amortizationofacquiredintangibleassets 1,404
Non-GAAPgrossprofit $ 106,440
Non-GAAPgrossmargin 82%
Non-GAAP Reconciliations (continued)
27
Non-GAAPGeneral&AdministrativeExpense
2019 Q22019 Q22020
Generalandadministrativeexpense $69,468 $15,987 $17,879
Less:Stock-basedcompensation 15,683 3,975 5,568
Less:Acquisition-relatedexpenses 3,970 – –
Non-GAAPgeneralandadministrativeexpense
$49,815 $12,012 $12,311
Non-GAAPgeneralandadministrativeexpense%ofrevenue
14% 14% 11%
Non-GAAPSalesandMarketingExpense 2019 Q22019 Q22020
Salesandmarketingexpense $228,035 $56,015 $55,443
Less:Stock-basedcompensation 16,032 4,215 5,375
Non-GAAPsalesandmarketingexpense $212,003 $51,800 $50,068
Non-GAAPsalesandmarketingexpense%ofrevenue
60% 61% 47%
Non-GAAPResearchandDevelopmentExpense
2019 Q22019 Q22020
Researchanddevelopmentexpense $87,064 $21,698 $25,310
Less:Stock-basedcompensation 8,911 2,441 3,893
Non-GAAPresearchanddevelopmentexpense
$78,153 $19,257 $21,417
Non-GAAPresearchanddevelopmentexpense%ofrevenue
22% 23% 20%
FreeCashFlow Q22020 Q22021
Netcashprovidedbyoperatingactivities $ 16,999 $ 16,535
Purchasesofpropertyandequipment (10,390) (1,534)
Freecashflow(2) $ 6,609 $ 15,001
Freecashflowmargin 6% 12%
Freecashflowwasimpactedby:
Employeestockpurchaseplanactivity $ 3.3 $ 3.1
Acquisition-relatedexpenses — (1.6)
Proceedsfromleaseincentives 8.6 —
Capitalexpenditures-newheadquarters (9.7) (0.6)
1 Cost of revenue portion of total stock-based compensation2 Free cash flow for Q2 2021 was benefited by approximately $5 million as a result of the accelerated timing of payments for insurance, professional fees and rent in the three months ended December 31, 2020.