17 q2 earnings deck
TRANSCRIPT

Malibu Boats, Inc.Second Quarter Fiscal 2017
Earnings ResultsFebruary 1, 2017
Safe Harbor StatementThis presentation includes forward-looking statements (as such term is defined in the Private Securities Litigation Reform Act of 1995). Forward-looking statements canbe identified by such words and phrases as “believes,” “anticipates,” “expects,” “intends,” “estimates,” “may,” “will,” “should,” “continue” and similar expressions, comparableterminology or the negative thereof, and includes the statement in this presentation regarding the expected demand and outlook for our product.
Forward-looking statements are subject to risks and uncertainties that could cause actual results to differ materially from those expressed or implied in the forward-looking statements, including, but not limited to: general industry, economic and business conditions, demand for our products, changes in consumer preferences,competition within our industry, our reliance on our network of independent dealers, our ability to manage our manufacturing levels and our large fixed cost base, thesuccessful introduction of our new products, and other factors affecting us detailed from time to time in our filings with the Securities and Exchange Commission. Manyof these risks and uncertainties are outside our control, and there may be other risks and uncertainties which we do not currently anticipate because they relate to eventsand depend on circumstances that may or may not occur in the future. Although we believe that the expectations reflected in any forward-looking statements are basedon reasonable assumptions at the time made, we can give no assurance that our expectations will be achieved. Undue reliance should not be placed on these forward-looking statements, which speak only as of the date hereof. We undertake no obligation (and we expressly disclaim any obligation) to update or supplement any forward-looking statements that may become untrue because of subsequent events, whether because of new information, future events, changes in assumptions or otherwise.Comparison of results for current and prior periods are not intended to express any future trends or indications of future performance, unless expressed as such, andshould only be viewed as historical data.
2
Use and Definition of Non-GAAP Financial MeasuresThis release includes the following financial measures defined as non-GAAP financial measures by the SEC: Adjusted EBITDA, Adjusted EBITDA Margin, and Adjusted FullyDistributed Net Income. These measures have limitations as analytical tools and should not be considered as an alternative to, or more meaningful than, net income asdetermined in accordance with GAAP or as an indicator of our liquidity. Certain items excluded from Adjusted EBITDA are significant components in understanding and assessinga company’s financial performance, such as a company’s cost of capital and tax structure, as well as the historical costs of depreciable assets. Our presentation of these non-GAAP financial measures should also not be construed as an inference that our results will be unaffected by unusual or non-recurring items. Our computations of these non-GAAP financial measures may not be comparable to other similarly titled measures of other companies.
We define Adjusted EBITDA as earnings before interest expense, income taxes, depreciation, amortization and non-cash, non-recurring or non-operating expenses, includingcertain professional fees, acquisition and integration related expenses, non-cash compensation expense and certain product development costs. We define Adjusted EBITDAMargin as Adjusted EBITDA divided by net sales. Adjusted EBITDA and Adjusted EBITDA Margin are not measures of net income as determined by GAAP. Managementbelieves Adjusted EBITDA and Adjusted EBITDA Margin are useful because they allow management to evaluate our operating performance and compare the results of ouroperations from period to period and against our peers without regard to our financing methods, capital structure and non-recurring or non-operating expenses. We excludethe items listed above from net income in arriving at Adjusted EBITDA because these amounts can vary substantially from company to company within our industry dependingupon accounting methods and book values of assets, capital structures, the methods by which assets were acquired and other factors.
We define Adjusted Fully Distributed Net Income as net income attributable to Malibu Boats, Inc. (i) excluding income tax expense, (ii) excluding the effect of non-recurring ornon-cash items, (iii) assuming the exchange of all Units ("LLC Units") of Malibu Boats Holdings, LLC (the "LLC") into shares of Class A common stock, which results in theelimination of noncontrolling interest in the LLC, and (iv) reflecting an adjustment for income tax expense on fully distributed net income before income taxes (assuming noincome attributable to non-controlling interests) at our estimated effective income tax rate. Adjusted Fully Distributed Net Income is a non-GAAP financial measure because itrepresents net income attributable to Malibu Boats, Inc, before non-recurring or non-cash items and the effects of noncontrolling interests in the LLC. We use Adjusted FullyDistributed Net Income to facilitate a comparison of our operating performance on a consistent basis from period to period that, when viewed in combination with our resultsprepared in accordance with GAAP, provides a more complete understanding of factors and trends affecting our business than GAAP measures alone. We believe AdjustedFully Distributed Net Income assists our board of directors, management and investors in comparing our net income on a consistent basis from period to period because itremoves non-cash or non-recurring items, and eliminates the variability of noncontrolling interest as a result of member exchanges of LLC Units into shares of Class A CommonStock. In addition, because Adjusted Fully Distributed Net Income is susceptible to varying calculations, the Adjusted Fully Distributed Net Income measures, as presented inthis release, may differ from and may, therefore, not be comparable to similarly titled measures used by other companies.
A reconciliation of our net income as determined in accordance with GAAP to Adjusted EBITDA and Adjusted EBITDA Margin, and of our net income attributable to MalibuBoats, Inc. to Adjusted Fully Distributed Net Income is provided under "Reconciliation of Non-GAAP Financial Measures".
3

Jack SpringerChief Executive Officer
MALIBU BOATS, INC.
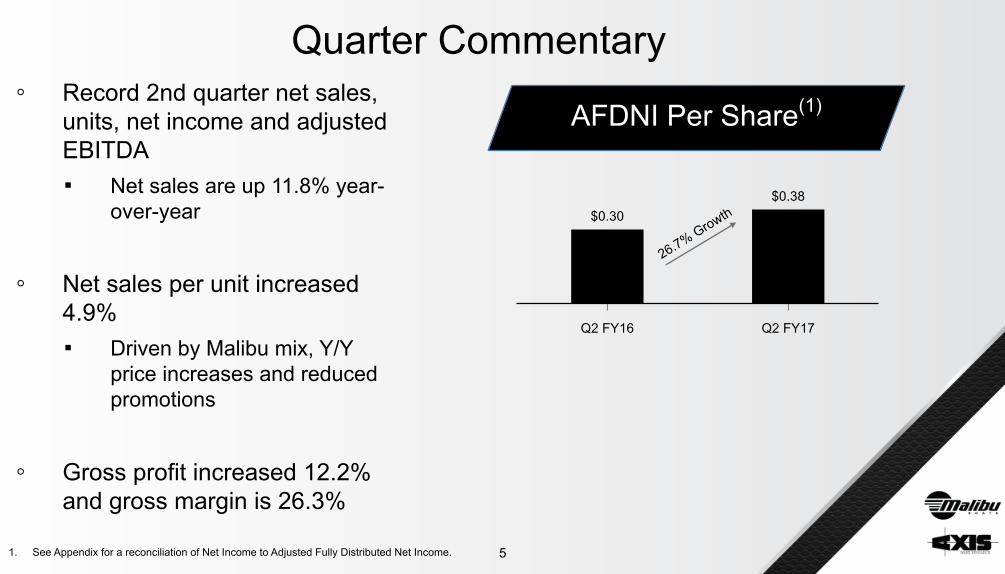
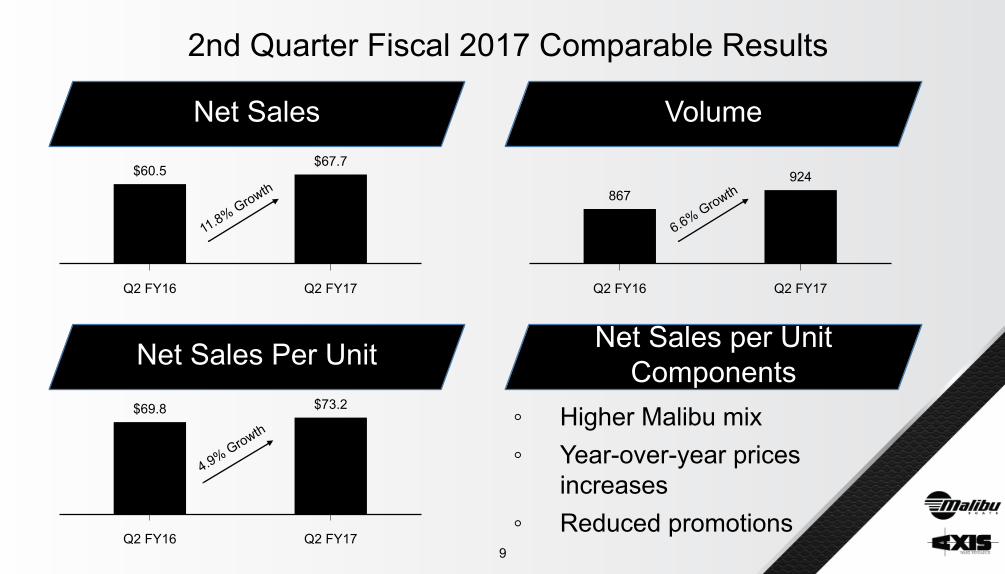
Quarter Commentary◦ Record 2nd quarter net sales,
units, net income and adjustedEBITDA ▪ Net sales are up 11.8% year-
over-year
◦ Net sales per unit increased4.9% ▪ Driven by Malibu mix, Y/Y
price increases and reducedpromotions
◦ Gross profit increased 12.2%and gross margin is 26.3%
1. See Appendix for a reconciliation of Net Income to Adjusted Fully Distributed Net Income.
Q2 FY16 Q2 FY17
$0.30$0.38
26.7% Growth
5
AFDNI Per Share(1)
1. Source: Statistical Surveys, Inc. (“SSI”).
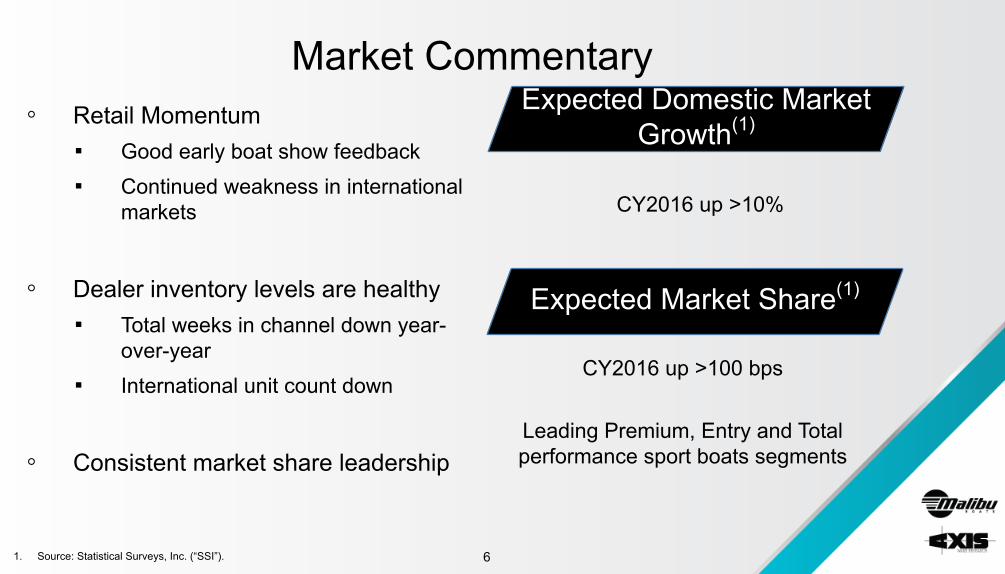
Market Commentary◦ Retail Momentum
▪ Good early boat show feedback▪ Continued weakness in international
markets
◦ Dealer inventory levels are healthy▪ Total weeks in channel down year-
over-year▪ International unit count down
◦ Consistent market share leadership
CY2016 up >10%
CY2016 up >100 bps
Leading Premium, Entry and Totalperformance sport boats segments
6
Expected Domestic MarketGrowth(1)
Expected Market Share(1)
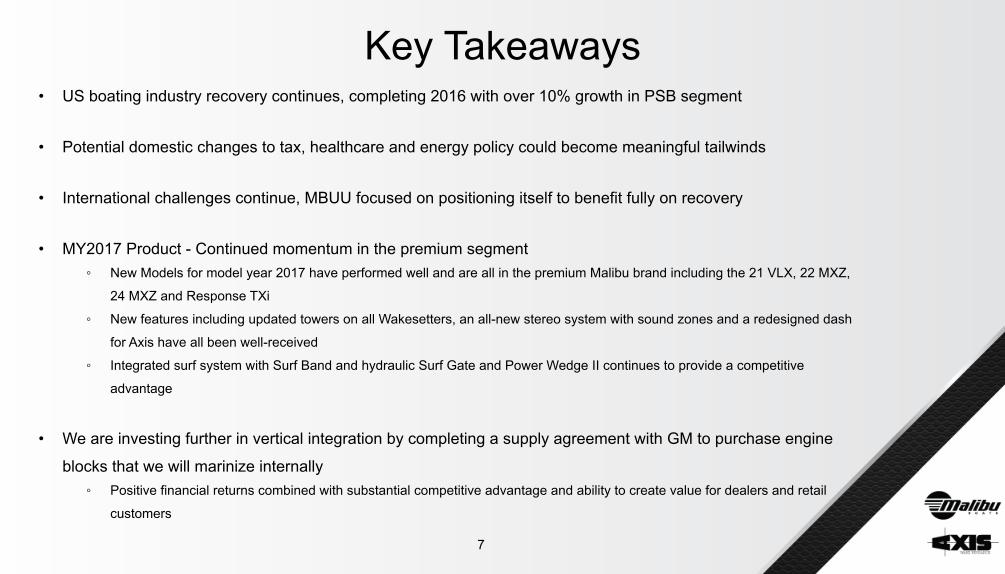
Key Takeaways• US boating industry recovery continues, completing 2016 with over 10% growth in PSB segment
• Potential domestic changes to tax, healthcare and energy policy could become meaningful tailwinds
• International challenges continue, MBUU focused on positioning itself to benefit fully on recovery
• MY2017 Product - Continued momentum in the premium segment◦ New Models for model year 2017 have performed well and are all in the premium Malibu brand including the 21 VLX, 22 MXZ,
24 MXZ and Response TXi
◦ New features including updated towers on all Wakesetters, an all-new stereo system with sound zones and a redesigned dash
for Axis have all been well-received
◦ Integrated surf system with Surf Band and hydraulic Surf Gate and Power Wedge II continues to provide a competitive
advantage
• We are investing further in vertical integration by completing a supply agreement with GM to purchase engine
blocks that we will marinize internally◦ Positive financial returns combined with substantial competitive advantage and ability to create value for dealers and retail
customers
7

Wayne WilsonChief Financial Officer
MALIBU BOATS, INC.
Q2 FY16 Q2 FY17
867924
Q2 FY16 Q2 FY17
$69.8 $73.2
2nd Quarter Fiscal 2017 Comparable Results
◦ Higher Malibu mix◦ Year-over-year prices
increases◦ Reduced promotions
Q2 FY16 Q2 FY17
$60.5$67.7
11.8% Growth
Net Sales Volume
Net Sales per UnitComponents
4.9% Growth
Net Sales Per Unit
9
6.6% Growth
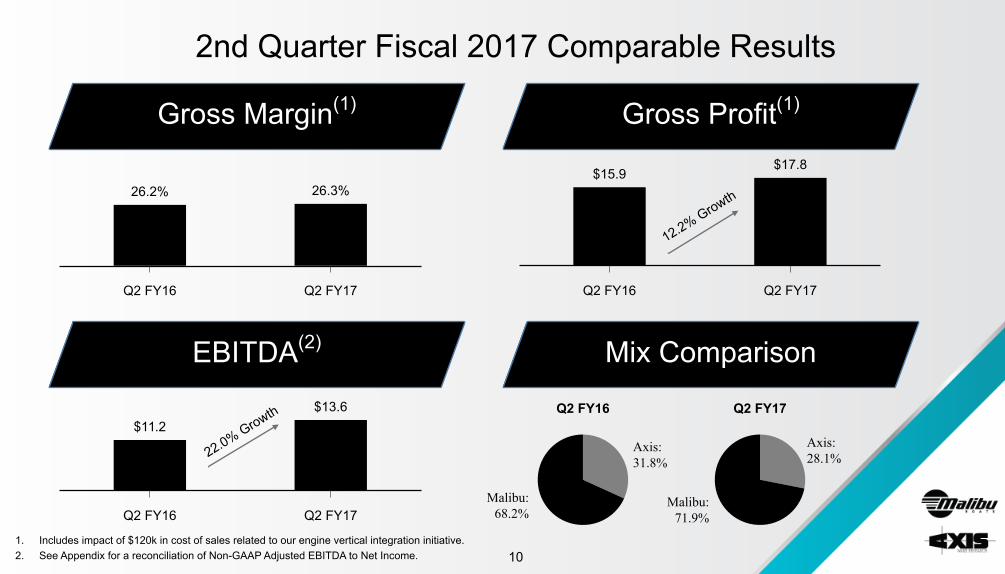
2nd Quarter Fiscal 2017 Comparable Results
Q2 FY16 Q2 FY17
26.2% 26.3%
Gross Margin(1)
Q2 FY16 Q2 FY17
$15.9$17.8
12.2% Growth
Gross Profit(1)
Q2 FY16 Q2 FY17
$11.2$13.6
22.0% Growth
EBITDA(2) Mix Comparison
1. Includes impact of $120k in cost of sales related to our engine vertical integration initiative. 2. See Appendix for a reconciliation of Non-GAAP Adjusted EBITDA to Net Income.
Q2 FY17
Axis:28.1%
Malibu:71.9%
Q2 FY16
Axis:31.8%
Malibu:68.2%
10
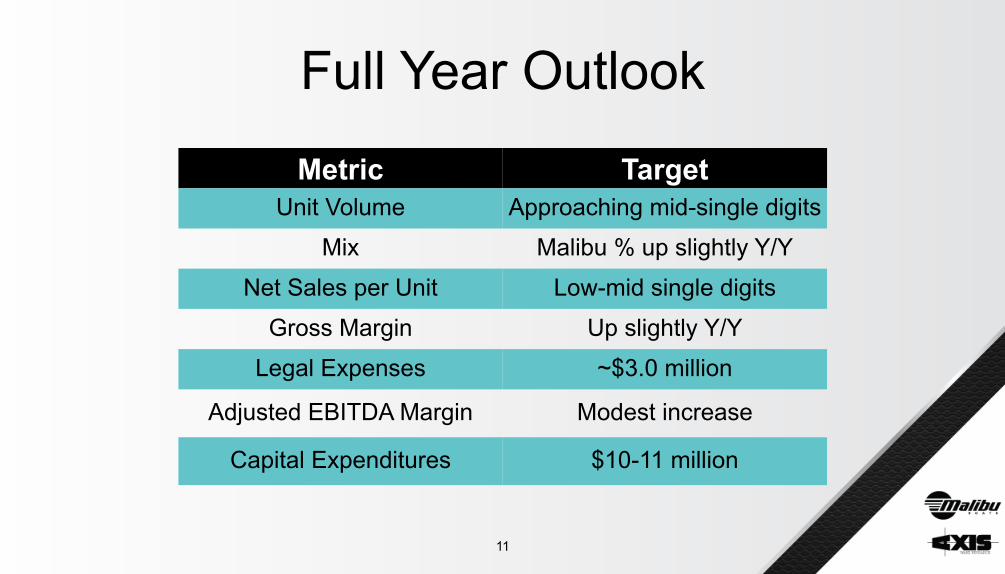
Full Year Outlook
Metric TargetUnit Volume Approaching mid-single digits
Mix Malibu % up slightly Y/Y
Net Sales per Unit Low-mid single digits
Gross Margin Up slightly Y/Y
Legal Expenses ~$3.0 million
Adjusted EBITDA Margin Modest increase
Capital Expenditures $10-11 million
11

Appendix
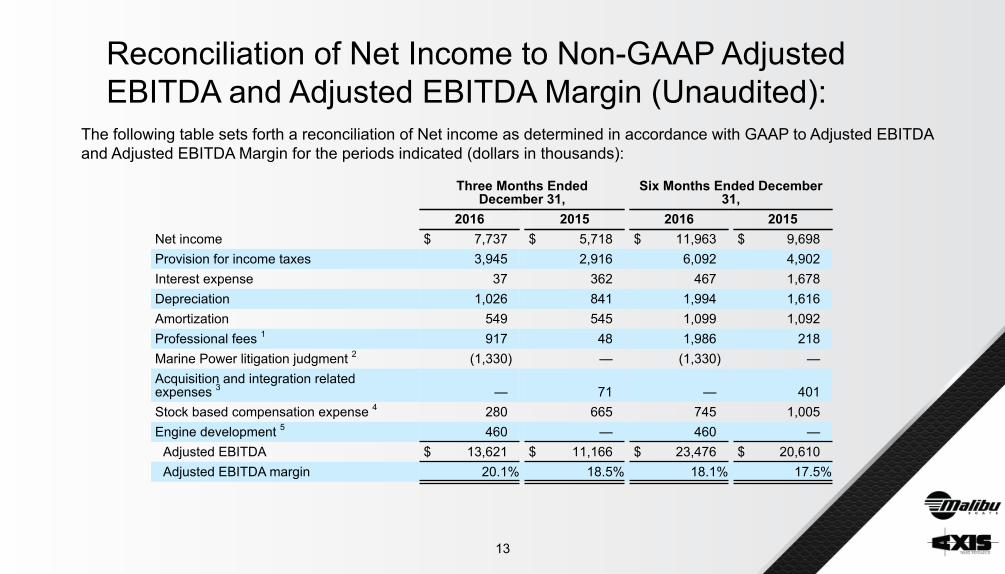
Reconciliation of Net Income to Non-GAAP AdjustedEBITDA and Adjusted EBITDA Margin (Unaudited):
The following table sets forth a reconciliation of Net income as determined in accordance with GAAP to Adjusted EBITDAand Adjusted EBITDA Margin for the periods indicated (dollars in thousands):
13
Three Months EndedDecember 31,
Six Months Ended December31,
2016 2015 2016 2015Net income $ 7,737 $ 5,718 $ 11,963 $ 9,698Provision for income taxes 3,945 2,916 6,092 4,902Interest expense 37 362 467 1,678Depreciation 1,026 841 1,994 1,616Amortization 549 545 1,099 1,092Professional fees 1 917 48 1,986 218Marine Power litigation judgment 2 (1,330) — (1,330) —Acquisition and integration relatedexpenses 3 — 71 — 401Stock based compensation expense 4 280 665 745 1,005Engine development 5 460 — 460 —
Adjusted EBITDA $ 13,621 $ 11,166 $ 23,476 $ 20,610Adjusted EBITDA margin 20.1% 18.5% 18.1% 17.5%
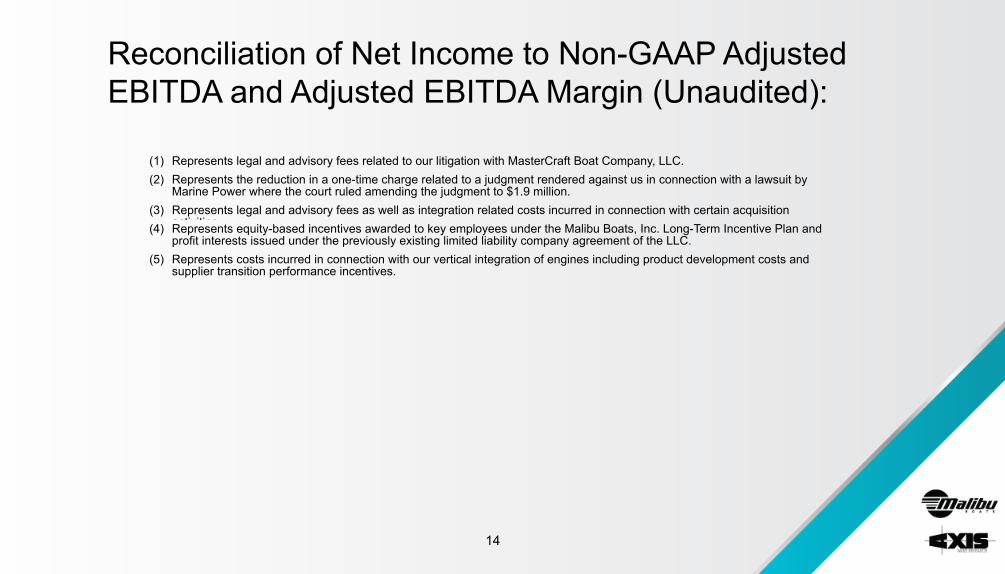
Reconciliation of Net Income to Non-GAAP AdjustedEBITDA and Adjusted EBITDA Margin (Unaudited):
14
(1) Represents legal and advisory fees related to our litigation with MasterCraft Boat Company, LLC.(2) Represents the reduction in a one-time charge related to a judgment rendered against us in connection with a lawsuit by
Marine Power where the court ruled amending the judgment to $1.9 million.(3) Represents legal and advisory fees as well as integration related costs incurred in connection with certain acquisition
activities.(4) Represents equity-based incentives awarded to key employees under the Malibu Boats, Inc. Long-Term Incentive Plan andprofit interests issued under the previously existing limited liability company agreement of the LLC.
(5) Represents costs incurred in connection with our vertical integration of engines including product development costs andsupplier transition performance incentives.
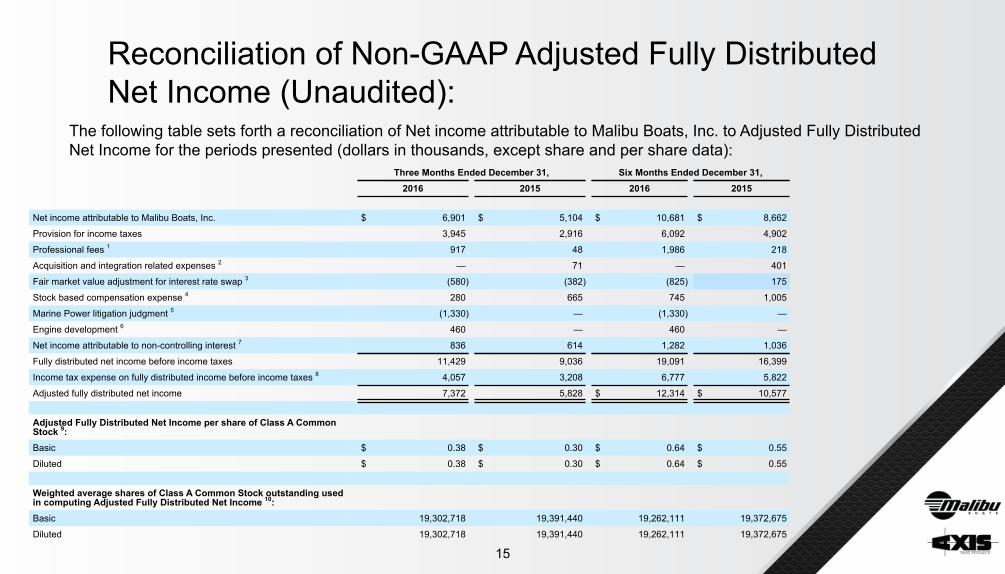
Reconciliation of Non-GAAP Adjusted Fully DistributedNet Income (Unaudited):
15
The following table sets forth a reconciliation of Net income attributable to Malibu Boats, Inc. to Adjusted Fully DistributedNet Income for the periods presented (dollars in thousands, except share and per share data):
Three Months Ended December 31, Six Months Ended December 31,2016 2015 2016 2015
Net income attributable to Malibu Boats, Inc. $ 6,901 $ 5,104 $ 10,681 $ 8,662
Provision for income taxes 3,945 2,916 6,092 4,902
Professional fees 1 917 48 1,986 218
Acquisition and integration related expenses 2 — 71 — 401
Fair market value adjustment for interest rate swap 3 (580) (382) (825) 175
Stock based compensation expense 4 280 665 745 1,005
Marine Power litigation judgment 5 (1,330) — (1,330) —
Engine development 6 460 — 460 —
Net income attributable to non-controlling interest 7 836 614 1,282 1,036
Fully distributed net income before income taxes 11,429 9,036 19,091 16,399
Income tax expense on fully distributed income before income taxes 8 4,057 3,208 6,777 5,822
Adjusted fully distributed net income 7,372 5,828 $ 12,314 $ 10,577
Adjusted Fully Distributed Net Income per share of Class A CommonStock 9:Basic $ 0.38 $ 0.30 $ 0.64 $ 0.55
Diluted $ 0.38 $ 0.30 $ 0.64 $ 0.55
Weighted average shares of Class A Common Stock outstanding usedin computing Adjusted Fully Distributed Net Income 10:Basic 19,302,718 19,391,440 19,262,111 19,372,675
Diluted 19,302,718 19,391,440 19,262,111 19,372,675
16
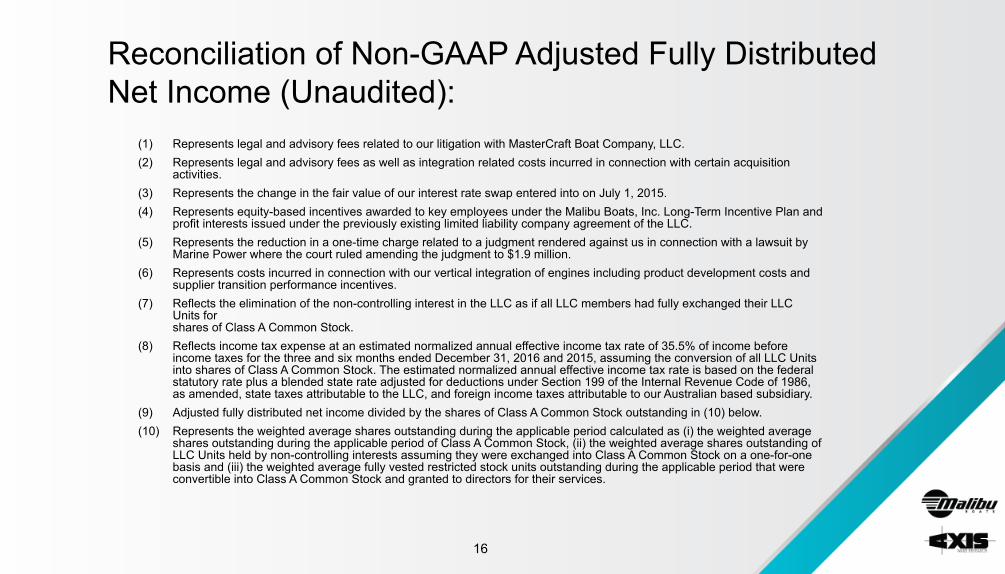
Reconciliation of Non-GAAP Adjusted Fully DistributedNet Income (Unaudited):
(1) Represents legal and advisory fees related to our litigation with MasterCraft Boat Company, LLC.(2) Represents legal and advisory fees as well as integration related costs incurred in connection with certain acquisition
activities.(3) Represents the change in the fair value of our interest rate swap entered into on July 1, 2015.(4) Represents equity-based incentives awarded to key employees under the Malibu Boats, Inc. Long-Term Incentive Plan and
profit interests issued under the previously existing limited liability company agreement of the LLC.(5) Represents the reduction in a one-time charge related to a judgment rendered against us in connection with a lawsuit by
Marine Power where the court ruled amending the judgment to $1.9 million.(6) Represents costs incurred in connection with our vertical integration of engines including product development costs and
supplier transition performance incentives.(7) Reflects the elimination of the non-controlling interest in the LLC as if all LLC members had fully exchanged their LLC
Units forshares of Class A Common Stock.
(8) Reflects income tax expense at an estimated normalized annual effective income tax rate of 35.5% of income beforeincome taxes for the three and six months ended December 31, 2016 and 2015, assuming the conversion of all LLC Unitsinto shares of Class A Common Stock. The estimated normalized annual effective income tax rate is based on the federalstatutory rate plus a blended state rate adjusted for deductions under Section 199 of the Internal Revenue Code of 1986,as amended, state taxes attributable to the LLC, and foreign income taxes attributable to our Australian based subsidiary.
(9) Adjusted fully distributed net income divided by the shares of Class A Common Stock outstanding in (10) below.(10) Represents the weighted average shares outstanding during the applicable period calculated as (i) the weighted average
shares outstanding during the applicable period of Class A Common Stock, (ii) the weighted average shares outstanding ofLLC Units held by non-controlling interests assuming they were exchanged into Class A Common Stock on a one-for-onebasis and (iii) the weighted average fully vested restricted stock units outstanding during the applicable period that wereconvertible into Class A Common Stock and granted to directors for their services.