q2 2016 earnings call slides and reconciliation of non
TRANSCRIPT

Q2 2016 EARNINGS CALL
Disclosures regarding Forward Looking Statements & Non-GAAP Financial Measures (pages 12-19)
SECOND QUARTER 2016 EARNINGS CALL
August 17, 2016

Q2 2016 EARNINGS CALL
• Repurchased $1.2 billion of stock under share repurchase program and paid
$251 million in dividends
SECOND QUARTER HIGHLIGHTS
1
Comp Sales +2.0%
Gross Margin 34.44%, -3 bps1
SG&A 21.20%, -26 bps2
EBIT Margin 11.24%, -13 bps1,2
EPS $1.31, +9.2%2
• Solid first half of the year, with comp sales in line with plan
• Healthy macro fundamentals, our project inspiration and expertise, and
targeted promotions continued to drive comp growth
‒ Positive comps in 10 of 14 regions
‒ Positive comps in 10 of 13 product categories
‒ Pro comps well above the Company average
1 Includes a 20 basis point negative impact to gross margin and EBIT margin related to the RONA transaction as a result of
purchase accounting adjustments to beginning inventory and mix.
2 Includes an $84 million loss on a foreign currency hedge entered into in advance of the RONA acquisition. The loss
negatively impacted SG&A and EBIT margin by 45 basis points and decreased diluted earnings per share by $0.06.

Q2 2016 EARNINGS CALL
TOTAL SALES SUMMARY1
2
Total % Change
Sales $18.3B +5.3%
Average Ticket $68.91 +1.6%
Customer Transactions 265.0M +3.7%
1 The acquisition of RONA added $461 million of sales in the quarter and approximately 75% of the increase in
customer transactions. The impact to average ticket was insignificant.

Q2 2016 EARNINGS CALL
2.0%
0.3%
1.7%
0% 1% 2%
Sales
Transactions
Average Ticket
Transaction/Ticket
7.3%
2.0%
5.2% 4.3% 4.6%
5.2% 4.8%
-2.0%
0.0%
2.0%
4.0%
6.0%
8.0%
10.0%
Q1 Q2 Q3 Q4 FY
Quarterly Trend 2016 2015
0.0%
1.6%
2.9%
0% 1% 2% 3% 4%
<$50
$50-500
>$500
Ticket Size
-2.8%
5.0%
3.8% 3.6% 4.6% 4.6%
-4.0%
-2.0%
0.0%
2.0%
4.0%
6.0%
May June July
Monthly Trend2
2016 2015
COMPARABLE SALES SUMMARY1
3 1 RONA will be included in the comparable sales calculation upon the anniversary of the transaction in Q2 2017. 2 Normalizing for holiday shifts, May, June, and July comps would have been approximately +1.7%, +2.0%, and +2.3%, respectively.

Q2 2016 EARNINGS CALL
Fashion Fixtures
Kitchens
Lumber & Building Materials
Seasonal Living
Tools & Hardware
PRODUCT CATEGORY PERFORMANCE1
4 1 Q2 comp sales were +2.0%. Positive comps in 10 of 13 product categories.
Home Fashions
Lawn & Garden
Millwork
Outdoor Power Equipment
Paint
Rough Plumbing & Electrical
Appliances
Flooring
Above Average
Average Below
Average

Q2 2016 EARNINGS CALL
OPERATING MARGIN SUMMARY
5
% of Sales Drivers
Gross Margin 34.44% -3 bps
(+) Value Improvement
(−) RONA purchase accounting adjustments and mix*
SG&A 21.20% -26 bps
(+) Bonus
(+) Employee insurance
(−) Loss on foreign currency hedge*
(−) Store payroll
Depreciation 2.00% 16 bps (+) Higher sales and fully depreciated assets
EBIT Margin 11.24% -13 bps
* 65 bps negative impact from RONA purchase
accounting adjustments and mix as well as loss on
foreign currency hedge
Leverage/
(Deleverage)

Q2 2016 EARNINGS CALL
YOY Change
Cash & Cash Equivalents $2.0B +$1.1B or +120.7%
Inventory $10.6B +$900M or +9.3%1
Inventory Turnover 3.89x ~ Flat
Accounts Payable $7.7B +$573M or +8.1%
Lease Adjusted Debt to EBITDAR 2.45x
Return on Invested Capital2 15.0% ~ Flat
BALANCE SHEET SUMMARY
6
1 The majority of the increase relates to the addition of RONA. 2The $530 million non-cash impairment charge recognized in connection with the Company's exit of its joint venture with Woolworths
Limited in Australia during 2015, net of the foreign currency hedge gain, negatively impacted ROIC by 194 basis points.
Q2 2016 EARNINGS CALL
Amount
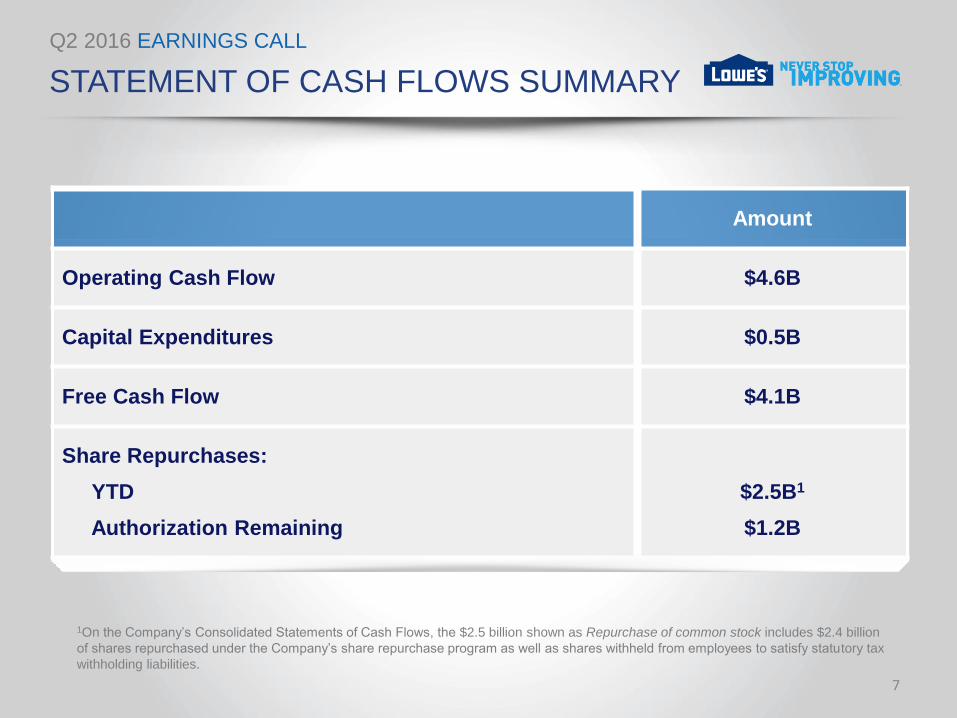
Operating Cash Flow $4.6B
Capital Expenditures $0.5B
Free Cash Flow $4.1B
Share Repurchases:
YTD
Authorization Remaining
$2.5B1
$1.2B
STATEMENT OF CASH FLOWS SUMMARY
7
1On the Company’s Consolidated Statements of Cash Flows, the $2.5 billion shown as Repurchase of common stock includes $2.4 billion
of shares repurchased under the Company’s share repurchase program as well as shares withheld from employees to satisfy statutory tax
withholding liabilities.

Q2 2016 EARNINGS CALL
ECONOMIC LANDSCAPE
8
• Key drivers of home improvement spending are real disposable
personal income, home prices, and housing turnover.
• The outlook for the home improvement industry remains positive,
supported by strong gains in the job market as well as disposable
income growth that continues to outpace growth in the economy, and
constructive housing trends.
• Our quarterly Consumer Sentiment Survey revealed that favorable
views around personal finances, home values, and home improvement
spending are holding steady.
• Rising home prices are motivating homeowners to invest in their
homes as we continued to see positive home improvement project
intentions.

Q2 2016 EARNINGS CALL
2016 PRIORITIES
Grow Sales
• Continue developing omni-channel capabilities
• Differentiate through better customer experiences
• Further improve our product and service offering for
the Pro customer
Drive Productivity and Profitability
• Continue to optimize store payroll and marketing
• Leverage our scale to get cost savings on indirect spend
9
Q2 2016 EARNINGS CALL
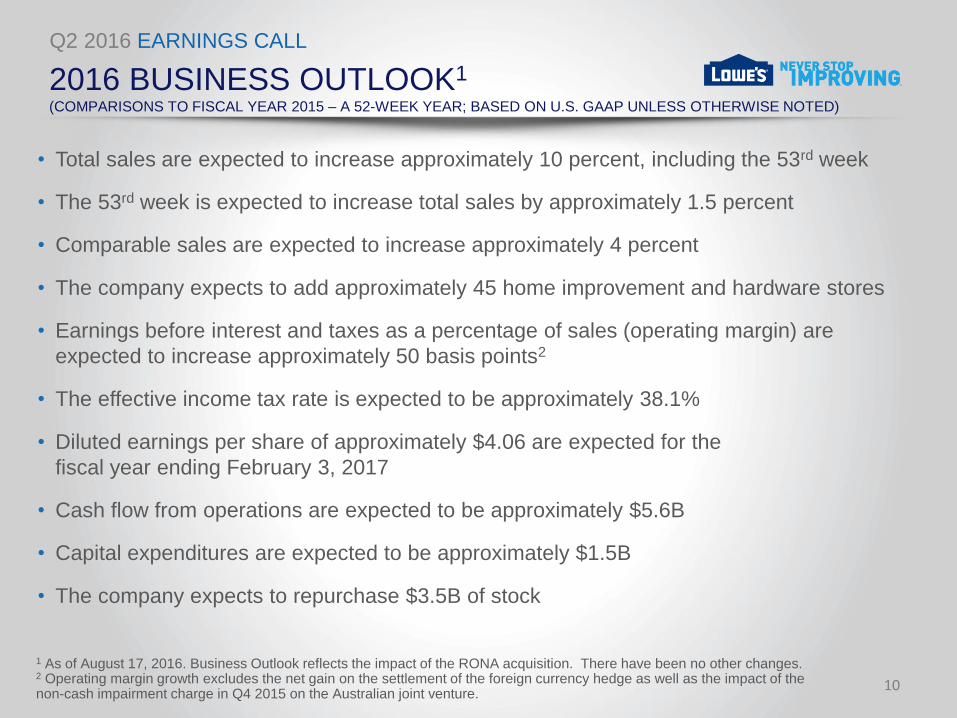
2016 BUSINESS OUTLOOK1 (COMPARISONS TO FISCAL YEAR 2015 – A 52-WEEK YEAR; BASED ON U.S. GAAP UNLESS OTHERWISE NOTED)
10
• Total sales are expected to increase approximately 10 percent, including the 53rd week
• The 53rd week is expected to increase total sales by approximately 1.5 percent
• Comparable sales are expected to increase approximately 4 percent
• The company expects to add approximately 45 home improvement and hardware stores
• Earnings before interest and taxes as a percentage of sales (operating margin) are
expected to increase approximately 50 basis points2
• The effective income tax rate is expected to be approximately 38.1%
• Diluted earnings per share of approximately $4.06 are expected for the
fiscal year ending February 3, 2017
• Cash flow from operations are expected to be approximately $5.6B
• Capital expenditures are expected to be approximately $1.5B
• The company expects to repurchase $3.5B of stock
1 As of August 17, 2016. Business Outlook reflects the impact of the RONA acquisition. There have been no other changes. 2 Operating margin growth excludes the net gain on the settlement of the foreign currency hedge as well as the impact of the non-cash impairment charge in Q4 2015 on the Australian joint venture.

Q2 2016 EARNINGS CALL
APPENDIX

Q2 2016 EARNINGS CALL
FORWARD LOOKING STATEMENTS
12
This document includes “forward-looking statements” within the meaning of the Private Securities Litigation Reform Act of 1995. Statements including words such as
“believe”, “expect”, “anticipate”, “plan”, “desire”, “project”, “estimate”, “intend”, “will”, “should”, “could”, “would”, “may”, “strategy”, “potential”, “opportunity” and similar
expressions are forward-looking statements. Forward-looking statements involve estimates, expectations, projections, goals, forecasts, assumptions, risks and
uncertainties. Forward-looking statements include, but are not limited to, statements about future financial and operating resu lts, Lowe’s plans, objectives, expectations
and intentions, expectations for sales growth, comparable sales, earnings and performance, shareholder value, capital expenditures, cash flows, the housing market, the
home improvement industry, demand for services, share repurchases, Lowe’s strategic initiatives, including those regarding the acquisition by Lowe’s Companies, Inc. of
RONA, inc. and the expected impact of the transaction on Lowe’s strategic and operational plans and financial results, and any statement of an assumption underlying
any of the foregoing and other statements that are not historical facts. Although we believe that the expectations, opinions, projections, and comments reflected in these
forward-looking statements are reasonable, we can give no assurance that such statements will prove to be correct. A wide variety of potential risks, uncertainties, and
other factors could materially affect our ability to achieve the results either expressed or implied by these forward-looking statements including, but not limited to,
changes in general economic conditions, such as the rate of unemployment, interest rate and currency fluctuations, fuel and other energy costs, slower growth in
personal income, changes in consumer spending, changes in the rate of housing turnover, the availability of consumer credit and of mortgage financing, inflation or
deflation of commodity prices, and other factors that can negatively affect our customers, as well as our ability to: (i) respond to adverse trends in the housing industry,
such as a demographic shift from single family to multi-family housing, a reduced rate of growth in household formation, and slower rates of growth in housing renovation
and repair activity, as well as uneven recovery in commercial building activity; (ii) secure, develop, and otherwise implement new technologies and processes necessary
to realize the benefits of our strategic initiatives focused on omni-channel sales and marketing presence and enhance our efficiency; (iii) attract, train, and retain highly-
qualified associates; (iv) manage our business effectively as we adapt our traditional operating model to meet the changing expectations of our customers; (v) maintain,
improve, upgrade and protect our critical information systems from data security breaches and other cyber threats; (vi) respond to fluctuations in the prices and
availability of services, supplies, and products; (vii) respond to the growth and impact of competition; (viii) address changes in existing or new laws or regulations that
affect consumer credit, employment/labor, trade, product safety, transportation/logistics, energy costs, health care, tax or environmental issues; (ix) positively and
effectively manage our public image and reputation and respond appropriately to unanticipated failures to maintain a high level of product and service quality that could
result in a negative impact on customer confidence and adversely affect sales; and (x) effectively manage our relationships with selected suppliers of brand name
products and key vendors and service providers, including third party installers. In addition, we could experience additional impairment losses if either the actual results
of our operating stores are not consistent with the assumptions and judgments we have made in estimating future cash flows and determining asset fair values, or we
are required to reduce the carrying amount of our investment in certain unconsolidated entities that are accounted for under the equity method. With respect to the
acquisition of RONA, potential risks include the effect of the transaction on Lowe’s and RONA’s strategic relationships, operating results and businesses generally; our
ability to integrate personnel, labor models, financial, IT and others systems successfully; disruption of our ongoing business and distraction of management; hiring
additional management and other critical personnel; increasing the scope geographic diversity and complexity of our operations; significant transaction costs or unknown
liabilities; and failure to realize the expected benefits of the transaction. For more information about these and other risks and uncertainties that we are exposed to, you
should read the “Risk Factors” and “Management’s Discussion and Analysis of Financial Condition and Results of Operations—Critical Accounting Policies and
Estimates” included in our most recent Annual Report on Form 10-K filed with the U.S. Securities and Exchange Commission (the “SEC”) and the description of material
changes thereto, if any, included in our Quarterly Reports on Form 10-Q or subsequent filings with the SEC.
The forward-looking statements contained in this document are expressly qualified in their entirety by the foregoing cautionary statements. All such forward-looking
statements are based upon data available as of the date of the 2nd quarter earnings release or other specified date and speak only as of such date. All subsequent
written and oral forward-looking statements attributable to us or any person acting on our behalf about any of the matters covered in this release are qualified by these
cautionary statements and in the “Risk Factors” included in our most recent Annual Report on Form 10-K and the description of material changes thereto, if any,
included in our Quarterly Reports on Form 10-Q or subsequent filings with the SEC. We expressly disclaim any obligation to update or revise any forward-looking
statement, whether as a result of new information, change in circumstances, future events, or otherwise.

Q2 2016 EARNINGS CALL
NON-GAAP MEASURES
13
Management is using non-GAAP financial measures in this document because it considers them to be important supplemental
measures of the Company’s performance. Management also believes that these non-GAAP financial measures provide additional
insight for analysts and investors in evaluating the Company’s financial and operating performance. Non-GAAP financial
measures should be considered in addition to, not as a substitute for, net earnings, earnings per share, total debt or other financial
measures prepared in accordance with GAAP. The Company’s methods of determining these non-GAAP financial measures may
differ from the methods used by other companies for these or similar non-GAAP financial measures. Accordingly, these non-
GAAP financial measures may not be comparable to measures used by other companies.
Pursuant to the requirements of SEC Regulation G, detailed reconciliations between the Company’s GAAP and non-GAAP
financial results were posted, by incorporation within the appendix to this presentation, on the Company’s Investor Relations
website at www.Lowes.com/investor on the day the Company’s operating and financial results were announced for the quarter
ended July 29, 2016 and management presented certain non-GAAP financial measures during a conference call with analysts
and investors. Investors are advised to carefully review and consider this information as well as the GAAP financial results that
are disclosed in the Company’s earnings releases and annual and quarterly SEC filings.

Q2 2016 EARNINGS CALL
NON-GAAP MEASURES
14
EBIT Margin (Operating Margin)
We define EBIT Margin as earnings before interest and taxes as a percentage of sales.
Lowe’s believes that EBIT Margin is a useful measure to describe the Company’s operating profit.
EBITDAR
We define EBITDAR as earnings before interest, taxes, depreciation, amortization, share-based
payments, rent, and non-recurring non-cash items.
Lease-Adjusted Debt
We define Lease-Adjusted Debt as short-term debt, current maturities of long-term debt, long-term
debt excluding current maturities, and eight times the last four quarters’ rent. We believe eight times
rent is a reasonable industry standard estimate of the economic value of our leased assets.
Lowe’s believes the ratio of Lease-Adjusted Debt to EBITDAR is a useful supplemental measure, as
it provides an indication of the results generated by the Company in relation to its level of
indebtedness by reflecting cash flow that could be used to repay debt.

Q2 2016 EARNINGS CALL
NON-GAAP MEASURES
15
ROIC
We define ROIC as trailing four quarters’ Net Operating Profit after Tax (NOPAT) divided by the average of ending debt and equity for the last five quarters.
Lowe’s believes ROIC is a useful measure of how effectively the Company uses capital
togenerate profits.
Free Cash Flow
We define Free Cash Flow as net cash provided by operating activities less capital
expenditures.
Lowe’s believes Free Cash Flow is a useful measure to describe the Company’s financial
performance and measures its ability to generate excess cash from its business operations.

Q2 2016 EARNINGS CALL
EBIT and EBITDAR
Net Earnings 2,799 2,834
Taxes 1,998 1,743
Interest1 608 533
EBIT 5,405 5,110
Depreciation and Amortization2 1,566 1,572
Share-based Payments 109 123
Rent 495 463
Non-cash impairment charge 530 -
EBITDAR 8,106 7,268
RECONCILIATION OF NON-GAAP MEASURES
16
1 Interest includes amortization of original issue discount, deferred loan costs & other non-cash amortization charges
2 Depreciation and amortization represents total Company depreciation, including Distribution Networks and Millworks, as well as
amortization of certain trademarks and intangibles
Four Quarters Ended
July 29, 2016 July 31, 2015

Q2 2016 EARNINGS CALL
RECONCILIATION OF NON-GAAP MEASURES
17
Lease Adjusted Debt
Short-term Borrowings - -
Current Maturities of LTD 1,193 1,014
Long-term Debt Excluding Current Maturities 14,712 10,345
Total Debt 15,905 11,359
8 Times Rent1 3,966 3,707
Lease Adjusted Debt 19,871 15,067
Four Quarters Ended
July 29, 2016 July 31, 2015
1 The annualized impact of the Company’s acquisition of 12 former Target locations is included in the 8 times rent calculation.
This adjustment increases 8 times rent for the period ended July 31, 2015 by $64 million.
Q2 2016 EARNINGS CALL
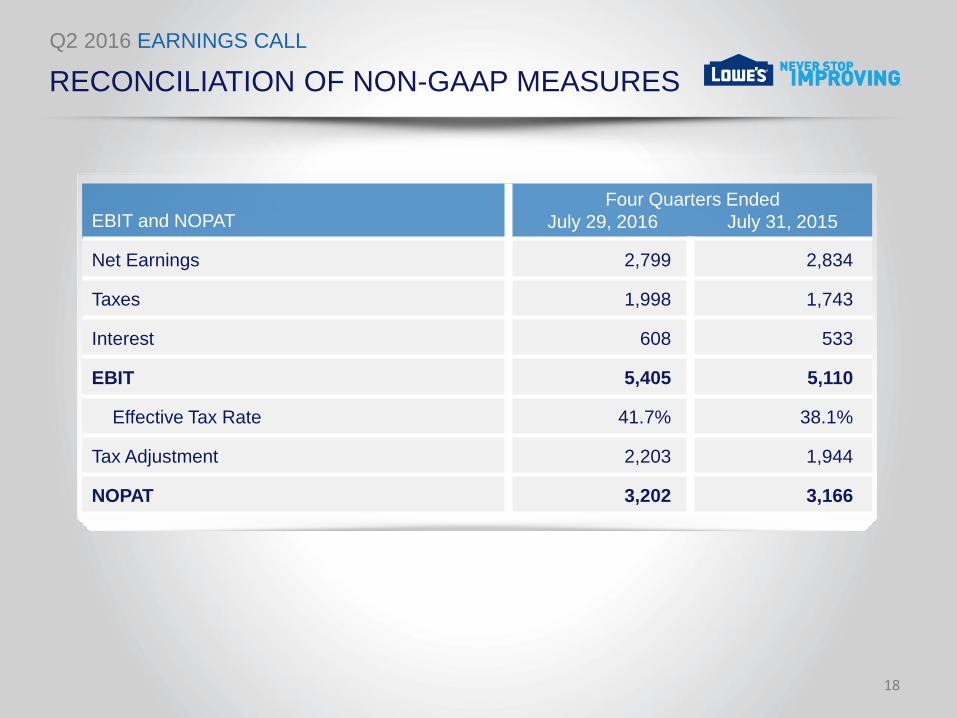
RECONCILIATION OF NON-GAAP MEASURES
18
EBIT and NOPAT
Net Earnings 2,799 2,834
Taxes 1,998 1,743
Interest 608 533
EBIT 5,405 5,110
Effective Tax Rate 41.7% 38.1%
Tax Adjustment 2,203 1,944
NOPAT 3,202 3,166
Four Quarters Ended
July 29, 2016 July 31, 2015

Q2 2016 EARNINGS CALL
RECONCILIATION OF NON-GAAP MEASURES
19 E = Estimate
Free Cash Flow FY 2016E FY 2015 FY 2014
Net Cash Provided by Operating Activities 5,600 4,784 4,929
Capital Expenditures 1,500 1,197 880
Free Cash Flow 4,100 3,587 4,049

Q2 2016 EARNINGS CALL
INVESTOR RELATIONS CONTACTS
20
TIFFANY MASON
Senior Vice President, Corporate Finance and Treasurer
704.758.2033
HEATHER HOLLANDER
Director, Investor Relations
704.758.3579
Investor Relations Website
www.Lowes.com/investor