q1 2018 economic outlook - seattle wealth … 2018 economic outlook by the lnwm investment strategy...
TRANSCRIPT

© 2018 LNWM | 801 SECOND AVENUE SUITE 1600 | SEATTLE WA 98104 | 206.464.5100 | WWW.LAIRDNORTONWM.COM 1
Q1 2018 ECONOMIC OUTLOOK
By the LNWM Investment Strategy & Research Group
• Real GDP in the US (adjusted for inflation) is poised to grow at above-trend levels in 2018, at about 2.5%, which will likely give the Federal Reserve reason to move the Fed Funds target higher at least three times in 2018.
• At the 12th hour, Congress passed tax reform (the Tax Cuts and Jobs Act). While we think the US economy was on solid footing prior to this, we think tax cuts will generally be supportive of equity valuations. However, we are uncertain as to the long-term benefits and are concerned about the possible negative effects of an increase in the already high US deficit.
• Bond yields globally have started to rise due to expectations of higher inflation and central bank balance sheet reduction through asset sales and maturations. Globally, central banks have begun shifting toward a less dovish stance, which will ultimately mean they purchase fewer bonds. We think central banks will continue to be transparent regarding this, which should lead to minimal market surprises, although rates will continue to move higher.
• Many believe that equity prices are at, or near, peak levels. We find it hard to substantiate where we are in the cycle and when it will turn. However, we do think current US market valuations are pricing in a near-perfect or “Goldilocks” economy. We continue to think there is more value to be had in markets outside the US. Hence, we are maintaining globally diversified portfolios and reducing some risk in our 2018 allocations.
SUMMARY
Total Return
2017 Performance of Asset Classes 4th Quarter and 2017 (As of Dec. 31, 2017)
Emerging Markets
U.S. Large-Cap Equities
Managed Futures
Commodities
Developed Int'l Equities
Global REITs
U.S. Small-Cap Equities
Hedge Funds – Illiquid
Hedge Funds – Liquid
U.S. High-Yield Bonds
U.S. Core Taxable Bonds
Intermediate Municipal Bonds
SOURCE OF DATA: Morningstar, Bloomberg, Hedge Fund Research.
* Net of manager fees | ** Assumes no manager fees
-0.2%3.5%
0.4%3.5%
0.4%
7.5%
6.0%1.5%
8.5%
14.7%
3.3%
11.4%3.8%
4.2%
1.7%
6.6%21.7%
7.4%37.3%
5.4%2.5%
4.7%
25.0%
2.5%
0.0% 20.0% 24.0%4.0%-4.0% 8.0% 12.0% 16.0% 36.0% 40.0%
4th Quarter 2017
2017
4.1%15.8%
LNWM Moderate Portfolio with Hedge Funds*
60/40 Equity and Fixed-Income Portfolio**
3.7%15.4%
0.0% 20.0% 24.0%4.0%-4.0% 8.0% 12.0% 16.0% 36.0% 40.0%

Q1 2018 ECONOMIC OUTLOOK
© 2018 LNWM | 801 SECOND AVENUE SUITE 1600 | SEATTLE WA 98104 | 206.464.5100 | WWW.LAIRDNORTONWM.COM 2
At the end of 2017, US equity markets were hitting record highs, economic growth was moving toward above-trend, unemployment was hovering around levels one would consider full employment, and inflation was beginning to rise back to normal levels. Then, the Tax Cuts and Jobs Act (TCJA) was passed. In the short run, we think the TCJA will be supportive of asset valuations, particularly equities, as US corporate earnings benefit from significantly lower tax rates; however, we think this could come at the expense of higher US deficits. The architects of the new tax law will tell you that economic growth will pay for the tax cuts, making them revenue neutral, although this comes with many assumptions.
“ We live in an age when unnecessary
things are our only necessities. ”- Oscar Wilde
THE RISING COST OF GROWTH
2018 KEY ECONOMIC DRIVERS
Inflation – Recent growth momentum across the globe has been better than most expected at a time when monetary policy has remained accommodative. Moreover, we now have additional fiscal stimulus in the US via tax reform. All of this has been reflected in buoyant markets for risky assets. An increasing rate of inflation is a concern because this could drive central banks to tighten monetary policy more aggressively than currently anticipated.
Geopolitical Disruption – We’ve had a decade of a relatively benign geopolitical environment. Driven by an electorate that seems to prefer an inward focus, leaders have done just that. Some say this is rightfully so, considering the historical role the US has played in maintaining world order. Regardless of one’s view on what the role of the US should be, one must acknowledge that the geopolitical environment feels less stable, increasing the probability of some disruption (including trade wars), which would be detrimental to the global economy and financial markets.
Corporate Earnings – Earning are always a focus given the importance to valuations. We’ve already begun to see the benefits of the recent US tax overhaul, as companies are increasing their forward-looking earnings estimates. What remains a question: will this lead to valuations expanding and higher stock prices? Or will earnings catch up to stock prices that already fully reflect the higher estimates?
Shift in Monetary Policy – As economic data turns more positive, there is a risk that central banks will become too aggressive in their efforts to tighten monetary policy. We believe markets have become accustomed to easy money, thereby becoming more sensitive to any changes. With that said, we believe some pull back on monetary stimulus is necessary and expect three additional interest rate hikes in the US in 2018, along with Federal Reserve continuing to sell (or not replace) the fixed-income assets on its balance sheet.
Longer-term Benefits and Costs of Tax Policy Changes – One could argue that the US economy did not need an additional “shot in the arm” (lower taxes) as we are at, or close to, full employment and GDP growth has improved. We agree with tax policy that increases US competitiveness and productivity, although we are also hopeful that this will not be a lost opportunity to reduce the national debt.

Q1 2018 ECONOMIC OUTLOOK
© 2018 LNWM | 801 SECOND AVENUE SUITE 1600 | SEATTLE WA 98104 | 206.464.5100 | WWW.LAIRDNORTONWM.COM 3
We are supportive of productive changes in fiscal policy, such as less onerous regulation and tax reform that allows US companies to be more competitive. However, at a time when US economic growth is already moving toward above-trend, we think it would have been more prudent to have incorporated deficit-reducing policies (potentially decreasing spending, not necessarily higher taxes). The Trump administration is fulfilling a campaign promise by implementing tax reform, although we are left wondering if -- as Oscar Wilde put it -- something unnecessary has been deemed otherwise. It is possible that the growth unleashed by the tax cuts will result in higher government revenue, getting us to revenue neutral. But that is far from certain.
LNWM believes lower tax rates will drive equities higher in the short run on continued corporate earnings growth. However, given that the impact of tax reform will likely be front-loaded, we believe increased inflation will cause the Federal Reserve to move interest rates higher quicker than the market anticipates. These two items -- tax reform and higher expectations for inflation -- are likely to have counter effects on each other and could ultimately dampen market exuberance.
The Goldilocks Economy: Can It Continue? The term “Goldilocks Economy” is credited to David Shulman of Salomon Brothers who first used it in 1992 to describe why he was remaining bullish. By “Goldilocks” Shulman meant the just right combination of falling inflation expectations and improving GDP growth. Generally speaking, this is what we’ve experienced since mid-2016. Globally, equity markets are now almost 30% higher and bond yields (until very recently) had remained relatively stable. Emerging market equities have been among the best-performing assets, at least in part because of low inflation both in the US and abroad.
So, where are we today? We are nine years into a bull market and current macroeconomic conditions remain very buoyant. In the last year, increases in economic growth seem to have been synchronized across global economies like never before, which we think will continue, limiting the probability of recession in the near term.
SOURCE OF DATA: Bloomberg.
Global Central Bank Security Purchases (12-month rolling, in billions of dollars)
2012 2013 2014 201620152010 20112009 2017 2018
2000
1500
1000
500
$2500
0
-500
-1000
Swiss Nat'l Bank
Bank of Japan
US Federal ReserveEuropean Central BankBank of England
Total Central Bank Purchases ($bn)
Total Central Bank Purchases

Q1 2018 ECONOMIC OUTLOOK
© 2018 LNWM | 801 SECOND AVENUE SUITE 1600 | SEATTLE WA 98104 | 206.464.5100 | WWW.LAIRDNORTONWM.COM 4
However, the very positive economic backdrop and sustained growth do not come without risks. Inflation, which is a natural derivative of growth, is the greatest risk in our view. In 2018, inflation is likely to come close to the Fed’s stated target of 2%, although given current levels of employment and recent rises in commodity prices, we think inflation could ultimately be higher than that. Rising inflation expectations will drive interest rates higher and cause the Federal Reserve to further tighten monetary policy, which will quickly cool the recent equity market rally.
Of the possible exogenous events, one cannot ignore the continued banter between the US and North Korea, as well as the seemingly renewed volatility in the Middle East. We think the tensions around North Korea will likely increase in the coming year and could also lead to rising tensions with China. Recently, China threatened to slow its purchase of US Treasury securities, which led to a brief selloff in the US bond market. Bonds quickly recovered, but in some ways, this was an acknowledgement of the power of China as a purchaser of US debt (and further evidence as to why the US deficit needs to be a greater priority).
With regard to the Middle East, historically, oil prices have been a significant concern given any tensions there. The price of oil (WTI Crude) recently moved past $60 a barrel, the highest level since the selloff of 2014, mainly due to increased demand. We think North American shale production is much more price-elastic, making tensions in the Middle East less impactful on oil prices.
2018 Allocations for LNWM Portfolios
We recently updated our asset allocation models. Given that US equity and bond markets are “priced for perfection,” we’ve begun lowering exposures there. We are maintaining our positions in non-US equities, and even increasing some of those.
In alternative assets, we’ve begun lowering our exposure to managed futures as they’ve become increasingly correlated with global equity markets -- the precise exposure we look to those strategies to offset -- in favor of hedge fund strategies. In hedge funds, we continue to focus our research on strategies that are not correlated with equities yet have unique sources of return. Fees are often an area of concern for hedge funds; we always leverage our size to attain the most favorable fee structures. Our Take on Bitcoin/Blockchain Given the ongoing media buzz surrounding bitcoin and blockchain, coupled with the many questions clients have asked about cryptocurrency, we decided to provide some thoughts. While entire books have been written on this topic, our stance on cryptocurrency can be summarized in four points.
1. Bitcoin (or any cryptocurrency) is simply a new “fiat currency,” or a currency that offers no physical store of value. Historically, a similar evolution occurred as people went from carrying leather pouches filled with gold to paper money and now to card-based transactions. Further, bitcoin is not the first attempt to bypass central banks in the production of currencies.

Q1 2018 ECONOMIC OUTLOOK
© 2018 LNWM | 801 SECOND AVENUE SUITE 1600 | SEATTLE WA 98104 | 206.464.5100 | WWW.LAIRDNORTONWM.COM 5
2. Value is dependent on participation for any fiat currency, including bitcoin. In other words, can I pay for goods and services using bitcoin? The more I can buy in exchange for bitcoin, the more relevant bitcoin will become. Until then, any value derived from bitcoin depends on how many dollars, yen, euros (or any other hard currency) you can get for it. Ultimately, all buyers and sellers have a base currency and need to translate back to that currency for consumption.
3. We don’t view any currency as a long-term investable asset from which one can extract rent, economic or otherwise, although many continue to debate this. In our view, buying any one currency versus another is a speculative bet. When we begin writing this Outlook, for example, a single bitcoin was trading at $16,000; very recently it dipped below $10,000, demonstrating the extreme volatility.
4. Blockchain is here to stay. The second point above is the most important in our view. A simple google search turns up certain retailers that accept bitcoin such as Expedia, Overstock.com, Dish, and Microsoft. I’ve also heard of a pizza restaurant in Chicago that will accept bitcoin in exchange for slices. And several of these businesses accept ethereum, litecoin, or bitcoin cash as well. However, in all cases, the quantity of goods or services one purchases in exchange for bitcoin depends on the prevailing bitcoin rate (per dollar) and is at a discount to that because of the extreme volatility of the currency. For example, Expedia’s policies state that when purchasing with bitcoin “to complete your booking…you will see the total cost of your booking in bitcoin, based on exchange rate set by Coinbase.” That rate will only remain valid for 10 minutes.
In all these examples, the value of bitcoin is translated to dollars to establish value. This means bitcoin is a fiat currency like the dollar, yen, euro or any other. As participation in bitcoin increases and its price volatility decreases, it will be easier to make purchases using bitcoin. However, the common characteristics of a fiat currency will remain.
Key to bitcoin is blockchain technology, which effectively utilizes private computers globally to update a common ledger and verify transactions. Bitcoin transactions are “off the grid” (for now), which has attracted nefarious transactions, although this also provides a self-regulating mechanism making counterfeiting very difficult and transactions more efficient.
Regardless of what happens to the value of bitcoin, blockchain technology is here to stay, and we also believe digital currencies will continue to grow. For governments and central banks, the decentralization of bitcoin or any other digital currency is concerning, and we find it difficult to believe that governments will stand by idly as activity grows. Personally, I would not want to be in the cross-hairs of the US Treasury. Nevertheless, only time will tell which of the digital currencies succeeds. Like blockchain, digital currencies will continue to proliferate, and we will continue to monitor their progress.
Q1 2018 ECONOMIC OUTLOOK
© 2018 LNWM | WWW.LAIRDNORTONWM.COM 6
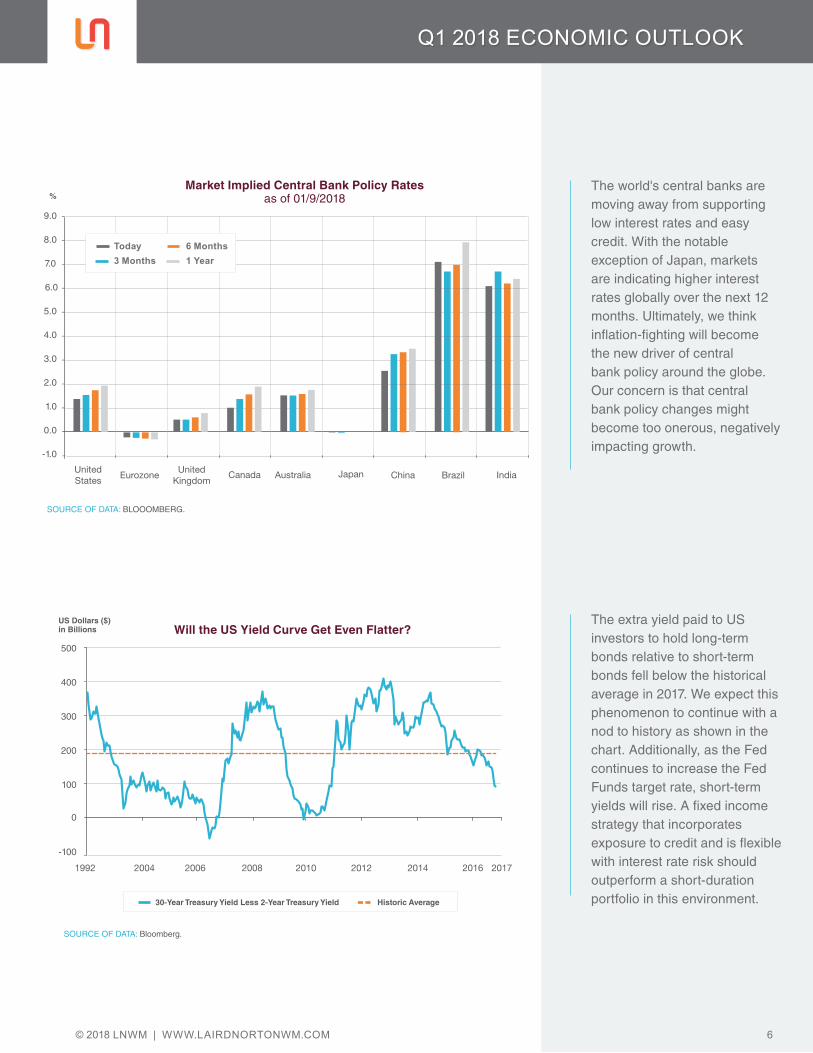
The world's central banks are moving away from supporting low interest rates and easy credit. With the notable exception of Japan, markets are indicating higher interest rates globally over the next 12 months. Ultimately, we think inflation-fighting will become the new driver of centralbank policy around the globe. Our concern is that central bank policy changes might become too onerous, negatively impacting growth.
Market Implied Central Bank Policy Ratesas of 01/9/2018%
3.0
-1.0
2.0
1.0
0.0
4.0
SOURCE OF DATA: BLOOOMBERG.
8.0
7.0
6.0
5.0
9.0
United States
EurozoneUnited
KingdomCanada Australia Japan China Brazil India
Today3 Months
6 Months1 Year
The extra yield paid to US investors to hold long-term bonds relative to short-term bonds fell below the historical average in 2017. We expect this phenomenon to continue with a nod to history as shown in the chart. Additionally, as the Fed continues to increase the Fed Funds target rate, short-term yields will rise. A fixed income strategy that incorporates exposure to credit and is flexible with interest rate risk should outperform a short-duration portfolio in this environment.
SOURCE OF DATA: Bloomberg.
Will the US Yield Curve Get Even Flatter?US Dollars ($) in Billions
2008 2010 2012 20162014 20172004 20061992
400
300
200
100
500
-100
0
30-Year Treasury Yield Less 2-Year Treasury Yield Historic Average

Q1 2018 ECONOMIC OUTLOOK
© 2018 LNWM | WWW.LAIRDNORTONWM.COM 7
Due to our expectations for higher inflation, we are recommending increased allocations to real assets, which include commodities and global infrastructure equities. Normally, Real Estate Investment Trusts (REITs) would fit in this category. However, we think the limited ability of REITs to raise rents will not offset the impact of higher interest rates going forward. During periods of rising inflation and interest rates, global infrastructure and commodities have outperformed both the stock and bond markets.
Total Return During Rising Inflation* Jan. 1, 2002 through Sept. 30, 2017Total Return (%)
20
0
15
10
5
25
4.4%
CPI Inflation
20.6%
Commodities Global Infrastructure
14.5%
Global Equities
10.9%
US Large Cap Equities
8.8%
US Taxable Bonds
2.4%
SOURCE OF DATA: Russell Investments, Bloomberg, Morningstar, LNWM.
*Rising inflation in this analysis is considered to be when CPI is greater than 0.7% for a given quarter. The returns for the quarters which met this criteria for each of the asset classes from 2002-1Q through 2017-3Q are then annualized.
In the second half of 2017, market-based inflation expectations rose substantially, alongside expectations for passage of tax reform. Rising production costs, rising wage growth and full employment all indicate the US economy is operating at near full capacity. While technology continues to hold down prices in many sectors, our expectation is that an economy operating at near full steam will eventually experience a rise in inflation, and this is a risk for 2018 that is likely underappreciated by many investors.
SOURCE OF DATA: Bloomberg.
Market Implied US Inflation Expectations%
2.0
1.8
1.6
1.4
2.2
1.2
1.0
2 Years 5 Years 10 Years
Jul-17 Aug-17 Sep-17 Oct-17 Nov-17 Dec-17 Jan-18
10 Years
2 Years
5 Years
Q1 2018 ECONOMIC OUTLOOK
© 2018 LNWM | WWW.LAIRDNORTONWM.COM 8
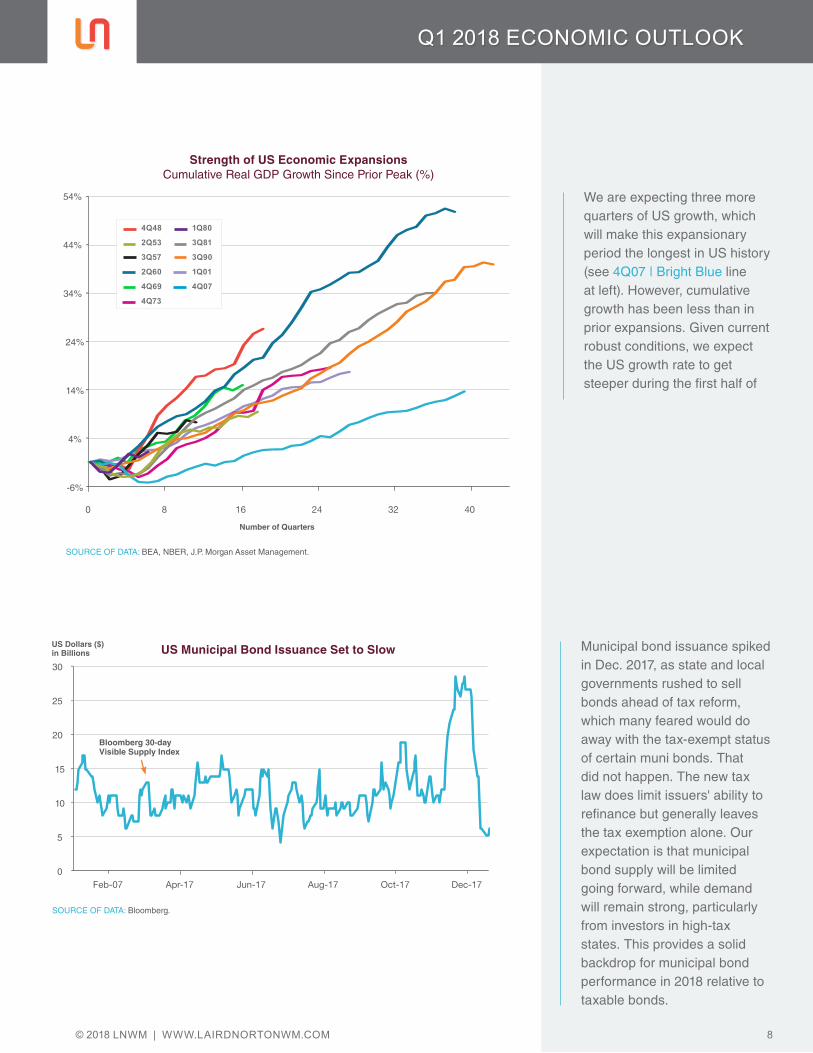
We are expecting three more quarters of US growth, which will make this expansionary period the longest in US history (see 4Q07 | Bright Blue line at left). However, cumulative growth has been less than in prior expansions. Given current robust conditions, we expect the US growth rate to get steeper during the first half of
Strength of US Economic ExpansionsCumulative Real GDP Growth Since Prior Peak (%)
Number of Quarters
SOURCE OF DATA: BEA, NBER, J.P. Morgan Asset Management.
44%
34%
24%
14%
54%
4%
-6%
32 4016 2480
4Q48
2Q53
3Q57
2Q60
4Q69
4Q73
1Q80
3Q81
3Q90
1Q01
4Q07
Municipal bond issuance spiked in Dec. 2017, as state and local governments rushed to sell bonds ahead of tax reform, which many feared would do away with the tax-exempt status of certain muni bonds. That did not happen. The new tax law does limit issuers' ability to refinance but generally leaves the tax exemption alone. Our expectation is that municipal bond supply will be limited going forward, while demand will remain strong, particularly from investors in high-tax states. This provides a solid backdrop for municipal bond performance in 2018 relative to taxable bonds.
SOURCE OF DATA: Bloomberg.
US Municipal Bond Issuance Set to SlowUS Dollars ($) in Billions
25
20
15
10
30
5
0Apr-17 Jun-17 Dec-17Feb-07 Aug-17 Oct-17
Bloomberg 30-day Visible Supply Index

Q1 2018 ECONOMIC OUTLOOK
© 2018 LNWM | WWW.LAIRDNORTONWM.COM 9
US consumer confidence has continued to rise, although actual consumer spending has tailed off since the end of 2014. Our expectation is for consumer spending to increase as wage growth continues, unemployment remains low and tax reform is implemented.
SOURCE OF DATA: Bloomberg.
An Optimistic US ConsumerIndex Level
2008 2010 2012 20162014 20172004 20062002
120
0
100
80
60
140
40
20
% Change
6.0
-6.0
4.0
2.0
0.0
8.0
-2.0
-4.0
Consumer Confidence Consumer Spending
Globally, equity valuations are now well above historical norms, less so outside the US. We’re maintaining our tilt toward non-US equities.
SOURCE OF DATA: FactSet, Eaton Vance. *Based on earnings estimates for next 12 months.
Current Price-to-Earnings* (P/E) Ratio vs. 10-Year AverageP/E Ratio
20
0
15
10
5
25
10.914.2
S&P 500
18.2
19.9
Russell 2000
24.3
Russell 1000 Growth
15.9
21.1
Russell 1000 Value
13.2
16.2
MSCI World
13.8
17.0
MSCI EAFE
12.9
14.9
MSCI EM
12.5
MSCI Europe
12.4
14.9
MSCI AC Asia
13.2
13.9
10-Year Average Current P/E
10.9
Q1 2018 ECONOMIC OUTLOOK
© 2018 LNWM | WWW.LAIRDNORTONWM.COM 10
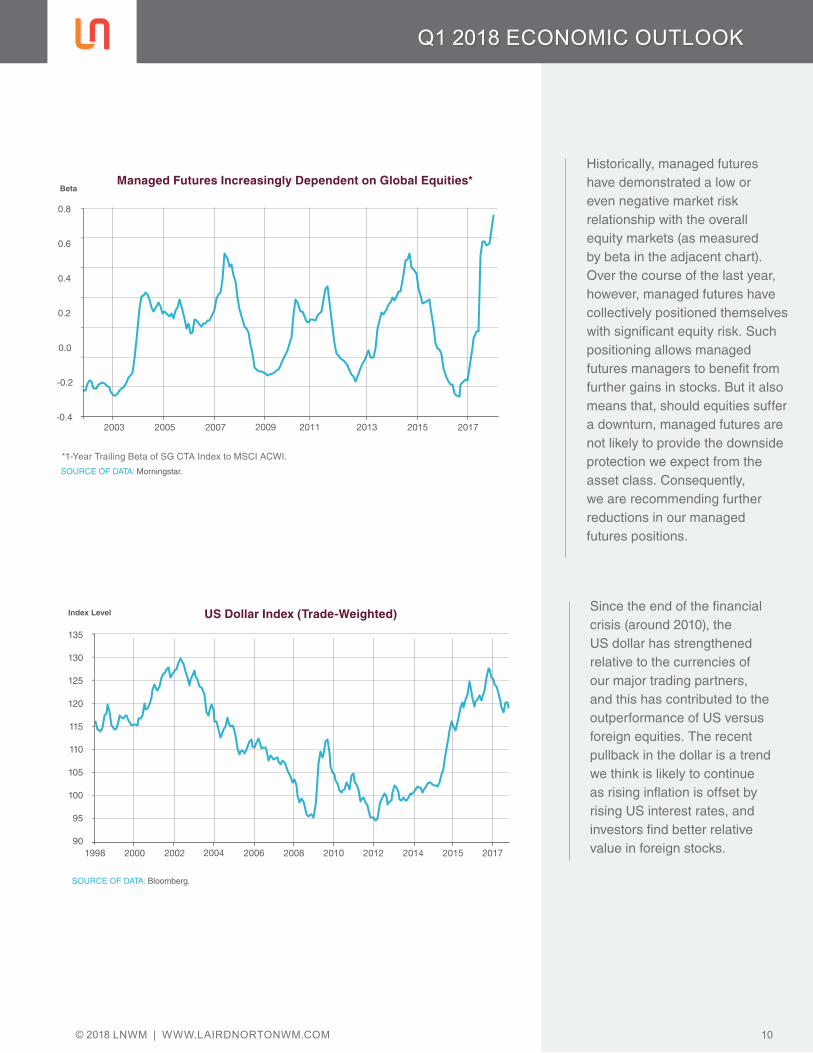
Historically, managed futures have demonstrated a low or even negative market risk relationship with the overall equity markets (as measured by beta in the adjacent chart). Over the course of the last year, however, managed futures have collectively positioned themselves with significant equity risk. Such positioning allows managed futures managers to benefit from further gains in stocks. But it also means that, should equities suffer a downturn, managed futures are not likely to provide the downside protection we expect from the asset class. Consequently, we are recommending further reductions in our managed futures positions.
Managed Futures Increasingly Dependent on Global Equities*Beta
0.6
0.4
0.2
0.0
0.8
-0.4
-0.2
2003 2005 2007 2009 2011 2013 2015 2017
SOURCE OF DATA: Morningstar.
*1-Year Trailing Beta of SG CTA Index to MSCI ACWI.
Since the end of the financial crisis (around 2010), the US dollar has strengthened relative to the currencies of our major trading partners, and this has contributed to the outperformance of US versus foreign equities. The recent pullback in the dollar is a trend we think is likely to continue as rising inflation is offset by rising US interest rates, and investors find better relative value in foreign stocks.
SOURCE OF DATA: Bloomberg.
US Dollar Index (Trade-Weighted)Index Level
2000 2002 20062004 20171998
130
125
120
115
135
105
110
100
90
95
2008 2010 2012 2014 2015

Q1 2018 ECONOMIC OUTLOOK
© 2018 LNWM | WWW.LAIRDNORTONWM.COM 11
Venezuela defaulted on its debt in Nov. 2017, which led to a temporary spike in the yields of emerging markets (EM) bonds. However, investors quickly realized that most EM economies were in good shape and Venezuela's problems were unique to that country. Therefore, credit spreads tightened and yields stabilized for the overall market. We continue to recommend an allocation to emerging markets debt with the expectation that spreads will continue to fall on EM debt over time as creditworthiness improves to levels approximating that of developed countries.
SOURCE OF DATA: Bloomberg.
Emerging Market Bonds Unphased by Venezuela Default% Yield
60.0
50.0
40.0
30.0
70.0
10.0
20.0
0.0
Apr-17 May-17 Jun-17 Aug-17Jul-17Feb-17 Ma-17Jan-17 Sep-17 Oct-17 Nov-17 Dec-17 Jan-18
% Yield
5.8
5.6
5.4
5.2
4.8
5.0
4.6
2026 Maturity Venezuela Bond (left) JP Morgan EMBI Global Core YTW (right)
Extremely strong recent performance in bitcoin and other cryptocurrencies masks their underlying daily volatility. In less than a year, bitcoin has gone from being valued at less than the price of 1 ounce of gold to nearly 15 ounces at one point.
Ounces of Gold per 1 BitcoinGold Oz
SOURCE OF DATA: Bloomberg.
20182016 20172015
14
12
10
8
16
6
4
2
0

Q1 2018 ECONOMIC OUTLOOK
© 2018 LNWM | 801 SECOND AVENUE SUITE 1600 | SEATTLE WA 98104 | 206.464.5100 | WWW.LAIRDNORTONWM.COM 12
ABOUT LAIRD NORTON WEALTH MANAGEMENTWith nearly $5 billion in assets under advisement, Laird Norton Wealth Management is the Northwest’s premier wealth management company. Founded in 1967 to serve the financial management needs of the Laird and Norton families, the firm now provides integrated wealth management solutions to more than 600 individuals, families, business leaders, private foundations and nonprofit organizations.
DISCLOSURE
The information presented here does not constitute and should not be construed as legal advice, as an endorsement of any party or any investment product or service, or as an offer to buy or sell any investment product or service. The views and solutions described may not be suitable for all investors. All opinions expressed are those of Laird Norton Wealth Management and are current only as of the date appearing on this material. Laird Norton Wealth Management is comprised of two distinct entities that may offer similar services to clients. Laird Norton Trust Company is a State of Washington chartered trust company. Its wholly owned subsidiary, Laird Norton Tyee Asset Strategies, LLC, is an investment advisor registered with the Securities and Exchange Commission.
The LNWM Moderate Model Portfolio with Hedge Funds performance shown is comprised of a hypothetical combination of actual investment returns generated by investment managers and funds recommended by LNWM during the time period indicated. Past performance is no guarantee of future results. The model portfolio allocation ranged from 20%-33% fixed income, 36%-67% equity, 10%-33% hedge funds and 0-5% cash. The actual allocations at any given time are available upon request. Within equities there is a mix of active and passive strategies, value and growth, various capitalizations and international stocks. The Model reflects all changes in LNWM’s recommended managers during the period. The investment results include the reinvestment of dividends and other earnings. The Model Portfolio is net of mutual fund fees and gross of LNWM management fees.
The Moderate Model Portfolio is not an actual portfolio and it is not possible to invest in the Model directly. Neither is it possible to invest directly in any index used in the comparative asset allocation blends shown. The Model investment performance does not represent the actual performance experienced by any client or group of client accounts. Actual performance results in client accounts will have varied substantially from the performance shown as a result of the inception of the investment, the timing and expenses of trades in the portfolio, the addition or withdrawal of cash, funds or securities, the imposition of taxes, expenses of custody and other variables not accounted for in the Model Portfolio.
Fees charged by Laird Norton Wealth Management will reduce the net performance of your investment portfolio. For example, a $3,000,000 investment for the 10-year period ending December 31, 2016, allocated in line with a Moderate Portfolio Model, would have a value of approximately $4,863,109 at the end of the period. A 1% annual fee, collected monthly in arrears, would reduce the ending balance to approximately $4,403,809. The Laird Norton Tyee Asset Strategies, LLC standard schedule of fees is set forth in our Form ADV Part 2A and is available upon request. Fees for accounts managed by Laird Norton Trust Company are based on the trust company’s standard fee schedule and may include fiduciary fees and related expenses in addition to investment management fees.
The 60/40 Equity & Fixed-Income Blend Portfolio: Annually rebalanced blend of the Barclays Capital U.S. Aggregate Bond Index and the MSCI All-Country World Index (ACWI). The blend is intended to reflect a typical moderate asset allocation without active management or
ABOUT THE AUTHOR GINO PERRINA, Ph.D., CFA is the Chief Investment Officer at Laird Norton Wealth Management and has more than 15 years of experience in investment analysis, strategy and risk management. Prior to joining LNWM in November 2015, Gino was a Managing Director at BlackRock Inc. in New York City, responsible for managing risk in the firm’s alternative asset portfolios (+$100 billion in total investment). He was also Managing Director of Research and Risk Management at BlackRock Alternative Advisors (2006 to 2010), Head of Fixed Income Research at Russell Investments (2010 to 2012) and a fixed income analyst and portfolio manager at Microsoft and IAC/InterActive Corp.