greek economic outlook
TRANSCRIPT

Economic Outlook 2015
Economic Analysis & Markets
March 2015
Ilias Lekkos [email protected] Irini Staggel [email protected] Dimitris Gavalas [email protected] Anastasia Aggelopoulou [email protected] Piraeus Bank 4 Amerikis Street, 105 64, Athens, Greece Tel: (+30) 210 328 8187, Fax: (+30) 210 328 8605
Bloomberg Page: <PBGR>

2

Economic Outlook (YoY% change, unless otherwise stated)
3
2012 2013 2014 2015
Real GDP -6.6 -3.9 0.8 0.5 up to 1.0
Nominal GDP -6.5 -6.1 -1.8 -1.6 up to -0.3
GDP Deflator 0.1 -2.3 -2.6 -2.1 up to -1.3
Inflation 1.5 -0.9 -1.3 -1.6 up to -0.8
Unemployment
(% of labour force) 24.4 27.5 26.5 25.0 up to 26.0
Current Account
(% of GDP) -2.4 0.6 0.9 0.8 up to 1.2
Credit growth -4.0 -3.9 -3.1 -3.0 up to -2.0
Source: ELSTAT, Bank of Greece, MinFin, Piraeus Bank Research

4
A casual observer of the Greek political discourse should be excused for feeling completely confused by
the cacophony created by a litany of the comments regarding the issue of Greek sovereign debt
sustainability, re-negotiation, alleviation or even repudiation. While these comments reflect the
importance of these issues for the future of the Greek economy, the way this dialogue is conducted
obscures rather than clarifies the true nature of the problems that need to be addressed.
One way to put some order to this rather chaotic discussion is to place the issue of debt sustainability
into the right framework: Starting from the beginning, we have to be aware that to a large extent the
economic and labor market policies implemented in Greece in 2013-2014 as well as the outline of the
policies to be implemented over the next couple of years have been decided in one of the most crucial
Eurogroup meetings back in November 2012. At that meeting our European partners took the
unequivocal decision to support Greece in its effort to remain in the Eurozone, while Greece
committed to the implementation of the Economic Adjustment Programme. With hindsight that
Eurogroup meeting had a profoundly positive impact on the Greek economy as it led to the
elimination of Grexit fears, allowed the disbursement of the “super-tranch” of €50bn, paved the way
for the recapitalization of the Greek banking sector, normalized our relationship with the rest of Europe
thus improving tourism from 2013 onwards and more generally it put the foundations for the
stabilization and gradual recovery of the Greek economy.

5
Last time that the issue of the sustainability of Greek debt was seriously addressed by the institutions
was during the November 2012 Eurogroup meeting. The outcome of that meeting was very favourable
for the Greek economy. Yet Eurogroup had to satisfy two important, politically imposed, constraints:
• Debt had to appear to be sustainable (based on IMF’s sustainability analysis)
• Estimated funding needs could not exceed the amount of €245 bn originally allocated to Greece,
i.e. no new money.
These constraints are satisfied under a unique set of conditions that maybe achievable in a physics lab
(or more appropriately in an Excel spreadsheet) but not in the real world. More specifically, debt
sustainability requires a specific trajectory for growth, inflation, Euribor rates, fiscal surpluses and
privatization revenues. At the same time the lack of new financing means that all fiscal surpluses, ANFA
& SMP profits and privatizations revenues have to be directed towards repaying Greece’s external
debt.

6
The point that we are trying to make is that debt is one of the variables in that system of equations but
it is the end- rather the starting-point. Rather than starting a negotiation on the level of debt we
should start from a reasonable set of macro assumptions, allowing for achievable primary surpluses
that can be recycled into the Greek economy in the form of infrastructure spending and keeping
debt/GDP as a “free” variable which will be determined at the end.
If that exercise leads to unrealistic levels of sovereign indebtness at the end-horizon of the simulation
then corrective action should be taken to reduce the debt accordingly.

7
With hindsight the main driving forces supporting GDP growth in 2014 were:
• Tourism activity: Tourism revenues increased in 2014 by 10.6% YoY reaching €13.4 bn
• EU support: Funding (in the form of grants from EU funds) reached circa €8 bn in 2014
• Remarkable pick up in domestic demand: In 2014 private consumption grew by 1.3%,
contributing 1.0% to GDP growth rate and gross fixed capital was increased by 2.7% contributing
0.3% to GDP growth rate
• Deflation: Contrary to popular belief deflation has been a positive force supporting Greek
households’ real disposable income
In 2014 real GDP grew by 0.8% ending a prolonged recession that begun back in 2008.
However during Q4/2014, real GDP declined by 0.4% QoQ curbing the upward trend since the
beginning of 2014.

8
• The downward revision of Q4-2014 real GDP growth rate to -0.4% QoQ minimized the
momentum of the Greek economy, drastically reducing the carry – over effect to just 0.1%
forcing us to revise our forecast for real GDP growth rate to a range of 0.5% to 1.0% noting a
median value of 0.8%
• Despite worries we believe that tourism will accelerate further in 2015 continuing to support the
Greek economy
• EU funding: we expect EU funding to decelerate in 2015
• An upside risk on our estimates depends on the outcome of the negotiations between the new
government and our EU partners.

Source: European Commission DG ECFIN, ELSTAT, Bank of Greece, Teiresias, Bloomberg, MinFin, Piraeus Bank Research
Economic Climate Tracer
Since the middle of 2012 the Greek economy entered in an improving trajectory that culminated in
a brief period of GDP growth.
The recent rise of political uncertainty and instability is threatening to push back the Greek
economy to a recessionary phase and causes a rapid escalation of financial stress.
9
Greek Financial Distress Index
-2.0
-1.0
0.0
1.0
-0.25 -0.15 -0.05 0.05 0.15
level
mom change
downswing expansion
contraction upswing
Feb.'15
Jan.'06
-4.0
-3.0
-2.0
-1.0
0.0
1.0
2.0
3.0
4.0
5.0
6.0
7.0
Jan-0
3
Jun-0
3
Nov-0
3
Apr-
04
Sep-0
4
Feb-0
5
Jul-05
Dec-0
5
May-0
6
Oct-
06
Mar-
07
Aug-0
7
Jan-0
8
Jun-0
8
Nov-0
8
Apr-
09
Sep-0
9
Feb-1
0
Jul-10
Dec-1
0
May-1
1
Oct-
11
Mar-
12
Aug-1
2
Jan-1
3
Jun-1
3
Nov-1
3
Apr-
14
Sep-1
4
Dec'14

Real GDP (YoY% change)
10 Source: ELSTAT, Piraeus Bank Research
Contribution of main components to
Real GDP growth rate
In 2014, domestic demand and to a lesser extend foreign trade made a positive contribution.
The carry –over effect for 2015 is a mere 0.1%. Following the assumption that the Greek economy
with maintain a part of its dynamic we estimate that the real GDP growth rate will range from 0.5%
up to 1.0%, noting a middle point at 0.8%
-10.0
-8.0
-6.0
-4.0
-2.0
0.0
2.0
4.0
6.0
8.0
19
96
19
97
19
98
19
99
20
00
20
01
20
02
20
03
20
04
20
05
20
06
20
07
20
08
20
09
20
10
20
11
20
12
20
13
20
14
20
15
carry - over effect growth dynamics within the year total % change
-15.0
-10.0
-5.0
0.0
5.0
10.0
2001 2002 2003 2004 2005 2006 2007 2008 2009 2010 2011 2012 2013 2014
Private Consumption Public Consumption
Gross Fixed capital formation stockbuilding
External trade GDP (YoY % change)

11
Carry - over effect of main GDP components
Source: ELSTAT, Piraeus Bank Research
-5.0
0.0
5.0
10.0
15.0
20.0
2014 2015 2014 2015 2014 2015 2014 2015 2014 2015
Private Consumption
Public Consumption
GFCF Exports Imports
carry - over effect growth dynamics within the year
We estimate that a favourable sign for a further GDP growth is the positive carry over effect of
private consumption, which constitutes the main part of GDP.
Moreover we note an extreme positive carry over effect on GFCF, but also a strong carry over effect
on imports. The contribution of an increase in investment on the GDP growth rate will be partly
counterbalanced by the negative contribution of an increase in imports .

12
Headline Inflation (CPI)
Inflation & Output Gap
Headline Inflation (CPI) vs GDP deflator
Given the substantial negative output gap in the
Greek economy and taking into account the
global lowflationary environment, we expect the
Greek economy to remain in a deflationary
mode with inflation at a range of -1.6% to -0.8%,
noting a middle point at -1.2%
Source: European Commission DG ECFIN, EL.STAT., Piraeus Bank Research
-4.0
-2.0
0.0
2.0
4.0
6.0
8.0
10.0
19
96
19
97
19
98
19
99
20
00
20
01
20
02
20
03
20
04
20
05
20
06
20
07
20
08
20
09
20
10
20
11
20
12
20
13
20
14
20
15
GDP deflator Inflation
-4.0
-3.0
-2.0
-1.0
0.0
1.0
2.0
3.0
4.0
5.0
6.0
Jan-1
0
May-1
0
Sep-1
0
Jan-1
1
May-1
1
Sep-1
1
Jan-1
2
May-1
2
Sep-1
2
Jan-1
3
May-1
3
Sep-1
3
Jan-1
4
May-1
4
Sep-1
4
Jan-1
5
May-1
5
Sep-1
5
CPI (MoM%) CPI (YoY%)
-2.0
-1.0
0.0
1.0
2.0
3.0
4.0
5.0
6.0
-3 -2.5 -2 -1.5 -1 -0.5 0 0.5 1 1.5
HIC
P co
nsta
nt t
ax y
oy%
cha
nge
Output Gap

Source: ΕLSTAT, Eurostat, Piraeus Bank Research 13
Nominal GDP (YoY% change)
Nominal vs Real GDP (YoY% change)
Nominal GDP (YoY% change)
-15.0
-10.0
-5.0
0.0
5.0
10.0
15.0
Q1
/02
Q4
/02
Q3
/03
Q2
/04
Q1
/05
Q4
/05
Q3
/06
Q2
/07
Q1
/08
Q4
/08
Q3
/09
Q2
/10
Q1
/11
Q4
/11
Q3
/12
Q2
/13
Q1
/14
Q4
/14
Real GDP (YoY% change) Nominal GDP (YoY % change)
-10.0
-5.0
0.0
5.0
10.0
15.0
19
96
19
97
19
98
19
99
20
00
20
01
20
02
20
03
20
04
20
05
20
06
20
07
20
08
20
09
20
10
20
11
20
12
20
13
20
14
20
15
carry - over effect growth dynamics within the year total % change
-10.0
-5.0
0.0
5.0
10.0
15.0
20
01
20
02
20
03
20
04
20
05
20
06
20
07
20
08
20
09
20
10
20
11
20
12
20
13
20
14
20
15
GDP (YoY % change) GDP Deflator
Nominal GDP (YoY% change)
The carry over effect for nominal GDP is still
negative.
Having estimated that the GDP deflator will
remain negative, our forecast for nominal
GDP growth ranges from -1.6% to -0.3%.
14
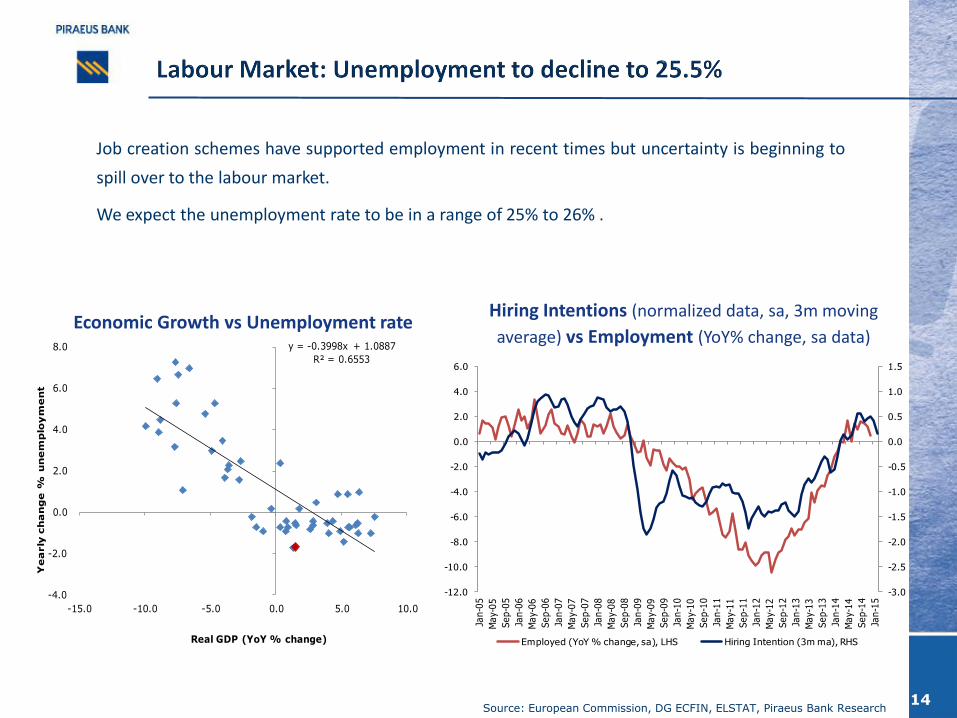
Economic Growth vs Unemployment rate Hiring Intentions (normalized data, sa, 3m moving
average) vs Employment (YoY% change, sa data)
Source: European Commission, DG ECFIN, ELSTAT, Piraeus Bank Research
Job creation schemes have supported employment in recent times but uncertainty is beginning to
spill over to the labour market.
We expect the unemployment rate to be in a range of 25% to 26% .
-3.0
-2.5
-2.0
-1.5
-1.0
-0.5
0.0
0.5
1.0
1.5
-12.0
-10.0
-8.0
-6.0
-4.0
-2.0
0.0
2.0
4.0
6.0
Jan-0
5
May-
05
Sep-0
5
Jan-0
6
May-
06
Sep-0
6
Jan-0
7
May-
07
Sep-0
7
Jan-0
8
May-
08
Sep-0
8
Jan-0
9
May-
09
Sep-0
9
Jan-1
0
May-
10
Sep-1
0
Jan-1
1
May-
11
Sep-1
1
Jan-1
2
May-
12
Sep-1
2
Jan-1
3
May-
13
Sep-1
3
Jan-1
4
May-
14
Sep-1
4
Jan-1
5
Εmployed (YoY % change, sa), LHS Hiring Intention (3m ma), RHS
y = -0.3998x + 1.0887
R² = 0.6553
-4.0
-2.0
0.0
2.0
4.0
6.0
8.0
-15.0 -10.0 -5.0 0.0 5.0 10.0
Ye
arly
ch
an
ge
% u
ne
mp
loy
me
nt
Real GDP (YoY % change)

Source: Bank of Greece, Piraeus Bank Research
Current Account Balance (cumulative, mn €)
15
Travel Balance (cumulative, mn €)
Current Account (% of GDP)
-16.0
-14.0
-12.0
-10.0
-8.0
-6.0
-4.0
-2.0
0.0
2.0
20
03
20
04
20
05
20
06
20
07
20
08
20
09
20
10
20
11
20
12
20
13
20
14
20
15
-7000
-5000
-3000
-1000
1000
3000
5000
Jan.
Jan.-
Feb.
Jan.-
Mar.
Jan.-
Apr.
Jan.-
May
Jan.-
Jun.
Jan.-
Jul.
Jan.-
Aug.
Jan.-
Sep.
Jan.-
Oct
.
Jan.-
Nov.
Jan.-
Dec.
2012 2013 2014
-2000
0
2000
4000
6000
8000
10000
12000
14000
Jan.
Jan.-
Feb.
Jan.-
Mar.
Jan.-
Apr.
Jan.-
May
Jan.-
Jun.
Jan.-
Jul.
Jan.-
Aug.
Jan.-
Sep.
Jan.-
Oct.
Jan.-
Nov.
Jan.-
Dec.
2012 2013 2014
The tourism revenues are estimated to positively
contribute to the Current account balance.
This drift is estimated to overperform any
possible increase of the trade deficit in case of an
upward trend of imports as a result of the
investments.
Source: ΕLSTAT, Eurostat, Bank of Greece, Piraeus Bank Research 16
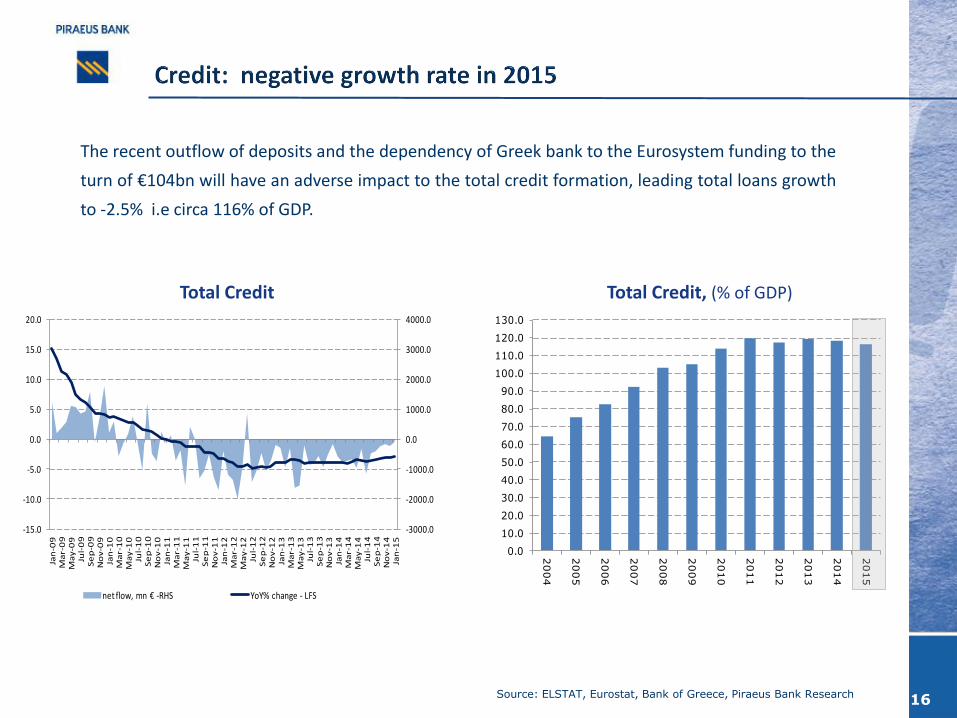
Total Credit Total Credit, (% of GDP)
The recent outflow of deposits and the dependency of Greek bank to the Eurosystem funding to the
turn of €104bn will have an adverse impact to the total credit formation, leading total loans growth
to -2.5% i.e circa 116% of GDP.
-3000.0
-2000.0
-1000.0
0.0
1000.0
2000.0
3000.0
4000.0
-15.0
-10.0
-5.0
0.0
5.0
10.0
15.0
20.0
Jan
-09
Ma
r-0
9M
ay
-09
Jul-
09
Se
p-0
9N
ov
-09
Jan
-10
Ma
r-1
0M
ay
-10
Jul-
10
Se
p-1
0N
ov
-10
Jan
-11
Ma
r-1
1M
ay
-11
Jul-
11
Se
p-1
1N
ov
-11
Jan
-12
Ma
r-1
2M
ay
-12
Jul-
12
Se
p-1
2N
ov
-12
Jan
-13
Ma
r-1
3M
ay
-13
Jul-
13
Se
p-1
3N
ov
-13
Jan
-14
Ma
r-1
4M
ay
-14
Jul-
14
Se
p-1
4N
ov
-14
Jan
-15
net flow, mn € -RHS YoY% change - LFS
0.0
10.0
20.0
30.0
40.0
50.0
60.0
70.0
80.0
90.0
100.0
110.0
120.0
130.0
2004
2005
2006
2007
2008
2009
2010
2011
2012
2013
2014
2015

Current Economic Developments
17

GDP Analysis &
Economic Climate
18
Source: ELSTAT, Piraeus Bank Research
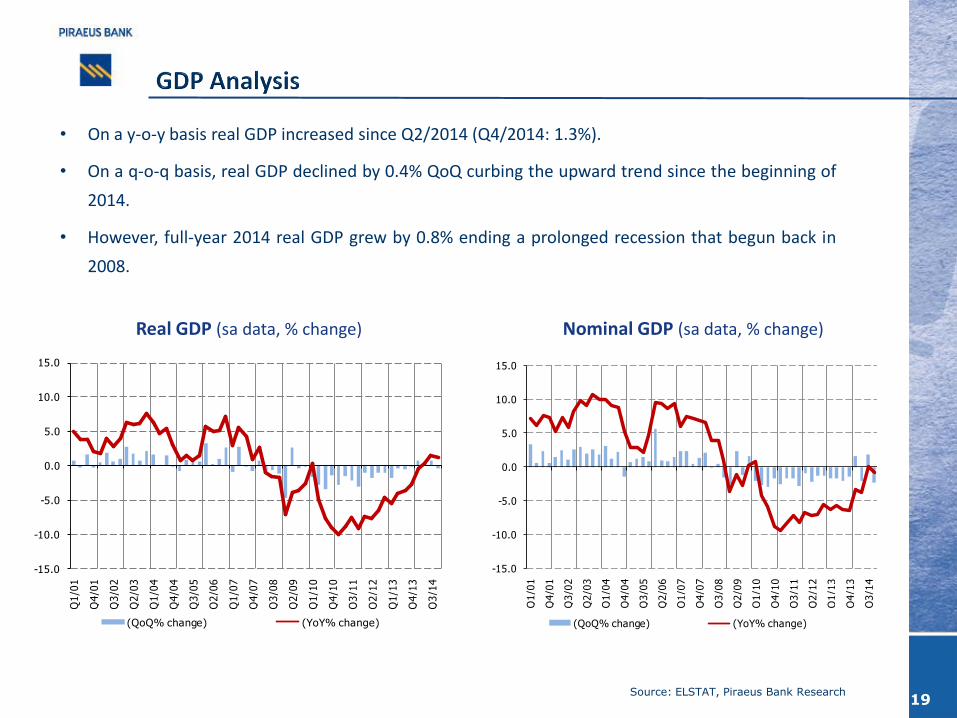
• On a y-o-y basis real GDP increased since Q2/2014 (Q4/2014: 1.3%).
• On a q-o-q basis, real GDP declined by 0.4% QoQ curbing the upward trend since the beginning of
2014.
• However, full-year 2014 real GDP grew by 0.8% ending a prolonged recession that begun back in
2008.
19
Real GDP (sa data, % change) Nominal GDP (sa data, % change)
-15.0
-10.0
-5.0
0.0
5.0
10.0
15.0
Q1/0
1
Q4/0
1
Q3/0
2
Q2/0
3
Q1/0
4
Q4/0
4
Q3/0
5
Q2/0
6
Q1/0
7
Q4/0
7
Q3/0
8
Q2/0
9
Q1/1
0
Q4/1
0
Q3/1
1
Q2/1
2
Q1/1
3
Q4/1
3
Q3/1
4
(QoQ% change) (YoY% change)
-15.0
-10.0
-5.0
0.0
5.0
10.0
15.0
Q1/0
1
Q4/0
1
Q3/0
2
Q2/0
3
Q1/0
4
Q4/0
4
Q3/0
5
Q2/0
6
Q1/0
7
Q4/0
7
Q3/0
8
Q2/0
9
Q1/1
0
Q4/1
0
Q3/1
1
Q2/1
2
Q1/1
3
Q4/1
3
Q3/1
4
(QoQ% change) (YoY% change)

GDP & GVA Analysis
Main components‘ contribution to Real
GDP growth rate
Main economic activity sectors’
contribution to GVA growth rate
• In 2014, domestic demand and to a lesser extend foreign trade made a positive contribution to GDP
growth.
• Gross value added fell with a decreasing rate compared with 2013.
Source: ELSTAT, Piraeus Bank Research 20
-15.0
-10.0
-5.0
0.0
5.0
10.0
2001 2002 2003 2004 2005 2006 2007 2008 2009 2010 2011 2012 2013 2014
Private Consumption Public Consumption
Gross Fixed capital formation stockbuilding
External trade GDP
-10.0
-5.0
0.0
5.0
10.0
15.0
2001 2002 2003 2004 2005 2006 2007 2008 2009 2010 2011 2012 2013 2014
Agri, forestry & fishing Trade; vehicles; transportation & storage;
accommodation & food serviceConstruction Industry
other services GVA (yoy% change)

* Calculated based on ESI
Source: European Commission DG ECFIN, ELSTAT, Piraeus Bank Research
Economic Climate Tracer*
• During Q2-Q3/2014, both the ESI (Economic Sentiment Indicator) and the GDP change show positive
signs, signaling a possible stabilization of the economy and the probability of recovery. However, this
change in Q4/2014 as both the ESI and the GDP reduced on a QoQ basis.
• According to our mapping of the business cycle, Greece seems to be entering the contraction
quadrant, although during H2/2014 there were signs of stabilization in the expansionary phase.
21
ESI vs GDP growth rate
-12.0
-10.0
-8.0
-6.0
-4.0
-2.0
0.0
2.0
4.0
6.0
8.0
10.0
70
75
80
85
90
95
100
105
110
115
Q1/0
1
Q3/0
1
Q1/0
2
Q3/0
2
Q1/0
3
Q3/0
3
Q1/0
4
Q3/0
4
Q1/0
5
Q3/0
5
Q1/0
6
Q3/0
6
Q1/0
7
Q3/0
7
Q1/0
8
Q3/0
8
Q1/0
9
Q3/0
9
Q1/1
0
Q3/1
0
Q1/1
1
Q3/1
1
Q1/1
2
Q3/1
2
Q1/1
3
Q3/1
3
Q1/1
4
Q3/1
4
Economic Sentiment Indicator (LHS) Real GDP growth (% ΥoΥ, RHS)
-2.0
-1.0
0.0
1.0
-0.25 -0.15 -0.05 0.05 0.15
level
mom change
downswing expansion
contraction upswing
Feb.'15
Jan.'06

Source: European Commission DG ECFIN, ELSTAT, Piraeus Bank Research
Confidence Indicator in Construction (CIC)
22
Industrial Confidence Indicator (ICI)
• Business confidence indicators in industry and construction show a steady improvement since late
2012. Yet, since end -2014 their estimates and expectations seems to moderate in a “ wait and see”
environment.
• Manufacturing companies send mixed signals in production as they seem to be negative with respect
to the level of orders and inventories.
• In the construction’ sector the negative estimates regarding turnover are moderate; however the
pessimistic expectations regarding employment have risen again.
-30.0
-25.0
-20.0
-15.0
-10.0
-5.0
0.0
5.0
10.0
15.0
Jan
-11
Mar
-11
May
-11
Jul-
11
Sep
-11
No
v-1
1
Jan
-12
Mar
-12
May
-12
Jul-
12
Sep
-12
No
v-1
2
Jan
-13
Mar
-13
May
-13
Jul-
13
Sep
-13
No
v-1
3
Jan
-14
Mar
-14
May
-14
Jul-
14
Sep
-14
No
v-1
4
Jan
-15
Order books Stocks (reverse sign) Production expectations ICI
-90.0
-80.0
-70.0
-60.0
-50.0
-40.0
-30.0
-20.0
-10.0
0.0
10.0
20.0
Jan
-11
Mar
-11
May
-11
Jul-
11
Sep
-11
No
v-1
1
Jan
-12
Mar
-12
May
-12
Jul-
12
Sep
-12
No
v-1
2
Jan
-13
Mar
-13
May
-13
Jul-
13
Sep
-13
No
v-1
3
Jan
-14
Mar
-14
May
-14
Jul-
14
Sep
-14
No
v-1
4
Jan
-15
Order books employment expectations CCI

Source: European Commission DG ECFIN, ELSTAT, Piraeus Bank Research 23
Confidence Indicator in Services (SCI) Confidence Indicator in Retail Trade (RCI)
• In retail trade, the respective confidence indicator seems to return to negative territory and in
services sector a reduction in expectations is depicted due to pessimistic expectations and estimates.
• In the same context - as in any other business sector - in the last quarter of 2014 and the beginning of
the year there was a negative impact on expectations.
-60.0
-50.0
-40.0
-30.0
-20.0
-10.0
0.0
10.0
20.0
Jan
-11
Mar
-11
May
-11
Jul-
11
Sep
-11
No
v-1
1
Jan
-12
Mar
-12
May
-12
Jul-
12
Sep
-12
No
v-1
2
Jan
-13
Mar
-13
May
-13
Jul-
13
Sep
-13
No
v-1
3
Jan
-14
Mar
-14
May
-14
Jul-
14
Sep
-14
No
v-1
4
Jan
-15
Sales - current stocks (reverse sign) Sales - expectations RCI
-50.0
-40.0
-30.0
-20.0
-10.0
0.0
10.0
20.0
30.0
Jan
-11
Mar
-11
May
-11
Jul-
11
Sep
-11
No
v-1
1
Jan
-12
Mar
-12
May
-12
Jul-
12
Sep
-12
No
v-1
2
Jan
-13
Mar
-13
May
-13
Jul-
13
Sep
-13
No
v-1
3
Jan
-14
Mar
-14
May
-14
Jul-
14
Sep
-14
No
v-1
4
Jan
-15
business situation Demand - current Demand - expectations SCI

Source: European Commission DG ECFIN, ELSTAT, Piraeus Bank Research
Consumer Confidence Indicator
24
The Consumer Confidence Index (CCI) improved but still remains strongly negative.
The January elections strengthened the consumers’ expectations. In February, the increase of the
ESI is directly linked to the improvement of the consumer confidence index by 18.7 ppt.
-90.0
-80.0
-70.0
-60.0
-50.0
-40.0
-30.0
-20.0
-10.0
0.0
Jan-
11
Mar
-11
May
-11
Jul-1
1
Sep-
11
Nov
-11
Jan-
12
Mar
-12
May
-12
Jul-
12
Sep-
12
Nov
-12
Jan-
13
Mar
-13
May
-13
Jul-1
3
Sep-
13
Nov
-13
Jan-
14
Mar
-14
May
-14
Jul-1
4
Sep-
14
Nov
-14
Jan-
15
Savings - expectations HSLD financial situation-expectations
Economic situation-expectations Unemployment-expectations
ConsCI

Economic Activity Indicators (Private & Public)
25
Source: Eurostat, ELSTAT, MinFin, Piraeus Bank Research
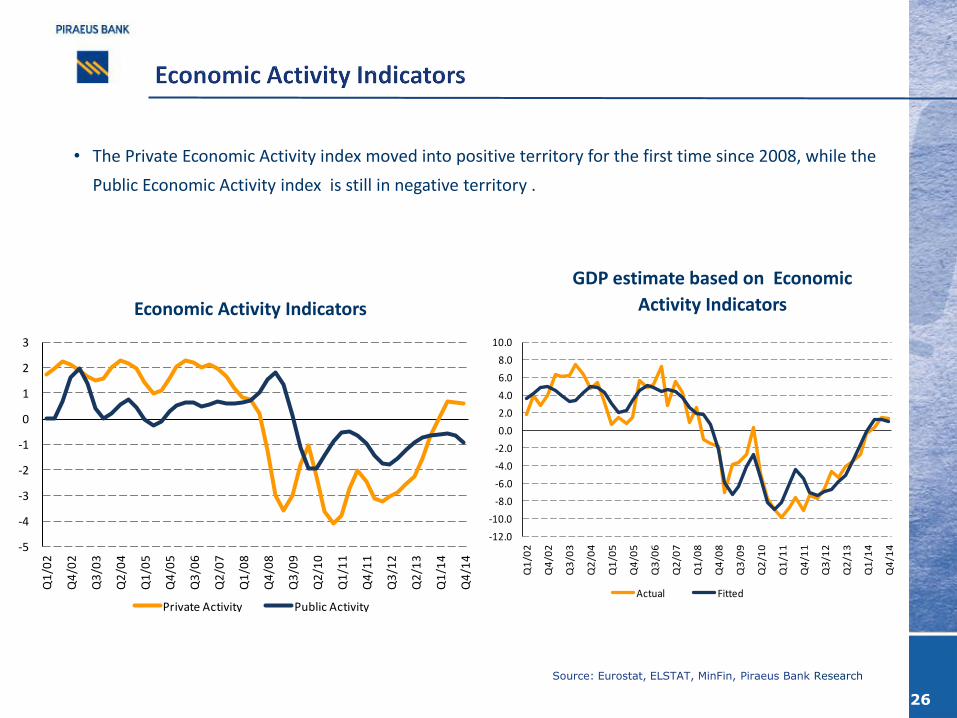
Economic Activity Indicators
GDP estimate based on Economic
Activity Indicators
26
• The Private Economic Activity index moved into positive territory for the first time since 2008, while the
Public Economic Activity index is still in negative territory .
-5
-4
-3
-2
-1
0
1
2
3
Q1
/02
Q4
/02
Q3
/03
Q2
/04
Q1
/05
Q4
/05
Q3
/06
Q2
/07
Q1
/08
Q4
/08
Q3
/09
Q2
/10
Q1
/11
Q4
/11
Q3
/12
Q2
/13
Q1
/14
Q4
/14
Private Activity Public Activity
-12.0
-10.0
-8.0
-6.0
-4.0
-2.0
0.0
2.0
4.0
6.0
8.0
10.0
Q1
/02
Q4
/02
Q3
/03
Q2
/04
Q1
/05
Q4
/05
Q3
/06
Q2
/07
Q1
/08
Q4
/08
Q3
/09
Q2
/10
Q1
/11
Q4
/11
Q3
/12
Q2
/13
Q1
/14
Q4
/14
Actual Fitted

* We used US Census Bureau X-12 ARIMA procedure in order to produce the trend - cycle time series, which represent the underling behavior and direction of
the series and capture the long – term behavior and the medium - term business cycles. (UK Office of National Statistics, ONS)
Source: DG EcFin, ELSTAT, Piraeus Bank Research
Industrial Production Index (IPI) &
Industrial Confidence Indicator (ICI)
Trend & Cycle *
27
Main components’ contribution to IPI growth rate
• In 2014, the Industrial Production Index decreased by -2.2% (2013: -3.2%), mainly due to the negative
contribution of IPI Electricity. Instead, IPI Manufacturing perform a positive sign after a 6-year period of
recession (2014: + 0.9% , 2013:- 0.7%).
• The performance of Industrial Production Index, combined with the expectations index indicate
deceleration in the short term.
-12.0
-10.0
-8.0
-6.0
-4.0
-2.0
0.0
2.0
4.0
6.0
Q1/1
1
Q2/1
1
Q3/1
1
Q4/1
1
Q1/1
2
Q2/1
2
Q3/1
2
Q4/1
2
Q1/1
3
Q2/1
3
Q3/1
3
Q4/1
3
Q1/1
4
Q2/1
4
Q3/1
4
Q4/1
4
contribution of "IPI Mining" contribution of "IPI Manufacturing"
contribution of "IPI Electricity" contribution of "IPI Water"
IPI (YoY % change)
0
20
40
60
80
100
120
140
-40.0
-35.0
-30.0
-25.0
-20.0
-15.0
-10.0
-5.0
0.0
5.0
10.0
Jan-0
1
Jul-
01
Jan-0
2
Jul-
02
Jan-0
3
Jul-
03
Jan-0
4
Jul-
04
Jan-0
5
Jul-
05
Jan-0
6
Jul-
06
Jan-0
7
Jul-
07
Jan-0
8
Jul-
08
Jan-0
9
Jul-
09
Jan-1
0
Jul-
10
Jan-1
1
Jul-
11
Jan-1
2
Jul-
12
Jan-1
3
Jul-
13
Jan-1
4
Jul-
14
Jan-1
5
IPI (level) - RHS IPI (YoY %change) - LHS ICI

Private Building Permits
& Confidence Indicator in Construction
Trend & Cycle*
28
Main components’ contribution to the growth of the Production Index in
Construction
• The number of new building permits, although at clearly low levels seems to be stabilizing.
• The Construction Production Index moves up exclusively due to the positive contribution of
construction in large infrastructure projects.
* We used US Census Bureau X-12 ARIMA procedure in order to produce the trend - cycle time series, which represent the underling behavior and direction of
the series and capture the long – term behavior and the medium - term business cycles. (UK Office of National Statistics, ONS)
Source: DG EcFin, ELSTAT, Piraeus Bank Research
-60.0
-40.0
-20.0
0.0
20.0
40.0
60.0
80.0
Q1/1
1
Q2/1
1
Q3/1
1
Q4/1
1
Q1/1
2
Q2/1
2
Q3/1
2
Q4/1
2
Q1/1
3
Q2/1
3
Q3/1
3
Q4/1
3
Q1/1
4
Q2/1
4
Q3/1
4
Q4/1
4
contribution of "PI of Building Construction"
contribution of "PI of Civil Engineering"
PI Construction (YoY % change)
0
1000
2000
3000
4000
5000
6000
7000
8000
9000
-100.0
-80.0
-60.0
-40.0
-20.0
0.0
20.0
40.0
Jan-0
1
Aug
-01
Mar-
02
Oct
-02
May-0
3
Dec-
03
Jul-
04
Feb
-05
Sep
-05
Ap
r-06
No
v-0
6
Jun-0
7
Jan-0
8
Aug
-08
Mar-
09
Oct
-09
May-1
0
Dec-
10
Jul-
11
Feb
-12
Sep
-12
Ap
r-13
No
v-1
3
Jun-1
4
Jan-1
5
Permits (level) - RHS Permits (YoY % change) - LHS CCI

Retail Trade Volume Index (excl. Fuels) &
Retail Confidence Indicator Trend & Cycle*
29
• The retail industry shows signs of stabilization. The level of volume index remains low but moves slightly
above the annual YoY level.
• The Retail Confidence Indicator suggests that the improving trend in the retail sector will decelerate.
• Wholesale trade is directly linked to the performance of the retail trade and the disposal of their stocks.
* We used US Census Bureau X-12 ARIMA procedure in order to produce the trend - cycle time series, which represent the underling behavior and direction
of the series and capture the long – term behavior and the medium - term business cycles. (UK Office of National Statistics, ONS)
Source: DG EcFin, ELSTAT, Piraeus Bank Research
Turnover Index in Wholesale Trade
Trend & Cycle*
0
20
40
60
80
100
120
140
-50.0
-40.0
-30.0
-20.0
-10.0
0.0
10.0
20.0
30.0
40.0
50.0
Jan-0
1
Aug
-01
Mar-
02
Oct
-02
May-0
3
Dec-
03
Jul-
04
Feb
-05
Sep
-05
Ap
r-06
No
v-0
6
Jun-0
7
Jan-0
8
Aug
-08
Mar-
09
Oct
-09
May-1
0
Dec-
10
Jul-
11
Feb
-12
Sep
-12
Ap
r-13
No
v-1
3
Jun-1
4
Jan-1
5
Retail trade (level) - RHS Retail (YoY % change) - LHS RCI
0
20
40
60
80
100
120
140
-20.0
-15.0
-10.0
-5.0
0.0
5.0
10.0
15.0
20.0
Q1/0
1
Q3/0
1
Q1/0
2
Q3/0
2
Q1/0
3
Q3/0
3
Q1/0
4
Q3/0
4
Q1/0
5
Q3/0
5
Q1/0
6
Q3/0
6
Q1/0
7
Q3/0
7
Q1/0
8
Q3/0
8
Q1/0
9
Q3/0
9
Q1/1
0
Q3/1
0
Q1/1
1
Q3/1
1
Q1/1
2
Q3/1
2
Q1/1
3
Q3/1
3
Q1/1
4
Q3/1
4
Wholesale Trade (level) - RHS Wholesale Trade (YoY % change)-LHS

Turnover Index in Automotive, Trend & Cycle*
30
• Elevated unemployment and reduced disposable income contributed to the decline in consumption
in consumer durables, hence the automobile industry has been significantly affected by the
downturn in the economy.
• In the services sector business confidence has improved.
Turnover Index in Services (excl. Trade & auto)
Confidence Indicator in Services, Trend & Cycle*
* We used US Census Bureau X-12 ARIMA procedure in order to produce the trend - cycle time series, which represent the underling behavior and
direction of the series and capture the long – term behavior and the medium - term business cycles. (UK Office of National Statistics, ONS)
Source: DG EcFin, ELSTAT, Piraeus Bank Research
0
50
100
150
200
250
-60.0
-50.0
-40.0
-30.0
-20.0
-10.0
0.0
10.0
20.0
30.0
Q1/0
1
Q3/0
1
Q1/0
2
Q3/0
2
Q1/0
3
Q3/0
3
Q1/0
4
Q3/0
4
Q1/0
5
Q3/0
5
Q1/0
6
Q3/0
6
Q1/0
7
Q3/0
7
Q1/0
8
Q3/0
8
Q1/0
9
Q3/0
9
Q1/1
0
Q3/1
0
Q1/1
1
Q3/1
1
Q1/1
2
Q3/1
2
Q1/1
3
Q3/1
3
Q1/1
4
Q3/1
4
Motor Trade (level) - RHS Motor Trade (YoY % change)-LHS
0
20
40
60
80
100
120
140
160
-50.0
-40.0
-30.0
-20.0
-10.0
0.0
10.0
20.0
30.0
40.0
50.0
Q1/0
1
Q4/0
1
Q3/0
2
Q2/0
3
Q1/0
4
Q4/0
4
Q3/0
5
Q2/0
6
Q1/0
7
Q4/0
7
Q3/0
8
Q2/0
9
Q1/1
0
Q4/1
0
Q3/1
1
Q2/1
2
Q1/1
3
Q4/1
3
Q3/1
4
Services(Level) - RHS Services (YoY % change) - LHS SCI-LHS
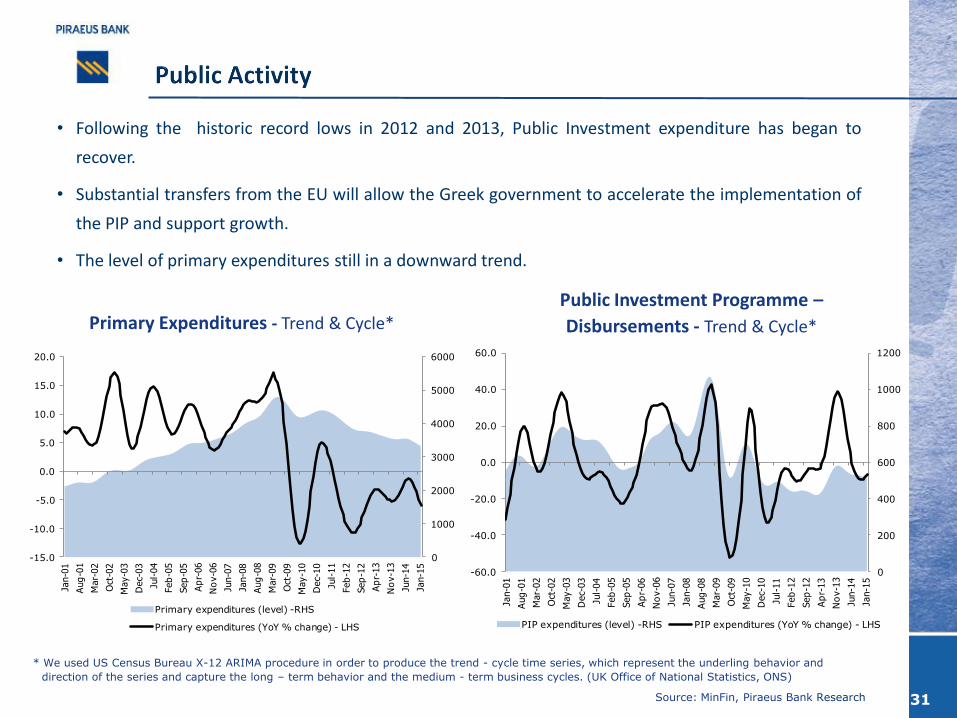
Primary Expenditures - Trend & Cycle*
31
Public Investment Programme –
Disbursements - Trend & Cycle*
• Following the historic record lows in 2012 and 2013, Public Investment expenditure has began to
recover.
• Substantial transfers from the EU will allow the Greek government to accelerate the implementation of
the PIP and support growth.
• The level of primary expenditures still in a downward trend.
* We used US Census Bureau X-12 ARIMA procedure in order to produce the trend - cycle time series, which represent the underling behavior and
direction of the series and capture the long – term behavior and the medium - term business cycles. (UK Office of National Statistics, ONS)
Source: MinFin, Piraeus Bank Research
0
200
400
600
800
1000
1200
-60.0
-40.0
-20.0
0.0
20.0
40.0
60.0
Jan-0
1
Aug
-01
Mar-
02
Oct
-02
May-0
3
Dec-
03
Jul-
04
Feb
-05
Sep
-05
Ap
r-06
No
v-0
6
Jun-0
7
Jan-0
8
Aug
-08
Mar-
09
Oct
-09
May-1
0
Dec-
10
Jul-
11
Feb
-12
Sep
-12
Ap
r-13
No
v-1
3
Jun-1
4
Jan-1
5
PIP expenditures (level) -RHS PIP expenditures (YoY % change) - LHS
0
1000
2000
3000
4000
5000
6000
-15.0
-10.0
-5.0
0.0
5.0
10.0
15.0
20.0
Jan-0
1
Aug
-01
Mar-
02
Oct
-02
May-0
3
Dec-
03
Jul-
04
Feb
-05
Sep
-05
Ap
r-06
No
v-0
6
Jun-0
7
Jan-0
8
Aug
-08
Mar-
09
Oct
-09
May-1
0
Dec-
10
Jul-
11
Feb
-12
Sep
-12
Ap
r-13
No
v-1
3
Jun-1
4
Jan-1
5
Primary expenditures (level) -RHS
Primary expenditures (YoY % change) - LHS

Output Gap,
Labour Market & Inflation
32

Source: ELSTAT, Piraeus Bank Research
• In 2014, inflation reached -1.3% from -0.9% in 2013.
• The reversal of the positive effect of tax hikes increase the intense of the deflation.
• GDP deflator moves lower than inflation.
33
HICP & Effect of Tax changes GDP deflator & CPI (YoY% change)
-3.0
-2.0
-1.0
0.0
1.0
2.0
3.0
4.0
5.0
6.0
2001 2002 2003 2004 2005 2006 2007 2008 2009 2010 2011 2012 2013 2014
Headline Inflation GDP deflator
-4.0
-3.0
-2.0
-1.0
0.0
1.0
2.0
3.0
4.0
5.0
6.0
7.0
Jan-0
8
Apr-
08
Jul-08
Oct-
08
Jan-0
9
Apr-
09
Jul-09
Oct-
09
Jan-1
0
Apr-
10
Jul-10
Oct-
10
Jan-1
1
Apr-
11
Jul-11
Oct-
11
Jan-1
2
Apr-
12
Jul-12
Oct-
12
Jan-1
3
Apr-
13
Jul-13
Oct-
13
Jan-1
4
Apr-
14
Jul-14
Oct-
14
Jan-1
5
HICP constant tax (YoY % change) Effect of tax changes
HICP (YoY % change)

Source: ELSTAT, Piraeus Bank Research
Unemployment rate
• Job creation schemes have had a substantial
impact on the labour market, leading to a
stabilisation in payroll figures and pushing
unemployment down on a yearly basis.
• In 2014 the unemployment rate reached an
average of 26.5% vs. 27.5% in 2013.
34
Employment (YoY % change & level)
Underemployed workers (% of employed)*
*Persons working in a part – time job because they could not find a full - time job
3,300
3,500
3,700
3,900
4,100
4,300
4,500
4,700
4,900
-12.0
-10.0
-8.0
-6.0
-4.0
-2.0
0.0
2.0
4.0
6.0
Q1/0
2
Q4/0
2
Q3/0
3
Q2/0
4
Q1/0
5
Q4/0
5
Q3/0
6
Q2/0
7
Q1/0
8
Q4/0
8
Q3/0
9
Q2/1
0
Q1/1
1
Q4/1
1
Q3/1
2
Q2/1
3
Q1/1
4
Q4/1
4
Employed, in thousands (RHS) YoY % change (LHS) average level (2001-2014), RHS
10.8 10.49.8
10.6 10.0
9.0 8.4 8.3
9.6
12.7
17.9
24.4
27.5 26.5
5
10
15
20
25
30
Q1/0
1
Q3/0
1
Q1/0
2
Q3/0
2
Q1/0
3
Q3/0
3
Q1/0
4
Q3/0
4
Q1/0
5
Q3/0
5
Q1/0
6
Q3/0
6
Q1/0
7
Q3/0
7
Q1/0
8
Q3/0
8
Q1/0
9
Q3/0
9
Q1/1
0
Q3/1
0
Q1/1
1
Q3/1
1
Q1/1
2
Q3/1
2
Q1/1
3
Q3/1
3
Q1/1
4
Q3/1
4
Quarterly Data Ετήσια στοιχεία
0.0
1.0
2.0
3.0
4.0
5.0
6.0
7.0
8.0
Q1/
04
Q3/
04
Q1/
05
Q3/
05
Q1/
06
Q3/
06
Q1/
07
Q3/
07
Q1/
08
Q3/
08
Q1/
09
Q3/
09
Q1/
10
Q3/
10
Q1/
11
Q3/
11
Q1/
12
Q3/
12
Q1/
13
Q3/
13
Q1/
14
Q3/
14

Source: Eurostat, ELSTAT, MinFin, Piraeus Bank Research 35
Real Time Output Gap Index
(base period 1993 -2013) Inflation & Output Gap
• Continuing high unemployment and low levels of Capacity Utilization for a long time-period have
created an intensive output gap in the economy.
• In case where the output gap is strongly negative the inflation (at constant tax rates) remains low
and vise versa.
-2.0
-1.0
0.0
1.0
2.0
3.0
4.0
5.0
6.0
-3 -2.5 -2 -1.5 -1 -0.5 0 0.5 1 1.5
HIC
P c
on
stan
t ta
x yo
y% c
han
ge
Output Gap
-3.0
-2.5
-2.0
-1.5
-1.0
-0.5
0.0
0.5
1.0
1.5
Q1/
93
Q4/
93
Q3/
94
Q2/
95
Q1/
96
Q4/
96
Q3/
97
Q2/
98
Q1/
99
Q4/
99
Q3/
00
Q2/
01
Q1/
02
Q4/
02
Q3/
03
Q2/
04
Q1/
05
Q4/
05
Q3/
06
Q2/
07
Q1/
08
Q4/
08
Q3/
09
Q2/
10
Q1/
11
Q4/
11
Q3/
12
Q2/
13
Q1/
14
Q4/
14

Employment & GVA by sector (current prices, ESA 2010) , % of total*
• During the crisis efforts to transfer resources seems to take place.
• In sectors such as construction and manufacturing, the reduction of gross added value share led
to a decrease in the proportion of employed; the opposite has happened at the primary sector
and services.
Source: ELSTAT, Piraeus Bank Research 36
0.0
5.0
10.0
15.0
20.0
25.0
30.0
0.0 2.0 4.0 6.0 8.0 10.0 12.0 14.0 16.0 18.0 20.0 22.0 24.0 26.0 28.0 30.0 32.0 34.0
GV
A (
% o
f to
tal)
employment (% of total)
Indust.2014
Indust. 2008
Trade2008
Primary2008
Primary2014
Trade2014
Constr.2014
Constr.2008
51.0
53.0
55.0
57.0
59.0
61.0
63.0
65.0
67.0
69.0
37.0 39.0 41.0 43.0 45.0 47.0 49.0 51.0 53.0 55.0 57.0 59.0
GV
A (
% o
f to
tal)
employment (% of total)
other Services2008
other Services 2014
Primary: Agriculture, forestry and fishing Mining and quarrying;
Industry: manufacturing; electricity, gas, steam and air conditioning supply; water supply; sewerage, waste management and remediation activities
Trade: Wholesale and retail trade; repair of motor vehicles and motorcycles; transportation and storage; accommodation and food service activities
Other services: Information and communication Financial and insurance activities Real estate activities Professional, scientific and technical activities;
administrative and support service activities Public administration and defence; compulsory social security; education; human health and social work activities
Arts, entertainment and recreation, repair of household goods and other services

Banking Sector
37

Source: Bank of Greece, Piraeus Bank Research
Non-Performing Loans (% of total loans)
38
Δ(NPL) QoQ & Δ(Unemployment Rate),sa QoQ
The stock of non-performing loans is still increasing.
Nevertheless the formation of new NPLs should
decelerate following the stabilization of the labour
market.
Δ(NPL) YoY & Employment growth rate (YoY % change)
0.0
10.0
20.0
30.0
40.0
50.0
60.0
Q1 2
007
H1 2
007
9M
2007
2007
Q1 2
008
H1 2
008
9M
2008
2008
Q1 2
009
H1 2
009
9M
2009
2009
Q1 2
010
Η1 2
010
9M
2010
2010
Q1 2
011
Η1 2
011
9M
2011
2011
Q1 2
012
H1 2
012
9M
2012
2012
Q1 2
013
H1 2
013
9M
2013
2013
Q1 2
014
H1 2
014
9M
2014
Total Loans Consumer Corporate loans Mortgage Loans
-1.00
-0.50
0.00
0.50
1.00
1.50
2.00
2.50
3.00
3.50
Q1/0
7
Q2/0
7
Q3/0
7
Q4/0
7
Q1/0
8
Q2/0
8
Q3/0
8
Q4/0
8
Q1/0
9
Q2/0
9
Q3/0
9
Q4/0
9
Q1/1
0
Q2/1
0
Q3/1
0
Q4/1
0
Q1/1
1
Q2/1
1
Q3/1
1
Q4/1
1
Q1/1
2
Q2/1
2
Q3/1
2
Q4/1
2
Q1/1
3
Q2/1
3
Q3/1
3
Q4/1
3
Q1/1
4
Q2/1
4
Q3/1
4
Q4/1
4
Q1/1
5
Q2/1
5
Δ(NPL) [(Q(t) - Q(t-1)] Δ(Unemployment Rate) [(Q(t) - Q(t-1)](t-2)
-15.0
-10.0
-5.0
0.0
5.0
10.0
15.0
Q1/0
7
Q2/0
7
Q3/0
7
Q4/0
7
Q1/0
8
Q2/0
8
Q3/0
8
Q4/0
8
Q1/0
9
Q2/0
9
Q3/0
9
Q4/0
9
Q1/1
0
Q2/1
0
Q3/1
0
Q4/1
0
Q1/1
1
Q2/1
1
Q3/1
1
Q4/1
1
Q1/1
2
Q2/1
2
Q3/1
2
Q4/1
2
Q1/1
3
Q2/1
3
Q3/1
3
Q4/1
3
Q1/1
4
Q2/1
4
Q3/1
4
Q4/1
4
ΔNPL (YoY) Employment (YoY % change)

Source: DG EcFin, ECB, BoG, Eurostat, ELSTAT, Piraeus Bank Research 39
Total Loans (% of GDP) Loans, Greece (YoY % change & net flows)
Note: Flows are derived from the differences in outstanding amounts
corrected for loan write-offs, exchange rate valuations and
reclassifications.
• Both the decrease in nominal GDP and the level of loan outstanding amount leads to a slight
decrease in the ratio of loans to GDP.
• The rate of decline in loans is clearly negative, however at end -2014 the negative monthly net flow
seems to limit.
100,000
120,000
140,000
160,000
180,000
200,000
220,000
240,000
260,000
280,000
95.0
100.0
105.0
110.0
115.0
120.0
125.0
Q1
/09
Q2
/09
Q3
/09
Q4
/09
Q1
/10
Q2
/10
Q3
/10
Q4
/10
Q1
/11
Q2
/11
Q3
/11
Q4
/11
Q1
/12
Q2
/12
Q3
/12
Q4
/12
Q1
/13
Q2
/13
Q3
/13
Q4
/13
Q1
/14
Q2
/14
Q3
/14
Q4
/14
Outstanding amount (mn €), RHS Greece (% of GDP), LHS Euroarea (% of GDP), LHS
-3000.0
-2000.0
-1000.0
0.0
1000.0
2000.0
3000.0
4000.0
-15.0
-10.0
-5.0
0.0
5.0
10.0
15.0
20.0
Jan
-09
Ma
r-0
9M
ay
-09
Jul-
09
Se
p-0
9N
ov
-09
Jan
-10
Ma
r-1
0M
ay
-10
Jul-
10
Se
p-1
0N
ov
-10
Jan
-11
Ma
r-1
1M
ay
-11
Jul-
11
Se
p-1
1N
ov
-11
Jan
-12
Ma
r-1
2M
ay
-12
Jul-
12
Se
p-1
2N
ov
-12
Jan
-13
Ma
r-1
3M
ay
-13
Jul-
13
Se
p-1
3N
ov
-13
Jan
-14
Ma
r-1
4M
ay
-14
Jul-
14
Se
p-1
4N
ov
-14
Jan
-15
net flow, mn € -RHS YoY% change - LFS

Source: BoG, ELSTAT, Piraeus Bank Research 40
Total Deposits & Repos* Deposits & Repos (YoY % change & net flows)*
Note: excl. Bank of Greece & liabilities associated with assets disposed
of in a securitization but still recognized on the statistical balance sheet Notes: Flows are derived from changes in outstanding amounts
corrected for foreign exchange valuations and reclassifications
adjustments.
The flow of deposits does not include the accounting increase in
deposits by non-euro area residents that is related to securitisation
operations and represent liabilities of credit institutions to Special
Purpose Vehicles.
• The deposits to GDP ratio exceeds 100%.
• The negative monthly net flows indicate that the outflow of deposits continues in 2014 as well.
0
50,000
100,000
150,000
200,000
250,000
300,000
0.0
20.0
40.0
60.0
80.0
100.0
120.0
140.0
Q1/0
9
Q2/0
9
Q3/0
9
Q4/0
9
Q1/1
0
Q2/1
0
Q3/1
0
Q4/1
0
Q1/1
1
Q2/1
1
Q3/1
1
Q4/1
1
Q1/1
2
Q2/1
2
Q3/1
2
Q4/1
2
Q1/1
3
Q2/1
3
Q3/1
3
Q4/1
3
Q1/1
4
Q2/1
4
Q3/1
4
Q4/1
4
Outstanding amount (mn €) Loans (% of GDP)
-25000
-20000
-15000
-10000
-5000
0
5000
10000
15000
-25.0
-20.0
-15.0
-10.0
-5.0
0.0
5.0
10.0
15.0
Jan-0
9M
ar-
09
May-0
9Ju
l-09
Sep-0
9N
ov-0
9Ja
n-1
0M
ar-
10
May-1
0Ju
l-10
Sep-1
0N
ov-1
0Ja
n-1
1M
ar-
11
May-1
1Ju
l-11
Sep-1
1N
ov-1
1Ja
n-1
2M
ar-
12
May-1
2Ju
l-12
Sep-1
2N
ov-1
2Ja
n-1
3M
ar-
13
May-1
3Ju
l-13
Sep-1
3N
ov-1
3Ja
n-1
4M
ar-
14
May-1
4Ju
l-14
Sep-1
4N
ov-1
4Ja
n-1
5
Net f low, mn € - RHS YoY% change - LFS

• The level of deflation in Greece burdens the real rates.
• One of the biggest side effects of the lack of liquidity and the political uncertainty is the high cost of
funding for Greek Corporates.
41
Piraeus Bank Greek Corporate Bond
Index – Weighted Average Yield
Average Real Interest Rate on New bank loans
(<€1mn) to Non Financial Corporations
(nominal rate minus change in HICP, %)
Source: ELSTAT, Eurostat, Bank of Greece, ECB, Bloomberg, Piraeus Bank Research
0.0
1.0
2.0
3.0
4.0
5.0
6.0
7.0
8.0
9.0
10.0
2/1/2013
11/2/2013
23/3/2013
2/5/2013
11/6/2013
21/7/2013
30/8/2013
9/10/2013
18/11/2013
28/12/2013
6/2/2014
18/3/2014
27/4/2014
6/6/2014
16/7/2014
25/8/2014
4/10/2014
13/11/2014
23/12/2014
1/2/2015
13/3/20150.0
1.0
2.0
3.0
4.0
5.0
6.0
7.0
8.0
9.0
Q1/0
9
Q2/0
9
Q3/0
9
Q4/0
9
Q1/1
0
Q2/1
0
Q3/1
0
Q4/1
0
Q1/1
1
Q2/1
1
Q3/1
1
Q4/1
1
Q1/1
2
Q2/1
2
Q3/1
2
Q4/1
2
Q1/1
3
Q2/1
3
Q3/1
3
Q4/1
3
Q1/1
4
Q2/1
4
Q3/1
4
Q4/1
4
Euroarea Greece

Source: Bank of Greece, Piraeus Bank Research
Liabilities to the Eurosystem (mn. €)
• Liabilities to the Eurosystem increased from €4 bn in Jan 2008 to €135.8 bn in June 2012. An outlier was
recorded in February 2012 (€158 bn), due to the PSI procedure.
• By 2014, this figure had fallen and by mid-year banks stopped using the ELA mechanism.
• However, in the beginning of 2015 and when the uncertainty increased, the Greek financial institutions
increased their liabilities to the ELA mechanism up €5,2 bn in January. Additionally, funding through the
ECB reached €82,3 bn from €56 bn in Dec.’14.
42
0
20,000
40,000
60,000
80,000
100,000
120,000
140,000
160,000
180,000
Jul-
11
Au
g-1
1Se
p-1
1O
ct-1
1N
ov-
11
De
c-1
1Ja
n-1
2Fe
b-1
2M
ar-1
2A
pr-
12
May
-12
Jun
-12
Jul-
12
Au
g-1
2Se
p-1
2O
ct-1
2N
ov-
12
De
c-1
2Ja
n-1
3Fe
b-1
3M
ar-1
3A
pr-
13
May
-13
Jun
-13
Jul-
13
Au
g-1
3Se
p-1
3O
ct-1
3N
ov-
13
De
c-1
3Ja
n-1
4Fe
b-1
4M
ar-1
4A
pr-
14
May
-14
Jun
-14
Jul-
14
Au
g-1
4Se
p-1
4O
ct-1
4N
ov-
14
De
c-1
4Ja
n-1
5
ELA ECB

Public Sector
43

44 Source: Ministry of Finance, Piraeus Bank Research
/1 The total revenue and expenditure outcome is preliminary and will be finalized after the vote of 2014 annual budget report (for both revenue and expenditure). /2 Annual estimates as depicted in the 2015 Budget.
2014 2015 2014 2015
Jan.-Feb Jan. - Feb Target Difference Outcome /1
Estimates /2
Ordinary Budget (1) (2) (2-1) (3) (2-3) (4) (5)
Net revenue 7,869 7,298 -571 8,467 -1,169 46,650 50,871
Revenues before tax refunds 8,366 7,905 -461 8,778 -872 49,636 53,171
Special revenue from licensing public rights 0 0 0 152 -152 384 577
Tax refunds 497 608 111 463 145 3,370 2,877
Expenditures 8,369 7,745 -624 8,477 -731 48,472 49,305
Primary expenditure 6,418 6,307 -111 6,898 -591 41,928 41,887
Military procurement (on a cash basis) 5 0 -5 70 -70 345 700
Guarantees called 370 6 -364 29 -23 587 818
to bodies classified inside the General Government
(net basis)364 6 -358 7 -1 442 667
to bodies classified outside the General Government 6 0 -6 22 -22 145 151
Net interest payments 1,576 1,432 -144 1,480 -48 5,569 5,900
Loan disbursement fee to EFSF 0 0 0 0 0 42 0
Ordinary Budget balance -500 -447 53 -10 -437 -1,822 1,566
PIP
Revenue 1,594 496 -1,098 290 206 4,717 4,732
Expenditures 606 238 -368 350 -112 6,592 6,400
PIP Balance 988 258 -730 -60 318 -1,875 -1,668
Net Revenues State Budget 9,463 7,794 -1,669 8,757 -963 51,367 55,603
Expenditures State Budget 8,976 7,983 -992 8,827 -844 55,064 55,705
State Budget Balance 487 -189 -676 -70 -119 -3,697 -102
State Budget Primary Balance 2,063 1,243 -820 1,411 -168 1,872 5,798
State Budget Execution 2015
million € Difference
Jan.-Feb. 2015

Source: IMF, MinFin, EFSF, Piraeus Bank Research
Disbursements of the Economic Programmes (€ bn)
• Official Sector Funding to Greece has resumed. Currently the combined disbursements of the two economic
programmes amount to €226.7 bn, €73.1 bn from the first and €153.6 bn from the second.
• In 2014, Greece returned to the Bond Markets after four years. On April, a 5-year bond was issued having a
principal amount of €3 bn, and an annual coupon of 4.75% and on July a 3-year bond with a principal amount
of €1.5bn and an annual coupon of 3.375%.
45
73.1
226.7
0
50
100
150
200
250
0
5
10
15
20
25
30
35
40
45
May-
10
Sep-1
0
Dec-
10
Jan-1
1
Mar-
11
Jul-11
Dec-
11
Mar-
12
Apr-
12
May-
12
June-1
2
Dec-
12
Jan-1
3
Feb-1
3
May-
13
Ιουν-
13
July
-13
Dec-
13
April-14
June-1
4
July
-14
Aug-1
4
EFSF: other tranches (€47.8 bn) EFSF: Bank recapitalisation (€48.2bn)
EFSF: PSI & DBB ( €45.8 bn) EΑ Bilateral (€ 52.9bn)
IMF (SBA: € 20.2bn, EFF: €11.7bn) Total (cumulative), RHS

Source: Bloomberg, MinFin, EFSF, IMF, Piraeus Bank Research
Bonds & Loans Maturities, as of March 2015 (€ mn ) *
Following the completion of the PSI & Debt Buy – Back, and the implementation of the Eurogroup’s
decisions (November 2012) regarding the extension of the maturities of the bilateral and EFSF loans,
the maturity profile of Greek Government debt spreads all the way to 2057.
46
* Figures do not include short-term securities (T-bills) and circa €25bn related to Bank of Greece loans, special and bilateral loans, other internal and
external loans, repos and external securitizations.
0
2000
4000
6000
8000
10000
12000
14000
16000
18000
20000
2015
2016
2017
2018
2019
2020
2021
2022
2023
2024
2025
2026
2027
2028
2029
2030
2031
2032
2033
2034
2035
2036
2037
2038
2039
2040
2041
2042
2043
2044
2045
2046
2047
2048
2049
2050
2051
2052
2053
2054
2055
2056
2057
EU (bilateral) IMF EFSF (PSI & BB) EFSF (Recap) EFSF (new loan) Railway & OASA International GGB (National Central Banks) GGB (ECB) GGB (new)

Disclaimer: This note constitute an investment advertisement, is intended solely for information purposes and it cannot in any way be considered investment
advice, offer or recommendation to enter into any transaction. The information included in this note may not be construed as suitable investment for the holder,
nor may it be considered as an instrument to accomplish specific investment goals or relevant financial needs of the holder and may neither be reckoned as a
substitute to relevant contractual agreements between the Bank and the holder. Before entering into any transaction each individual investor should evaluate the
information contained in this note and not base his/her decision solely on the information provided. This note cannot be considered investment research and
consequently it was not compiled by Piraeus Bank according to the requirements of the law that are intended to ensure independence in the sector of investment
research. Information comprised in this note is based on publically available sources that are considered to be reliable. Piraeus Bank cannot be held accountable
for the accuracy or completeness of the information contained in this note. Views and estimates brought forward in this note represent domestic and international
market trends on the date indicated in the note and they are subject to alteration without previous warning. Piraeus Bank may also include in this note investment
research done by third parties. This information is not modified in any way, consequently the Bank cannot be held accountable for the content. The Piraeus Bank
Group is and organization with a considerable domestic and international presence, and provides a great variety of investment services. In cases where conflicts
of interest issues should arise while Piraeus Bank or the rest of the companies of the group provide investment services in relation to the information provided in
this note, Piraeus Bank and the companies of the Group should be underlined that (the list is not exhaustive): a) No restrictions apply in dealing for own account,
or with regards to trading in relation to portfolios managed by Piraeus Bank or companies of its group before the publication of this note, or with regards to trading
before an initial public offer. b) It is possible that investment or additional services are provided to the issuers included in this note against a fee. c) It is possible
that Bank or any of its subsidiaries participate in the share capital of any of the issuers included in this note or may attract other interests financial or not from them.
d) The Bank or any of its subsidiaries may act a market maker or an underwriter for any of the issuers included in the note. e) Piraeus Bank may have issued
similar notes with different or incompatible content with the content of this note. It should be explicitly noted that: a) Figures refer to past performances and past
performances do not constitute a safe indication for future performances. b) Figures constitute simulation of past performances and they are not a safe indication
of future performances. c) Any projections or other estimates are not safe indications for future performances. d) Taxation treatment of information provided in this
note may differ according to the rules that govern each individual investor. Therefore the holder should seek independent advice in relation to taxation rules that
may affect him/her. e) Piraeus Bank is not under any obligation to keep data and information provided herein updated.
47