q1 2014 resultsresults.orange.com/20140429-db550f12/en/materials/orange_201404… · q1 2014...
TRANSCRIPT

April 29th, 2014
Q1 2014 results Gervais Pellissier, Deputy CEO and CFO
Q1 2014 results – April 29th, 2014

Q1 2014 highlights 1

4
restated EBITDA margin stabilised at 30.8% thanks to slower revenue decrease and ongoing cost reduction
in €m Q1 13
cb Q1 14 actual
% yoy cb
key points
revenues 10,192 9,804 -3.8% better trend than Q4 13 (-5.1% and -3.8% ex. reg.)
regulatory effect represented only €89m, mainly from Spain excl. regulation -3.0%
restated EBITDA* 3,138 3,017 -3.8% indirect cost reduction €114m, confirming our guidance of at least €250m decrease for 2014
stable EBITDA margin, in line with FY guidance in % of rev. 30.8% 30.8% 0.0pt
CAPEX 1,143 1,161 +1.6% 58% dedicated to network (+5 points yoy)
in % of rev. 11.2% 11.8% +0.6pts
* see slide 25 for EBITDA restatements Q1 2014 results – April 29th, 2014 yoy: year-on-year; comparison with same quarter previous year
qoq: quarter-on-quarter; comparison with previous quarter
5
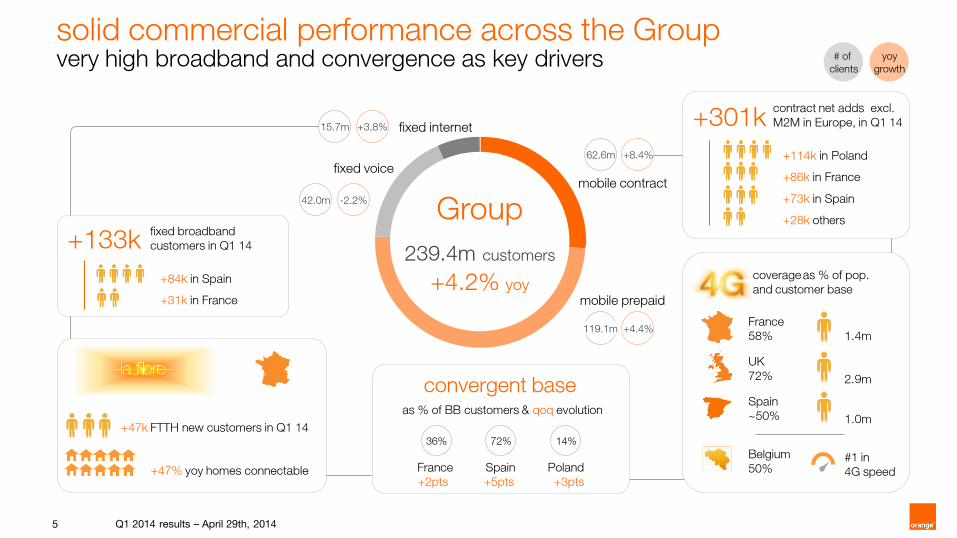
solid commercial performance across the Group very high broadband and convergence as key drivers
contract net adds excl.
M2M in Europe, in Q1 14
+114k in Poland
+86k in France
+73k in Spain
+28k others
+301k
as % of BB customers & qoq evolution
France Spain Poland
+2pts +5pts +3pts
convergent base
72% 14% 36%
fixed broadband
customers in Q1 14
+84k in Spain
+31k in France
+133k
+47k FTTH new customers in Q1 14
+47% yoy homes connectable
France
58%
UK
72%
Spain
~50%
Belgium
50%
1.4m
2.9m
1.0m
#1 in
4G speed
coverage as % of pop.
and customer base
62.6m +8.4%
42.0m -2.2%
+4.4%
mobile prepaid
fixed voice mobile contract
fixed internet
Group
239.4m customers
+4.2% yoy
# of
clients
yoy
growth
15.7m +3.8%
Q1 2014 results – April 29th, 2014
119.1m 119.1m

6
ongoing cost reduction enabling stable EBITDA margin with 69% of revenue attrition compensated by Opex savings
Q1 2014 results – April 29th, 2014
stabilizing Group restated EBITDA margin for Q1 2014
48 %
8 %
-3 %
57%
23 %17%
69%
Q1 14 2013 2012 2011
Q1 14
-0.5pt
0.0pt
2013 2011
-1.1pt -1.0pt
2012
-2.0pt
-1.6pt -1.5pt
France Group
revenue decline offset by opex savings in % of revenue decline
* includes €22m gain from the disposal of Arkadin shares
France Group
FY 2014 Group restated EBITDA margin stabilization confirmed

7
indirect costs** direct costs
improving Q1 2014 Group restated EBITDA trend EBITDA down -€120m vs. -€222m in Q1 2013
change in EBITDA* in €m
Q1 2014 results – April 29th, 2014 * see slide 25 for EBITDA restatements
** underlying indirect costs yoy improvement of €92m after excluding gain from Arkadin disposal
stable margin
Q1 14
30.8%
3,017
IT&N,
property,
G&A &
other
+38
labour
opex
+76
other direct
costs
-8
commercial
& content
costs
+104
interco
costs
+57
revenues
-387
Q1 13
cb
30.8%
3,138
+114m€ +152m€
direct costs indirect costs
-92 -68
-149
-182-130
-108
-162
-152
-37
1Q14
-267
-114*
4Q13
-311
3Q13
-176
2Q13
-222
1Q13
-219
confirming guidance of >€250m indirect costs decrease in 2014
yoy change in Group Opex base in €m

8
€76m reduction in labour expenses in Q1 14 impacted by :
– a significant volume effect of almost €100m
driven by a 4% yoy drop in the average number of full-time employees
evenly spread across both France & International (especially Poland)
– moderate impact of salary policies on labour costs per FTE
with France at +1.9%, helped by employee tax offsets in France (CICE) for €12m yoy
International at +3.7%
confirmed decrease of labour expenses with a significantly positive volume effect boosted by yoy phasing differences
-20
-3.4%
Q1 14
-2,197
price effect
& other*
-22
-2
volume effect
+99
+26
+73
Q1 13 cb
-2,274
* o/w profit sharing ** Average Full Time Equivalents
Group average FTE** down -4% in 1 year (in ‘000s)
Group labour expenses down €76m in €m
International
France
Q1 2014 results – April 29th, 2014
-4.0%
Q1 14
International
France
155.1
62.0
93.0
Q1 13 cb
161.6
64.7
96.9

9
increased CAPEX on 4G and FTTH to support future growth
> 5,400 4G sites, covering 58% of population, up 8pp from 50% end of 4Q13
+171k FTTH homes connectable despite adverse weather conditions
> 2,400 4G sites, covering around 50% of population
targeting 66% population coverage by end 2014
8,700 sites shared with T-Mobile
> 2,000 4G sites covering 29% of population
€207m invested in Q1 14 or +€51m yoy
Mobistar, independently recognized as having best network*, commercially launched 4G March 31st, with
50% population coverage
+24
+53
-58
Q1 14 Q1 13 cb
investment in very high speed networks
(4G, FTTH and VDSL) up +66% yoy
4G
FTTH VDSL
mutualisation, rationalization & phasing out
11.8%
11.2%
as of Q1 2014
1,161
1,143
Q1 2014 results – April 29th, 2014 * for 2G voice, 3G indoor coverage and all 4G KPIs, incl. download and upload speed (source: Commsquare)
%
CAPEX evolution in €m
CAPEX as % of revenues
10
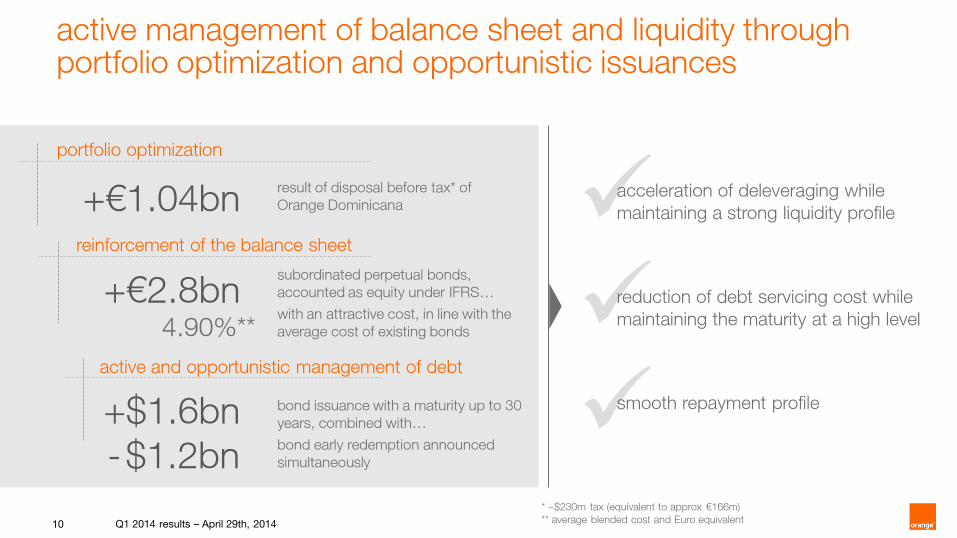
active management of balance sheet and liquidity through portfolio optimization and opportunistic issuances
+€2.8bn
reinforcement of the balance sheet
4.90%**
+€1.04bn
portfolio optimization
+$1.6bn
- $1.2bn
active and opportunistic management of debt
result of disposal before tax* of
Orange Dominicana
subordinated perpetual bonds,
accounted as equity under IFRS…
with an attractive cost, in line with the
average cost of existing bonds
reduction of debt servicing cost while
maintaining the maturity at a high level
smooth repayment profile
acceleration of deleveraging while
maintaining a strong liquidity profile
* ~$230m tax (equivalent to approx €166m)
** average blended cost and Euro equivalent
bond issuance with a maturity up to 30
years, combined with…
bond early redemption announced
simultaneously
Q1 2014 results – April 29th, 2014

business review 2
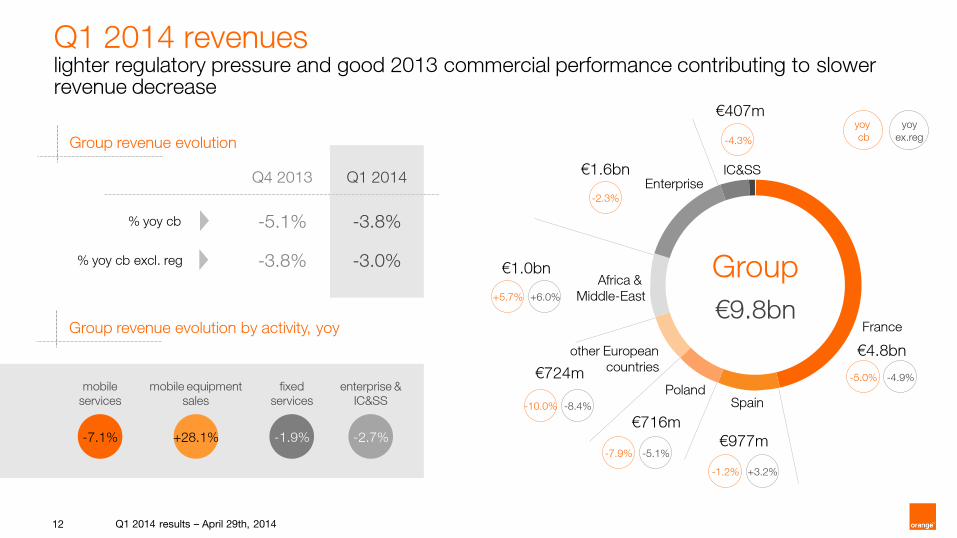
12
-3.8%
-3.8% -5.1%
+5.7% +6.0%
€1.0bn
Q1 2014 revenues lighter regulatory pressure and good 2013 commercial performance contributing to slower revenue decrease
Q1 2014 results – April 29th, 2014
yoy
cb
yoy
ex.reg
-3.0%
% yoy cb
Q4 2013 Q1 2014
€4.8bn
-1.2% +3.2%
€977m -7.9% -5.1%
€716m -10.0% -8.4%
€724m
-2.3%
€1.6bn
-4.3%
€407m
Enterprise IC&SS
Africa &
Middle-East
other European
countries
Poland Spain
France
Group
€9.8bn
% yoy cb excl. reg
-7.1%
mobile
services
+28.1%
mobile equipment
sales
-1.9%
fixed
services
-2.7%
enterprise &
IC&SS
Group revenue evolution
Group revenue evolution by activity, yoy
-5.0% -4.9%

13
fixed services
ex. reg -€49m
in €m
Q1 13 cb
Q1 14 actual
% yoy cb
revenues 5,065 4,810 -5.0%
excl. regulation -4.9%
mobile services 2,157 1,948 -9.7%
mobile equipment 119 119 +0.3%
fixed services 2,662 2,620 -1.6%
other revenues 128 123 -3.7%
0
other
-5
wholesale
+33
Q1 14
4,810
BB
+6
narrowband
-88
mobile
equipment
sales
mobile
service
revenues
-196
regulatory
impacts
-6
Q1 13
cb
5,065
Q1 2014 France financials improving fixed revenue trend and additional repricing of the mobile base
revenues evolution breakdown (in €m)
mobile service revenues mirrored further repricing and SIMO/convergent offers penetration
− 79% of the contract customer base on a 2013 offer
− annual rolling ARPU evolution at -10.4% after -11.5% in Q4 13
− improved value drivers with growing share of 4G (reaching 8% of contract
voice customer base) and convergent customers
Q1 2014 results – April 29th, 2014
-9.1% ex reg
fixed revenues trend keeps improving at -1.6% in Q1 14 net adds, in ‘000s
− revenue decrease excl. reg limited to
-€49m vs. -€94m in Q1 13
− slow-down of PSTN revenues decrease
(-€88m in Q1 14 vs. -€120m in Q1 13)
− stable BB revenues: favourable base effect
thanks to +77% fibre customers yoy offset
by increasing weight of Open customers
(36% of BB base vs. 27% in Q1 13)
-261 -240
-166-140
+175+120
Q1 13
+30 +47
Q1 14
PSTN only FTTH
PSTN & ADSL naked DSL & other
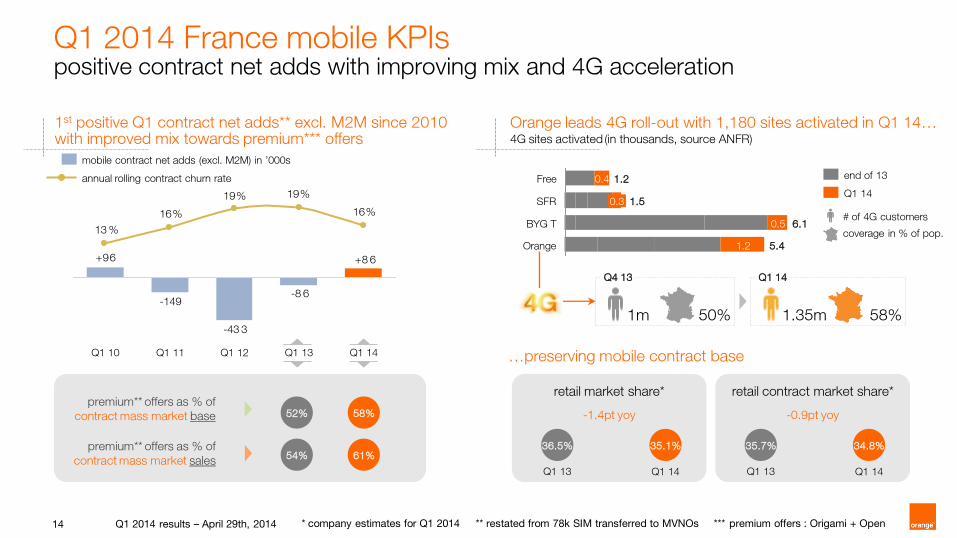
14
Q1 2014 France mobile KPIs positive contract net adds with improving mix and 4G acceleration
1st positive Q1 contract net adds** excl. M2M since 2010 with improved mix towards premium*** offers
Q1 2014 results – April 29th, 2014
+8 6
-8 6
-43 3
-149
+96
16%
19%19%
16%
13 %
Q1 14 Q1 13 Q1 12 Q1 11 Q1 10
premium** offers as % of
contract mass market base
premium** offers as % of
contract mass market sales
Orange 5.4 1.2
BYG T 6.1 0.5
SFR 1.5 0.3
Free 1.2 0.4
58% 50% 1m 1.35m
Orange leads 4G roll-out with 1,180 sites activated in Q1 14… 4G sites activated (in thousands, source ANFR)
Q4 13
Q1 14
end of 13
Q1 14
# of 4G customers
coverage in % of pop.
* company estimates for Q1 2014 ** restated from 78k SIM transferred to MVNOs *** premium offers : Origami + Open
…preserving mobile contract base
retail market share*
-1.4pt yoy
Q1 13 Q1 14
36.5% 35.1%
retail contract market share*
-0.9pt yoy
Q1 13 Q1 14
35.7% 34.8%
52% 58%
54% 61%
annual rolling contract churn rate
mobile contract net adds (excl. M2M) in ’000s
15
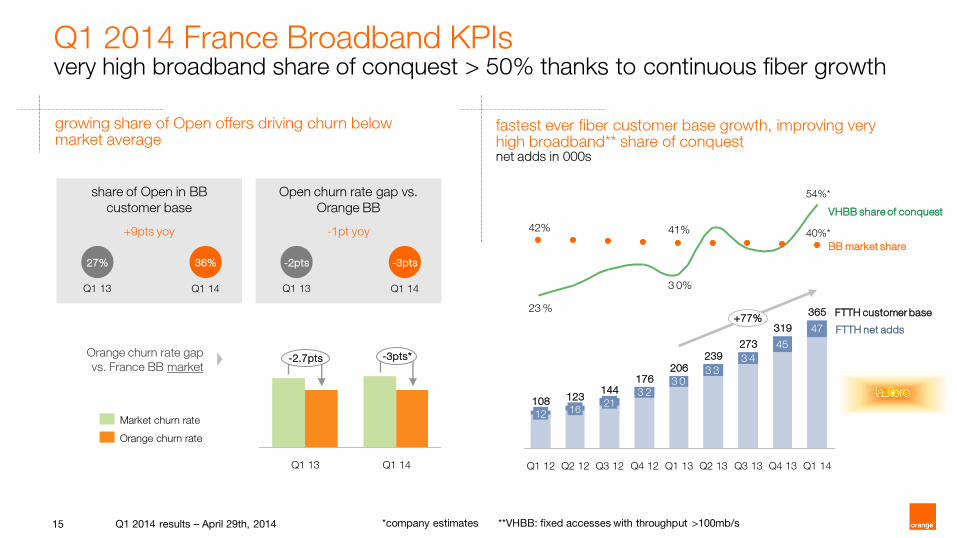
Q1 2014 France Broadband KPIs very high broadband share of conquest > 50% thanks to continuous fiber growth
*company estimates
41%42%
3 0%
23 %
54%*
40%*
BB market share
VHBB share of conquest
3 23 0
3 33 4
45
47
Q1 14
365
Q4 13
319
Q3 13
273
Q2 13
239
Q1 13
206
Q4 12
176
Q3 12
144
21
Q2 12
123
16
Q1 12
108
12
+77% FTTH net adds
FTTH customer base
Orange churn rate gap
vs. France BB market
growing share of Open offers driving churn below market average
Q1 2014 results – April 29th, 2014
fastest ever fiber customer base growth, improving very high broadband** share of conquest net adds in 000s
-3pts* -2.7pts
Q1 14 Q1 13
Orange churn rate
Market churn rate
**VHBB: fixed accesses with throughput >100mb/s
share of Open in BB
customer base
+9pts yoy
Q1 13 Q1 14
27% 36%
Open churn rate gap vs.
Orange BB
-1pt yoy
Q1 13 Q1 14
-2pts -3pts

16
Q1 2014 Spain continuous growth in customer base driving improvement in revenue trend
fixed broadband: customer base growing 24%, now 72% convergent mobile: strong growth in contract customers
27%
Q1 13
12,179
70%
30%
+1.5%
contract
prepaid
Q1 14
12,366
73%
mobile customers in 000s
+6.4%
net adds in 000s
+8 4
+40
x 2.1
Q1 14 Q1 13
customers (in 000s) and share of
convergent (in %)
in €m
Q1 13 cb
Q1 14 actual
% yoy cb
revenues 989 977 -1.2%
excl. regulation +3.2%
mobile services 741 621 -16.2%
mobile equipment 36 125 +251.3%
fixed services 209 229 +9.9%
other revenues 4 2 -46.9%
ongoing commercial momentum through increasing penetration of
convergence…
– strong ADSL net adds (+84k)
– strong mobile contract net adds (+95k)
…drives improvement in underlying (ex-regulation) revenue growth…
– +3.2% in Q1 14 vs. +2.7% in Q4 13
… with growth in fixed broadband and mobile equipment revenues
compensating contraction in mobile services revenues
Q1 2014 results – April 29th, 2014
45%
+23.7%
1,436
72%
Q1 14 Q1 13
1,776

17
Q1 2014 Poland good commercial momentum and a sequentially improving revenue trend
mobile: sustained customer net additions in ‘000s
fixed lines: steady reduction in fixed voice line losses in ‘000s
Q1 14
-56
Q4 13
-62
Q3 13
-78
Q2 13
-95
Q1 13
-111
convergence: continuous momentum in open customers in ‘000s and in % of mobile postpaid base
125211
286352
72
Q1 14
4.8%
Q4 13
4.0%
Q3 13
3.0%
Q2 13
1.8%
Q1 13
1.0% 70
199179
61
-9
139169
8264
-5
Q4 13 Q3 13 Q2 13 Q1 13 Q1 14
postpaid net adds total net adds
in €m
Q1 13 cb
Q1 14 actual
% yoy cb
revenues 777 716 -7.9%
excl. regulation -5.1%
mobile services 366 344 -6.2%
mobile equipment 8 10 +31.2%
fixed services 371 340 -8.6%
other revenues 31 22 -28.7%
good commercial momentum – positive Mobile Number Portability balance in Q1 14, the first quarter
since 2008 – convergence strategy proving effective, with +67k Q1 14 net adds in
Open customers, resulting in a 352k base – continuing momentum in entry level SIMO offer, with +126k Q1 14 net
adds in nju.mobile, up to 479k customers – fixed voice line losses continuously down: -50% vs. Q1 13 and -10% vs.
Q4 13
sequentially improving revenue trend at -7.9% in Q1 14 vs. -9.4% in Q4 13
Q1 2014 results – April 29th, 2014

18
Q1 2014 Rest of the World stable underlying revenues with growth in emerging markets offsetting significant repricing in some European countries
European countries: ongoing positive trend in Romania (+4.9%) not enough to offset portfolio repricing in Belgium (-19.6%, with 94% of the base now repriced) and Slovakia (-9.7%)
Africa and Middle-East growth driven by Mali, Guinea, Ivory Coast and Egypt
Q1 2014 results – April 29th, 2014
Africa & Middle East mobile
customer base
+11.4% yoy
n°1 or n°2 in volume
market share in
16 out of 21 emerging market countries
revenues in Romania
+4.9% yoy
+25% growth in data
revenues
Orange Money customers
9.9m +48% yoy
in €m
Q1 13 cb
Q1 14 actual
% yoy Cb
revenues 1,887 1,865 -1.2%
excl. regulation -0.2%
Africa & Middle East 959 1,014 +5.7%
European countries 805 724 -10.0%
other countries 126 131 +3.5%

19
data services IPVPN accesses in France, yoy growth
+36%
+20%+19%
Security Video
conferencing
Cloud
Services
IT services Q1 2014 yoy revenue growth
voice services yoy access growth in France
1Q14
-7.7%
+7.3%
2013
-8.9%
+7.5%
2012
-8.7%
+13.6%
+1.5%
1Q14
+0.9%
2013
+1.7%
2012
PSTN XoIP
Q1 2014 Enterprise revenue decrease slowdown in Q1, fueled by a lower price pressure on IPVPN and solid IT growth engines such as Cloud, Security and Image
in €m
Q1 13 cb
Q1 14 actual
% yoy cb
revenues 1,602 1,565 -2.3%
voice 448 417 -7.1%
data 751 727 -3.1%
IT & integration services 403 421 +4.6%
voice decreased less strongly than in previous quarters but remained impacted by migrations towards VoIP solutions
slightly improved trend on data, with less price pressure intensity in Q1 on IPVPN
IT & integration services supported by solid growth of Security, Cloud and Image products, further boosted by acquisitions in a dynamic entities portfolio management
Q1 2014 results – April 29th, 2014

20
EE: growing demand for double speed 4G, as total 4G base grows c. 900k to 2.9m; on target to exceed 6m 4G customers by end of 2014
Sustained low postpaid churn#
Q1 operating revenue grows 0.8% ex.
regulation, £m Continued postpaid growth*
Insights
Initiatives
–4G rolled out in 200 cities (72% population), with double speed 4G
(only offered in the UK by EE) in UK’s 20 largest cities (25%
population)
–50% of new and renewing (Orange and T-Mobile) postpaid customers
selected 4G, with strong uptake of 4GEE Extra plans
–ranked UK’s #1 network for voice, text, mobile internet and reliability
by RootMetrics®
–New entry-level 4G postpaid plans (from £13.99 per month)
–New, EE branded affordable 4G smartphone “Kestrel”
* excluding MVNOs
# monthly average (3 month rolling)
regulation Q1/13 Q1/14 prepaid postpaid Q1/13
ex
regulation
-1.7%
+0.8%
1,512 1,474 1,486
-38
-46
+45 +13
fixed &
w’sale * excluding MVNOs
214k
271k
229k
283k
233k
345k 357k
243k
192k
Postpaid mobile
M2M

2014 guidance confirmed 3

22
2014 restated
EBITDA*
€12.0bn - €12.5bn
stabilised EBITDA*
margin
2014 dividend
€0.60
interim payment
€0.20 in December
2014
net debt / EBITDA**
closer to 2x by year-
end 2014 and
around 2x in the
medium term
selective M&A
policy, focus on
existing footprint
2014
guidance
* restated EBITDA and after Orange Dominican Republic disposal from Q2 2014
** calculated by dividing (A) net financial debt, including 50% of the net financial debt of the EE JV in the U.K., by (B) restated EBITDA including 50% of the EBITDA of EE JV
Q1 2014 results – April 29th, 2014
subject to the Annual General Meeting of Shareholders approval.
ex-date June 2nd, record date June 4th, payment date June 5th 2013 dividend balance of €0.50

thank you

appendices

25
EBITDA restatements
in €m Q1 13
cb Q1 14 actual
EBITDA restated 3,138 3,017
restructuring -4 0
litigations 0 -333
labour related -39 -36
other
disposal of Wirtualna Polska 0 68
EBITDA reported 3,094 2,716
1
The Ebitda for Q1 14 was
impacted by a charge of
€333m related to events
which occurred post the 6th of
March, 2014 relating to
litigations both in France and
at the Group level.
Q1 2014 results – April 29th, 2014

26
revenues evolution
France Group (yoy evolution) Spain
Poland Rest of Europe Emerging markets Enterprise
-2,4%
-5,1%
Q3
-4,0%
Q1
-3,0%
-3,8%
Q4
-3,8%
Q2
-2,5%
-4,8%
Q1
-1,8%
-4,1%
Q1
-4,9%
-5,0%
Q4 Q3 Q2 Q1 Q1
+3,2%
-1,2%
Q4 Q3 Q2 Q1
-7,9%
-5,1%
Q1 Q4 Q3 Q2 Q1 Q1
-8,4%
-10,0%
Q4 Q3 Q2 Q1 Q1
+6,0%
+5,7%
Q4 Q3 Q2 Q1 Q1
-2,3%
Q4 Q3 Q2 Q1
organic
ex reg
Q1 2014 results – April 29th, 2014