q1 2013 free_wheel_video_monetization_report
TRANSCRIPT

FREEWHEEL
VIDEO MONETIZATION REPORT Q1 2013

FreeWheel Video Monetization Report Q1 2013 2
■ Total video views increased 30% year over year, driven by Digital Pure-Play networks, which have built significant scale around short-form content
■ Short-form video views dominated, comprising 87% and 86% of total video views for Linear + Digital and Digital Pure-Play, respectively
■ Digital Pure-Play drove almost 85% of its Q1 video views through syndication, as compared to Linear + Digital which had a syndication rate of 25%
■ Focusing less on syndication, Linear + Digital has built up healthy ad loads across all content types, with long-form ad loads increasing from 7.4 ads per video view in Q1 2012 to 9.5 in Q1 2013
■ The two approaches of Linear + Digital and Digital Pure-Play result in roughly even scale in total ad views for Q1 2013, and overall growth of 22% year over year
■ For the industry as a whole over the past year, non-desktop video viewing (mobile, tablets, OTT devices) increased 6x, reaching almost 20% of video views
■ Tablets are driving TV-style viewing habits, with almost 60% of ad views in Q1 2013 derived from long-form content (20+ minutes)
Key Findings
BackgroundIn 2012, FreeWheel added a number of new clients into its dataset, which enabled deeper insight and more robust perspective on the many trends shaping the industry. As a result, this quarter’s report highlights a breakout of two broad market segments, both focused on premium online video.
Linear + Digital
■ Generate majority of their revenue from linear TV services and also offering content on IP-based environments
■ Business models focused on diverse mix of short, mid, and long-form content, with an emphasis on driving high ad loads (ads per video view)
Digital Pure-Play
■ Operate exclusively in IP-based environments, either by aggregating third-party premium content and/or developing original premium content
■ Business models focused on video view growth through syndicated distribution of largely short-form content
FreeWheel Video Monetization Report Q1 2013 3
FreeWheel and Video Monetization Report overviewFreeWheel’s flagship product, Monetization Rights Management® (MRM) is an advertising management system for enterprise-class media companies designed to manage ad sales rights and serve ads into the U.S. and UK on wired and wireless Internet devices. The FreeWheel Video Monetization Report is released quarterly and seeks to highlight the changing dynamics of how enterprise-class content owners and distributors are monetizing professional digital video content. The underlying dataset is one of the largest available on the usage and monetization of professional, rights-managed video content, and in 2012 comprised over 53 billion video views.
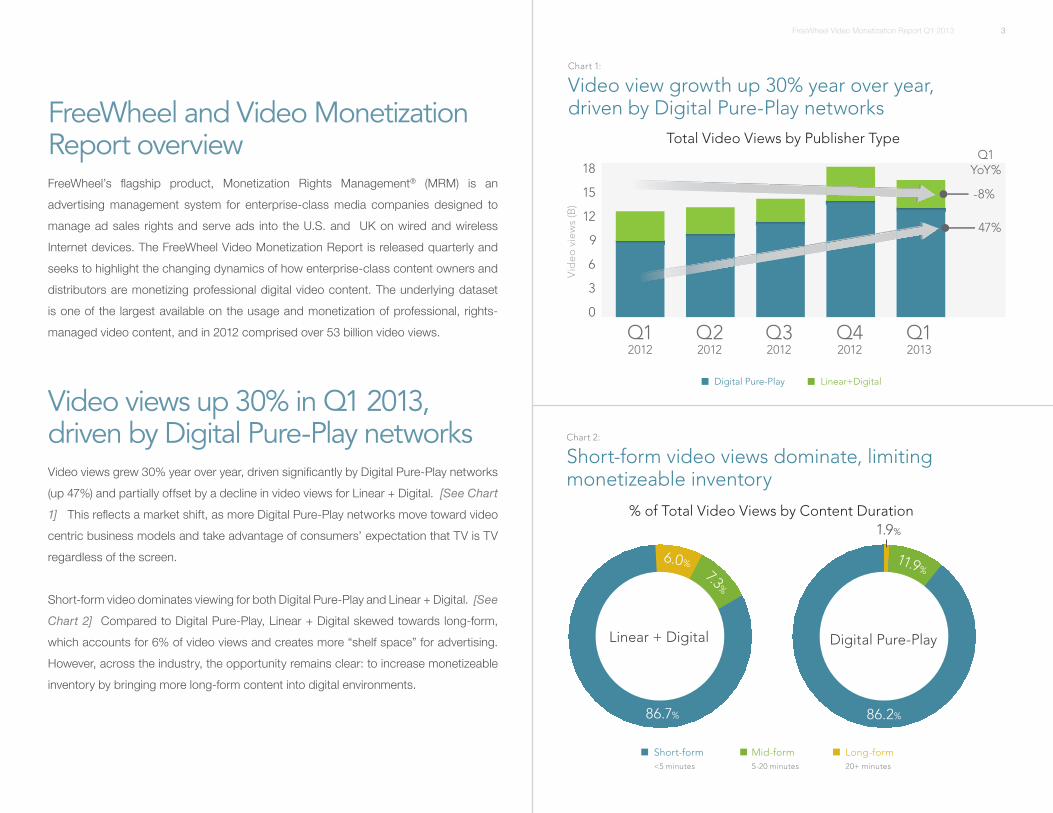
Video views up 30% in Q1 2013, driven by Digital Pure-Play networksVideo views grew 30% year over year, driven significantly by Digital Pure-Play networks (up 47%) and partially offset by a decline in video views for Linear + Digital. [See Chart 1] This reflects a market shift, as more Digital Pure-Play networks move toward video centric business models and take advantage of consumers’ expectation that TV is TV regardless of the screen.
Short-form video dominates viewing for both Digital Pure-Play and Linear + Digital. [See Chart 2] Compared to Digital Pure-Play, Linear + Digital skewed towards long-form, which accounts for 6% of video views and creates more “shelf space” for advertising. However, across the industry, the opportunity remains clear: to increase monetizeable inventory by bringing more long-form content into digital environments.

FreeWheel Video Monetization Report Q1 2013 4
Digital Pure-Play video view growth was primarily driven by short-form content (<5 minutes), which rose 54% year over year. [See Chart 3] This is not surprising given content focus on news, celebrity entertainment, music videos, and other content that lends itself to syndicated business models. However, continued growth is expected from Digital Pure-Play networks in short and mid-form as original content pipelines ramp up. Netflix’s success with House of Cards (and its Emmy buzz) is an early indication that content developed explicitly for digital audiences can secure A-list talent and deliver high production values. It’s likely that ad-supported examples will soon follow.
Linear + Digital, despite a greater focus on long-form content (20+ minutes), has seen relatively modest growth of 4% in this content type. Long-form content remains in limited supply, due in part to paid monetization (e.g., through Netflix, Amazon), and in part to limitations in unlocking ad rights. Authenticated TV Everywhere applications represent a significant opportunity to begin opening long-form content for ad-supported monetization. Linear + Digital has also seen a decline in short-form video views in Q1 2013, which can be addressed in part through increased repackaging of long-form content into clip libraries.
Syndication: key driver of video views for Digital Pure-Play and increasing for Linear + DigitalA significant driver of growth in video views and video ad views over the past four quarters has been video syndication (defined as viewing that occurs outside of owned and operated properties of video publishers). Syndicated video views accounted for 84% of Digital Pure-Play in Q1 2013, as these networks have leveraged a large base of partners including YouTube, Yahoo!, and a vast ecosystem of niche networks. [See Chart 4]
The syndication rate for Linear + Digital players increased steadily from 17% in Q1 2012 to 25% in Q1 2013; however, it remains well below that of Digital Pure-Play. Syndication deals such as ABC/Yahoo! and AOL/Discovery demonstrated the potential for further syndication. Until now, Linear + Digital networks have focused more on driving growth through owned and operated properties.

FreeWheel Video Monetization Report Q1 2013 5
Linear + Digital sees healthy ad loads across all content types, with strong growth in long-formAd loads provide a strong indication of the level of monetizeable inventory that publishers leverage for their content. Linear + Digital continues to drive the highest ad loads, with long-form ad loads increasing from 7.4 ads per video view in Q1 2012 to 9.5 in Q1 2013. This reflects a careful balance between increased ad opportunities and improved management of the user experience to minimize viewer attrition. [See Chart 5] Upside still exists to drive the type of long-form ad loads that are seen in linear TV (15+ ads per video), which will be a key driver to ad view scale should content supply remain limited. Linear + Digital has also maintained high ad loads on both short and mid-form video; however, they remain largely flat year over year, implying a need to drive growth through increasing audience scale.
For Digital Pure-Play networks, growth remains relatively flat across all content durations. [See Chart 6].

FreeWheel Video Monetization Report Q1 2013 6
Mid-form, which accounts for 12% of Digital Pure-Play video views, has ad loads that are currently below that of short-form. This is largely driven by focus on pre-roll ad units [See Chart 7], and there is likely significant upside for this content type in the near-term. Long-form has not been a key priority for Digital Pure-Play networks to date, resulting in a 1.3 ad load during Q1 2013 (versus 9.5 for Linear + Digital). With new mid-form and long-form content in development at many Digital Pure-Play networks, ad loads present a significant growth opportunity.
A key driver to increasing ad loads will be the effective monetization of the mid-roll position. In Q1 2013 96% of monetization for Digital Pure-Play networks was generated by pre-rolls, a slight increase from a year ago which was 98%. Mid-roll ad views continue to gain share for Linear + Digital, up from 36% in Q1 2012 to 41% in Q1 2013.
For the industry as a whole, non-desktop video viewing increased 6x year over year, reaching nearly 20% of viewsFor both Linear + Digital and Digital Pure-Play, creating scale will increasingly require monetization across all platforms. In Q1 2013, non-desktop video viewing (mobile, tablet, OTT) reached 19% of total video views, up from 3% in Q1 2012 as installed bases of video-ready mobile and tablet devices have continued to climb. [See Chart 8] OTT devices comprised only 1.5% of video views in Q1 2013. However, as gaming consoles continue to establish themselves as video-centric devices, and devices like Roku continue to increase the number of integrations with content providers (particularly via authenticated apps), continued ad view growth is expected from OTT devices.

FreeWheel Video Monetization Report Q1 2013 7
Monetization of mobile and tablets is driven largely by Apple devices, with iPad, iPhone, and iPod comprising over 70% of mobile and tablet video ad views in Q1 2013. [See Chart 9] iPad now leads the industry in volume, comprising 39% of total ad views (versus iPhone with 31%). iPad volume relative to iPhone is driven both by the narrowing between the installed bases of iPad and iPhone users, and by iPad’s emergence as a long-form video viewing device.
iPads drove twice as many ad views from long-form content (58%) as iPhone (27%) and Android Phone (24%). [See Chart 10] This reflects TV-style viewing habits on iPad versus on-the-go usage for mobile phones.
A combination of Linear + Digital and Digital Pure-Play tactics is essential to drive industry scaleIn summary, there are two broad approaches to creating monetizeable inventory: (i) Linear + Digital which focuses on increased ad loads and a diverse content mix and (ii) Digital Pure-Play which focuses on video view growth through syndicated short-form content.

FreeWheel Video Monetization Report Q1 2013 8
The net result of these two approaches is roughly even scale in total ad views for the Linear + Digital and Digital Pure-Play groups in Q1 2013. [See Chart 11] Total ad view growth was up 22% year over year in Q1 2013, driven largely by Digital Pure-Play.
While Linear + Digital experienced more modest growth, this group has built scale by optimizing content mix and ad loads to create monetizeable inventory across all content types. Long-form accounted for 36% of total ad views for Linear + Digital in Q1 2013, while Digital Pure-Play drove 87% of ad view volume from short-form. [See Chart 12]
Presumably, a combination of these two approaches is essential to bringing the digital video industry to TV scale and addressing growing demand from TV-oriented ad buyers. Publishers of both types must simultaneously focus on: (i) optimal content mix between short, mid and long-form, (ii) growth in ad loads, with long-form ad loads ultimately nearing TV levels and (iii) audience scale through syndication. Without a concerted ongoing effort to balance supply and demand across linear and digital, economic growth within the industry will ultimately suffer.
For more information about this report, please contact:
Brian Dutt FreeWheel Advisory Services