q^ tidal to seismic frequency investigations with a quartz accelerometer of new geometry by barry...
TRANSCRIPT

4P0SU 7o-1693TB
\f$ University of California, San Diego Q^ Institute of Geophysics and Planetary Physics
© ***
s FINAL REPORT
Contract AF49(638)-1388
Geophysics Division Air Force Office of Scientific Research
United States Air Force Washington, D. C. « H
LOW LEVEL EARTH MOTION
I* I
u S 9 ARPA Order No. 292-69
Program Code No. 9F10 «• | Contract Starting Date: 1 May 1964 or Contract Termination Date: 30 September 1969 ^q
Jf % Project Scientists: Richard A. Haubrich ••
Principal Investigator » ?|
George Backus £ g. Barry Block p. ft Freeman Gilbert • • Robert D. Moore • V/alter Munk « «
May 1, 1970 La Jolla, California
.'eproduced by the CLEARINGHOUSE
'or federal Scientific & Technical .< Information Springfield Va 22151 - ■*
i L.
ti

'
<►
Table of Contents
I Constructing P-Velocity Models to Fit Restricted Sets of Travel-Time Data. George Backus and Freeman Gilbert
II Inversion of Inaccurate Gross Earth Data. George Backus and Freeman Gilbert
III T,idal to Seismic Frequency Investigations with a Quartz Accelerometer of N / Geometry, Barry Block and Robert D. Moore
IV Earth Normal Modes from a 6.5 Magnitude Earthquake. Barry Block, Jay Dratler, Jr. and Robert D. Moore
V Microseism Measurements on the Deep Ocean Bottom. Hugh Bradner
VI Ocean Microseism Measurements with a Muetral Bouyancy Free- Floating Midwater Seismometer. Hugh Bradner, Louis G. de Jerphanion and Richard Lar.dlois
VII Seismic Noise Between 2.5 and 200 Cycles per Hour. Richard A. Haubrich
IX Linearization and Calibration of Electrostatically Fedback Gravity Meters. Robert D. Moore atal W. E. Farrell

• I
c
CONSTRUCTING P-VELOCITY MODELS TO FIT RESTRICTED SETS OF
TRAVEL-TIME DATA
By George Backus and Freeman Gilbert
Abstract
A scheme recently proposed by the authors for constructing Earth models
which fit a given finite set of gross Earth data Is applied to the problem
of constructing a P-velocity structure which, within experimental error,
fits the observed travel times in the range A = 25 (5 )95 . Three such
models are obtained, all of which fit the observed travel times with
residuals less than 0.06 , whereas 0.5 is the estimated standard error
of the observations. The models differ mainly in the outer 700 km of the
mantle.
/
Bull, aeism, Soo. Am. Sj^, No. 3, pp 1407-1414, June 1969.

.
INVERSION OF INACCURATE GROSS EARTH DATA
By George Backus and Freeman Gilbert
Abstract
A gross Earth datum is a single measurable number describing some property
of the whole Earth, such as mass, moment of inertia, or the frequency of
oscillation of some identified elastic-gravitational normal mode. We suppose
that a finite set G of gross Earth data has been measured, that the measure-
ments are inaccurate, and that the variance matrix of the errors of measure-
ment can be estimated. We show that some such sets G of measurements determine
the structure of the Earth within certain limits of error except for fine-
scale detail. That is, from some sets G it is possible to compute localized
averages of the Earth structure at varioup depths. These localized averages
will be slightly in error, and their errors will be larger as their resolving
lengths are shortened. We show how to determine whether a given set G of
measured gross Earth data permits such a construction of localized averages,
and, if so, how to find the shortest length scale over which G gives a local
average structure at a particular depth if the variance of the error in com-
puting that local average from G is to be less than a specified amount. We apply
the general theory to the linear problem of finding the depth variation of a
frequency-independent local elastic dissipation (Q) from the observed damping rates
of a finite number of normal modes. We also apply the theory to the nonlinear
problem of finding density against depth from the total mass, moment and normal-
mode frequencies, in case the compressional and sheai velocities are known.
Phil. TranB. Roy. Soa. Lond. 266 No. 1173, pp 123-102, 5 Mar 70.

•
t
TIDAL TO SEISMIC FREQUENCY INVESTIGATIONS WITH
A QUARTZ ACCELEROMETER OF NEW GEOMETRY
By Barry Block and Robert D. Moore
Abstract
A wide-band, tidal to seismic frequency, accelercmeter has been developed
.g that is of simple internal geometry and low drift (<10 g/day). Initie.1
tidal and earth-mode frequency investigations are described along with
detailed design features and internal noise measurements.
Journal of Geophysical Research, 75, 1493-1505, 1970

•
*> -►
EARTH NORMAL MODES FROM A 6.5 MAGNITUDE EARTHQUAKE
(submitted to Nature)
Barry Block
Institute of Geophysics and Planetary Physics, and Physics Department; University of California, San Diego, California
Jay Dratler, Jr.
Institute of Geophysics and Planetary Physics, and Physics Department; University of California, San Diego, California
Robert D. Noore
Institute of Geophysics and Planetary Physics, University of California, San Diego

:
i
The earth normal mode spectrum between 8 and 39 cycles per hour
(cph) has been obtained with a 20 db signal-to-noise ratio for a relatively
small earthquake <M =6.5) using a low noise broad-band vertical accelero- s
meter of new design. The earthquake occurred in the New Hebrides (18*.9 S,
169°.3 E) on October 13, 1969, 06:56 GMT at a depth of 2U6 kM.
A1-'7' The infrument usea has a band width extending from tidal to seismic
frequencies. It utilizes a quarts fiber in torsion, phase sensitive capacitance
(3) detection and electrostatic feedback . The internal instrumental noise was
(2) measured in the band 1-30 cph by cross-correlating with another similar
I-2U instrument, and was found to be the calculated Brownian noise of 2 x 10
2 -9 g /cph. Instrumental drift is so small (< 10 g/day) that operation at
full scale tidal gain is possible for several months without re-zeroing.
The instrument has two outputs at present. The tidal output
(Fig. 1) is flat from DC to 4.8 cph, where it breaks at 20 db/decade. The
gain in the tidal channel is such that + 10 voltf output, or full scale,
_7 corresponds to + 3.7 x 10 g. The second output is a band pass filter with
40 db gain relative to the tidal channel in a 1-30 cph band. Above 30 cph
the filter output drops off at 40 db/decade. 7he filter gain is such that
-9 + 10 volts corresponds to + 3.7 x 10 g in the 1-30 cph pass band. The
calibration factor for the instrument was obtained from a static tilt cali-
bration using the tidal data channel and correcting for the added gain of
the filter channel in the 1-30 cph passband.
-•

•
The site, near Miranar Naval Air Gtatlon in San Diego, is noisy
at seismic frequencies from jet engine noiöe, hut at earth mode frequencies
(1-30 cph) the ambient power spectru.T (Figc. S,^) is low enough to permit
the measurement of normal mode frequencies and line structure from small
earthquakes.
Tidal data for a two day's run is shown in Fig. 1. This is raw
data which has been analogue filtered by a two-stage buffered RC filter
with a 100 second time constant and digitized at one second intervals. The
earthquake (Fig. 2) shows up as a symmetric trace superimposed on the band
pass filter record, showing absenc of nonlinear mechanical coupling within
the instrument. Figures (3,U) show the earthquake power spectrum from 1 to
39 cph. The typical ambient power spectrum of the site was obtained from
filter data corresponding to the 15 hour time period AB(Fig. 1). The earth-
quake power spectrum was obtained from the filter data corresponding to the
15 hour period CD(Fig. 1). The time period BC(Fif;. 1) had a small undersea
earthquake and could not be used to obtain an ambient power spectrum.
A comparison of the measured modal spectrum with the ambient power
spectrum shows that there are several low order modes which can be distinguished
from the noise below 10 cph, and that the mode structure above this frequency
is real. In fact, in the region from 10 to 39 cph, the signal-to-noise ratio
is better than 20 db.
Although not shown in the figures, spectra for both the earthquake
and the ambient noise were taken up to a frequency of 120 cph. Up to this
frequency, the earthquake spectrum shows considerable structure at least 20 db
above the ambient spectrum . At a more favorable site, the ambient noise would
be lower and would enable data to be gathered over a longer time for increased
mode resolution. For this reason Instruments are under construction having a
considerably lower Brownian motion limit than the one used here.

i' The good signal-to-noisc ratio (20 dt) found liere chows that normal
mode and earthquake source data are now obtainable for a far larger class
of earthquakes than ever before possible. The smaller earthquakes can be
examined for source structure and the large oner, with their consequently
longer data runs, can be used to resolve modal line structure. A more complete
treatment analyzing several earthquakes is in preparation.
Acknowledgements: The authors wish to thank James Brune for his help in
identifying various features of the earthquake, Richard Haubrich for his
assistance in the data handling and analysis and Freeman Gilbert for his
assistance in identifying normal modes.
This research was supported by the Advanced Research Projects
Agency of the Department of Defense and was monitored by the Air Force
Office of Scientific Research under Contract No. AF U9(638)-1388.

Captions
Fig. 1. Tidal channel output from 8:29:17 GMT, Oct. 12 to 20:58:36 GMT,
Oct. 13. Filter channel output corresponding to tidal data from Section AB
was used to obtain the ambient spectrum for the site. The main earthquake
time series was taken from the filter channel output corresponding to
Section CD.
Fig. 2. Raw filter channel output corresponding to Section CD of FigdJ,
showing the details of the time series for the New Hebrides earthquake.
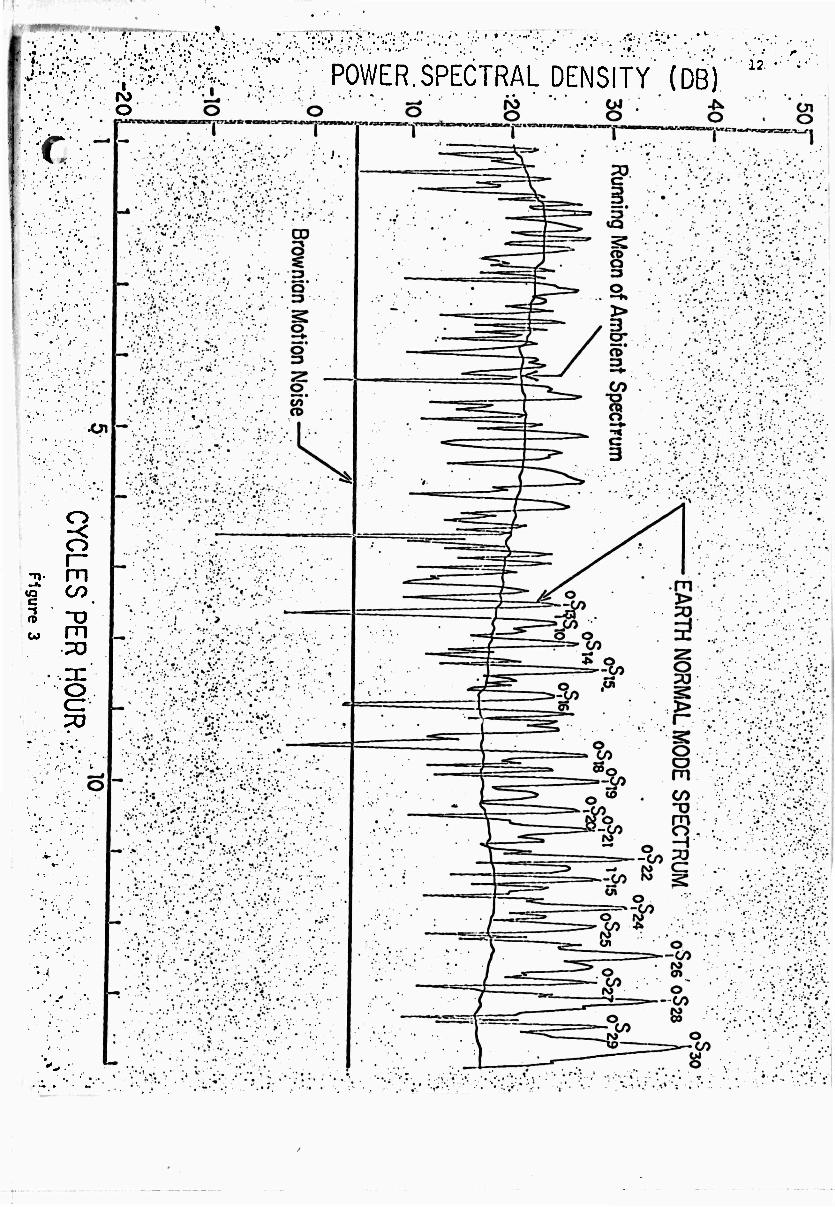
Fig. 3. Spectra from 1 to lu cycles per hour (cph). The earth normal
mode fpectrum refers to Section CD in Figs. (1,2). The running mean of the
ambient spectrum refers to Section AB in Fig. (1). Rrownian motion noise
is shown as the heavy solid line. The 0 db point corresponds to an absolute
-25 2 (s) spectral density of 7.U x 10 g /cph. Selected modes are identified * .
Fig. U. Spectra from 12 to 39 cph. The earth normal mode spectrum refers
to Section CD in Figs. (1,2). The ambient spectrum and its running mean
refer to Section AB in Fig. (1). Browniar .notion noise is shown as the
heavy solid line. The 0 db point corresponds to an absolute spectral
-25 2 (5) density of 7.U x 10 g /cph. Selected modes are identified

imirwiMuiji
•■ ■.::' ■■:■ .^vK"' >■■■■■ v>-, •.■ ••;•.: - ■-. •
■■■^.>..=.:;:^r>:;:^vv::A->-v: ••;:' .;-v • ' •>^^V^MVjVv^-, -v::- ;..V ^^ V: ,
^^^^^
c •••.••> ■•.••-> "■■•."■.' .*• ••■•■
■■
• ;'■.•■■'■' ''■••".-"■•.• v ■: ■.•,■ ^;' ' v.. :.•■':•.'.■ '.*
> * a
H5h '... * .,V. ■...•.•..;
'-.■u-, ■• ••■.
•V •' ..••.
i s
- ■••..•, •:.'.:v •:•. V-^'.-.^'. ...•.•:•.■.♦ ."'•■; .:;?•;. *•-.
•- : ■: . \-'-^^-:/:-^- '■^■^:-.r: .■. :■;.'*:..■]■:■
:•••• • •/. ■ •■•;.■.■ .•• s.'?-;U -.A-t- •••..'% '• • '■■■ ''■.••.
? -i ■•'•.■ •■/- ■•■•5 •■•••■ : ';
'.SV
■■••>■ <•,:• ■V'i.'. ■••"■•' ■'? • •• ''-■:': ■ '■ •■' ■ .' : • . ■:-5- :.-*..:wl'fr-X\^•■:■■■ ■•■'.-.'••;-.lf-. .•1 ••■
».• . i." * ' • *
y-:', ••••■•;
mmmmm <: ■i--'- v^ .',■:■■■■
tf'^CM^tv^ \
4, y ; '-f-
■■■■-j i/S: -.:Ä^^ft#^^i;:;S:|;5J
•:>'■
• ■'".:'>'\''' ;'■'.'
,::VV^-V.;:^.v.,:-^,. ••.-•.

t ;
■ • V
c 3
•t • .• i> • :•■ "
."v:>-
..c
u
'' t'L .. .^V«'VT,-;'" ■■; ••;:■.••-■'; r-'i-*'.
.::■■-- ■*■::■ r'/'/i .•<:■' ■'.;.- v-'. ■<•■; •><:
^4'.
< ■•■ \-,. •... .'>.
•
o POWER.SPECTRAL DENSITY (DB)
12.
O -< o r*
-n- m ml.
CO c "O
CA> m , ' TO
, T o TO
r

■•v
■ -
1 *:
8 f3
ü»
Si
^ m CO
-X3 , m » X o c
-n S —>. U3 • c -J ID
K
k_ o S 8 « Ö 8
>-..
-13
. * •».
:;:•• •
A

r
14
References
1.
2.
3.
4.
5.
B. Block, R. D. Moore, Transactions, American Geophysical Union 50,
No. 4, April 1969.
B. Block, R. D. Moore, Tidal to Seismic Frequency Investigations
with a Quartz Accelerometer of New Geometry. J. Geophys. Res. (in press).
B. Block, R. D. Moore, Measurements in the Earth Mode Frequency Range
by an Electrostatic Sensing and Feedback Gravimeter, J. Geophysical
Res., 71_, 4361-4375 (1966).
W. E. Farrell, R. D. Moore, Linearization and Calibration of Modified
LaCoste Gravity Meters. J. Geophys. Res. (in press).
Freeman Gilbert, private communication and G. Backus and F. Gilbert,
Uniqueness in the Inversion of Inaccurate Gross Earth Data. Phil. Trans. Roy
Soc. Lon. A, in press, (1970).
C

15
MICROSEISM MEASUREMENTS ON THE DEEP OCEAN BOTTOM
By Hugh Bradner
Abstract
Several laboratories have developed apparatus for ocean-bottom seismic
measurements and have made a total of about 200 records in deep oceans.
They have observed earthquakes, measured propagation velocities, studied
microseism noise, and determined that signal-to-noise ratios may allow them
to monitor bomb tests. But many more measurements will be needed before de-
finitive generalizations can be made about the generation and attenuation
of microseisms.
Nautilus, 4, (1918)

16
OCEAN MICROSEISM MEASUREMENTS WITH
A NEUTRAL BOUYANCY FREE-FLOATING MIDWATER SEISMOMETER
* itit H. Bradner, Louis G. de Jerphamon and Richard Langlois
Institute of Geophysics and Planetary Physics
University of California, San Diego
ABSTRACT
Seismometers in spherical aluminum pressure housings
have been weighted to float stably at midwater depths in the ocean,
and thus record water motions in a frequency band of 0.02 to 5 cps.
Simultaneous records made with a midwater instrument at 1.2 km depth
and a bottom instrument at 4.6 km depth showed coherence at spectral
power peaks of leaky organ pipe frequencies, and additional coherence
peaks at frequencies down to 0.025 cps. Twenty organ pipe modes can
be tentatively identified. The spectral power can be attributed almost
entirely to microseismic motions in waveguide modes. We conclude that
the forcing functions for microseisms are broad enough so that deep
ocean bottom and midwater microseism spectral peak frequencies are
characteristic of local bathymmetry.
* Present address: Intertechnique, 78 Plaisir, Paris France
** Present address: Department of Chemistry, Columbia University
Graduate School.

17
1. INTRODUCTION
We have modified our ocean-bottom seismometers to be neutrally
bouyant at predetermined depths in the ocean, like Swallow floats.
Such stable midwater operation is possible since the aluminum pressure cases
of our instruments are less compressible than sea water. The work was
initially undertaken by the first and third authors in order to study the
modes of ocean waveguide excitation that had been inferred from ocean-
2 bottom seismic background spectra. The second author joined the work
as a master's degree thesis project. Additional motivation for the work
arose from our belief that water motion around ocean-bottom instruments may
mask seismic background spectra at frequencies lower than the microseism
peak. A free-floating neutrally buoyant instrument will move almost
exactly as the surrounding water and hence will not produce signals due to
steady water flow. The correspondence is not quite exact because the
compressibility of the instrument is not the same as water. The center of
mass of the instrument is displaced from the geometrical center, and the
seismometer has a small spring-supported mass which moves with respect to
the center of mass of the instrument.
Section 2 of the present paper will review briefly the theory
of waveguide mode excitation. Section 3 will describe the instruments.
Section «+ will consider the motion of a neutrally buoyant instrument in a
moving medium. Finally, section 5 will discuss some experimental results.
- V

18
2. OCEAN WAVEGUIDE MODES
The general equation for the displacement potential of small
amplitude elastic wave motion in a homogeneous fluid is the simple wave equation
32^ - c2 *H
3t2 3x2
If we consider a source to be an antinode of pressure oscillations
on a rigid bottom interface, and consider the air above the top interface
to be massless, we can write the solution of the wave equation as a plane wave
^ = 2A sin (2Ttft) sin (2TTX/X)
with wavelength \ = HH/(2n +1), where x is the depth of observation and
H is the water depth. This model would predict "organ-pipe" resonant
modes in the ocean waveguide. More realistic models with distant sources
and semirigid layered bottoms lead to a somewhat similar mode structure,
although the frequencies are not always exact multiples of the fundamental;
and they may show different excitation amplitudes; and there is not an am-
plitude node at the ocean bottom for most modes. (See for example Chapter 4
3 of Ewing, Jardetzky and Press .
Abramovici computed the modes for a layered bottom. He shows
that these modes reproduced in Fig. 1 are in good agreement with measured
2 ocean-bottom power spectra. In all cases, the water surface is c displace-
ment antinode. Hence the ratio of midwater

^ .
19
power to bottom power in vertical organ pipe roodec can be written readily
as:
2 cos 2Tifx/c
cos2 2TTfH/c
where f is the frequency of the leaky organ pipe mode, x is the depth
of the midwater observation, H is the water depth, and c is the velocity
of compressional waves in water. The power ratio for modes other than
vertical organ pipe generally cannot be expressed in this simple form.
3. INSTRUMENTS
The basic instruments were our ocean-bottom seismometers, con-
sisting of California Institute of Technology/United Electrodynamics 1-cps in orthogonal triaxial arrangement
lunar velocity transducer seismometers/ with tape recorders in 65-cm-diameter
2 aluminum pressure cases. For midwater use, the anchor was replaced by a
counterweight of the proper net weight to make the instrument float at a
predetermined depth in ocean water. The counterweight was attached in a
manner similar to the anchor of the ocean-bottom instrument, and was released
at a predetermined time by electrolytic solution of a magnesium pin. A
supplementary weight of approximately 10 kg was employed to sink the instru-
ment rapidly to near the desired operating depth, where this weight was
released by the bursting of a calibrated diaphragm. A pressure transducer
was mounted on the instrument to record its depth on a Rustrack recorder or
on one frequency-modulated track of the magnetic tape recorder. A three-
component instrument is shown schematically in Fig. 2.
»■

20
U. MOTION OF A NEUTRALLY BUOYANT INSTRUMENT
When the instrument is near its equilibrium depth in still water, its free
oscillatory motion is characterized by the float compressibility and the VäiiZlä 5
frequency. (The float frequency is slightly higher than the VSisälM frequency.) below the thermocline
The accelerations associated with this damped motion/are negligible within
the 0.02 - 5 cps pass band of our instruments. If the center of mass of
the instrument were at its center of buoyancy, and if no interior parts were
flexibly mounted, then after reaching equilibrium depth, the instrument would
follow all nonrotational or shear-free motions of the water in our pass band.
Since the center of mass hangs directly below the center of buoyancy, and
the seismometer mass is negligibly small we can say with adequate validity
that the instrument follows the vertical water motion. Water
motion due to compressional waves can be considered shear-free in our ob-
servations, since the wavelength is very much larger than the dimensions of
the instrument.
Horizontal water motion can produce seismometer signals by rocking
the instrument with moderately low damping at its natural rocking frequency.
This frequency is a function of the moment of inertia and the location of
the center of mass; and in our instruments produced a discernible spurious
power peak at 0.39 ± 0.01 cps in water tank tests. The rocking oscillations
were less violent in the ocean experiments, and were unobservable in an
experiment at 1210 m. depth.
The release of the counterweight is accomplished through the
electrolytic etching of a magnesium pin. This produces an effective change
in instrument buoyancy of 0.3 gm in U hours. Since 1 gm change in buoyancy

•
u
21
causes a 3-meter change in equilibrium depth the dissolving magnesium
-3 -1 produces a small average vertical velocity of 6.25 x 10 cm sec .
Accelerations associated with this average velocity should be negligibly
small.
We believe therefore that the midwater instrument gives a valid
indication of water motion in the frequency range from 0.02 to 4 cps. The
main motion is expected to be due to co-npressional waves, though the ocean
is a stratified fluid with unknown flows that can also arise from internal
waves and driven motions. The frequencies of internal waves are expected
to lie outside our passband but we cannot exclude a'priori the possibility
of spurious signals from unknown driving forces.
5. EXPERIMENTAL RESULTS
Near-Shore Observations
Station 2 was run in water depth of 1500 ± 50 m over broken bottom
at a location 2U km southwest of San Diego. Throughout a four-hour period
the instrument stayed at a constant depth of 430 m within the resolution of
the depth recorder (tUOm).
Station 4 was run in the same water depth, within 10 km of Station
2. The instrument depth was 800 ± 10 m. The two runs were separated in time
by seven months. Original analog magnetic tape records were digitized on an
Adage computer, using time markers that had been recorded on the tape during
the seismic measurements. The digitized records from the three-component tri-
axial seismometers were rotated during spectral analysis on a CDC digital com-
puter to yield vertical and horizontal spectral power densities and coherences.
« 4

•
22
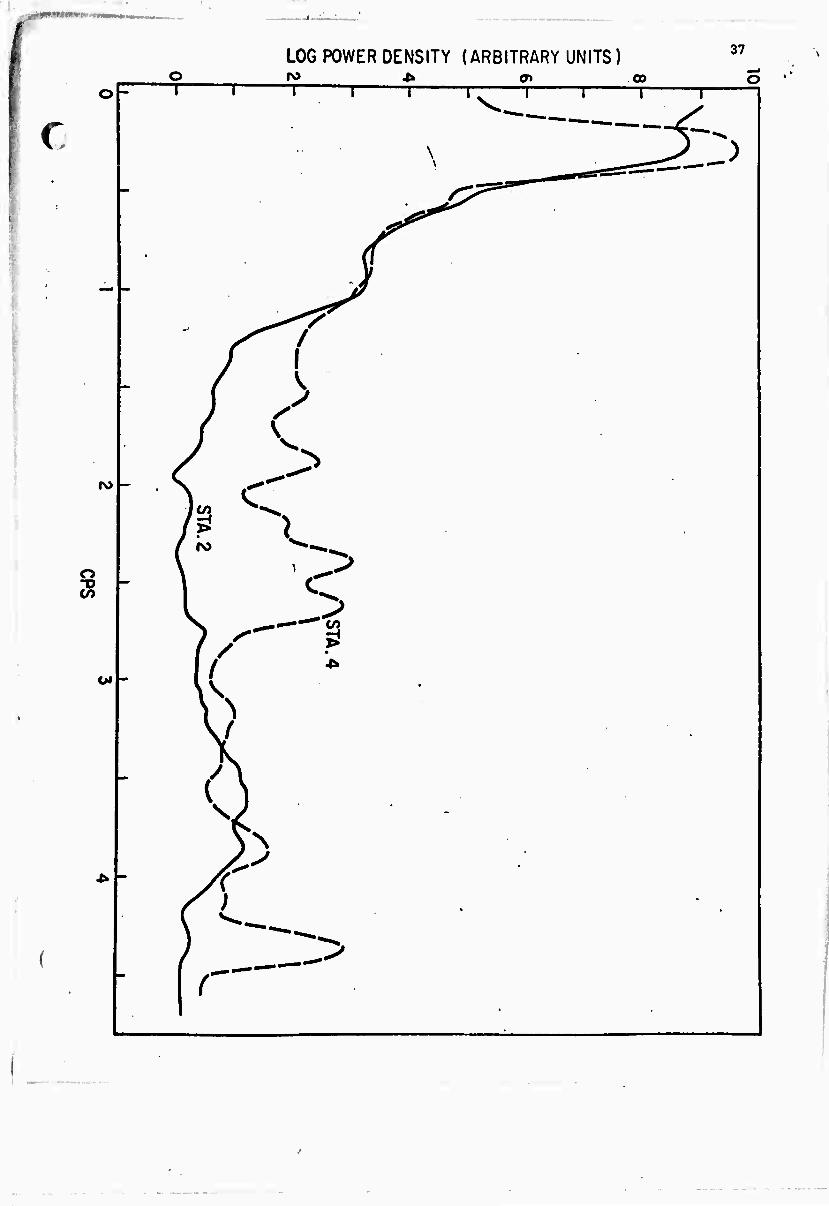
r Fig. 3 shows the vertical spectral from the two observations.
The apparent peak in power density at 0.34 cps is due to the natural rocking
period of the instrument, and prevents a comparison between the spectra between
about 0.3 and 0.5 cps. The spectra outside of this band show several common
power peaks, (see Table I), implying that the microseism background may have
a peaked structure whose frequencies are characteristic of the bathymmetry,
and whose amplitudes are indicative of a non-white forcing function. The
frequencies of leaky organ-pipe modes have not been calculated for this geo-
graphic region.
Deep Water Observations
The midwater seismic measurement of Station 5 was a 16 hour record
in water of «4.6 km depth over a uniform bottom at a location 78 km north of
Oahu, Hawaii (Fig. 4). A south-southwest moving swell ran 2 to 4 meters high
during the experiment. The three-component triaxial seismometer floated at a
depth of 1210 m ± *tO m. A simultaneous record was made on the uniform flat
bottom with a similar instrument. The instruments were equipped with low-
noise Texas Instrument Company parametric amplifiers, and the 1-cps seismometers
were low-pass filtered at 0.1 cps.
Qualitative comparison can be made between the spectral structure
observed in this experiment, at 22°, 25,N, 158°, 08^ (location by sextant)
and the spectral structure observed four years earlier with a bottom seis-
mometer at a nearby location, 22°, 28'N, 158°, 00'W. The spectrum from the
earlier observation is reproduced here as Fig. 5. The upper frequencies in
the spectrum from the present experiment are supressed by the low-pass filter,
so that the spectrum is not unambiguously discernable above background for
frequencies higher than 1 cps. However, the midwater vs. bottom coherence
peaks discussed later (Fig. 10) indicate that the mode structure continues

23
out to at least U cps and has similar peak frequencies during both observa-
tions. Four sections of data were analyzed: the first record started
6 hours after the bottom instrument was launched. Additional two hour length
records were analyzed from 0 to U cps from midwater and bottom instruments,
beginning at 10 ours, 1U hours and 18 hours after launching the bottom
instrument. Both instruments showed small changes in spectral power dis-
tribution during the recording time, though the peak frequencies did not
change.
Figure 6 shows the X, Y and Z spectra from the midwater instru-
ment out to U cps during the last recording interval. The spectra have
been displaced vertically in the figure for clarity: The power density
between 2 and 4 cps is very nearly the same for each component. Figure 7
is a similar display for the bottom instrument. The spectral shapes from
the two instruments are strikingly similar and show apparent resonance peaks
in vertical power.
Figures 8 and 9 show higher resolution spectra from the two
instruments below ^ cps during the last recording interval. The pronounced
peaks at 0.05, 0.1 and 0.2 cps in the MWS record are not clearly evident in
the bottom record. for station 5
In all instances the time series/consisted of 7200 terms, beginning
at 18 hours. Thus the U cps records and the % cps records were analyzed
during overlapping but not identical times. Information on the statistical parameters for the power spectra at all stations is given in Table II.
A large persistent power difference between X and Y in the 0.1 cps
peak during the analyses at h cps implies that the midwater seismometer turned
through about 45° during the 16 hour period.
Sections of the original analog records were examined on a
Panoramic RTA-5 Spectrum Analyzer to determine that the observed spectral
shape and peak structure were valid, and were not artifacts produced by the
digital analysis.

24
c Figure 10 shows the vertical component spectra from the two instru-
ments, and their coherence. In this figure the spectra have not been displaced
vertically; they indicate true relative power in the midwater and bottom
vertical motions.
High resolution calculations of relative amplitude, coherence and
phase between X, Y and Z components of the MWS record show that the 0.05 cps
peak is a vertically moving compressional wave, while the 0.1 cps peak comes
from horizontal motion. The power density in the 0.05 cps peak of the MWS
is two orders o. magnitude greater than the bottom, while the power density
in the 0.1 cps peak is one order of magnitude greater than the bottom.
Another small peak in the MWS record at 0.35 cps shows greater than 95%
confidence coherence with the bottom record. The 0.05, 0.1 and 0.35 cps
coherent peaks represent high Q waveguide excitation modes which we feel
are characteristic of the physical environment rather than peaks in a forc-
ing function.
The weak signal at frequencies above 1 cps makes coherence low.
However if we tabulate all well defined vertical power coherent peaks
regardless of size we find remarkably close agreement with the frequencies
of leaky organ pipe modes calculated by Abramovici. See table III. By look-
ing at only the vertical coherence we will overlook other possible modes,
and the agreement with organ-pipe modes may be illusory.
High resolution analysis showed that there is no power peak at
0.09 cps corresponding to the fundamental organ pipe mode (Fig. 8). The
high cohexonce peak at 0.10 cps was shown by amplitude and phase comparison
to be almost entirely horizontal X motion. The 0.05 cps peak which may have
significant coherence with the bottom record, is almost entirely Z motion.
The incoherent peak at 0.20 cps is horizontal with equal power in X and Y.

25
Vertical power coherence is high at 0.35 and at 0.'45 cps though no power peak
shows above the background at 0.15 cps.
By calculating spectral coherences and phases with shifted start
times on the MWS time series, we found indication that the bottom seismometer
lagged approximately 3 sec behind the MWS, thus supporting the idea that we
are observing modes whose energy flows downward past the floating instrument
toward the bottom. We were also able to determine that the high frequency
spatial coherence dimished rapidly for shifts greater than about 8 sec thus
indicating that the waveguide Q plus the forcing function for - 4 cps waves
has a time-coherence of about 30 cycles. Similar measurements on the 0.10 cps
peak show that its time coherence is greater than 40 cycles (100 sec), while
the peak at 0.35 cps has a time coherence between 72 and 1U1 cycles (200-ll00 sec),
We are unable to make direct test of organ-pipe modes by comparing
midwater power with bottom power at the coherent peaks, since the signal/noise
ratio was severely reduced by the low-pass filter. We attempted to make a
qualitative test by arguing that coherence will be reduced wherever the term
2 2 cos 2TTfx/c or cos 2irfH/c is small. The agreement appeared qualitatively
valid above 2 cps but was not conclusive.
On the basis of all our experimental data we conclude that the
seismic background at frequencies up to at least 4 cps may be carried in well
defined waveguide modes where the bottom is uniform over a distance of several
wavelengths. Leaky organ-pipe modes are probable. Abramovici has obtained
a good theoretical fit to our 1963 data by assuming a white forcing function.
However our additional data indicate that an uneven and time-varying forcing
function is operative. Alternatively we might say that the generating zone
of microseisms according to the model of Haubrich can be characterized by
waveguide modes, especially leaky organ-pipe modes,

26
with a non-white forcing function. This is in agreement with earlier ocean
bottom three-component seismic records which indicated organ-pipe modes near
7 land masses, converting to Rayleigh waves at greater distance from shore .
C

27
■
I
ACKNOWLEDGEMENTS
We wish to thank the many members of IGPP for their counsel
and help.
This research was supported by the Advanced Research Projects
Agency of the Department of Defense and was monitored by the Air Force
Office of Scientific Research under Contract No. AF 49(638)-1388.

28
c REFERENCES
(1) Swallow, J.C., A Neutral-buoyancy Float fo^ Measuring Deep Currents,
Deep Sea Res., 3t 74-81, (1955).
(2) Bradner, H. and Dodds, J.G., Comparative Seismic Noise on the Ocean
Bottom and on Land, J. Geophye. Res., 69, 4339-U338 (196U).
(3) Elastic Waves in Layered Media, Ewing, Jardetzky and Press, McGraw Hill,
1957.
(«O Abramovici, F., Diagnostic Diagrams and Transfer Functions for Oceanic
Wave-Guides, Bull. Seis. Soc. Am., 58, 427-H56 (1968).
(5) The Vaisala frequency is a measure of the adiabatic oscillation
stability of a small mass of fluid. See for example Eckart,
Hydrodynamics of Oceans and Atmospheres. Pergamon, London, 1960;
M.V. Hill, The Sea Vol. I, Interscience, 1962.
(6) Haubrich, R.A., W.H. Munk, and F.E. Snodgrass, Comparative Spectra
of Microseisms and Swell, Bull. Seis. Soc. Am., S3, 27-37 (1963).
(7) Bradner, H., J.G. Dodds, and R.E. Foulks, Investigation of Micro-seism
Sources with Ocean Bottom Seismometers, Geophysics, 30, 511-526 (1955),

29
FIGURE CAPTIONS
Figure 1 (Reproduced from Abramovici )
Power density spectrum P on ocean bottom, January 21, 1963
(Bradner and Dodds, 1964). Location: 22° 28«N, 158° 00'W.
The isolated points show peaks of the transfer function T for
Hilo 31 with the attenuation factor A = e'^0-002^^); The
scales for P (left) and T (right) are logarithmic.
Figure 2 Schematic view of Midwater Seismometer three-component tri-
axial seismometer is contained in aluminum pressure housing,
along with amplifiers, crystal clock, tape recorder and radio
recovery beacon transmitter.
Figure 3 Comparison of Vertical Power Spectram for Midwater Seismometer,
Stations 2 and U.
Figure 4 Bathymmetry in vicinity of Station 5.
2 Figure 5 (Reproduced from Bradner and Dodds ). Seismic background
spectra on land and ocean bottom, February 8, 1963, Hawaii.
The land instrument was a vertical seismometer. The ocean-
bottom instrument contained three-component equiaxial seismometers.
Only one component is displayed. The other two components were
similar. The scales at the top of the figure show the frequencies
of organ-pipe modes in the water.
Figure 6 Horizontal and Vertical Power Spectra to 4 cps. Midwater Seis-
mometer, Hawaii Station 5. The plots have been displaced verti-
cally by different amounts for clarity. Actual X: Y: Z power
densities averaged over the range 2-4 cps are in the ratio
' > 1: 1.20: 1.10.
- »

31
r TABLE I
Peaks in Vertical Spectrum, Stations 2 and 4,
Frequency (cps)
Stn 2 Stn U
0.25 0.27 0.55 0.55
0.95 (0.9 )
(1.35) (1.6 ) 1.55 (1.75)
1.9 2.1 2.2
2.4 2.6
2.75 3.2
3.65
3.85 3.85 (4.1 )
4.35 4.35

32
TABLE II
Time Series Used in Calculating Power Spectra in this Paper
Series length Pie;. St'n
2
(minu tes) No. terms S<
U107
amples/
18.
öec 1
2
tlo. lags
3 3 3/U 180
U 6 6479 18. 2 180
5 - 8 8648 18 200
6 5 15 7200 8 100
7 5 15 7200 8 100
8 5 120 7200 1 100
9 5 120 7200 1 100
10 5 15 7200 8 100
U6
72
90
1UU
1UU
144
144
144
- >

; c
33
TABLE III
Frequencies of Observed Power Peaks Compared with
Frequencies of Abramovici's calculated Modes. Station 5.
Frequency (cps)
(2) Observed
0.08* 0.26 O.tS 0.6k 0.72
0.88
1.08 1.20 1.32 1.52 1.6U 1.76 1.90 2.08 2.20
5:1? 2.64 2.76 2.92
(1) Frequencies were read from Abramovici's plotr and are uncertain to about ±0.01 cps below mode 10, and about ±0.02 cps in the higher modes.
(2) Observed frequencies were determined by peaks in coherence between JIWS and BOT instruments. Peak position accurate to ±0.02 cps. (See Fig. 12)
Mode Abramovici
1 0.09 2 0.25 3 0.U2 4 0.58 5 0.73 6 0.78 7 0.93 8 1.08 9 1.1U
10 1.28 11 1.45 12 1.62 13 1.78 14 1.95 15 2.12 16 2.29 17 2.45
18 2.62 19 2.78 20 2.93
c Higher resolution analysis shows that the high coherence peak occurs at 0.10 cps; and there may be also statistically significant peaks around 0.05 and 0.36 cps.

.)
34
Table I Peaks in Vertical Spectrum, Stations 2 and M.
Table II Time Series Used in Calculating Power Spectra in this Paper.
Table III Frequencies of Observed Power Peaks Compared with
Frequencies of Abramovici's calculated Modes. Station 5.

MMMMMM»
35
HILO 31
0.8
0.4
v
Is, ISm
. R
^ i W i
0.6 J I I''»'
1.2
1.2 1.8 2.4 3.0
£•/„ /

Pressure Pot
36
Recovery Antenno
Aluminum Shell
Mognesium Release
Bottom Plate
•Weight giving zero buoyancy
•Weight released at chosen depth
Figure
Schematic View of the Midwater Seismometer
fi\l
LOG POWER DENSITY (ARBITRARY UNITS) 37
r >
c\>
o ■v
OJ -
*» -
o ro 4fc o» .00 o i i i 1
' ' ^^L- I 1 1
• "~~ —-^-—^ •■ \ ^) )
\ ,^^5-5-^=^^"—
Ss^**^^
-
s^f f I " fi •
•
) s—s / \v •
\ ^ Y •
- Q •
'
VN /^
, — A
/) * -
\ s^--—.
-
/ J> (
• •

•
158° 1 i
i
38
157° 23'
'2200
2V
STATION 5
-» *•' 158'
2V 157'
ti'i

10
C io2 -
10 -
1 1 V) a u 1 ^
cs
IO'1
>. t— to 2 IO'2
UJ O or UJ -3 5 10 3
2 ^j
< io"4
I— U UJ ^^ to
IO"5
IO-V
2 3 4 5 FREQUENCY (cps)
^
-

.j. .
LOG POWER DENSITY (ARBITRARY UNITS) <io
L>
O ro * 0> CD 0 o r 1 1 1 1 ^1^ J^ 1
"^N^ "* "N
k .-^SÜ^S*^ ^^r
^
^ \ - ~r=k^l- 1
L ^ V^—' '
^^ ^^\^r^^>
(^ * •^X S J>
— j^ f't
' 1 >
(t 1 o - (' 1 =0 ro CO
CO 1 CO /CO • 1 1 / •
-< V M / X ,
/ ) \ «
\ ' ( • \
)( 01 " /I ) • (i
\i /1 •
\^ / n / •
/1 \ c -
\ i\ 1 1 \
4b _ \J

r
LOG POWER DENSITY ( ARBITRARY UNITS) 41
o
? •^
■

LOG POWER DENSITY (ARBITRARY UNITS) 4k m oo
«♦2
<>

LOG POWER DENSITY (ARBITRARY UNITS) 43
'

LOG POWER DENSITY ( ARBITRARY UNITS ) ** <rt oo
uu Ö T

r SEISMIC NOISE BETWEE11 2.5 AND 200 CYCLES PER HOUR
Richard A. Haubrich
ABSTRACT
The seismic background noise between 2.5 and 200 cycles
per hour (cph) was measured at TFSO, Payson, Arizona using two instru-
ments, a modified LaCoste gravity meter (LC) and a Geotech vertical
seismometer (ZLP1). The spectra of ground acceleration from simul-
taneous records of the two instruments indicate that ZLP1 is subject
to an increasing amount of instrument noise as the frequency decreases
below 200 cph. The LaCoste spectrum is considered to represent
-24 primarily true ground motion. This spectrum ranges between 10 and
-23 2 10 Og/g) /cph in the band from 6 to 60 cph. Above 60 cph, the
spectrum rises due to storm induced microseisms. Below 6 cph, the
spectrum is observed to rise at about 12 db per octive. In spite of
the fact that no coherence was observed between atmospheric pressure
and ground motion, we suspect that the primary cause of seismic noise
below 60 cph is loading due to atmospheric pressure variations.
»45

'
,
1. Introduction
Digital recordings of ground motion were made at the Tonto
Forast Seismological Observatory (TFSO), Payson, Arizona. The two
principal seismic instruments used were a modified LaCoste vertical
gravimeter (Block and Moore, 1966) and a Geotech vertical long period
seismometer, ZLP1. The Geotech instrument (Model 7505A) was installed
in the main vault at TFSO in a room sealed to atmospheric pressure.
The LaCoste (LC) instrument was installed in the experimental vault
which is located about 1.0 km from ZLP1. In addition some recordings
were made with a microbaragraph located near ZLP1. Other long period
vertical seismometers were also recorded along with ZLP1 and LC.
Records were chosen for analysis which were free from
obvious earthquake surface waves. Results of the spectrum of ground
motion and cross spectra between various components are given below.
»♦6
r r
■
47
2. Spectra
Figures 1 and 2 give the instrument response functions for
2 ZLP1 and LC. Zero db represents an output of 1.0 (1c) foi an input
_2U 2 of 10 (Ag/g) where 1c is "least count", the value of one unit
in the digital output.- A least count change is produced by an input
voltage change to the digitizer of .61 millivolts. The unit Ag/g
_3 is an input to the seismometer of about 10 gals acceleration where
Ag is the acceleration change and g is the value of gravitational
acceleration at the earth's surface.
Table 1 gives the data for the three spectra shown in Figures
3, 4 and 5. Each figure shows two spectra calculated from the digital
records obtained from the ZLP1 and the LaCoste instruments. The spectra
have all been corrected for instrument response.
From the figures, one sees that the ZLP1 spectrum exceeds
the LaCoste spectrum as the frequency decreases below 200 cycles per
hour. At 200 cph and above (not shown) the two spectra are essentially
the same. We conclude from this that the ZLP1 spectrum is due prin-
cipally to instrument noise at the lower frequencies. The spectrum of
ZLP1 rises at about 6 to 9 db per octave toward low frequency. If we
assume that the noise source is the displacement of the seismometer mass
with respect to its supports, then the moving coil transducer would
produce a 6 db per octave increase with decreasing frequency. If in
addition, the ZLP1 amplifier is subject to 1/f noise below 50 cph, this
would explain the 9 db per octive slope in Figures 3 and 4.
Recordings were also made of ZLP2 and ZLP7 from the TFSO

148
seismic array. The final corrected spectra of ground motion from these
were found to be no lower (and often higher) than that obtained from
ZLP1. The spectrum from the LaCoste instrument shows a consistent low
level between 6 and 100 cycles per hour. The spectral density in this
band varies as a function of frequency and time by about 10 db. The
-24 2 lowest level observed is 10 (Ag/g) /cph (Figure 3).
The LaCoste meter has a theoretical thermal noise level of
-25 2 about 5 x 10 (Ag/g) /cph. We feel that the actual instrument noise
level is close to this so that the lowest level of the observed spectrum
represents about 50% ground motion and 50% instrument noise. The
observed spectrum increase below 6 cph is considered to be a property
of seismic noise.
2 Table 2 gives a conversion of units from (Ag/g) /cph to dis-
placement in cm and time in seconds for two frequencies, 10 cph and
60 cph. Column 3 gives the values of displacement spectrum density in
2 -2H 2 urits of (cm) sec for our zero db level of 10 (Ag/g) /cph. Column
4 gives the rms value of ground displacement in cm for a band one octive
wide centered at 10 and 60 cph. Thus the lowest level of ground motion
measured with the LaCoste would produce a trace amplitude with less
than 1 cm rms when played through an octive filter at 60 cph with a
magnification of 10 . The lowest level at 10 cph which is somewhat
above 0 db (Figure k) would give about 1 cm rms at a magnification of
io5.
«49
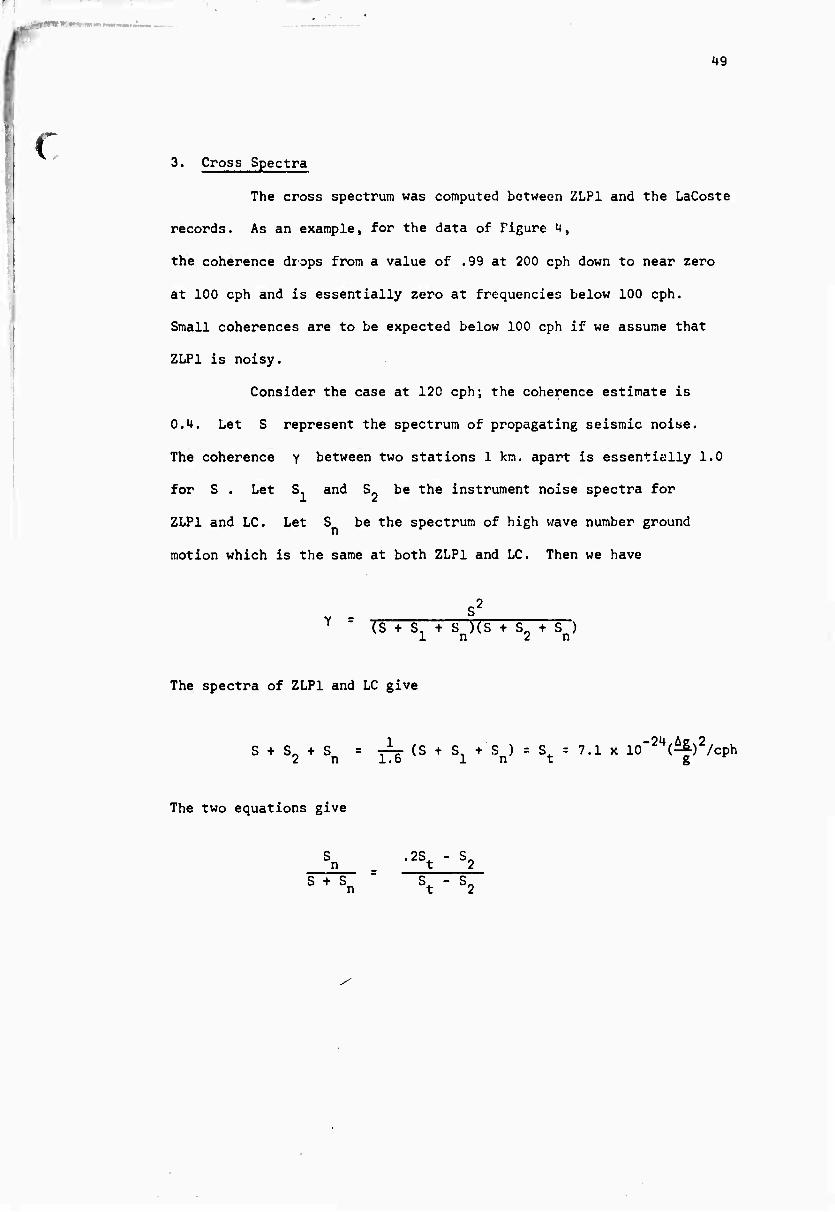
3. Cross Spectra
The cross spectrum was computed between ZLP1 and the LaCoste
records. As an example, for the data of Figure 4,
the coherence drops from a value of .99 at 200 cph down to near zero
at 100 cph and is essentially zero at frequencies below 100 cph.
Small coherences are to be expected below 100 cph if we assume that
ZLP1 is noisy.
Consider the case at 120 cph; the coherence estimate is
O.U. Let S represent the spectrum of propagating seismic noise.
The coherence y between two stations 1 km. apart is essentially 1.0
for S . Let S, and S« be the instrument noise spectra for
ZLP1 and LC. Let S be the spectrum of high wave number ground
motion which is the same at both ZLP1 and LC. Then we have
T " (S + S, + S )(S + S- + S ) In ^ n
The spectra of ZLP1 and LC give
S + S2 + Sn = 3^5 (S + S1 + Sn) = St = 7.1 x 10"24(^|-)2/cph
The two equations give
Sn '^t - S2 S + sn st - s2

50
If we take S = 5 x lO" (^-)2/cph then ?—2^ = .14 so that about 2 g S + Sn
1/7 of the power is high wave number noise. This value depends on
the assumed value of S0 . If S = 10"24(^)2/cph, than S /(S+S ) * / g n n
= .07.
Cross spectra were also computed between the microbaragraph
and ZLP1 and LC. Ho significant coherence was found between the
seismic and the barograph data at any frequencies between 2 and 200
cph. The lack of coherence does not necessarily mean that the ground
motion below 100 cph is unrelated to atmospheric pressure changes.
On the contrary, the evidence suggests that the low level spectrum
observed on the LC could be atmospherically induced.
Consider the following model of atmospheric pressure loading.
A homogeneous half space with Larai parameters X , y is loaded by
constant pressure p over a sector bounded by polar coordinates
r. < r < r- ; 6. < 6 < e« . At the origin the vertical ground
displacement due to the static load is given by
Wo - h Po(r2 " rl)(e2 - V
^ + 2p 2u(X + v)
Divide the plane bv circles concentric with the origin
such that each circle has radius
Rn = (2n - 1)R ; n = 1, 2, 3...

where R is a scale length. If
A = TTR
51
is the area of the central circle, then each ring R , < r < R ' B n-1 - - n
has area
A = 8(n - DA n
n - 2, 3,...
Divide each ring into 8(n-l) equal area sectors by drawing radii
at intervals of 9 = 2ii/8(n-l) in each ring. The plane has now
been sectored into equal area regions, each approximately square.
Our model is that each of the sectors is loaded by atmos-
pheric pressure variations independent of all the others and that
p has the same mean square value (in time) for each sector. The
spectrum of w (which we designate as ^w ^) will thus be the
of the spectra from each sector. V7e assume that the pressure wave
lengths are small compared to seismic wave lengths so that the static
loading theory holds. The contribution in power due to the central
2 circle is proportional to R . The contribution from all the sectors
in the n ring is
sum
8(n-l) 2R
8(n-l) 2(n-l) ) n — *-1 o j«• •
so that the total power is proportional to
R2 [1 . i Sn]

. ■ i mtammäm . —IM^.I »iwipmiii ■■um
52
where S *l + rr+<r+... — . n 2 3 n
is the harmonic series. As n goes to infinity, S diverges; but
it doesn't diverge very fast. For n = 1,000, S =7.5 while for
n = 30,000, S = 10.9. n
11 2 Letting X = y = 2 x 10 dynes/cm we have
2 -11 2 Consider the frequency 60 cph; taking ^w )>= 3 x 10 cm sec ( N o
(Table 2) and ^p ^= 10 (dynes/cm) sec (Haubrich and MacKenzie,
1965).
1 k R(l + 4 S K = »+60 meters <: n
from which R is determined for a given . Thus for
n = 1,000 R = 211 meters
n = 30,000 R = 182 meters
For n larger than 1000 the model is rather insensitive to the value
of n .
From this model, we conclude that the coherence between
pressure induced ground motion and local pressure should be
1/(1 + Y S ) which is about .21 at n = 1000 and .15 at n = 30,000.
These coherence values are too low to be observed from the data
considered here.

r c
53
The values of R obtained are close to those observed for
cases where coherent pressure and ground motion were observed (Haubrich
and MacKenzie, 1965). On those occasions when the observed coherence
is above 0.5, one must assume that the above model fails in that /p 2\,
is higher than average in the areas close to the seismometer.
As frequency decreases, the pressure spectrum typically
increases by about 9 to 12 db per octive. This explains the
relatively flat ground acceleration spectrum above 6 cph. The increase
in the ground spectrum at lower frequencies would seem to indicate
that R increases with the period of atmospheric pressure variations
below 6 cph.

( 54
■«. '
.ef erences
Block, B. and R. D. Moore, Measurements in the earth mode frequency
range by an electrostatic sensing and feedback gravimeter,
J. Geophye. Res., 71, 4361 - 4375, 1966.
Haubrich, R. A. and G. S. MacKenzie, Earth noise, 5 to 500 millicycles
per second: 2. Reaction of the earth to oceans and
atmosphere, J. Geophys. Res., 70, 1429 - 1440, 1965.

'
S5
TABLE 1
Figure No. Date Start Time Sample Record MST Rate Length
3 1/17/69 1320 3|/sec. 2.9 hr.
M U/18/69 lOUO 3i/sec 7.3 hr.
5 8/16/69 1200 3|/sec 2.9 hr.
TABLE 2
cph Period Seconds 10'24(Ag/g)2/cph 10"24(Ag/g)2/cph
10 360 -8 2
3.9 x io cm sec 8.7 x 10' cm rms/octive
60 60 -11 2
3.0 x 10 cm sec _7
5.9 x io cm rms/octive


/ 58
V > •o <u C 3 IA «O
i o. IA u «
CM cn s~*s
VO a> •**, 1^. a>
< ^. ***0'
"* (Si
c | o • o
(U t—
c +J o «/» o
•r- o 4-> 4J o
(0 a» ■ _l >
•r- t? +J C • • (0 3 00 f—»
O (U E C C7> XJ
c XI M- to "O O
QJ c r— k 3 a. (0 I. _i
■•-> M u> o +J 0) •r- D. • • C m < =>
• • CO
9) E O)
/
<
/
/
\
\
o o cvj
O O
Q:
O
ce LU a. CO UJ -j o >- o
1 1 I 1 o O o o CD lO ^l- ro
qp o CM

59
5
I a
i 5 s
& CM
Oi t • o
s
«o
I
/ /
o in
J- o

•
60
. J
9
5 3
§ 2
I t 3
o
o o
UJ Q. cn UJ -J o >• o
-IQ
s o o qp
o CVJ

I
•"»m*"
\ « 61
r. LINEARIZATION AND CALIBRATION OF ELECTROSTATICALLY FEDBACK GRAVITY METERS
By Robert D. Moore and W. E. Farrell
Abstract
On« of the common techniques for converting LaCoste-Romberg survey gravity
meters into fedback continuously recording tidal gravity meters is to detect
the mass position with a capacitor bridge and apply feedback forces electro-
statically. In general, this servosystem is nonlinear and the output voltage
has a quadratic as well as a linear dependence on gravity. For the tidal
variation in gravity, the quadratic term can be reduced from typically 10% to
.1% of the linear term with a modification of the standard feedback system.
The linearized, fedback gravity meter is precisely calibrated by a two-step
procedure. First, the tilt method is used to determine the zero frequency
response. The frequency dependence cf the transfer function, vital for
accurate phase calibration at tidal frequencies, is measured by inserting
a random signal in the feedback loop and crosscorrelating the random signal with
the gravity meter output. The accuracy of the calibration at tidal frequencies
is t .3% in amplitude and + .2 degrees in phase.
J. Geophys. Rea., 75, 928-932, 1970
<

UNCLASSIFIED SfUfUy CI>Mi>ictti«>n **
DOCUMINT COHTROt MU • R * D '»rru.nv rltttlllflfn •> Uli», »oär ol thilfrt »nj mätunj mnnminlnn wu'l » »f t»»O^B^»i> 9¥tfll fptl It tUflll**)
I eMia>N*ri><e*cri«iTv iC»tp»fi» mlmii
Univtrslty of California, San Diago Inatituta of Gaophysics and Planetary Physics La Jolla, California
UNCLASSIFIED I». «MOW*
Low Laval barth Motion
« Oltt"ifT.»t »Ottt rrV*> ml fß»n •«< Inclutl** 4»>»t)
Final Report - 1 May 1964 ■ 30 Sap 1969 • «u TMOM<II (FittTTSSSTmiMI» InliJäTläT) SSQ
Richard A. Haubrich
1 May 1970 AF49(638)-138B
66 »» NO or •€»•
14 •id
» »"OjtC T NO 8652
627010 •kit Wpwq
AFOSR TO-lfiQ^TR it ontaiautiON »»»ttMtN»
1. This document has been approved for public release end aale; ita distribution is unlimited.
II »u'OkCMCMT*«« NOTC*
TECH, OTHER
I *Mt»>ct -t
I« IPOMtOIIINe MILI TAMi «C '■*•»•
AF Office of Scientific Research (SRPG) 1400 Wilson Boulevard Arlington, VA 22209
ly propoaed by the authors for constructing Earth models which set of grojs Earth data is applied to the problem of constructing ure which, within experimental error, fits the observed travel £ + 250(50)950. Three auch modele are obtained, all of which
1. A scheme recent fit a given finite a P-velocity struct time a in the range fit the observed travel tiroes with residuals lese than 0.06°, whereaa 0.5° Is the estimated standard outer 700 km of the
error of the observations, mantle.
The modele differ meinly in the
2. A gross Earth datum is a single measurable number describing some proper'y of the whole Earth, such aa mass, moment of inertia, or the frequency of oscillation of some identified elastic-gravitational normal mode. We suppose that a finit* set of G of gross Earth data has been measured, that the measurements are inaccurate, and that the variance matrix of the errors of measurement can be estimated. We show that some such sets G of measurements determine the structure of the Earth within certain limits of error except for fine-scale detail. That is, from some sets G it is possible to compute localized average of the earth structure at various depths. These localized averages will be slightly in c-ror, and their error will be larger as their resolvi ig lengths are shortened. We show how to determine whether a given set G of measured gross Earth data permits such a construction of localized averages and if so, how to find the shortest length scale over which G gives a local average structure at a particular depth if the variance of error in computing that local average from G is to be less than a specified amount.
DD /r.,1473 UNCLASSIFIED.
Svcunlv ClaftMficalion
. •• .
i'curiiv f U««ifl callan • 4 tIN» *>
■ Ott
LINN ■
■ OL«
LINK C
HOtt
Mod« theory Resolving Power Groat «arth Data Q
UMCLASSIEIED S*curily CU*»i(ic«lion
■