pwc sports outlook 2016
TRANSCRIPT

At the gate and beyondOutlook for the sports market in North America through 2020
www.pwc.com/us/sports
October 2016
PwC Sports Outlook

At the gate and beyond | 2
Introduction 3
Gate revenues 4
Media rights 9
Sponsorship 10
Merchandise 12
Appendix 14
Contacts 16
Table of Contents

At the gate and beyond | 3
Introduction
Segment definitions
For the purposes of this report, the sports market consists of:
Gate revenues - primary market ticket sales for live sporting events. Non-recurring seat premiums and license costs are not included.
Media rights - fees paid to show sporting events on broadcast and cable television networks, television stations, terrestrial radio, satellite radio, the Internet, and on mobile devices.
Sponsorship - fees paid to have a brand associated with a team, league, facility or event, including naming and category rights.
Merchandising - the sale of licensed products with team and league logos, player likenesses, and other intellectual property. Food concession revenues are not included.
North America sports market by segment
2011 2012 2013 2014 2015 2016 2017 2018 2019 2020 CAGR
US$ millions
Gate revenues 16,115 15,821 17,372 17,707 18,265 18,721 19,372 19,789 20,318 20,818 2.7%
Media rights 10,800 11,619 12,262 14,595 16,305 18,218 18,876 19,868 20,533 21,289 5.5%
Sponsorship 12,615 13,257 13,900 14,689 15,481 16,301 16,931 17,541 18,128 18,741 3.9%
Merchandising 12,482 12,771 13,144 13,493 13,806 13,966 14,200 14,422 14,624 14,822 1.4%
Total 52,012 53,468 56,678 60,484 63,857 67,206 69,379 71,620 73,603 75,670 3.5%
% change year on year
Gate revenues -1.8% 9.8% 1.9% 3.1% 2.5% 3.5% 2.2% 2.7% 2.5%
Media rights 7.6% 4.2% 18.8% 11.7% 11.7% 3.6% 5.3% 3.3% 3.7%
Sponsorship 5.1% 4.9% 5.1% 5.4% 5.3% 3.9% 3.6% 3.3% 3.4%
Merchandising 2.3% 2.9% 2.7% 2.3% 1.2% 1.7% 1.6% 1.4% 1.4%
Total 2.8% 6.0% 6.7% 5.6% 5.2% 3.2% 3.2% 2.8% 2.8%
CAGR - compound annual growth rate Source: PwC Sports Outlook (October 2016)
Welcome to the 2016 edition of the PwC Sports Outlook, which updates PwC’s perspective on the sports industry, including recent results and potential opportunities and challenges to future industry growth. This year’s edition refreshes our five-year revenue forecasts through 2020 within four key segments of the North American sports market: gate revenues, media rights, sponsorship, and merchandising.
We project the sports market in North America will grow at a compound annual rate of 3.5 percent across the four segments analyzed, from $63.9 billion in 2015 to $75.7 billion in 2020.
Beyond 2016, the industry should move into a period with more stable conditions relative to the past five years, which were characterized by post-recession recovery, CBA-related work stoppages, and new media rights deals. The relative near-term stability is noted in part by limited recent transaction activity involving major pro league clubs, which tends to peak immediately before/after new CBA and national media rights deals and bottom out in the middle of those deal cycles when there is higher uncertainty regarding a league’s future economic conditions.
Yet while team ownership has stabilized at this point in the cycle, new business ventures by industry and its rights holders, partners and service providers are channeling significant incremental capital into sports; positioning for potential growth opportunities ahead and in support of team valuations and demand for limited partner interests.
Higher volatility likely will return to the industry-wide forecasts in next year’s edition of the Outlook as the next cycle of rights deals begins to overlap with the five-year projection period and a shift in underlying economic conditions becomes more imminent.
At the gate and beyond | 4
Gate revenues
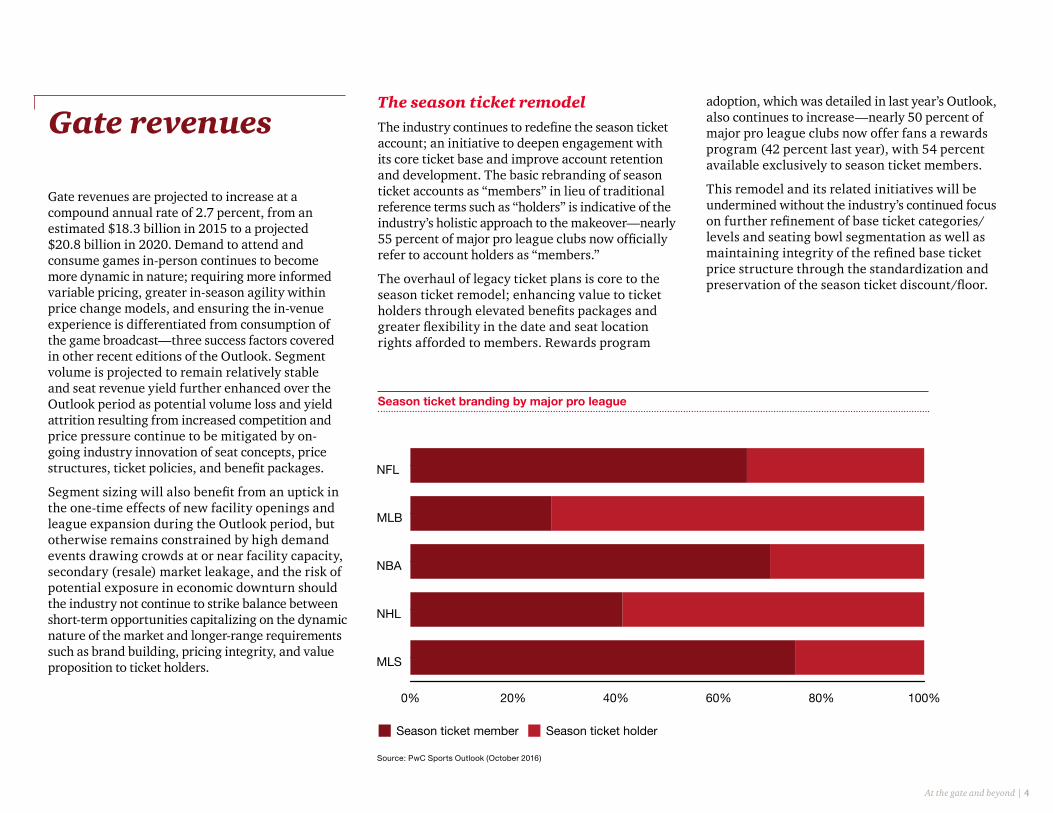
Season ticket branding by major pro league
Gate revenues are projected to increase at a compound annual rate of 2.7 percent, from an estimated $18.3 billion in 2015 to a projected $20.8 billion in 2020. Demand to attend and consume games in-person continues to become more dynamic in nature; requiring more informed variable pricing, greater in-season agility within price change models, and ensuring the in-venue experience is differentiated from consumption of the game broadcast—three success factors covered in other recent editions of the Outlook. Segment volume is projected to remain relatively stable and seat revenue yield further enhanced over the Outlook period as potential volume loss and yield attrition resulting from increased competition and price pressure continue to be mitigated by on-going industry innovation of seat concepts, price structures, ticket policies, and benefit packages.
Segment sizing will also benefit from an uptick in the one-time effects of new facility openings and league expansion during the Outlook period, but otherwise remains constrained by high demand events drawing crowds at or near facility capacity, secondary (resale) market leakage, and the risk of potential exposure in economic downturn should the industry not continue to strike balance between short-term opportunities capitalizing on the dynamic nature of the market and longer-range requirements such as brand building, pricing integrity, and value proposition to ticket holders.
The season ticket remodelThe industry continues to redefine the season ticket account; an initiative to deepen engagement with its core ticket base and improve account retention and development. The basic rebranding of season ticket accounts as “members” in lieu of traditional reference terms such as “holders” is indicative of the industry’s holistic approach to the makeover—nearly 55 percent of major pro league clubs now officially refer to account holders as “members.”
The overhaul of legacy ticket plans is core to the season ticket remodel; enhancing value to ticket holders through elevated benefits packages and greater flexibility in the date and seat location rights afforded to members. Rewards program
adoption, which was detailed in last year’s Outlook, also continues to increase—nearly 50 percent of major pro league clubs now offer fans a rewards program (42 percent last year), with 54 percent available exclusively to season ticket members.
This remodel and its related initiatives will be undermined without the industry’s continued focus on further refinement of base ticket categories/levels and seating bowl segmentation as well as maintaining integrity of the refined base ticket price structure through the standardization and preservation of the season ticket discount/floor.
0% 20% 40% 60% 80% 100%
MLS
NHL
NBA
MLB
NFL
Season ticket member Season ticket holder
Source: PwC Sports Outlook (October 2016)

At the gate and beyond | 5
Season tickets: select monetary benefits by major pro league
Seat rights flexibility
Partial season plans are shifting from pre-set packages of fixed dates/seats to more flexible pre-paid rights which afford the holder more discretion in use of the account’s ticket allotment—more than 40 percent of major league pro clubs currently offer one or more partial season plans with flexible game dates and/or seat locations, with highest adoption currently among MLB and MLS clubs. Further, ticket exchange rights are being adopted and programmed across full and partial season plans which allow account holders to redeem unused tickets for available alternate dates. Pre-game exchange rights are more common than post-game rights—pre- and post-game rights are granted by more than 35 percent and 15 percent of major pro league clubs, respectively—and are less restrictive in terms of additional fees charged, number of games that can be exchanged, and selection of games available for redemption. With enhanced ticket use flexibility across all plan types, differentiated pricing and benefit packaging have become critical to maintaining full season accounts and further developing partial season accounts.
Monetary benefits
Season ticket holder access to exclusive content and immersive experiences have become key rights afforded within the benefit package to differentiate season ticket plans and further segment among plan types. However, monetary benefits within the season ticket package remain more widely considered by ticket holders in the value equation along with the season ticket price discount; contributing directly to the bottom line of ticket holder economics. Among monetary benefits, in-venue retail is the most prevalent, followed by parking and in-venue F&B—offered by more than 80 percent, 40 percent, and 35 percent of major pro league clubs, respectively.
In general, a purchase discount model is utilized where goods are sold to account holders at a discounted price compared to other game attendees. Another notable, but less common model, provides an upfront purchase credit to the season ticket account—based on the total cost of the season tickets—that can be used at the account holders’ discretion for in-venue retail and F&B purchases.
Source: PwC Sports Outlook (October 2016)
0% 20% 40% 60% 80% 100%
MLS
NHL
NBA
MLB
NFL
F&B discount
F&B credit
Parking discount
Parking credit
Retail discount
Retail credit
Most clubs segment and award monetary benefits to season ticket accounts based on plan type while others also vest account holders into monetary benefits based on tenure and seat category. On average, retail and F&B discounts which consider account tenure are 65 percent higher when a season ticket account is fully vested than the rate of discount assigned to season ticket accounts exclusively by plan type.

At the gate and beyond | 6
Ticket policies
With season ticket accounts now being positioned as an annual membership and supported by year-round programming and engagement, the industry has begun to roll-out year-round payment plans and adopt auto-renewal policies for accounts—approximately 20 percent of major pro league clubs now default to auto-renewal of accounts, albeit most offer an opt-out option to account holders who agree to up-front or accelerated payment.
The season ticket remodel has also eased industry’s adoption of more aggressive season ticket holder policies such as delayed ticket delivery, ticket resale restrictions, and ticket transfer fees—approximately 20 percent of major pro league clubs have implemented policies placing restrictions on ticket resale, with highest adoption currently within MLB and NHL. Resale restrictions regulate an account holder’s authorized resale location(s), permitted resale volume, and/or establish resale price floors or ceilings. Digital ticketing and delayed ticket delivery policies strengthen any resale restrictions established by enhancing visibility into account activity and end user profiles—approximately 30 percent of major pro league clubs deliver digital tickets to account holders as either the default or single option.
Such season ticket policies are part of the industry’s broader strategy to address secondary market activity and establish an official blended marketplace along with other leading tactics, including dynamic pricing in the primary market, direct participation in official ticket exchanges, partnerships with third-party platforms, broker account controls, and the emerging practice of ticket buy-back programs.
The premium seat marketPremium seating is a key component of the industry's seat program mix, representing more than 15 percent of seat inventory across professional sports in North America and up to 40 percent of a club's total seat related revenue. Member clubs across the five major pro leagues currently generate more than $7.3 billion from premium seat holders, a market sizing which accounts for seat premiums as well as related gate receipts and F&B revenue generated from suite, club and loge inventory.
Premium seat composition continues to evolve with newer concepts such as mega suites and loge boxes filling in the premium seat spectrum between the traditional private suite and club seat products. As detailed in the 2014 edition of the Outlook, these concepts have become common elements of the premium seat mix in new build projects and are also being programmed into older venues by repositioning excess private suite and club seat inventory.
Major pro leagues: premium seat market size
Five major pro leagues currently generate more than
$7.3 billion from premium seat holders
Source: PwC Sports Outlook (October 2016)
$0
$1B
$2B
$3B
$4B
$5B
$6B
$7B
$8B
Related gate receipts Related F&B revenue
Club premiums
Suite premiums
Loge premiums
*Figures presented in billions
$2.6B
$0.8B
$1.8B
$0.2B
$1.9B
Total - $7.3B

At the gate and beyond | 7
Major pro league venues: premium seat inventory
The migration of premium seat inventory to the event level and lower bowl from the traditional suite and club seat level(s) above continues across professional sports and intercollegiate athletics. This repositioning locates premium seat holders closer to the action and allows the industry to remove friction points in delivering immersive experiences to its highest end premium accounts. Approximately 60 percent of major pro league venues currently feature one or more event level products, many of which provide premium seat holders with exclusive views and access to players, coaches, and behind the scenes activity. The majority of event level products—event level suites, bunker suites and membership clubs—are located outside the seating bowl and include lower bowl seat access for game viewing due to physical constraints, among other considerations—event level products with a view of the event only represents approximately 35 percent of the event level inventory across major pro league venues.
Event level premium inventory: percent of major pro league venues
Source: PwC Sports Outlook (October 2016)
0
100,000
200,000
300,000
400,000
500,000
600,000
700,000
800,000
900,000
2016201520142013201220112010200920082007200620052004200320022001200019991998199719961995
Arena
Pre
miu
m s
eats
Stadium
Ballpark
Soccer stadium
Source: PwC Sports Outlook (October 2016)
0% 20% 40% 60% 80% 100%
Soccer Stadium
Ballpark
Stadium
Arena
Event view No event view
82%
59%
43%
59%

At the gate and beyond | 8
Sourcing space for fan zonesAs first covered in last year’s Outlook, fan zones—otherwise referred to as fan decks or plazas—have become a core building program element of new build and renovation projects to promote fan interaction as well as offer innovative and communal game day experiences. Today, more than 50 percent of major pro league venues feature one or more fan zones with a dedicated footprint.
Nearly 70 percent of fan zone inventory located within venue seating bowls has been constructed as part of a facility renovation project. General seat sections and concourse spaces were displaced and repositioned in nearly 65 percent of these projects, with premium seating and various other miscellaneous spaces accounting for the remaining projects.
Fan zone build-out: displaced seats and space in renovation projects
Fan zones located within seating bowls resulting from renovation projects are most often located on a venue’s upper levels, comprising 64 percent of renovated inventory, while similar areas programmed into new build facilities are more evenly distributed among lower and upper levels of the venue. Regardless of project type, over 90 percent of all fan zones are located in outfield or non-sideline locations. More than
50% of major pro league
venues feature one or more fan zones with a
dedicated footprint
General Seats Premium Seats Concourse Other
Soccer Stadium
25%
25%
50%
Ballpark
36%
29%
36%
Stadium
36%
9%
45%
9%
Arena
40%
20%
20%
20%
Source: PwC Sports Outlook (October 2016)
At the gate and beyond | 9
Media rights
Media rights are projected to increase at a compound annual rate of 5.5 percent, from an estimated $16.3 billion in 2015 to a projected $21.3 billion in 2020. The segment’s pace of growth is expected to stabilize and moderate over the next five years following the torrid pace realized over the past decade and across two deal cycles; a period which has positioned media rights to become the industry’s largest segment by 2018.
Consumer and advertiser engagement with game broadcasts and other sports media content is expected to remain strong; keeping media rights in-demand among traditional broadcaster intermediaries along with other emerging distribution partners who are elevating the competitive environment for rights deals. Sports properties continue to signal preference to monetize through rights fees from intermediaries, however, the composition of the media rights segment is likely to continue to diversify as more content is monetized through direct carriage fees of league networks and digitally through in-house and equity ventures involving direct collection of subscription and ad revenues.
Sports properties are focused on new digital and immersive products positioned incremental to the traditional broadcast to reach new audiences, deepen engagement, and displace any rights fee premium lost in next cycle of broadcast deals as pay-TV evolves away from or within the bundle. As first noted in last year’s Outlook, the next rights deal cycle, which will begin to overlap the projection period in next year’s edition, is unlikely to realize the same rights fee premiums from broadcast intermediaries as were yielded during
the current cycle. The extent to and rate at which the current cycle premium is dissolved in the next deal cycle will depend on the pace and extent to which the cable bundle is unraveled as well as how quickly the technology enabling and elevating digital experiences is advanced and adopted.
Broadcast rights preservation is likely to remain industry priority through at last the next deal cycle, which will lead most properties to avoid major disruption of existing distribution and potential further dilution of rights fees. As a result, direct to consumer offerings featuring live game content will likely continue to be positioned to incremental audiences and/or focus on consumer
experiences complimentary to traditional game viewing. Further, other emerging digital products are focusing on premium, immersive experiences with either live or archived content enabled by a wide landscape of underlying technology, including personalized video, 3D video, virtual reality, augmented video, and augmented reality. Such products will impact value pools across the sports market value chain. Product roadmaps and realization of key features such as consumer personalization, authorship, social interactivity, seamless transitions, and real-time delivery will determine extent to which immersive products targeted will result in shifts within or increases to the sports wallet of consumers and advertisers.
At the gate and beyond | 10
Sponsorship
Sponsorship is projected to increase at a compound annual rate of 3.9 percent, from an estimated $15.5 billion in 2015 to a projected $18.7 billion in 2020. The segment was surpassed in size by media rights in 2015, but strong segment fundamentals and the second-highest projected rate of growth will keep sponsorship ahead of merchandising as the industry’s third largest segment.
The projected five-year growth rate for sponsorship was lowered from 4.5 percent per year to just under 4 percent per year in this year’s edition as key existing inventory, which became available over the past several years with the runoff of prior generation deals, is recommitted in multi-year deals during the early part of the projection period. Limited inventory is then expected to constrain deal volume towards the end of the five-year outlook with existing inventory committed and deals involving new inventory resulting from digital media platforms, uniform rights, and incremental in-venue signage and naming rights opportunities slower to be realized. The yield levels anticipated for much of the new inventory targeted will likely materialize towards the end or outside the projection period due to the expected roll-out timing of the underlying technologies or the otherwise likely nearer term shift of existing sponsor commitments to such inventory versus the generation of incremental fees. As a result, industry will likely phase into or otherwise delay deal making on new inventory to synch with product roadmaps and/or a potential deeper industry-wide pool of sponsorship dollars.
The sponsorship segment is composed of various categories of rights and entitlements.
At the gate and beyond | 11
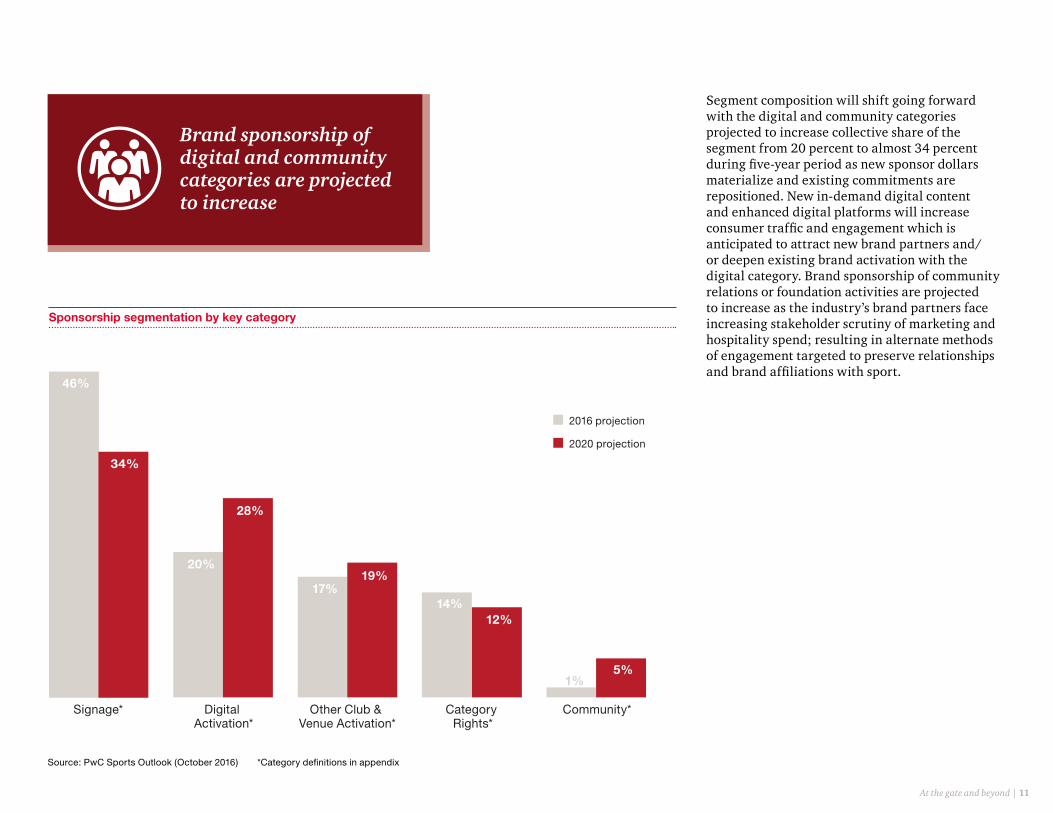
Segment composition will shift going forward with the digital and community categories projected to increase collective share of the segment from 20 percent to almost 34 percent during five-year period as new sponsor dollars materialize and existing commitments are repositioned. New in-demand digital content and enhanced digital platforms will increase consumer traffic and engagement which is anticipated to attract new brand partners and/or deepen existing brand activation with the digital category. Brand sponsorship of community relations or foundation activities are projected to increase as the industry’s brand partners face increasing stakeholder scrutiny of marketing and hospitality spend; resulting in alternate methods of engagement targeted to preserve relationships and brand affiliations with sport.
Sponsorship segmentation by key category
Source: PwC Sports Outlook (October 2016) *Category definitions in appendix
Brand sponsorship of digital and community categories are projected to increase
Signage* Digital Activation*
Other Club & Venue Activation*
Category Rights*
Community*
46%
20%
17%14%
1%
34%
28%
19%
12%
5%
2016 projection
2020 projection

At the gate and beyond | 12
Merchandise
Licensed merchandise sales are projected to increase at a compound annual rate of 1.4 percent from an estimated $13.8 billion in 2015 to a projected $14.8 billion in 2020. Segment growth remains largely tied to economic conditions and over the next five years will continue to pace well-below historical high-water marks, constrained by market saturation, macroeconomic pressures, and changes in domestic spending patterns, including more direct competition for discretionary spend. Additionally, the segment’s domestic growth could be affected by industry focus on international markets, as e-commerce and the digital reach of major pro league clubs makes expansion to new markets an increasingly attainable and attractive growth strategy in lieu of a relatively mature domestic market.
Further innovation within traditional product development as well as retail sales and distribution models will likely contribute to the incremental segment growth domestically, as fragmented demand and continued sector disruption propel sports industry properties and their license and retailer partners in the build out of omnichannel and realization of other guiding principles such as customized promotions, real-time production, experiential shopping, and frictionless transactions.
As noted in last year’s edition of the Outlook, another notable measure being taken by major pro league clubs to improve metrics is the adoption of in-house operations of the retail business. The number of major pro league clubs operating retail in-house has remained stable year over year, with approximately 40 percent operating in-house and 60 percent utilizing an external operator.
Retail business models - key benefits
In-House Operation External Service Provider
Full view of customer and fan profiles Purchasing power and other economies of scale
Integrated lines of business, operations and systems Institutional knowledge of retail operations and leading practices
Pricing autonomy Risk transfer on inventory and overhead costs
Full control of retail product and service delivery Capital preservation
Real-time capture and use of transaction data Integration with F&B operations if outsourced to same party
Full margin capture / service fee avoidance
Change agility and long-range planning
Leverage brand partners and build apparel partnerships
At the gate and beyond | 13
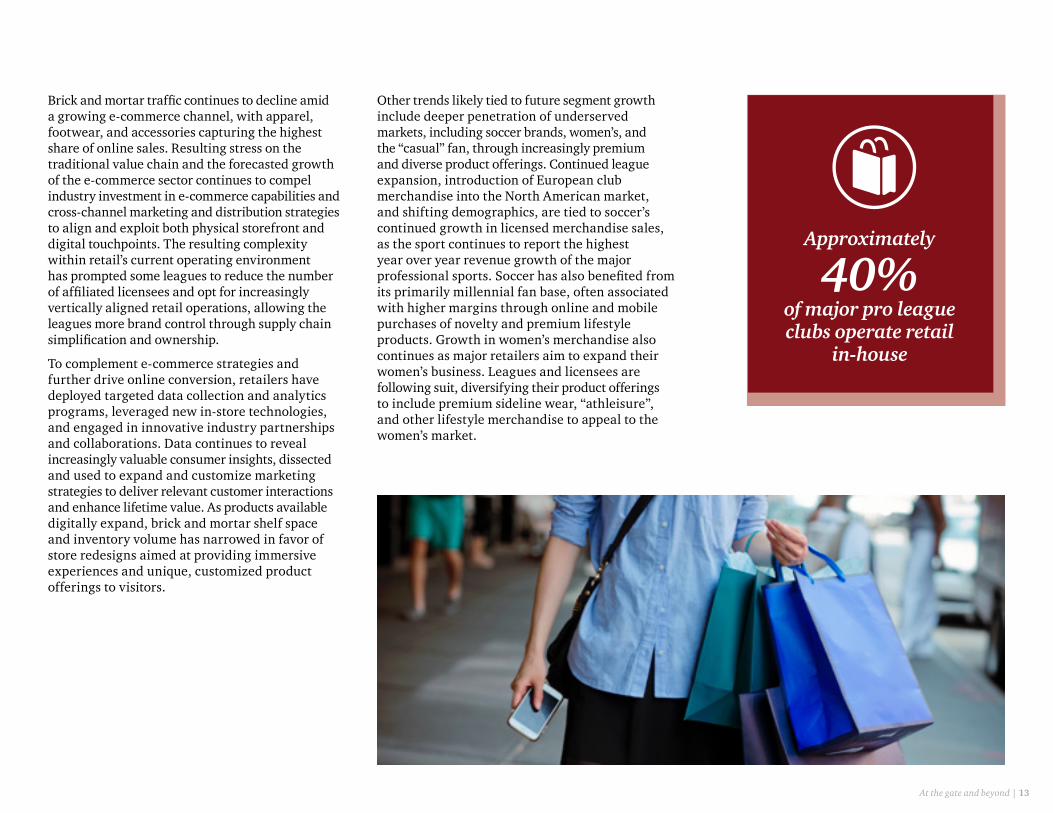
Brick and mortar traffic continues to decline amid a growing e-commerce channel, with apparel, footwear, and accessories capturing the highest share of online sales. Resulting stress on the traditional value chain and the forecasted growth of the e-commerce sector continues to compel industry investment in e-commerce capabilities and cross-channel marketing and distribution strategies to align and exploit both physical storefront and digital touchpoints. The resulting complexity within retail’s current operating environment has prompted some leagues to reduce the number of affiliated licensees and opt for increasingly vertically aligned retail operations, allowing the leagues more brand control through supply chain simplification and ownership.
To complement e-commerce strategies and further drive online conversion, retailers have deployed targeted data collection and analytics programs, leveraged new in-store technologies, and engaged in innovative industry partnerships and collaborations. Data continues to reveal increasingly valuable consumer insights, dissected and used to expand and customize marketing strategies to deliver relevant customer interactions and enhance lifetime value. As products available digitally expand, brick and mortar shelf space and inventory volume has narrowed in favor of store redesigns aimed at providing immersive experiences and unique, customized product offerings to visitors.
Other trends likely tied to future segment growth include deeper penetration of underserved markets, including soccer brands, women’s, and the “casual” fan, through increasingly premium and diverse product offerings. Continued league expansion, introduction of European club merchandise into the North American market, and shifting demographics, are tied to soccer’s continued growth in licensed merchandise sales, as the sport continues to report the highest year over year revenue growth of the major professional sports. Soccer has also benefited from its primarily millennial fan base, often associated with higher margins through online and mobile purchases of novelty and premium lifestyle products. Growth in women’s merchandise also continues as major retailers aim to expand their women’s business. Leagues and licensees are following suit, diversifying their product offerings to include premium sideline wear, “athleisure”, and other lifestyle merchandise to appeal to the women’s market.
Approximately 40%
of major pro league clubs operate retail
in-house

At the gate and beyond | 14
Appendix
Historical dataHistorical estimates and future projections were built starting with the collection of historical data from a variety of sources, including confidential and proprietary sources. Third-party sources of publicly available information, including trade associations and government agencies, were also consulted and their information used indirectly as part of the proprietary calculations.
Projection methodsAll projections are built around historical and current data alongside informed assumptions from our industry specialists related to factors likely to impact future trends, including economic, demographic, behavioral, technological, competitive, and other drivers. Multiple models were developed for each segment and the alternate results were reconciled by our industry specialists to represent the most accurate and likely scenario of future trends based on our professional experience and knowledge.
Growth rates Annual year-on-year growth rates and compound annual growth rates (CAGRs) have been calculated and presented in this report. The CAGRs show the average annual growth between the five years of 2016 to 2020 in each segment and are calculated using the following formula:
CAGR = 100 * [(Value in 2020/Value in 2015) 1/5 – 1]
InflationAll figures are reported in nominal terms reflecting actual spending transactions and therefore include the effects of inflation.
GlossaryCAGR Compound annual growth rate
CBA Collective bargaining agreement
MLB Major League Baseball
MLS Major League Soccer
NBA National Basketball Association
NFL National Football League
NHL National Hockey League
Sponsorship category definitions
Signage – naming right entitlements and permanent signage on building exterior, concourse, static boards, rotational boards, and video boards
Digital activation – ad placement, promotions, and partner recognition on official web pages, social media, email campaigns, mobile apps, and publications
Other club & venue activation - temporary signage, uniform rights, and presenting partner rights for event and non-event promotions
Category rights – official partner designations, product placements, and rights to league, club and venue marks
Community – partner recognition related to community relations and foundation activities

At the gate and beyond | 15
2015 Edition
• Dynamic Pricing
• Rewards Programs
• Fan Zones
• Media Rights Fee Premiums
• Naming Rights
• Retail Business Models & Satellite Locations
2014 Edition
• Facility Building Cycle & Industry Aging
• In-Venue Fan Experience
• Premium Seating
• Dynamic Pricing
• Local TV Rights Deals
• Naming Rights
2013 Edition
• Recession Period Effects
• In-Venue Fan Experience
• Enhanced Business Practices
PwC Sports Outlook/October 2015
At the gate and beyond Outlook for the sports market in North America through 2019
Overview
Gate revenues
Media rights
Sponsorship
Merchandise
Appendix
Contacts
At the gate and beyondOutlook for the sports market in North America through 2018
Overview
Gate revenues
Media rights
Sponsorship
Merchandise
Appendix
Contacts
PwC Sports Outlook/October 2014
PwC Sports Outlook / November 2013
At the gate and beyond
Outlook for the sports market in North America through 2017
Overview
Gate revenues
Media rights
Sponsorship
Merchandise
Appendix
Featured topics in other recent editions

Contacts
Editor
Adam W. Jones [email protected]
Other sports contacts
Michael Keenan [email protected]
Greg Peterson [email protected]
Andrew Rey [email protected]
Archie Fagot [email protected]
Sector leaders
Scott D. Berman Hospitality & Leisure (PwC US) [email protected]
Deborah Bothun Entertainment & Media (PwC US) [email protected]
John Simcoe Entertainment & Media (PwC Canada) [email protected]
©2016 PwC. All rights reserved. PwC refers to the US member firm or one of its subsidiaries or affiliates, and may sometimes refer to the PwC network. Each member firm is a separate legal entity. Please see www.pwc.com/structure for further details.
PwC refers to the US member firm, and may sometimes refer to the PwC network. Each member firm is a separate legal entity. Please see www.pwc.com/structure for further details. This content is for general information purposes only, and should not be used as a substitute for consultation with professional advisors. 214172-2017AK
pwc.com/us/sports