iab/pwc internet advertising revenue report · global entertainment and media outlook 2016 - 2020...
TRANSCRIPT
IAB/PwC Internet Advertising Revenue ReportFirst Half Year 2016 and Q2 2016
November 1, 2016

IAB First Half Year 2016 and Q2 2016 Internet Advertising Revenue Report
IAB/PwC Internet Ad Revenue Report: First Half Year 2016 and Q2 2016Agenda
2
Welcome
Kristina Sruoginis, Research Director, IAB
Half Year and Q2 2016 Digital Ad Revenue Highlights
David Doty, EVP and CMO, IAB
Kristina Sruoginis, Research Director, IAB
Detailed Analysis of IAB PwC First Half Year 2016 and Q2 2016 Report
David Silverman, Partner, PwC
Global Entertainment and Media Outlook 2016 - 2020
Gregory Boyer, Partner, Entertainment, Media and Communications,
PwC
Q & A

IAB First Half Year 2016 and Q2 2016 Internet Advertising Revenue Report
Important Note on Q&A
3
Journalists and IAB members can ask questions at
any time during the presentations. Please type
questions into the chat box on the webinar user
interface.
● We will create a queue and answer as
many questions as possible following the
presentations
● Additional press questions can be
directed to Laura Goldberg:
● Additional questions from IAB members
can be directed to Kristina Sruoginis:
The presentations and report will be available for
download after the webinar at:
https://www.iab.com/adrevenuereport

IAB First Half Year 2016 and Q2 2016 Internet Advertising Revenue Report
IAB/PwC Internet Advertising Revenue Report HighlightsNovember 2016
First Half Year 2016 and Q2 2016
David Doty, EVP and CMO, IAB
Kristina Sruoginis, Research Director, IAB

IAB First Half Year 2016 and Q2 2016 Internet Advertising Revenue Report
First Half 2016 Year-Over-Year Ad Revenue Growth
5
$ B
illio
ns
*The Nielsen Company, MonitorPlus (Standard Calendar, Total includes B2B, National Internet (Display only), FSI
Coupons), Oct. 2016
Total Media Ad
Revenue Growth
(HY 2015 vs. HY 2016)
The Nielsen Company
estimates total media
revenues for HY 2016
decreased by -2% from HY’15 to $57.9B*
$27.5
$32.7
$0
$5
$10
$15
$20
$25
$30
$35
HY 2015 HY 2016
Digital Ad Revenue Growth (HY 2015 vs. HY 2016)
19%

IAB First Half Year 2016 and Q2 2016 Internet Advertising Revenue Report
Highlights: Mobile Surges to Nearly Half All Revenue… Video and Social Also Up
6
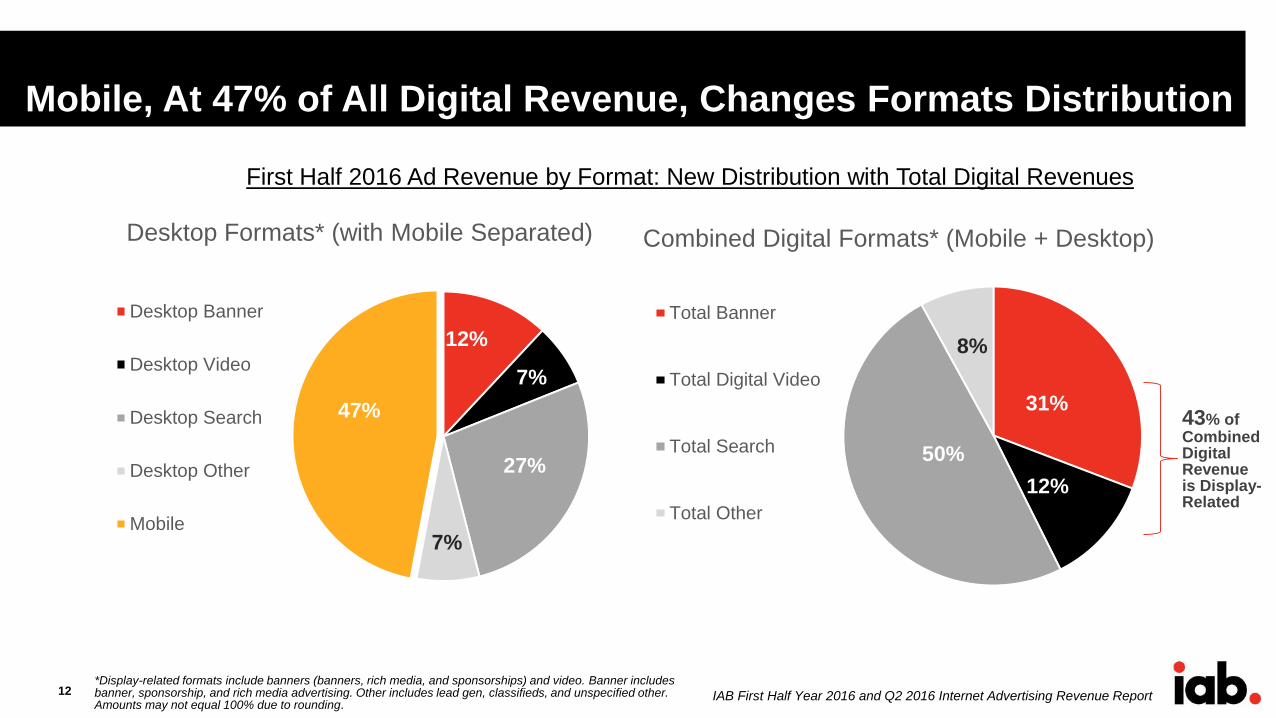
Mobile ad revenue, up 89% to $15.5 billion, now accounts for nearly half (47%) of internet ad revenue for the first half of 2016
Total video ad revenue (mobile + desktop) is up 51% to $3.9 billion
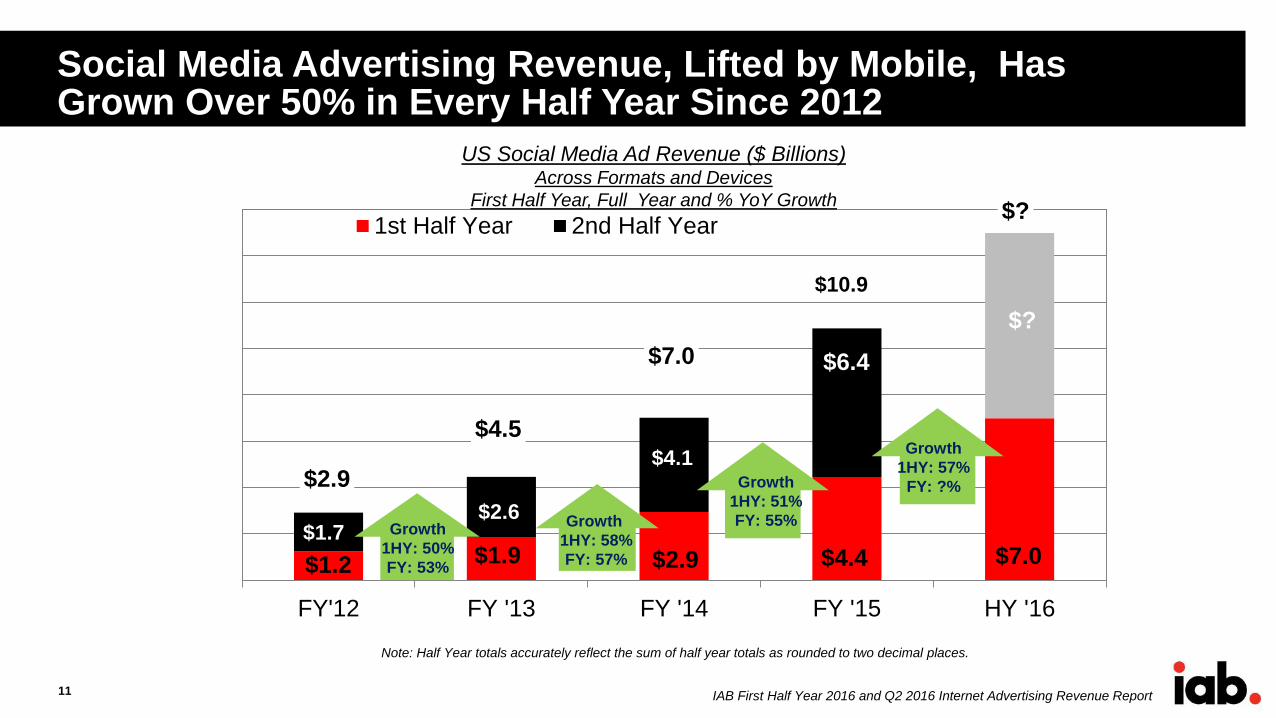
Total social media revenue (mobile + desktop), across all formats and platforms, is up 57% to $7 billion, growing by over 50% every half year since 2012
IAB First Half Year 2016 and Q2 2016 Internet Advertising Revenue Report
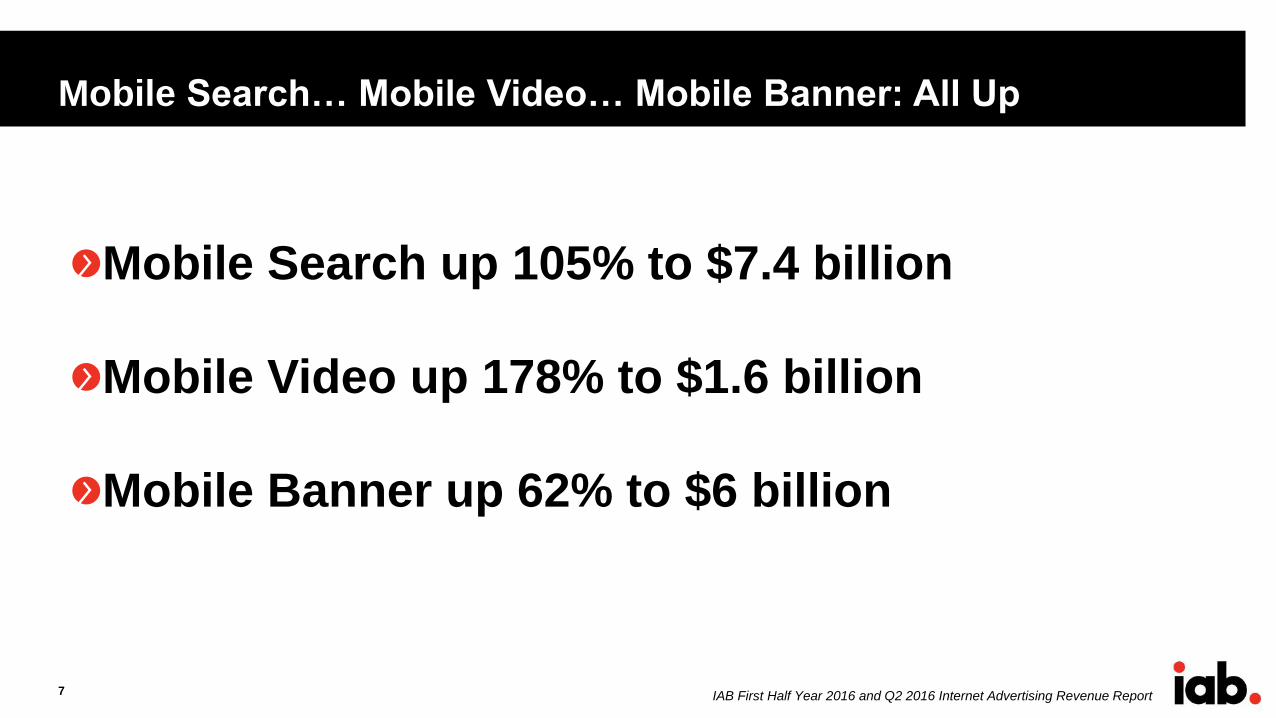
Mobile Search… Mobile Video… Mobile Banner: All Up
7
Mobile Search up 105% to $7.4 billion
Mobile Video up 178% to $1.6 billion
Mobile Banner up 62% to $6 billion
IAB First Half Year 2016 and Q2 2016 Internet Advertising Revenue Report
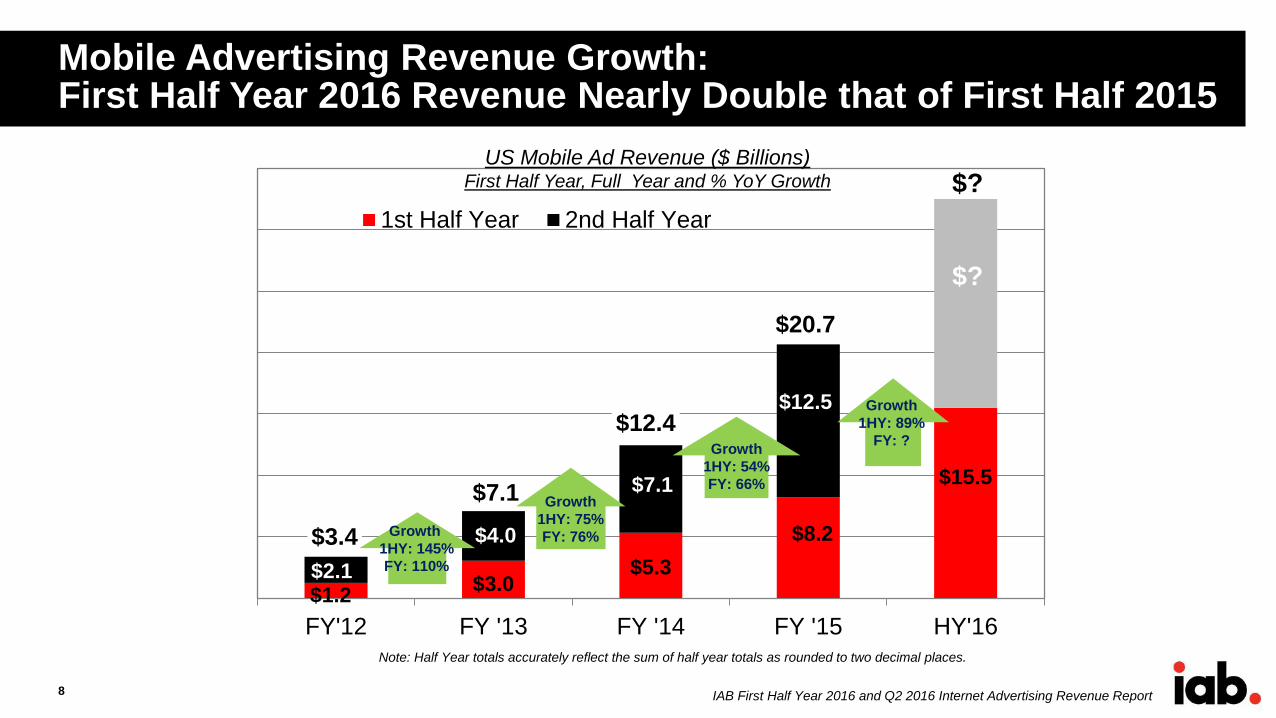
Mobile Advertising Revenue Growth:First Half Year 2016 Revenue Nearly Double that of First Half 2015
8
$1.2$3.0
$5.3
$8.2
$15.5
$3.4
$7.1
$12.4
$7.1
FY'12 FY '13 FY '14 FY '15 HY'16
1st Half Year 2nd Half Year
US Mobile Ad Revenue ($ Billions)First Half Year, Full Year and % YoY Growth
8
Growth
1HY: 145%
FY: 110%$2.1
$4.0
$20.7
Growth
1HY: 89%
FY: ?
$7.1
$12.5
Growth
1HY: 54%
FY: 66%
Note: Half Year totals accurately reflect the sum of half year totals as rounded to two decimal places.
$?
$?
Growth
1HY: 75%
FY: 76%
IAB First Half Year 2016 and Q2 2016 Internet Advertising Revenue Report
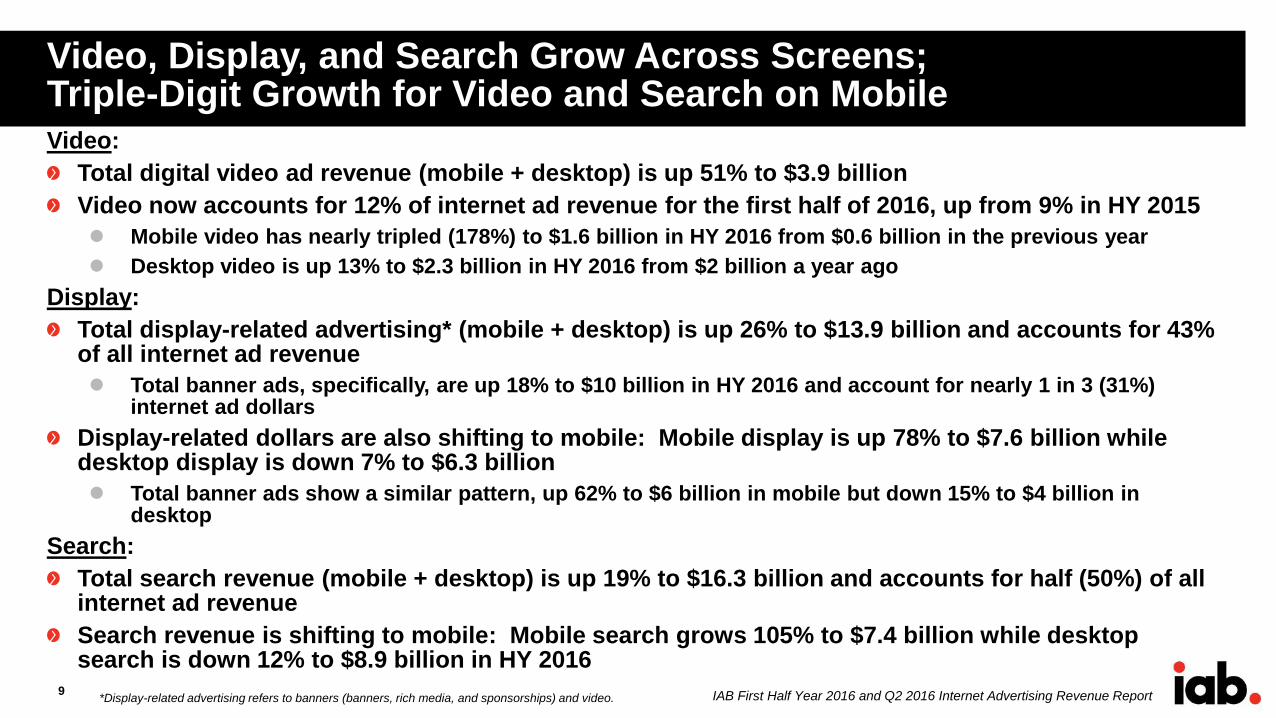
Video, Display, and Search Grow Across Screens; Triple-Digit Growth for Video and Search on Mobile
9
Video:
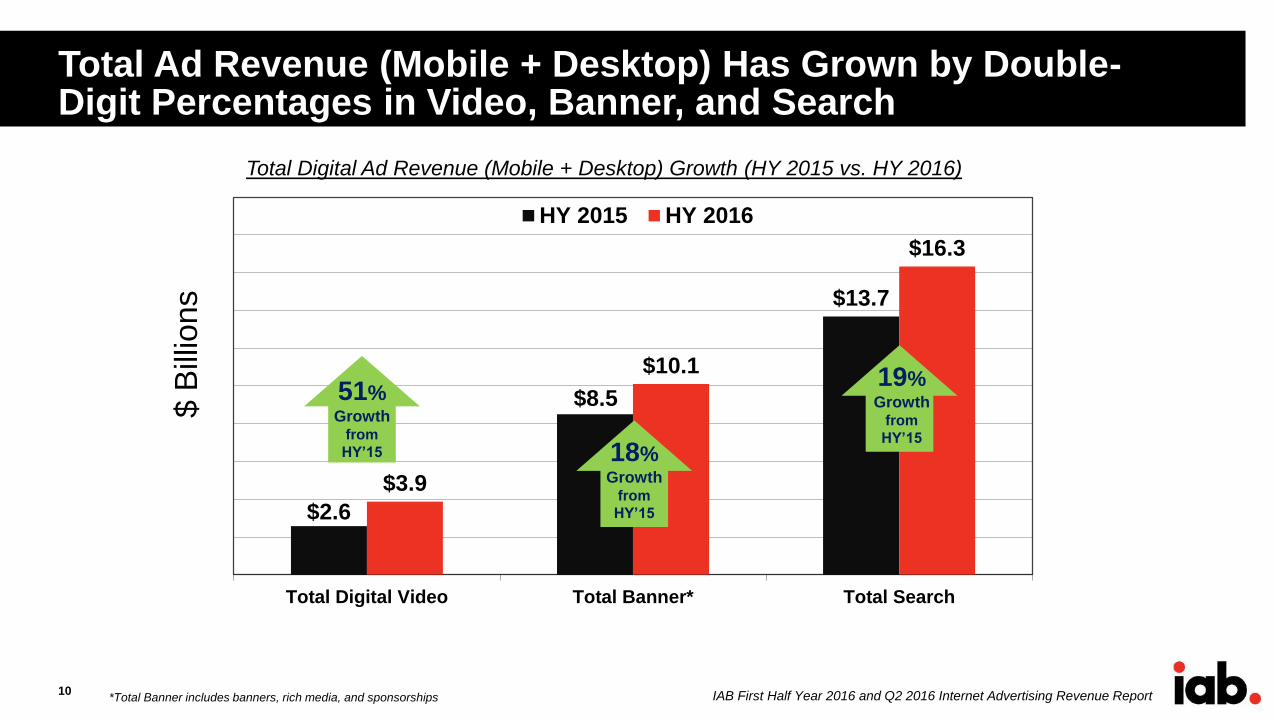
Total digital video ad revenue (mobile + desktop) is up 51% to $3.9 billion
Video now accounts for 12% of internet ad revenue for the first half of 2016, up from 9% in HY 2015
Mobile video has nearly tripled (178%) to $1.6 billion in HY 2016 from $0.6 billion in the previous year
Desktop video is up 13% to $2.3 billion in HY 2016 from $2 billion a year ago
Display:
Total display-related advertising* (mobile + desktop) is up 26% to $13.9 billion and accounts for 43% of all internet ad revenue
Total banner ads, specifically, are up 18% to $10 billion in HY 2016 and account for nearly 1 in 3 (31%) internet ad dollars
Display-related dollars are also shifting to mobile: Mobile display is up 78% to $7.6 billion while desktop display is down 7% to $6.3 billion
Total banner ads show a similar pattern, up 62% to $6 billion in mobile but down 15% to $4 billion in desktop
Search:
Total search revenue (mobile + desktop) is up 19% to $16.3 billion and accounts for half (50%) of all internet ad revenue
Search revenue is shifting to mobile: Mobile search grows 105% to $7.4 billion while desktop search is down 12% to $8.9 billion in HY 2016
*Display-related advertising refers to banners (banners, rich media, and sponsorships) and video.
IAB First Half Year 2016 and Q2 2016 Internet Advertising Revenue Report
Total Ad Revenue (Mobile + Desktop) Has Grown by Double-Digit Percentages in Video, Banner, and Search
10
$ B
illio
ns
$2.6
$8.5
$13.7
$3.9
$10.1
$16.3
Total Digital Video Total Banner* Total Search
HY 2015 HY 2016
Total Digital Ad Revenue (Mobile + Desktop) Growth (HY 2015 vs. HY 2016)
18%Growth
from
HY’15
51%Growth
from
HY’15
19%Growth
from
HY’15
*Total Banner includes banners, rich media, and sponsorships
IAB First Half Year 2016 and Q2 2016 Internet Advertising Revenue Report
Social Media Advertising Revenue, Lifted by Mobile, Has Grown Over 50% in Every Half Year Since 2012
11
$2.9
$4.5
$7.0
$10.9
$?
FY'12 FY '13 FY '14 FY '15 HY '16
1st Half Year 2nd Half Year
$4.4
$6.4
$7.0
$?
US Social Media Ad Revenue ($ Billions)Across Formats and Devices
First Half Year, Full Year and % YoY Growth
11
Growth
1HY: 50%
FY: 53%
$2.6
$2.9
Growth
1HY: 51%
FY: 55% Growth
1HY: 58%
FY: 57%
$4.1
$1.9$1.2
$1.7
Growth
1HY: 57%
FY: ?%
Note: Half Year totals accurately reflect the sum of half year totals as rounded to two decimal places.
IAB First Half Year 2016 and Q2 2016 Internet Advertising Revenue Report
Mobile, At 47% of All Digital Revenue, Changes Formats Distribution
12
31%
12%
50%
8%
Combined Digital Formats* (Mobile + Desktop)
Total Banner
Total Digital Video
Total Search
Total Other
12%
7%
27%
7%
47%
Desktop Formats* (with Mobile Separated)
Desktop Banner
Desktop Video
Desktop Search
Desktop Other
Mobile
First Half 2016 Ad Revenue by Format: New Distribution with Total Digital Revenues
Mobile Display and Search Revenue Impacts Total Format Share
43% ofCombined DigitalRevenue is Display-Related
*Display-related formats include banners (banners, rich media, and sponsorships) and video. Banner includes banner, sponsorship, and rich media advertising. Other includes lead gen, classifieds, and unspecified other.Amounts may not equal 100% due to rounding.
IAB First Half Year 2016 and Q2 2016 Internet Advertising Revenue Report
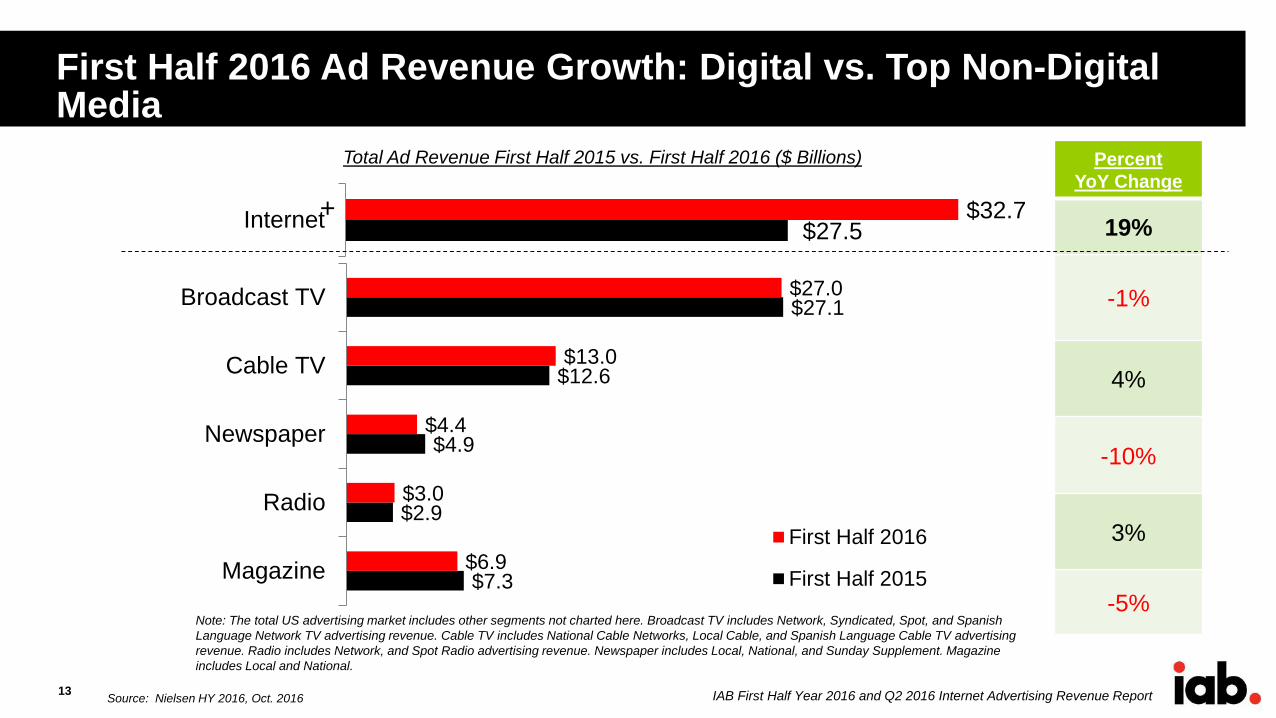
$27.5 $32.7Internet
First Half 2016 Ad Revenue Growth: Digital vs. Top Non-Digital Media
13
Total Ad Revenue First Half 2015 vs. First Half 2016 ($ Billions)
$7.3
$2.9
$4.9
$12.6
$27.1
$6.9
$3.0
$4.4
$13.0
$27.0
Magazine
Radio
Newspaper
Cable TV
Broadcast TV
First Half 2016
First Half 2015
Percent
YoY Change
19%
-1%
4%
-10%
3%
-5%Note: The total US advertising market includes other segments not charted here. Broadcast TV includes Network, Syndicated, Spot, and Spanish
Language Network TV advertising revenue. Cable TV includes National Cable Networks, Local Cable, and Spanish Language Cable TV advertising
revenue. Radio includes Network, and Spot Radio advertising revenue. Newspaper includes Local, National, and Sunday Supplement. Magazine
includes Local and National.
Source: Nielsen HY 2016, Oct. 2016
+
IAB First Half Year 2016 and Q2 2016 Internet Advertising Revenue Report
Q2 2016 Highlights

IAB First Half Year 2016 and Q2 2016 Internet Advertising Revenue Report
Q2 2016 Revenue Compared With Q2 2015
15
$ B
illio
ns
Total Media Ad Revenue
Change
(Q2 2015 vs. Q2 2016)
According to Nielsen,
total media revenues
decreased by -3% from Q2 2015 to Q2 2016
to $29B*
$14.3
$16.9
$0
$2
$4
$6
$8
$10
$12
$14
$16
$18
Q2 2015 Q2 2016
Digital Ad Revenue Growth (Q2 2015 vs. Q2 2016)
18%
*The Nielsen Company, MonitorPlus (Standard Calendar, Total includes B2B, National Internet (Display only),
FSI Coupons), Oct. 2016
IAB First Half Year 2016 and Q2 2016 Internet Advertising Revenue Report
$14.3 $16.9Internet
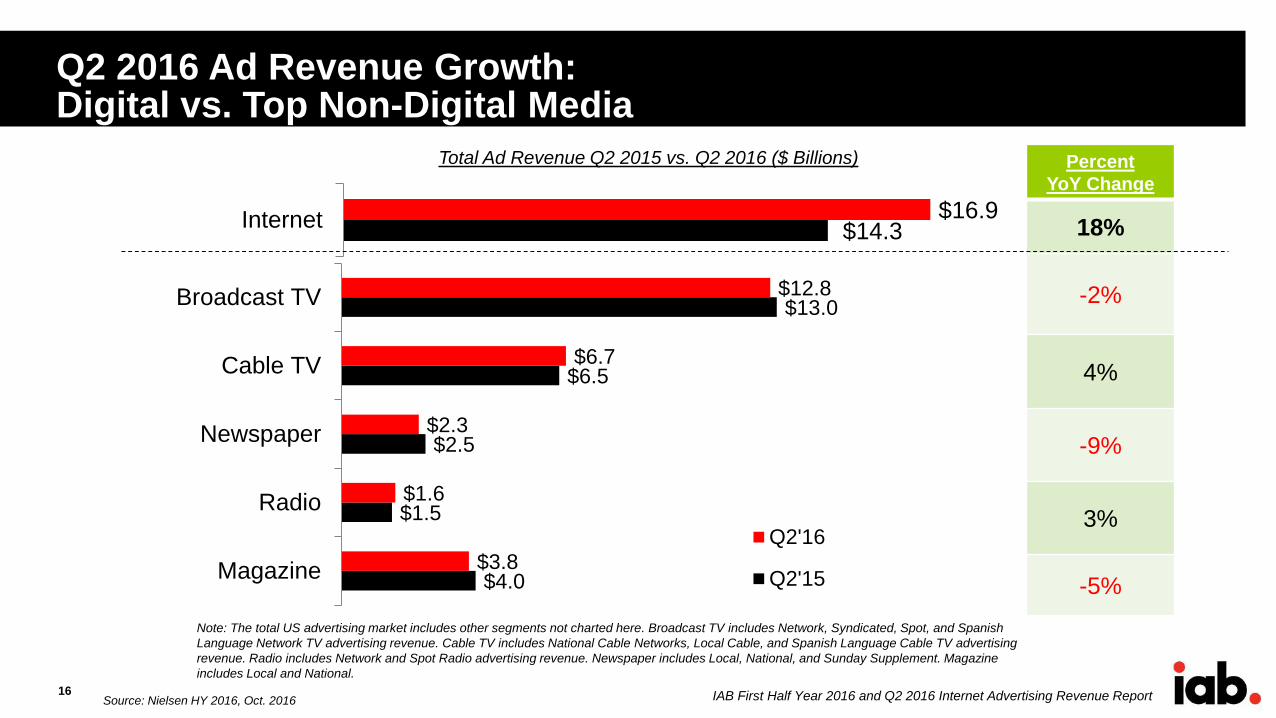
Q2 2016 Ad Revenue Growth: Digital vs. Top Non-Digital Media
16
Total Ad Revenue Q2 2015 vs. Q2 2016 ($ Billions)
$4.0
$1.5
$2.5
$6.5
$13.0
$3.8
$1.6
$2.3
$6.7
$12.8
Magazine
Radio
Newspaper
Cable TV
Broadcast TV
Q2'16
Q2'15
Percent
YoY Change
18%
-2%
4%
-9%
3%
-5%
Note: The total US advertising market includes other segments not charted here. Broadcast TV includes Network, Syndicated, Spot, and Spanish
Language Network TV advertising revenue. Cable TV includes National Cable Networks, Local Cable, and Spanish Language Cable TV advertising
revenue. Radio includes Network and Spot Radio advertising revenue. Newspaper includes Local, National, and Sunday Supplement. Magazine
includes Local and National.
Source: Nielsen HY 2016, Oct. 2016
IAB First Half Year 2016 and Q2 2016 Internet Advertising Revenue Report
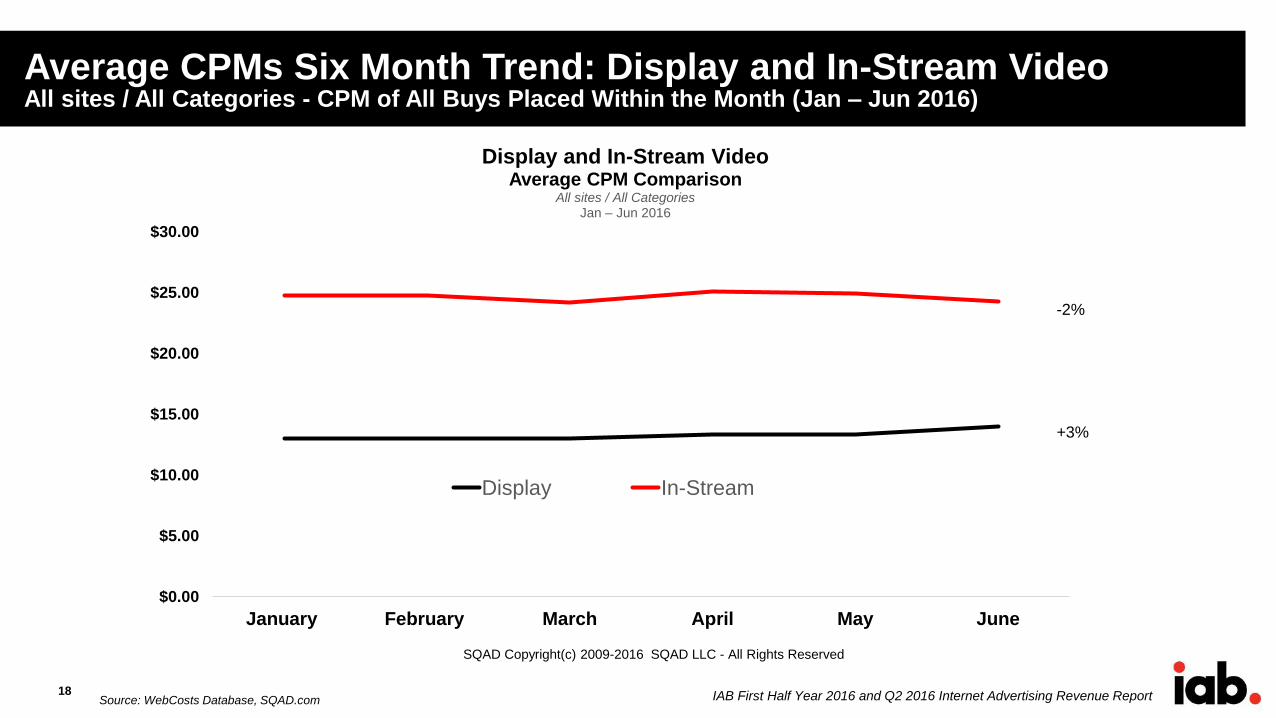
$0.00
$5.00
$10.00
$15.00
$20.00
$25.00
$30.00
January February March April May June
Display and In-Stream Video Average CPM Comparison
All sites / All Categories Jan – Jun 2016
Display In-Stream
+3%
-2%
Average CPMs Six Month Trend: Display and In-Stream VideoAll sites / All Categories - CPM of All Buys Placed Within the Month (Jan – Jun 2016)
Source: WebCosts Database, SQAD.com18
SQAD Copyright(c) 2009-2016 SQAD LLC - All Rights Reserved
IAB First Half Year 2016 and Q2 2016 Internet Advertising Revenue Report
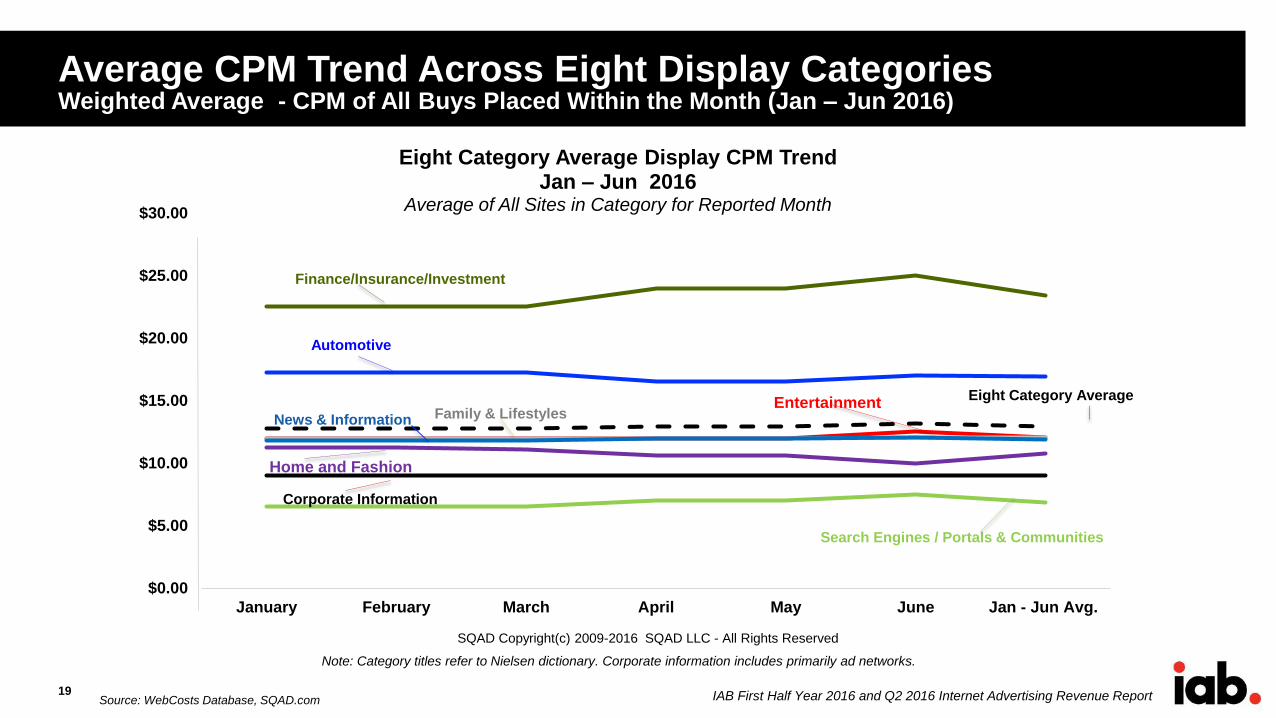
Average CPM Trend Across Eight Display CategoriesWeighted Average - CPM of All Buys Placed Within the Month (Jan – Jun 2016)
$0.00
$5.00
$10.00
$15.00
$20.00
$25.00
$30.00
January February March April May June Jan - Jun Avg.
Eight Category Average Display CPM TrendJan – Jun 2016
Average of All Sites in Category for Reported Month
Finance/Insurance/Investment
Eight Category Average
Family & Lifestyles News & InformationEntertainment
Corporate Information
Search Engines / Portals & Communities
Automotive
Home and Fashion
SQAD Copyright(c) 2009-2016 SQAD LLC - All Rights Reserved
19
Note: Category titles refer to Nielsen dictionary. Corporate information includes primarily ad networks.
Source: WebCosts Database, SQAD.com

IAB First Half Year 2016 and Q2 2016 Internet Advertising Revenue Report
$0.00
$25.00
$50.00
Eight Category Average Display CPM Trend Q1 and Q2 Comparison - 2016
CPM of all Buys Placed Within Quarter Weighted Average
1Q_16 2Q_16
Average Display CPM Quarterly Comparison in Eight Categories CPM of All Buys Placed Within Q1 and Q2 2016
• Seven Out of Eight Categories Showed an Increase From Q1 to Q2 2016
SQAD Copyright(c) 2009-2016 SQAD LLC - All Rights Reserved
20Source: WebCosts Database, SQAD.com
Note: Category titles refer to Nielsen dictionary. Corporate information includes primarily ad networks.
IAB First Half Year 2016 and Q2 2016 Internet Advertising Revenue Report
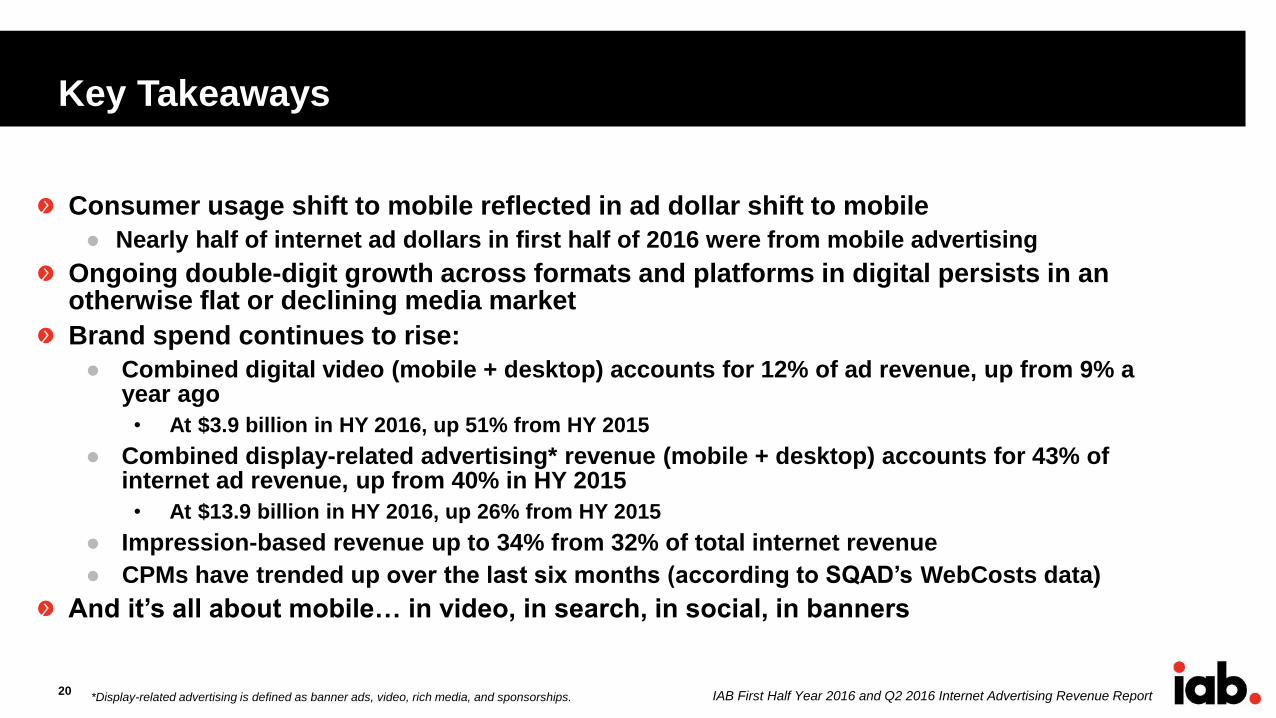
Key Takeaways
20*Display-related advertising is defined as banner ads, video, rich media, and sponsorships.
Consumer usage shift to mobile reflected in ad dollar shift to mobile
● Nearly half of internet ad dollars in first half of 2016 were from mobile advertising
Ongoing double-digit growth across formats and platforms in digital persists in an otherwise flat or declining media market
Brand spend continues to rise:
● Combined digital video (mobile + desktop) accounts for 12% of ad revenue, up from 9% a year ago
• At $3.9 billion in HY 2016, up 51% from HY 2015
● Combined display-related advertising* revenue (mobile + desktop) accounts for 43% of internet ad revenue, up from 40% in HY 2015
• At $13.9 billion in HY 2016, up 26% from HY 2015
● Impression-based revenue up to 34% from 32% of total internet revenue
● CPMs have trended up over the last six months (according to SQAD’s WebCosts data)
And it’s all about mobile… in video, in search, in social, in banners
IAB First Half Year 2016 and Q2 2016 Internet Advertising Revenue Report
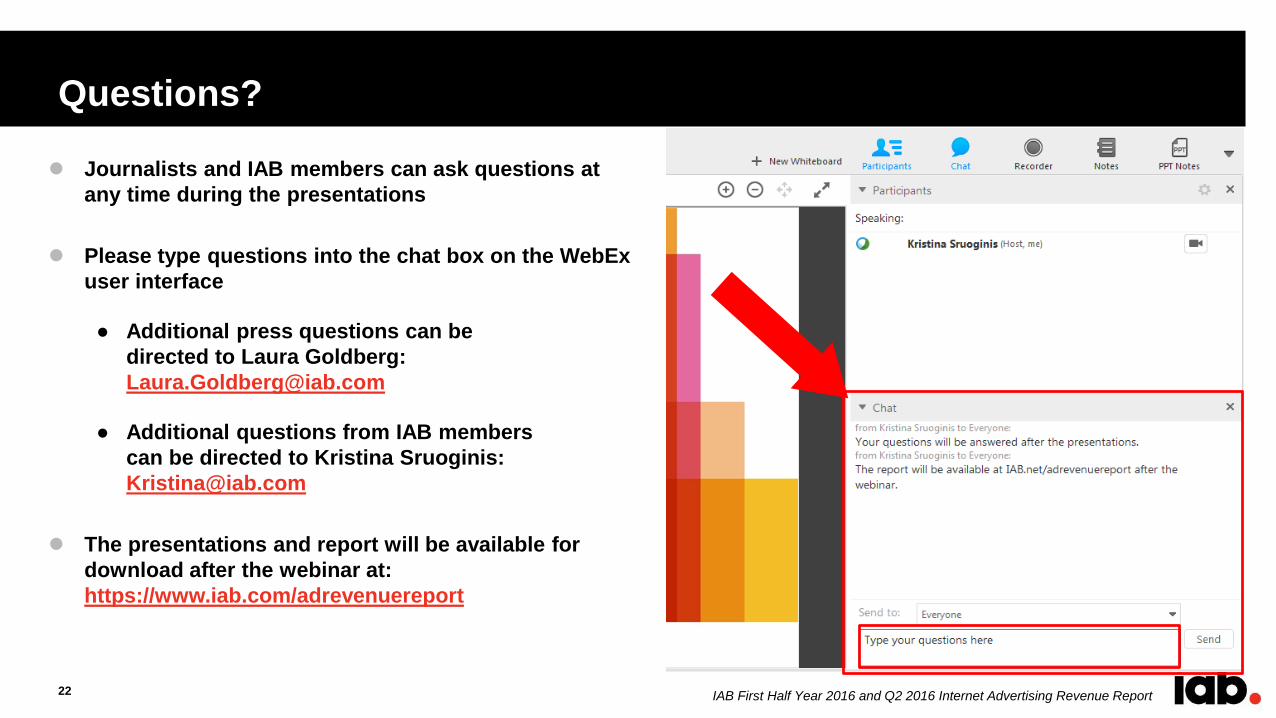
Questions?
Journalists and IAB members can ask questions at
any time during the presentations
Please type questions into the chat box on the WebEx
user interface
● Additional press questions can be
directed to Laura Goldberg:
● Additional questions from IAB members
can be directed to Kristina Sruoginis:
The presentations and report will be available for
download after the webinar at:
https://www.iab.com/adrevenuereport
22
THANK YOU
Reports (from 1996 to present) can be found at: https://www.iab.com/adrevenuereport