pwc m&a 2018 review and 2019 outlook · the tech and fin-tech sectors were active in the year...
TRANSCRIPT
PwC M&A 2018 Review and2019 Outlook
19 February 2019
www.pwc.com

PwC
• The data presented is based on information compiled by Thomson Reuters, ChinaVenture, AVCJ, PE data, and PwC analysis unless stated otherwise
• Thomson Reuters and China Venture record announced deals. Some announced deals will not go on to complete
• The deal volume figures presented in this report refer to the number of deals announced, whether or not a value is disclosed for the deal
• The deal value figures presented in this report refer only to those deals where a value has been disclosed (referred to in this presentation as “disclosed value”)
• “Domestic” means China including Hong Kong and Macau
• “Outbound” relates to mainland China company acquisitions abroad
• “Inbound” relates to overseas company acquisitions of Domestic companies
• “Private Equity deals” or “PE deals” refer to financial buyer deals with deal value over US$10mn and also including direct investments by financial institutions and conglomerates which are of the nature of private equity type investing
Foreword — explanation of data shown in this presentation (1 of 2)
2

PwC
Foreword — explanation of data shown in this presentation (2 of 2)
• “VC deals” refer to financial buyer deals with deal value less than US$10mn and/or with undisclosed value, but invested by private equity and venture capital funds
• “Financial buyer” refers to investors that acquire companies with the objective of realizing a return on their investment by selling the business at a profit at a future date and mainly, but not entirely, comprises PE and VC funds
• “Strategic buyer” refers to investors that acquire companies with the objective of integrating the acquisition in their existing business
• In order to exclude foreign exchange impact, deal values from 2014 to 2017 were adjusted based on 2018 average Rmb/US$ exchange rate
3

PwC
Overview

PwC
2018 China M&A remained flat at $678bn with record PE activity offsetting a 23% decline in outbound M&A
5
* Financial buyer-backed China mainland outbound deals are also included in private equity deals, but they are not double counted in the total deal volume and deal value in the table aboveSource: Thomson Reuters, China Venture and PwC analysis
Total deal volume and value, from 2014 to 2018
*
***
Volume Value Volume Value Volume Value Volume Value Volume Value Strategic buyers (US$bn) (US$bn) (US$bn) (US$bn) (US$bn)
Dom estic 4,1 80 223 .5 4,821 41 8.1 4,87 0 330.0 5,1 1 1 37 6.9 4 ,7 7 8 332.0 (7%) (12%)Foreign 354 22.0 31 6 1 3 .4 27 1 7 .0 255 1 4.4 1 7 8 20.6 -30% 43%
Total Strategic buyers 4,534 245.5 5,137 431.6 5,141 337.0 5,366 391.3 4,956 352.6 (8%) (10%)
Financial buyersPriv ate Equity 593 67 .1 1 ,062 1 7 8.1 1 ,7 67 220.8 1 ,324 1 81 .3 1 ,920 221 .8 45% 22%VC 1 ,334 1 .3 2 ,7 35 4.1 3 ,492 5.8 2 ,338 3 .1 3 ,41 0 7 .2 46% 131%
Total Financial buyers 1,927 68.4 3,797 182.2 5,259 226.7 3,662 184.5 5,330 229.0 46% 24%
China mainland OutboundSOE 7 8 25.6 7 9 23.8 1 1 6 65.9 1 01 28.1 64 21 .1 (37%) (25%)POE 1 45 1 3 .4 207 20.8 609 1 06.9 467 59.9 31 0 51 .1 (34%) (15%)Financial buy ers 49 1 3 .1 94 1 2.8 1 95 37 .7 238 34.4 253 21 .9 6% (36%)
Total China mainland Outbound 272 52.2 380 57.5 920 210.4 806 122.5 627 94.1 (22%) (23%)
HK Outbound 215 20.5 199 24.7 282 23.4 243 12.9 227 24.5 -7% 90%
Total 6,899 373.5 9,419 683.1 11,407 759.8 9,839 676.6 10,887 678.3 11% 0%
% Diff vol.
2018 vs.
2017
% Diff val. 2018
vs. 2017
2015 20162014 2017 2018

PwC
4,180 4,821 4,870 5,111 4,778
593
1,062 1,767 1,324 1,920
272
380
920 806 627
215
199
282 243 227
354
316
271 255 178
0
1,000
2,000
3,000
4,000
5,000
6,000
7,000
8,000
9,000
2014 2015 2016 2017 2018
Deal volume by main category (excludes VC)
Domestic Strategic Buyers Private Equity Deals China Mainland Outbound HK Outbound Foreign Strategic Buyers
Overall deal volumes have held broadly steady for the last three years, increasing by 11% year-on-year but still short of the 2016 peak
6
* 253 financial buyer-backed outbound deals are also recorded in private equity dealsSource: Thomson Reuters, China Venture and PwC analysis
No.
*
*

PwC
223.5
418.1 330.0
376.9 332.0
67.1
178.1
220.8 181.3
221.8
52.2
57.5 210.4
122.5 94.1
20.5
24.7
23.4
12.9 24.5
22.0
13.4
7.0
14.4 20.6
0
100
200
300
400
500
600
700
800
900
2014 2015 2016 2017 2018
Deal value by main category (excludes VC)
Domestic Strategic Buyers Private Equity Deals China Mainland Outbound HK Outbound Foreign Strategic Buyers
Deal values were flat year-on-year and remain 11% off the 2016 peak due almost entirely to China outbound M&A dropping by more than half compared to 2016 records (and by a quarter compared to 2017)
7
US$ billion
* US$21.9bn of financial buyer-backed China mainland outbound deals are also recorded in private equity deals** US$43bn Chem China-Syngenta deal is included in 2016 outbound valueSource: Thomson Reuters, China Venture and PwC analysis
*
*
**

PwC
27
67
34 39 42
9
27
19 19
24 18
19
48 28
20
3
1
2
3 5
0
20
40
60
80
100
120
2014 2015 2016 2017 2018
Number of deals with value > US$ 1 billion
Domestic Strategic Buyers Private Equity Deals China Outbound Foreign Strategic Buyers
The number of mega-deals (> US$1bn) in 2018 also remained flat, with significantly fewer large China outbound transactions (down 60% compared to 2016 and 29% on prior year) offset by a moderate increase in the number of mega-deals from PE and domestic strategic players
8
Source: Thomson Reuters, China Venture and PwC analysis
No.

PwC
Strategic buyers
9

PwC
Source: Thomson Reuters, China Venture and PwC analysis
Domestic strategic deal volume and value decreased by 7% and 12% respectively but have held at broadly comparable levels for 4 years now; inbound (foreign buyer) strategic deal volumes fell by 30% but with 43% higher value (due to several larger sized transactions) albeit the inbound numbers are much smaller
354 316 271 255 178
4,180 4,821 4,870
5,111
4,778
22.0 13.4 7.0 14.4 20.6
223.5
418.1 330.0
376.9 332.0
0
50
100
150
200
250
300
350
400
450
500
0
1,000
2,000
3,000
4,000
5,000
6,000
2014 2015 2016 2017 2018
Strategic buyer deals, from 2014 to 2018
Announced Deal Volume Inbound Announced Deal Volume DomesticAnnounced Deal Value Inbound Announced Deal Value Domestic
No. US$ billion
10

PwC
Sector activity was largely comparable to 2017 with the exception of real estate which fell back to more normal levels after several exceptionally large real estate deals in 2017
27.8 54.5 57.1 58.4 55.2
40.7 39.4 53.0
109.4 53.8 26.4
41.3 43.5
35.0
50.3 32.5
66.8 44.2
44.8
48.2
34.1
49.5 41.9
36.6
40.1
12.7
30.2 19.1
12.5 22.1
16.0
48.7
18.2
22.8 17.6
34.2
72.7
45.6
47.5 49.4
21.2
28.5
14.4
24.2
15.9
0
50
100
150
200
250
300
350
400
450
2014 2015 2016 2017 2018
Strategic buyer deal value by industry sector
Industrials Real Estate Materials Financials Consumer Healthcare Energy and Power High Technology Others
US$ billion
11Source: ThomsonReuters, ChinaVenture and PwC analysis

PwC
PE/VC and financial buyer deals
12

PwC
Fundraising: Access to Renminbi funding was a choke point for the industry in 2018 with many smaller and less established funds withdrawing from the market; but US dollar funding is back in vogue in a sharp reversal compared to 2016
13
Source: AVCJ and PwC analysis
12.7 15.1 9.4
29.8
82.2
21.4 29.3
92.5 51.0
26.3
140 163
103
283 281
0
50
100
150
200
250
300
0.0
20.0
40.0
60.0
80.0
100.0
120.0
2014 2015 2016 2017 2018
PE/VC fund raising for China investment
Non Rmb fund size Rmb fund size Fund volume
No.US$ billion

PwC
PE investment activity hit new records in 2018 at $222bn, marginally ahead of the previous peak in 2016, reflecting high supply of available capital meeting high demand for funding in the private sector and a hot tech and fin-tech sector featuring several mega-deals*
593
1,062
1,767
1,324
1,920
67.1
178.1
220.8
181.3
221.8
0
50
100
150
200
250
0
200
400
600
800
1,000
1,200
1,400
1,600
1,800
2,000
2014 2015 2016 2017 2018
Financial buyer deals**, from 2014 to 2018
Announced Deal Volume Announced Deal Value
No. US$ billion
14
Source: Thomson Reuters, China Venture and PwC analysis** Financial buyer-backed China mainland outbound deals are also included in the above numbers / VC not included* Including the $14bn funding round by Ant Financial, the largest ever private fund-raising globally

PwC
The tech and fin-tech sectors were active in the year and the $14bn funding round by Ant Financial was the highest ever by a private company globally
15
Source: ThomsonReuters, ChinaVenture and PwC analysis
Financial buyer deal value* by industry sector, from 2014 to 2018
* VC not included (comprises a further US$7.2bn of mainly tech-sector investment)
69.8 42.1 45.4
60.4 3.7
23.0
19.8 12.4
36.4
24.0
19.5
31.5 24.9
34.2 8.6
11.1 12.2
31.6
8.8
18.6 41.1 28.5
23.0
5.3
17.2 25.5
18.5
15.2
8.9
15.9
30.4
33.8
13.3
2.4
5.5
19.2
5.6
7.6
0
20
40
60
80
100
120
140
160
180
200
220
240
2014 2015 2016 2017 2018
High Technology Financials Consumer Healthcare Industrials Others Real Estate Media and Entertainment
US$ billion

PwC
The venture capital industry also rebounded strongly with just over 3,400 investments, only just behind the 2016 record (and higher than 2016 - at $7.2bn - in value terms)
16
1,334
2,735
3,492
2,338
3,410
1.3
4.1
5.8
3.1
7.2
0
1
2
3
4
5
6
7
8
0
500
1,000
1,500
2,000
2,500
3,000
3,500
4,000
2014 2015 2016 2017 2018
Venture Capital deals volume, from 2014 to 2018
Announced Deal Volume Value
No.
Source: ThomsonReuters, ChinaVenture and PwC analysis
US$ billion

PwC
Exits: But China’s equity capital markets were challenging leading to a sharp fall in PE-backed IPOs and trade sales were also soft as sellers fretted about expectation gaps on valuations
114 119 165
281
129
81 64
105
114
76
55 25
21
17
11
10
11
6
3
6
0
50
100
150
200
250
300
350
400
450
2014 2015 2016 2017 2018
PE/VC backed deal exit volume by type
IPO Trade sale Open market sale Share buyback Written off
17
No.
Source: AVCJ, China Venture and PwC analysis

PwC
3860
82
132
38
4537
60
122
33
1719
17
14
2713
1
6
11
281 2
0
2
3
0
50
100
150
200
250
300
2014 2015 2016 2017 2018
PE/VC backed exit IPO volume by bourse
Shenzhen Shanghai Hong Kong NYSE/ NASDAQ Others
PE-backed IPOs in China mainland stock markets fell to levels not seen in the past 5 years with long waiting lists and a very low approval rate; many investors preferred to exit in Hong Kong (new listing rules favourable to tech companies) and the US (superior liquidity)
18
No.
Source: Pedata and PwC analysis

PwC
Mainland China outbound
19

PwC
China outbound fell for the 3rd straight year* from the 2016 mega-year, affected by: policy factors ruling out some classes of investment; difficulties around both access to M&A financing and access to foreign currency; greater scrutiny of large cross-border M&A in many jurisdictions; and a generally uncertain environment for overseas deal-making
* Yet it should be noted that China outbound M&A is still considerably larger than it was up to as recently as 2015
272380
920806
62752.2 57.5
210.4
122.5
94.1
0
50
100
150
200
250
0
100
200
300
400
500
600
700
800
900
1,000
2014 2015 2016 2017 2018
Mainland China outbound deals, from 2014 to 2018
Announced Deal Volume Announce Deal Value
No. US$ billion
20
US$43 bn Chem China-Syngenta deal is included in 2016 outbound value Source: Thomson Reuters, China Venture and PwC analysis
**

PwC
SOEs did fewer overseas deals and spent less money doing them than at any time since2014 focusing instead on internal restructuring and the domestic market; for the 3rd
year running, POEs outspent their state-owned counterparts (by a factor of nearly2.5x) although they too were less active than in prior years; but financial buyers nowaccount for 40% of outbound deal volumes, hitting a new record by number in 2018,reflecting their ability to provide capital on deals
21
78 80 116 101 64
145205
609
467
31049
95
195
238
253
-10
10
30
50
70
90
110
130
150
0
100
200
300
400
500
600
700
800
900
1000
2014 2015 2016 2017 2018
SOE Announced Deal Volume POE Announced Deal Volume Financial buyers VolumeSOE Announced Deal Value POE Announced Deal Value Financial buyer Deal Value
No.US$ billionChina mainland outbound deals, from 2014 to 2018
Source: Thomson Reuters, China Venture and PwC analysis

PwC
Technology and consumer related deals continue to attract the lion’s share of activity in line with government policy to encourage the introduction of foreign technologies, brands and consumer goods into the China market
22
3 8 5 11 13 7 15 2
59 5934
49 43
2134
11
102
38
50 195
262
115 14 4
26 27 12 13
-
81 69
47
95
50 59
35 31
90
40
19
37
6 23
11
12
0
20
40
60
80
100
120
140
160
180
200
High Technology Consumer Healthcare Industrials Others Financials Materials Media andEntertainment
2018 SOE 2018 POE 2018 Financial buyers 2017 SOE 2017 POE 2017 Financial buyers
China mainland outbound deals by industry sector – volume, 2018 vs. 2017
No.
Source: Thomson Reuters, China Venture and PwC analysis

PwC
85 95 217 221 200 81 110
300 254
158
64 107
219 208
178
17
29
69 49
43
11
17
46
25
24
7
9
13
16
7
5
7
22
22
2
6
34
11
0
100
200
300
400
500
600
700
800
900
1,000
2014 2015 2016 2017 2018
中国内地企业海外并购交易数量按投资目标地区分类
United States Europe Asia Oceania Other North America Africa South America Russia
No.
The search for technology and brands means that developed markets in the US and Europe - as well as some parts of Asia - are still the biggest destination for Chinese buyers in terms of deal volumes
23Source: ThomsonReuters, China Venture and PwC analysis
Outbound M&A deal volume by region of destination 2014-2018

PwC
13.9 23.6
95.2
41.2 50.9 15.5 14.4
16.7
36.5 15.2
11.5 11.9
66.4
18.5 13.2
3.7 2.2
15.0
3.8 5.3
0.4 0.7
4.8
2.0 1.3
5.3 3.7
9.8
7.4
0.1 -
2.4
11.3
0
50
100
150
200
250
2014 2015 2016 2017 2018
中国内地企业海外并购交易数量按投资目标地区分类
Europe Asia United States Oceania Other North America Africa South America Russia
US$ billion
Europe continues to attract the highest dollar amounts, while Chinese buyers’ deal value in the US decreased for the second year running
24
Outbound M&A deal value by region of destination 2014-2018
*US$43 bn ChemChina-Syngenta deal is included in 2016 outbound value Source: Thomson Reuters, China Venture and PwC analysis
*

PwC
In fact, the decline in investment in the United States accounts for a large portion of the overall decline in China's overseas mergers and acquisitions since the 2016 peak*
* Especialy if we strip out the very large one-off $43bn Syngenta deal which accounts for most of the European decline from peak
25Source: ThomsonReuters and PwC analysis
US$ billion
0
50
100
150
200
250
2014 2015 2016 2017 2018
Europe Asia US Oceania ROW Total
Outbound M&A deal value by destination 2014-2018
PwC
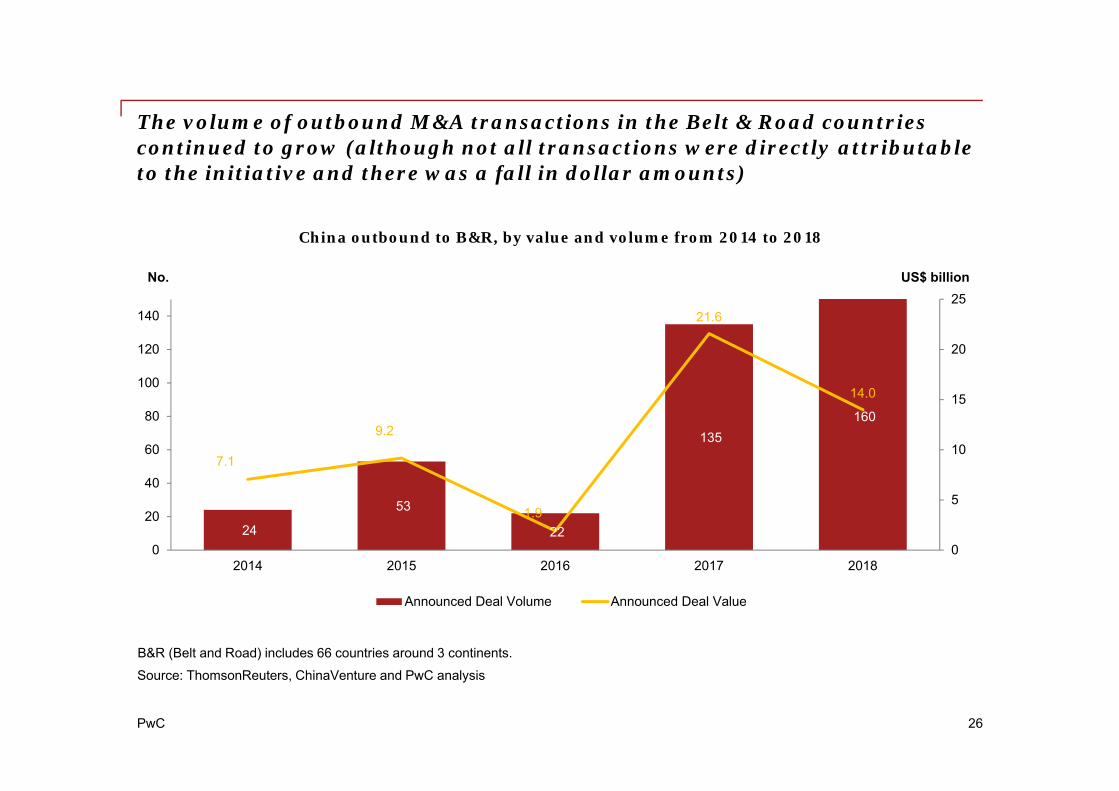
The volume of outbound M&A transactions in the Belt & Road countries continued to grow (although not all transactions were directly attributable to the initiative and there was a fall in dollar amounts)
24
53
22
135 160
7.1
9.2
1.9
21.6
14.0
0
5
10
15
20
25
0
20
40
60
80
100
120
140
2014 2015 2016 2017 2018
China outbound to B&R, by value and volume from 2014 to 2018
Announced Deal Volume Announced Deal Value
No. US$ billion
26
Source: ThomsonReuters, ChinaVenture and PwC analysisB&R (Belt and Road) includes 66 countries around 3 continents.

PwC
Key messages
27

PwC
Key messages — China M&A in 2018 (1 of 4)
• 2018 China M&A remained flat at $678bn with record PE activity offsetting a 23% decline in outbound M&A
• Overall deal volumes have held broadly steady for the last three years, increasing by 11% year-on-year but still short of the 2016 peak
• Deal values were flat year-on-year and remain 11% off the 2016 peak due almost entirely to China outbound M&A dropping by more than half compared to 2016 records (and by a quarter compared to 2017)
• The number of mega-deals (> US$1bn) in 2018 also remained flat, with significantly fewer large China outbound transactions (down 60% compared to 2016 and 29% on prior year) offset by a moderate increase in the number of mega-deals from PE and domestic strategic players
28
Overall Domestic and Foreign-Inbound Strategic
• Domestic strategic deal volume and value decreased by 7% and 12% respectively but have held at broadly comparable levels for 4 years now; inbound (foreign buyer) strategic deal volumes fell by 30% but with 43% higher value (due to several larger sized transactions) albeit the inbound numbers are much smaller
• Sector activity was largely comparable to 2017 with the exception of real estate which fell back to more normal levels after several exceptionally large real estate deals in 2017

PwC
Key messages — China M&A in 2018 (2 of 4)
29
PE/VC and financial buyer deals
• Fundraising: Access to Renminbi funding was a choke point for the industry in 2018 with many smaller and less established funds withdrawing from the market; but US dollar funding is back in vogue in a sharp reversal compared to 2016
• PE investment activity hit new records in 2018 at $222bn, marginally ahead of the previous peak in 2016, reflecting high supply of available capital meeting high demand for funding in the private sector and a hot tech and fin-tech sector featuring several mega-deals
• The tech and fin-tech sectors were active in the year and the $14bn funding round by Ant Financial was the highest ever by a private company globally
• The venture capital industry also rebounded strongly with just over 3,400 investments, only just behind the 2016 record (and higher than 2016 - at $7.2bn - in value terms)
• Exits: But China’s equity capital markets were challenging leading to a sharp fall in PE-backed IPOs and trade sales were also soft as sellers fretted about expectation gaps on valuations
• PE-backed IPOs in China mainland stock markets fell to levels not seen in the past 5 years with long waiting lists and a very low approval rate; many investors preferred to exit in Hong Kong (new listing rules favourable to tech companies) and the US (superior liquidity)

PwC
Key messages – China M&A in 2018 (3 of 4)
30
Mainland China Outbound
• China outbound fell for the 3rd straight year from the 2016 mega-year, affected by: policy factors ruling out some classes of investment; difficulties around both access to M&A financing and access to foreign currency; greater scrutiny of large cross-border M&A in many jurisdictions; and a generally uncertain environment for overseas deal-making
• SOEs did fewer overseas deals and spent less money doing them than at any time since 2014 focusing instead on internal restructuring and the domestic market; for the 3rd year running, POEs outspent their state-owned counterparts (by a factor of nearly 2.5x) although they too were less active than in prior years; but financial buyers now account for 40% of outbound deal volumes, hitting a new record by number in 2018, reflecting their ability to provide capital on deals
• Technology and consumer related deals continue to attract the lion’s share of activity in line with government policy to encourage the introduction of foreign technologies, brands and consumer goods into the China market
• The search for technology and brands means that developed markets in the US and Europe - as well as some parts of Asia - are still the biggest destination for Chinese buyers in terms of deal volumes
• Europe continues to attract the highest dollar amounts with China buyers steering clear of large sized transactions in the US for the second year running
PwC
Key messages – China M&A in 2018 (4 of 4)
31
Mainland China Outbound (Continued)
• In fact, the decline in investment in the United States accounts for a large portion of the overall decline in China's overseas mergers and acquisitions since the 2016 peak
• The volume of outbound M&A transactions in the Belt & Road countries continued to grow (although not all transactions were directly attributable to the initiative and there was a fall in dollar amounts)

PwC
Outlook
32

PwC
Outlook for 2019 (1 of 3)
Overall
• Softer in first half due to:
- Continued slowing of outbound (see next page)
- A number of uncertainties causing a wait-and-see effect
• Some rebound in the second half as uncertainties clear with a comparable year to 2018 for the year as a whole –albeit with activity loaded into the last 6-8 months
Domestic Strategic
• Broadly steady at existing high levels over the full year, but may be relatively slower in the first half pending outcomes from the Second Session of the Thirteenth National People’s Congress in March and more clarity on the impact of the ongoing US trade negotiations
• China’s government likely to continue to focus more on domestic economy to deal with various challenges
• Some increase in debt restructuring situations, due to:
- De-leveraging
- Ongoing SOE reform
- Maturing of banking sector / unwinding of shadow banking
- State sponsored debt-for-equity swaps.
33

PwC
Outlook for 2019 (2 of 3)
Foreign inbound
• May be some uptick due to:
- More openness in response to US trade negotiations
- Opening up in some specific sectors such as automotive, FS and technology
China outbound
• Some decline in first half due to:
- Impact of ongoing US trade war (although incremental effect limited, as deal values to US at low levels for last 2 years already)
- Increased scrutiny of larger / sensitive / high profile deals in other jurisdictions, too – including Europe –especially around technology or other assets now regarded as strategic in nature
- Uncertainties around the impact of Brexit on both the UK and the rest of Europe
- Ongoing tight access to M&A financing and foreign currency
- Pending outcomes from Second Session of the Thirteenth National People’s Congress in March
• If there are favourable developments on these factors, we do anticipate some rebound in the second half as the fundamental drivers of Chinese outbound M&A remain in play
• But we think that political scrutiny of large cross-border M&A will persist as nations protect strategic assets and this will reduce the number of mega-deals
• Overall we see only a moderate increase in China outbound over the full year
34

PwC
Outlook for 2019 (3 of 3)
Private equity (and other financial investors)
• Steady – continuing at or slightly below existing record high levels, due to:
- Historically high amounts of capital to be defrayed
- US dollar funds in particular are very cashed up and will be active – but non-core Renminbi funds less so
- Continued involvement in outbound activity, including as a source of US$ financing partnering with strategic buyers.
- But some pause at the start of the year, partly driven by valuation expectations, which may result in a slightly lower total for the year as a whole
35

PwC
Data compilation methodology and disclaimer
Statistics contained in this presentation and the press release may vary from those contained in previous press releases. There are three reasons for this: ThomsonReuters and ChinaVenture historical data is constantly updated as deals are confirmed or disclosed; PricewaterhouseCoopers has excluded certain transactions which are more in the nature of internal reorganisations than transfers of control; and exchange rate data has been adjusted.
• Acquisitions of private/public companies resulting in change of control
• Investments in private/public companies (involving at least 5% ownership)
• Mergers• Buyouts/buyins (LBOs, MBOs, MBIs)• Privatisations• Tender offers• Spinoffs• Splitoff of a wholly-owned subsidiary when 100%
sold via IPO• Divestment of company, division or trading assets resulting in
change of control at parent level• Reverse takeovers• Re-capitalisation• Joint Venture buyouts• Joint Ventures• Receivership or bankruptcy sales/auctions• Tracking stock
Included Deals Excluded Deals
36
• Property/real estate for individual properties• Rumoured transactions• Options granted to acquire an additional stake when not 100% of
the shares has been acquired • Any purchase of brand rights• Land acquisitions• Equity placements in funds• Stake purchases by mutual funds• Open market share buyback/retirement of stock unless part of a
privatisation• Balance sheet restructuring or internal restructuring• Investments in greenfield operations

Thank you!
This publication has been prepared for general guidance on matters of interest only, and does not constitute professional advice. You should not act upon the information contained in this publication without obtaining specific professional advice. No representation or warranty (express or implied) is given as to the accuracy or completeness of the information contained in this publication, and, to the extent permitted by law, [insert legal name of the PwC firm], its members, employees and agents do not accept or assume any liability, responsibility or duty of care for any consequences of you or anyone else acting, or refraining to act, in reliance on the information contained in this publication or for any decision based on it.
© 2019 PricewaterhouseCoopers. All rights reserved. In this document, “PwC” refers to PricewaterhouseCoopers which is a member firm of PricewaterhouseCoopers International Limited, each member firm of which is a separate legal entity.