pv installation for grid-connected distribution system in
TRANSCRIPT

International Journal of Smart Grid and Clean Energy
PV installation for grid-connected distribution system in
Savannakhet Province, Lao People's Democratic Republic
Thavy Khamchaleuna, Chayada Surawanitkun
b, Arkom Kaewrawang
c
aFaculty of Engineering, Khon Kean University, 123 Mittrapharp Road, Khon Kaen 40002, Thailand bFaculty of Applied Science and Engineering, Khon Kaen University, Nong Khai Campus 43000, Thailand
cDepartment of Electrical Engineering, Faculty of Engineering, Khon Kean University 123 Mittrapharp Road, Khon Kaen 40002,
Thailand
Abstract
Currently, renewable energy is used to connect the grid power system because it is the clean energy and
environmental friendly. It is getting worldwide attention such as solar photovoltaic (PV) and is used to generate
electricity by stand-alone and grid-connected. The size and the position of the PV are important for installation.
Therefore, the aim of this paper is the focus for analysis of PV installation in three positions with the grid-connected
distribution system. The PV installation was established by varying capacity of PV considered 100% of the load at
9.46 MW. The DIgSILENT Power-Factory software version 15 was used for system simulation. The voltage in each
bus of all cases increases for this analysis. The reactive power flow decreases and reverses to the external grid from
9.46 to -0.27 MW. The current in the 3rd bus to the external grid is reduced from 0.26 to 0.02 kA. The active power
losses and reactive power losses are lowest in case of 25-25-50% and 0:50:50%, respectively. This research is the
guideline to install the PV for grid-connected with medium voltage system in Lao People's Democratic Republic (Lao
PDR) for planning the future policy.
Keywords: PV generation, distributed generation, power loss, voltage profile
1. Introduction
In the worldwide, the installed capacity of renewable energy is 2,179,426 MW included the capacity of
PV installation – accounted for about 17.9% in 2017 [1]. The manufacturing cost of the PV modules has
decreased intensely which it is over $100 US/W in the 1970s and reduced to under $1.00 US/W in 2014
[2]. Actually, the price of large-scale PV modules is below $0.60 US/W [2]. Hence, the PV technology
has been developed rapidly in the last decade which effected grown-up to 389.57 GW and it increased to
42 times when compared with 2007 at 9.26 GW [1].
The most of electricity generation in Lao People's Democratic Republic (Lao PDR) is produced from
hydropower plants because the location depends on the topography in the country. Mostly, the field of
hydropower plant was installed in the northern and southern of the country. However, those energy
resources have been installed far from the load which the electrical energy is generated at 11 to 25 kV
after that stepped up to 115 kV by the power transformer. It is transferred to the 115/22 kV substation by
the long distance that served to domestic, industrial and commercial customers through the distribution
transformers. Generally, the power flow in the electricity system of Lao PDR is in one direction from
large scale power plants to the end user along the radial feeder. In addition, the 22 kV power network is
the type of fishbone. Therefore, the technique losses generated in the transmission line that depends on
the length and line impedances of the cable. Furthermore, the voltage drops on the finale feeder. The PV
plants popular is used to connect with the low and medium voltage distribution network without energy
* Manuscript received June 21, 2019; revised May 10, 2020.
Corresponding author. Tel.: +66(0)43009700 ; E-mail address: [email protected].
doi: 10.12720/sgce.9.4.737-745

storage [2]. The advantages of the PV to allow interconnection are maximum benefits because of nearly at
the load in the power system, reducing costs of construction and extension of the distribution and
transmission lines. Moreover, the appropriate size and location can reduce power losses [3-6]. There are
many researchers examined the effects of the high PV penetration level on the medium distribution
system, as proposed in the literature [3, 7-10]. The comparison by varying the capacities ratio of PV
generators and dissimilar locations for connection to utility grid system is analyzed in literature [5] when
the PV is installed in the different buses. It may have to be the positive and negative impacts to the
distribution system such as voltage deviations, surplus power flow reversible, energy losses variation, etc
[11-12].
The 22 kV of the electric power system in Lao PDR is the long distance. Consequently, there are the
power substation and the load demand distribute in the rural area. Savannakhet Province locates in the
central part II and the biggest area in Lao PDR. According the annual report of loss reduction and DSM
department-technical of EDL reported the average power losses in Savannakhet Province for distribution
system (22 kV); in 2018, the power loss is 13.78% (54,602,492 kWh) because the power system has a
long length for 22 kV network about 4,173 km over the province. This is the main problem occurred the
power loss and the voltage drop in the power system. Therefore, this paper presents the electrical effects
on voltage, the active power flow, reactive power flow, current, active power loss and reactive power loss
at difference of PV capacity and location for penetration grid connected to the medium power system.
Three different locations for PV installation in Savannakhet province are considered for varying the
capacity. The DIgSILENT PowerFactory software version 15.1 was used for simulation to analyze the
power system.
2. Model and Simulation
2.1. Savanakhet power system
Savannakhet province is the location in the Central II part of Lao PDR. The electric power grid utility
is operated by Electricity DU Laos (EDL) which is the state enterprise company under the Ministry of
Energy and Mines. There are five substations in Province’s area such as Pakbo, Kengkok, Nongdeun,
BanMet (Seno) and MeuangPhin substation. The research methodology selected the actual data from the
existing of Savannakhet Province-the 115/22 kV power distribution network of Nongdeun substation was
taken into the model. The traditional grid utility consists of 50 MVA transformer step down of 115/22 kV
and it has 7 main feeders. The 2nd feeder was chosen in the model simulation because this feeder is the
Table 1. The peak load annual report of the 2nd feeder at Nongdeun substation in 2017
Peak load
Month Current (A) Active power (MW) Reactive power (MVar) Power factor Voltage (kV)
January 212 7.5 2.98 0.93 23.0 February 167 6.86 2.62 0.92 23.0
March 256 9.13 3.3 0.94 22.0
April 177 6.26 2.53 0.93 23.0 May 241 8.33 3.26 0.93 22.9
June 179 6.31 2.58 0.92 22.5
July 299 8.39 2.56 0.96 23.0 August 177 6.34 2.35 0.94 22.0
September 183 6.62 2.42 0.94 22.8
October 165 5.88 2.38 0.93 22.9 November 215 7.53 3.55 0.9 23.0
December
738 International Journal of Smart Grid and Clean Energy, vol. 9 , no. 4, July 2020
highest peak on the substation as presented in Table 1. The power system contains the 202 buses, which
are 202 loads, and the 155 kV is the first bus and the 22 kV start from the 2nd to 202nd bus. The power
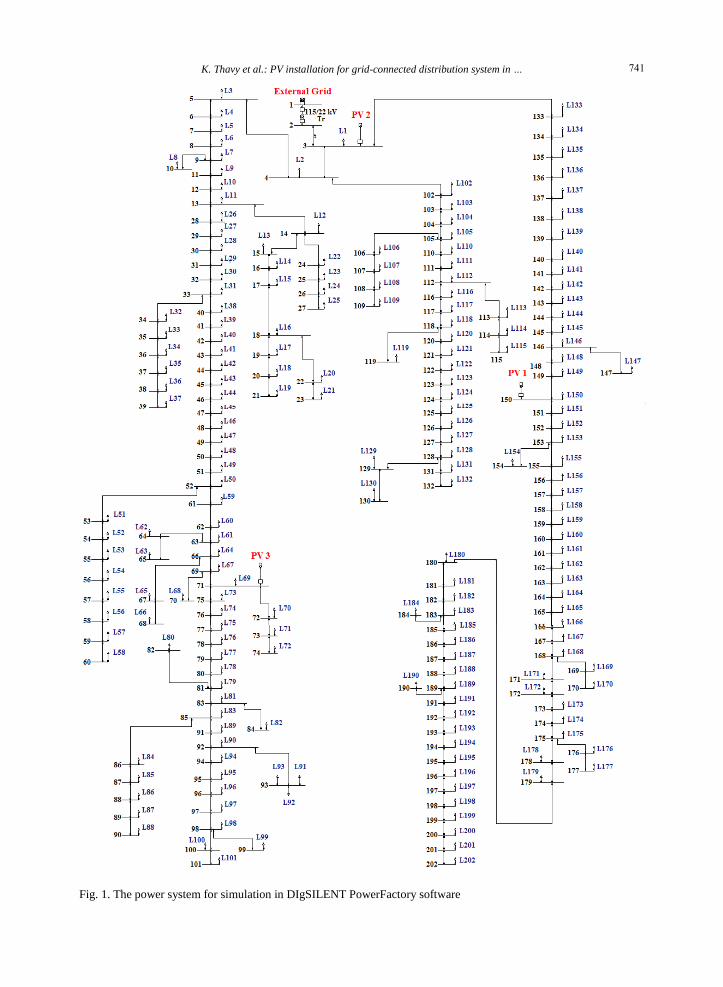
factor at 0.94 is taken into account form model and simulation as shown in Fig. 1 and the capacity of the
load presented in Table 2.

K. Thavy et al.: PV installation for grid-connected distribution system in …
2.2. System modeling
The existing power grid of urban area in for model simulation was selected. The original case is
without the PV. The total load demand is defined by the installed capacity of the transformer. In addition,
the steady-state ratio of the capacity of the transformer by the load scale of the 0.285 for active power and
the 0.1 for the reactive power are taken into calculated the load factor (LF). The size of the transformers
or the loads are divided in the twelve fragments presented in table 2 and the detail of the position of the
load is discussed from Ref. [13]. The work specific fixed capacity at 100% of PV installation of the peak
load at 9.13 MW in the 2nd feeder of Nongdern power substation. The capacity of the 1st location under
25% is designed three locations: the first at 16°29'21.03" N-104°47'49.39"E, the second at 16°32'7.68" N-
104°46'24.52"E and finally at 16°35'36.47" N-104°48'9.76"E were selected. The location of PV 1, 2 and 3
was installed at the 150th, 3rd, and 71st, respectively. The power system was modeled in DIgSILENT
PowerFactory software version 15.1 as shown in Fig. 1.
The Aluminum Conductor Steel Reinforced (ACSR) and Space Aerial Cable (SAC) were used in the
power system for transport to serve the energy. The size of 240 mm2 used with the main feeder-the total
line length is about 17 km. It transfers the electricity from the 2nd
to 3rd
bus and sub-feeder 1 and 2 about
8 km. In addition, the size of 150, 50 and 35 mm2 were utilized with distributing and branch cables which
are the total them length about 32, 28 and 4 km, respectively. The Impedances and line charging reported
in Table 3.
Table 2. The loads in the system
Size of transformer Amount (unit) Load scale
Active power (MW) Reactive power (MVar)
30 31 0.009 0.003
50 61 0.014 0.005
100 36 0.028 0.010
160 31 0.046 0.016
250 25 0.071 0.026
315 6 0.090 0.032
400 5 0.114 0.041
500 1 0.142 0.051
630 1 0.179 0.065
1000 1 0.285 0.103
1250 1 0.356 0.129
2000 3 0.570 0.206
Table. 3. Impedances and line charging of the cable [14]
Size (mm2) Z1 (Ω/km) Z0 (Ω/km) B0
(S/km)
B1
(S/km)
Current
Rating (A) R1 (/km) X1 (/km) R0 (/km) X0 (/km)
ACSR 25 1.138 0.4818 1.3158 1.9333 1.49 3.45 145
ACSR 35 1.11 0.4129 1.2582 1.6397 1.26 2.97 126
ACSR 50 0.556 0.3912 0.7042 1.6180 1.29 3.15 190
ACSR 150 0.1830 0.3281 0.3312 1.5550 1.34 3.47 335
ACSR 240 0.1343 0.3179 0.2825 1.5448 1.36 3.60 560
SAC 240 0.125 0.327 0.2732 1.5538 1.34 3.48 525
2.3. Analysis of the Power Flow
Load flow analysis in power system is important to evaluate power flow problems and planning. The
relation of node current and voltage in the power system on the linear network can be presented by
Newton-Raphson equation [15]
VYI bus (1)
739
or
N
j
jiji VYI1
(i = 1, 2, 3,…, n) (2)
where Ii is the injected current for bus i and Vj is the voltage for bus j. The Yij is the element of the
admittance and n is the total number of nodes in the power system.
The solution of load flow problem by used the equation, should be used the relation between the node
power and the current, which can be calculated by
i
ii
V
jQPI
ˆ
(i = 1, 2, 3,…, n) (3)
where Pi is the active power and Qi is the reactive power at node i, in case node i is a load node in the
system. Therefore, Pi and Qi are take the negative values and iV̂ is the conjugate of the voltage vector at
node i in the network. The injected current can be summarized as eq. (4).
N
j
jij
i
ii VYV
jQP
1ˆ
(i = 1, 2, 3,…, n) (4)
))(sin(cos1
ikikikikk
n
k
ii jBGjVVS
(i = 1, 2, 3,…, n) (5)
where Si is the apparent power and ik is the phase angle between bus i and bus
)sincos(1
ikikikikk
n
k
ii BGVVP
(6)
)cossin(1
ikikikikk
n
k
ii BGVVQ
(7)
where iP is the active power and
iQ is the reactive power at node i, the iV̂ and
kV̂ is the conjugate of the
voltage vector at node i and k in the network, respectively. The ikG and
ikG are called conductance and
susceptance, respectively.
For analysis of the power losses in distribution systems, there are two major sources that are in the
power lines and transformers.
RIPLoss
2 (8)
XIQLoss
2 (9)
where R, I and X are resistance, current and reactance of the conductor, respectively.
740 International Journal of Smart Grid and Clean Energy, vol. 9 , no. 4, July 2020
K. Thavy et al.: PV installation for grid-connected distribution system in …
Fig. 1. The power system for simulation in DIgSILENT PowerFactory software
741

3. Results and Discussions
3.1. Power flow feed in external grid
The power flow in the original case (without PV) is one-way flow from the external grid to the load
such as the active power and reactive power are 9.46 MW and 4.22 MVar, respectively. Then, the PV was
connected in the power system. The results show that the power flow reverses to external grid at the rang
from -0.03 to -0.27 MW for active power because the it generates from the PV source to supply the load
effected reduce power loss. In addition, the reactive power reduces from 4.22 to 3.39 MVar as
demonstrated in the Table 4.
Table 4 Total power losses for variable cases of the PV installation
Location of installed PV study cases
External Infeed
Active power (MW) Reactive power (MVar)
Without PV 0% 9.46 4.22
1 100:0:0% -0.03 3.92
2 0:100:0% -0.21 3.51
3 0:0:100% -0.22 3.48
1-2-3 25:25:50% -0.27 3.39 1-2-3 0:50:50% -0.27 3.4
1-2-3 0:25:75% -0.26 3.41 1-2-3 25:0:75% -0.26 3.41
1-2-3 0:75:25% -0.25 3.43
1-2-3 25:50:25% -0.25 3.42
1-2-3 25:75:0% -0.21 3.5
3.2. The voltage magnitude the difference location and capacity of
Fig. 2 shows the voltage in original case (0%), the analysis results found the voltage lowest on the
101st bus at 0.976 p.u. because of the end of feeder I and heavy load. It increases on the 102nd bus at
0.995 p.u. because this bus direct connects with the 4th bus. In addition, on the 133rd bus the voltage
value rises to 0.997 p.u. because it links with the 3rd bus and it is the first bus on the sub-feeder II. In the
final bus of the 2nd sub-feeder the voltage drops to 0.982 p.u. After that, the PV was installed on the 3rd,
71st and 150th bus accordingly the PV variation by different percentage at 100% of the peak load at 9.31
MW. The effect occurred in the power system. The voltage level at all the buses over the 1 p.u. but under
the 1.05 p.u. However, it is still in standards range of rated voltage for normal operating and emergency
conditions is defined the voltage deviation, the rang of ±5% and ±10% of the voltage deviation [16-17].
3.3. The active and reactive power losses
The power loss in the original case found the both active and reactive power losses at 0.32 MW and
0.9 MW, respectively. It occurred from a lot of factors such as the power line in this feeder was used
ACSR 150 (high resistance), long distant, PV generated over the load, joule heat in the line. Next, The PV
was installed by different ratio and according the location. The lowest power loss is found in the case
integrated PV from three sites for PV installation as well as the ratio is 25:25:50 of location 1, 2 and 3,
respectively, due to the PV generation sources distributed near the load. Thus, the power transmission is
short length. In addition, once case the same value for active power reactive power is 50:50% of location
2 and 3, respectively, as shown in Fig. 3.
742 International Journal of Smart Grid and Clean Energy, vol. 9 , no. 4, July 2020

K. Thavy et al.: PV installation for grid-connected distribution system in …
Fig. 2. The voltage magnitude variation in each bus when the PV connected to the grid
Fig. 3 The Active and reactive power losses at different percentages of the PV installation in the three
location
743

3.4. The current
The current from 3rd
bus to 202nd
bus is the constant value but it deviations the flow direction because
it generates from the PV to deliver the load. On the other hand, it decreases from the 3rd
bus to external
grid such as 0.26 to 0.02 kA. This leads to overcurrent in the system that some part of current movement
outside of the area.
4. Conclusions
This paper presents the effects of size PV installation with utility grid connected on PV power
distribution system in Savannakhet Province. The PV was installed in three locations that varied the
capacity size of the PV at 100% in 2nd
feeder in Nongdern power substation. The 11 cases of varying ratio
of the PV size are without PV, 100:0:0, 0:100:0, 0:0:100, 25:25:50, 0:50:50, 0:25:75, 25:0:75, 0:75:25, 25:50:25 and 25:75:0%. The results show the voltage in all case when the PV was installed in the power
system. The active power loss and reactive power loss are minimum in both case at 25:25:50 and 0:50:50.
In addition, the current decreases in the 3rd
bus to external grid. Moreover, the active power revers to the
external grid. The results in this study are useful to apply the renewable energy in the power system with
PV installation.
Conflict of Interest
The authors declare no conflict of interest.
Acknowledgements
The authors are grateful to both organizations including Electricite DU Laos (EDL) and Electricity
Generating Authority of Thailand (EGAT) for their supporting funds. In addition, EDL supported the
DIgSILENT PowerFactory software to simulate and data to model the electric power system in this
project. Moreover, Ministry of Energy and Mine of Lao PDR provided the solar radiation information and
Khon Kean University grant the research place.
References
[1] Renewable Energy Statistics 2018. [Online]. Available: Renewable Energy Statistics 2018. [Online]. Available:
https://www.irena.org/-/media/Files/.../2018/.../IRENA_RE_Capacity_ Statistics_2018.pdf
[2] Obi M, Bass R. Trends and challenges of grid-connected photovoltaic systems – A review. Renew. Sustain. Energy Rev., 2016;
58: 1082–1094.
[3] Tang Y, Burgos R, Li C, Boroyevich D. Impact of PV inverter generation on voltage profile and power loss in medium voltage
distribution systems. 2016 IEEE 43rd Photovolt. Spec. Conf., 2016; 1869–1874.
[4] Khan ZW. Analyzing the impacts of distributed generation on power losses and voltage profile. 2015 Int. Conf. Emerg.
Technol, 2015; 1–4,.
[5] Daud S, Fazliana A, Kadir A, Gan CK. The impacts of distributed photovoltaic generation on power distribution networks
losses. 2015 IEEE Student Conf. Res. Dev., 2015; 11–15.
[6] Mourad N. Impact of increased distributed photovoltaic generation on radial distribution networks. 2016 Int. Conf. Control.
Decis. Inf. Technol., 2016; 292–295.
[7] Solanki SK, Ramachandran V, Member S, Solanki J. Steady state analysis of high penetration PV on utility distribution feeder.
PES T&D 2012, 2012; 1–6.
[8] Watson DJ, Watson NR, Santos-martin D, Wood AR, Lemon S, V Miller AJ. Impact of solar photovoltaics on the low-voltage
distribution network in New Zealand. 2016; 10: 1–9.
[9] Ioan L, Bic D, Ieee M, Ronay K. Impact of Photovoltaic Power Plants on Power System Losses. 2017; 727–730.
[10] Thomson M, Infield DG. Impact of widespread photovoltaics generation on distribution systems. pp. 33–40.
[11] Kenneth AP, Folly K. Voltage rise issue with high penetration of grid connected PV voltage rise issue with high penetration of
grid connected PV. 2014; (August 2016): 4959–66.
744 International Journal of Smart Grid and Clean Energy, vol. 9 , no. 4, July 2020

K. Thavy et al.: PV installation for grid-connected distribution system in …
[12] Afolabi OA, Ali WH, Cofie P, Fuller J, Obiomon P, Kolawole ES. Analysis of the load flow problem in power system
planning studies. Energy and Power, no. September, 2015; 509–523.
[13] Thavy K, Chayada S, Arkom K. Effects of solar photovoltaic size on grid-connected power system in Savannakhet province,
Lao People's democratic republic. Submitted to KKU Research Journal (Graduate Studies), 2019.
[14] Thai Yazaki technical data. Retrieved August 13, 2018, [Online]. Available: http://www.nre.co.th/2014/downloads-spec-tis-
catalog /category/13-thaiyazaki.html.
[15] Chen Y. Power Flow Equation Formulation. 2015; 1(5): 1–5.
[16] Cheng D, Mather BA, Seguin R, Hambrick J, Broadwater RP. Photovoltaic (PV) impact assessment for very high penetration
levels. IEEE J Photovoltaics. 2016; 6(1): 295–300.
[17] Paper C, Town C, Town C. Voltage rise issue with high penetration of grid connected PV voltage rise issue with high
penetration of grid connected PV. 2014;(August 2016):4959–66.
Copyright © 2020 by the authors. This is an open access article distributed under the Creative Commons Attribution License (CC
BY-NC-ND 4.0), which permits use, distribution and reproduction in any medium, provided that the article is properly cited, the use
is non-commercial and no modifications or adaptations are made.
745