pv certification - nabcep€¦ · welcome to the 2019 edition of the nabcep board certified pv...
TRANSCRIPT
PV CertificationStudy Guide
Edited by: Bill Brooks, PE Brian Mehalic Brooks Engineering Solar Energy International
V.8/2019
Raising Standards. Promoting Confidence

SolarRoofHookis now
In 2011, we sought out to invent a mounting system that sealspenetrations on Asphalt Roofs without lifting Shingles. We received a patent and now, 7 years later, the product has finally gained acceptance as the world’s 1ST UL Certified Microflashing® and a ground-breaking way to mount solar on top of asphalt.
That product name is: QuickBOLT.The new name of our Solar Division is: QuickBOLT.
www.quickbolt.com(844) 671-6045 | MON-FRI : 7AM-5PM PST
NOLIFTING
SHINGLES
NOREMOVING
NAILS
INSTALL INLESS THAN
30 SECONDS

Welcome to the 2019 edition of the NABCEP Board Certified PV Certification Study Guide. This Study Guide is intended to be a useful study guide for individuals studying to take a NABCEP Board Certification exam in PV, a supplemental textbook for training courses, and a general reference book for practitioners in the field.
This edition follows the most recent version of the NABCEP PV Installation Professional Job Task Analysis (JTA) as well as the JTAs of the NABCEP PV Design Specialist, PV Installer Specialist, and PV Commissioning & Maintenance Specialist Board Certifications, which can be found at www.nabcep.org. The JTAs define the jobs of PV professionals who specialize in the design, installation, operations, commissioning, and maintenance of PV systems. NABCEP’s JTAs are the foundation for its Board Certification examinations, and each JTA breaks down the percentage of exam questions that come from each domain. Candidates preparing for one of NABCEP’s Board Certification exams should first review the relevant Job Task Analysis to see what areas in the body of knowledge are required to pass the exam, and do an honest and thorough self-evaluation to determine what areas they may need to study.
This guide is one of the “primary references” utilized by the Examination Committees in creating test questions for the NABCEP PV Installation Professional and PV Specialist Board Certification exams; however, it should not be considered the sole resource to use in preparing to take an exam. Questions on the exam are developed using the material in all of the primary resources, particularly the National Fire Protection Agency’s National Electrical Code. A list of primary resources may be found on nabcep.org. While this guide contains a lot of useful information, compiled by two of the most respected authors in the solar installation industry, it is not intended to be the definitive word on PV design, installation, operation, commissioning, or maintenance.
Table of Contents
1. Introduction . . . . . . . . . . . . . . . . . . . . . . . . . . . . . . . . . . . . . . . . . . . 6
2. System Design . . . . . . . . . . . . . . . . . . . . . . . . . . . . . . . . . . . . . . . . . 9
3. Installation . . . . . . . . . . . . . . . . . . . . . . . . . . . . . . . . . . . . . . . . . . . 81
4. System Commissioning . . . . . . . . . . . . . . . . . . . . . . . . . . . . . . . . 110
5. Operations & Maintenance . . . . . . . . . . . . . . . . . . . . . . . . . . . . . 123
AppendixesExam References . . . . . . . . . . . . . . . . . . . . . . . . . . . . . . . . . . . . . . . . . 124
Case Study Examples. . . . . . . . . . . . . . . . . . . . . . . . . . . . . . . . . . . . . . 136

R E S P E C T T H E R O O F
Thank you to our Study Guide Sponsors

NABCEP wishes to thank the companies and individuals who have made this Study Guide possible. This document is the result of the efforts of its principal authors: Bill Brooks (Brooks Engineering) and Jim Dunlop (Jim Dunlop Solar). It is also the result of review and contributions made by members of the NABCEP PV Certification Study Guide Committee. We are grateful to the following individuals for their contributions (company names provided are from where the individual worked immediately before the date of this Study Guide’s publication, and may not be the location of current employment):
Forward/ScopeThis document was developed to provide an overview of some of the basic requirements for solar photovoltaic (PV) system installations and those who design, install, and maintain them. The guide is organized according to the NABCEP PV Installation Professional Job Task Analysis (PVIP JTA), an industry developed and validated outline of the tasks involved in the design, installation, and maintenance of PV systems. Readers should use the PVIP JTA and this guide along with the 2017 National Electrical Code® (NEC®), the governing building codes and other applicable codes and standards. These codes and standards are referenced often throughout this document, and are the principal rules that govern the installation of PV systems and any other electrical equipment. A thorough understanding of these requirements is essential for PV system designers and installers.
PRINCIPAL AUTHORSBill Brooks, PE Brooks Engineering brooksolar.com
Jim Dunlop Jim Dunlop Solar jimdunlopsolar.com
ingeniousPV ingeniousPV.com
Live Solar & NYC Tech livesolar.com
Independent Power independentpower.net
Viridian Energy Co-operative viridianenergy.ca
Global Sustainable Energy Solutions gses.com.au
Vivint Solar vivintsolar.com
Planet Plan Sets planetplansets.com
Mastering Green mastering-green.com
Mike Holt Enterprises mikeholt.com
C-TEC Solar ctecsolar.com
Borrego Solar Systems borregosolar.com
SolPowerPeople, Inc. solpowerpeople.com
White House Solar maximumpowerpointtraining.com
Quick Mount PV quickmountpv.com
CONTRIBUTORS Andrew Kelly
Anthony Alexander
Caden Mulligan
Eric Smiley, PEng
Geoff Stapleton
Gregory Elvestad
Jeff Spies
Michael Ginsberg
Mike Holt
Michael Ricci
Ramón Ventura
Richard Stovall
Sean White
Susan Stark
Wesley Kennedy EnSync Energy Systems ensync.com
Acknowledgements:
Non Endorsement Statement: The North American Board of Certified Energy Practitioners (NABCEP) does not assume any legal liability or responsibility for the products and services listed or linked to in NABCEP publications and website. Reference to any specific commercial product, process, or service by trade name, trademark, manufacturer, or otherwise, does not constitute or imply NABCEP’s endorsement or recommendation.
NABCEP56 Clifton Country RoadSuite 202 Clifton Park, NY 12065800-654-0021 / [email protected]
This document is a collaborative effort, and is considered a work in progress. Future editions of this guide will incorporate comments, corrections and new content as appropriate to reflect new types of products, installation methods or code requirements.
Units of MeasureBoth the International System of Units (SI) and the U.S./Imperial customary units of measure are used throughout this document. While SI units are generally used for solar radiation and electrical parameters, U.S./Imperial customary units are used most commonly in the U.S. construction industry for weights or measure. PV professionals are expected to be comfortable with using both systems of measurement and converting between the two given the appropriate unit conversion factors.

6 • Introduction Copyright © 2019 NABCEP v.8 NABCEP PV Certification Study Guide
INTRODUCTION
This Photovoltaic (PV) Certification Study Guide is an informational resource intended for individuals pursuing a Board Certification in the field of photovoltaics from the North American Board of Certified Energy Practitioners (NABCEP).
This guide covers some of the basic requirements for the design, installation, operations, commissioning, and maintenance of PV systems. Individuals should use this guide in conjunction with other resources in preparation for NABCEP’s Board Certification exams related to PV.
To qualify for an exam, candidates should first carefully read the NABCEP Certification Handbook, which outlines specific prerequisites for education, training, and professional experience in a decision-making role, to qualify for the Board Certification exam. For further information on NABCEP’s Board Certification programs, and how to apply, and to download the latest NABCEP Certification Information Handbook, go to http://www.nabcep.org/certification/how-to-apply-2. This guide is organized and closely associated with the NABCEP PV Installation Professional Job Task Analysis (JTA), but it is written to also relate to the JTAs for the NABCEP PV Design Specialist, PV Installer Specialist, and PV Commissioning & Maintenance Specialist Board Certifications. The JTA outlines the normal duties of a qualified PV professional, and defines the general knowledge, skills, and abilities required of those who specify, install, operate, commission, and maintain PV systems. JTAs form the blueprint for NABCEP Board Certification examination content and should be referenced often when reviewing this document. The JTAs are available for download from the NABCEP website, at http://www. nabcep.org/
The objectives of this guide are to provide general information, and additional resources concerning the key areas for working with PV systems. This guide is not an all-inclusive or definitive study guide for the exam, and exam questions are not necessarily based on the contents of this resource guide. NABCEP offers practice exams for anyone interested in preparing to take one of its exams. Practice exams are available for purchase on our website, at http://www.nabcep.org/nabcep-practice-exams.
JTA Job Description for NABCEP Certified PV Installation Professional
Given a potential site for a solar PV
system installation, and given basic
instructions, major components,
schematics, and drawings, the PV
installation professional will: specify,
adapt, implement, configure, install,
inspect, and maintain any type of
photovoltaic system, including grid-
connected and stand-alone systems
with or without battery storage, that
meet the performance and reliability
needs of customers by incorporating
quality craftsmanship and complying
with all applicable codes, standards,
and safety requirements.

www.burndy.com© BURNDY LLC, 2017
Everything Under the SunFrom quality products and customized configurations,
to warrantied connections with reliable tools, BURNDY® saves you time and money by being your single source for all solar installation needs.
Inverter/Chargers
Charge Controllers
Interconnection System Equipment
www.SensataPower.com
HELP YOUR CUSTOMERS ACHIEVE
with Magnum Energy power conversion solutions from Sensata Technologies.
ENERGY PEACE-OF-MIND & ENERGY INDEPENDENCE
2018-PV_resource_guide_ad.indd 1 11/7/17 4:34 PM

8 • Introduction Copyright © 2019 NABCEP v.8 NABCEP PV Certification Study Guide
Photovoltaic Systems OverviewThe PV installer must be familiar with a wide range of PV systems that they may encounter. PV systems are electrical power generation systems that produce energy. They vary greatly in size and their applications, and can be designed to meet very small loads from a few watts or less up to large utility-scale power plants producing tens of megawatts or more. PV systems can be designed to supply power to any type of electrical load at any service voltage.
The major component in all PV systems is an array of PV modules that produces dc electricity when exposed to sunlight. Other major components may include power conditioning equipment, energy storage devices, other power sources and the electrical loads. Power conditioning equipment includes inverters, dc-to-dc converters, chargers, charge and load controllers, and maximum power point trackers. Energy storage
devices used with PV systems are mainly batteries, but may also include advanced technologies like flywheels or other forms of storing electrical energy or the product, such as storing water delivered by a PV water pumping system. Other energy sources coupled with PV systems may include electrical generators, wind turbines, fuel cells and the electric utility grid. See Fig. 1.
Balance-of-system (BOS) components include all mechanical or electrical equipment and hardware used to assemble and integrate the major components in a PV system together. Electrical BOS components are used to conduct, distribute and control the flow of power in the system.
Examples of BOS components include:• Conductors and wiring methods• Raceways and conduits• Junction and combiner boxes• Disconnect switches• Fuses and circuit breakers• Terminals and connectors• Grounding equipment• Array mounting and other structural hardware
Figure 1. PV system components 2011 Jim Dunlop Solar Solar Radiation: 2 - 2
PV System Components
1. PV modules and array
2. Combiner box
3. DC disconnect
4. Inverter (charger & controller)
5. AC disconnect
6. Utility service panel
7. Battery (optional)
1
2
3
4
5
7
6

r.e.think energy
With over 10 years of experience in the US solar distribution market, BayWa r.e. Solar Systems understands there are times of turbulence and uncertainty in the solar industry. We are committed to providing you with seamless support through the ups and downs, to help you run a successful solar business.
As one of the largest suppliers of solar equipment in the world, we are well-known for our stability as a partner.
We are here to empower and support you in every area of your solar business – from planning to purchasing to installation – you can count on BayWa r.e. Solar Systems to be the partner you need.
Visit solar-distribution-us.baywa-re.com to learn more.
10 • Introduction Copyright © 2019 NABCEP v.8 NABCEP PV Certification Study Guide
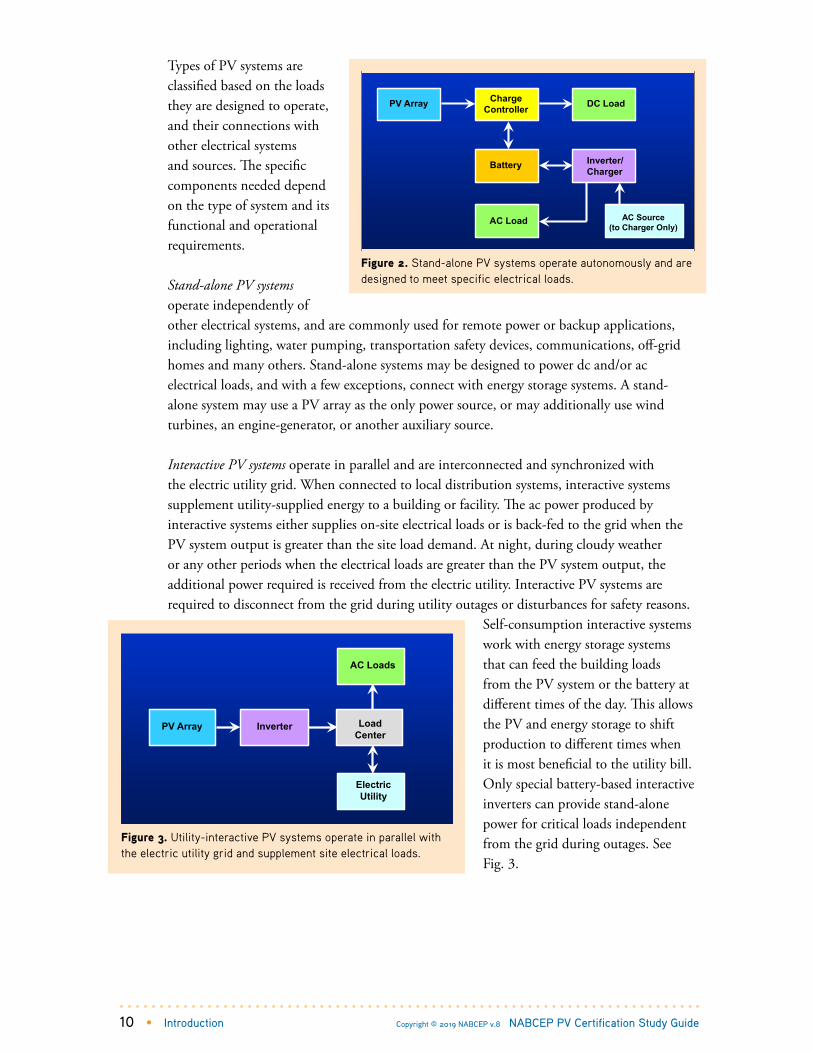
Types of PV systems are classified based on the loads they are designed to operate, and their connections with other electrical systems and sources. The specific components needed depend on the type of system and its functional and operational requirements.
Stand-alone PV systems operate independently of other electrical systems, and are commonly used for remote power or backup applications, including lighting, water pumping, transportation safety devices, communications, off-grid homes and many others. Stand-alone systems may be designed to power dc and/or ac electrical loads, and with a few exceptions, connect with energy storage systems. A stand-alone system may use a PV array as the only power source, or may additionally use wind turbines, an engine-generator, or another auxiliary source.
Interactive PV systems operate in parallel and are interconnected and synchronized with the electric utility grid. When connected to local distribution systems, interactive systems supplement utility-supplied energy to a building or facility. The ac power produced by interactive systems either supplies on-site electrical loads or is back-fed to the grid when the PV system output is greater than the site load demand. At night, during cloudy weather or any other periods when the electrical loads are greater than the PV system output, the additional power required is received from the electric utility. Interactive PV systems are required to disconnect from the grid during utility outages or disturbances for safety reasons.
Self-consumption interactive systems work with energy storage systems that can feed the building loads from the PV system or the battery at different times of the day. This allows the PV and energy storage to shift production to different times when it is most beneficial to the utility bill. Only special battery-based interactive inverters can provide stand-alone power for critical loads independent from the grid during outages. See Fig. 3.
Figure 2. Stand-alone PV systems operate autonomously and are designed to meet specific electrical loads.
2011 Jim Dunlop Solar System Components and Configurations: 4 - 3
Figure 3. Utility-interactive PV systems operate in parallel with the electric utility grid and supplement site electrical loads.
LoadCenter
PV Array Inverter
AC Loads
ElectricUtility
Figure 3. Utility-interactive PV systems operate in parallel with the electric utility grid and supplement site electrical loads.
2011 Jim Dunlop Solar System Components and Configurations: 4 - 2
Figure 2. Stand-alone PV systems operate autonomously and are designed to meet specific electrical loads.
DC LoadPV Array
Battery
ChargeController
Inverter/Charger
AC Load AC Source(to Charger Only)

System Design • 11 NABCEP PV Certification Study Guide Copyright © 2019 NABCEP v.8
SYSTEM DESIGN
1. Designing the PV System and Managing the ProjectA NABCEP Certified Professional is often an installer, a project manager, an installation foreman/supervisor, or a system designer. They must know how to interpret, review, and generate system designs. They must also be able to evaluate site issues affecting the design, identify discrepancies in the design or with code compliance, and recommend and implement appropriate corrective actions or alternatives. PV installation professionals have a thorough understanding of system designs, including their major components, functions and installation requirements.
1.1 Reviewing Customer Expectations Task 1An accurate assessment of the customer’s expectations is the starting point for specifying, designing and installing PV systems. Developing and planning PV projects requires an understanding of the customer’s expectations from both financial and energy perspectives. Companies and individuals offering PV installation services must interpret the customer’s desires, and based on the site conditions, clearly explain the options, their trade-offs and costs. They must also explain the functions, maintenance and operating principles for different types of PV systems. The solar professional must also estimate their performance relative to the customer’s electrical loads for a net-metered system and convey how the system design will work with changing utility rate schedules and other incentives for producing energy and power. As the solar industry grows, PV systems will become more interactive with smart buildings, smart meters, and energy storage systems to increase the value to the customer.
Meeting customer expectations includes addressing all other issues affecting the proposed installation, such as applicable incentives, changing markets, legal matters, location of equipment, fast emerging technologies, appearance, understanding codes, standards, covenants and regulations. Code changes happen on an ongoing basis and impact designs and costs of the system. Fundamentally, knowledge of the client’s needs and desires become the basis for preparing proposals, quotations, and construction contracts.
There are several public domain and many commercial software resources available in the PV industry that address different aspects of project development and systems design. The
NABCEP PV Technical Sales Certification
The NABCEP PV Technical Sales Certification is a credential
offered for those specifically engaged in marketing and the customer
development process for PV installations. Further information on
this certification program is available on the NABCEP website:
http://www.nabcep.org/ certification/pv-technical-sales-certification

12 • System Design Copyright © 2019 NABCEP v.8 NABCEP PV Certification Study Guide
capabilities of these tools range from simple solar resource and energy production estimates, to site survey and system design tools, to complex financial analysis software. Some tools also provide assistance with rebate programs applications and tax incentives, while other programs and worksheets focus on the technical aspects of system sizing and design. Proprietary software is often used by larger solar companies and by solar financing institutions.
The following lists some of the popular software tools used in the PV industry:
Assessing Energy UseKnowledge of the customer’s electrical loads and energy use are important considerations for many types of PV installations. The energy produced by PV systems will often offset energy derived from another source and represents a return on the customer’s financial investment.
For net-metered, stand-alone and self-consumption systems, be prepared to evaluate and discuss the customer’s energy use relative to the PV system options and their expected performance. This can be as simple as reviewing electrical bills for the past year or longer if available. See Fig 5. For new construction or off-grid applications, the energy use can be estimated from equipment ratings and expected load use profiles, but estimates can be highly
Public Domain (NREL/DOE)
• PVWATTS: http://pvwatts.nrel.gov/
• In My Back Yard (IMBY): www.nrel.gov/eis/imby/
• RET Screen
• System Advisor Model (SAM): www.nrel.gov/analysis/sam/
• Google Earth: https://www.google.com/earth/
Manufacturers and Integrators
• Inverter string sizing and various system sizing and design tools
Commercial
• Clean Power Estimator: www.cleanpower.com
• PVSYST: www.pvsyst.com
• OnGrid: www.ongrid.net
• PVSol: www.solardesign.co.uk/
• PV F-Chart: www.fchart.com
• Maui Solar Software: www.mauisolarsoftware.com/
• HOMER: www.homerenergy.com/
• Helioscope: https://helioscope.folsomlabs.com/
• AuroraSolar: http://www.aurorasolar.com/
• Energy Periscope

System Design • 13 NABCEP PV Certification Study Guide Copyright © 2019 NABCEP v.8
inaccurate. Actual measurements are always preferred, and there are a number of low-cost electronic watt-hour meters available that can be readily installed to measure specific loads, branch circuits or entire electrical services. Load information is used to size and design PV systems, estimate their performance and to conduct financial evaluations.
For stand-alone PV applications, load energy consumption dictates the size and cost of the asessments are a must. In many PV syPV system required, and is a critical design parameter. For these systems, accurate load assessments are a must. In many cases, a customer could have a greater benefit in changing equipment or practices to minimize their energy use, rather than installing a larger PV system to offset inefficient loads or habits.
Interactive (grid-connected) PV systems may be designed to satisfy a portion of existing site electrical loads, but generally no more than the total energy requirements on a net basis. Systems using energy storage (batteries) for off-grid and utility back-up applications require a detailed load analysis to adequately size the array, battery, and inverter for stand-alone operation. Many PV system sizing worksheets and software tools incorporate means to input a given electrical load and estimate the PV to load energy contribution in the results.
Electrical loads are any type of device, equipment or appliance that consumes electrical power. Electrical loads are characterized by their voltage, power consumption and use profile. Many types of electrical loads and appliances are available in high-efficiency models. Alternating-current (ac) loads are powered by inverters, generators or the utility grid. Direct-current (dc) loads operate from a dc source, such as a battery. Some small off-grid PV system applications use only dc loads, and avoid having to use an inverter to power ac loads.
DSIRE
Many websites provide information concerning
local and state regulations for PV installations,
including incentive programs, utility interconnection
rules, and requirements for contractor licensing,
permitting and inspection. The Database of State
Incentives for Renewable Energy (DSIRE) is an
excellent source for this information, and includes
up-to-date summary information and numerous links
to federal, state and local websites. For additional
details, see: www.dsireusa.org
Figure 5. Electric bills are reviewed as part of a site survey to evaluate customer energy use.
Figure 4. The Database of State Incentives for Renewable Energy (DSIRE) contains information on rules, regulations and policies for renewable energy and energy efficiency programs in all states.

14 • System Design Copyright © 2019 NABCEP v.8 NABCEP PV Certification Study Guide
1.2 Assess Project Site Task 3Site surveys are used to collect information about the local conditions and issues affecting a proposed PV installation. This information is documented through records, notes, photographs, measurements and other observations and is the starting point for a PV project. Ultimately, information from site surveys is used in combination with the customer desires as the basis for preparing final quotations, system designs, and planning the overall installation.
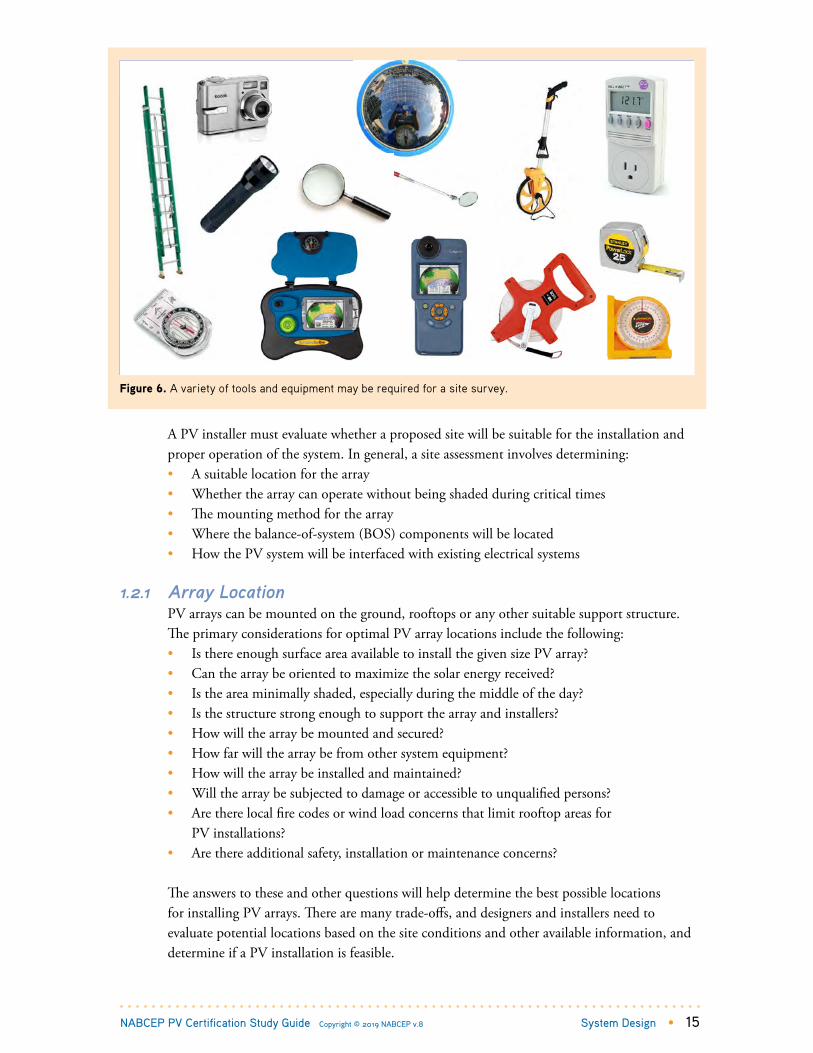
There are many aspects to conducting a thorough site survey. The level of detail depends on the size and scope of the project, the type of PV system to be installed, and where and how it will be installed. Greater considerations are usually associated with commercial projects, due to the larger equipment and increased safety hazards involved. Obtaining the necessary information during a site survey helps plan and execute PV installations in a timely and cost-effective manner. It also begins the process of assembling the system manuals and project documentation. A number of tools, measuring devices, special equipment and safety gear may be required for conducting site surveys. See Fig. 6. Some of the basic equipment includes:• Appropriate PPE including hardhats, safety glasses, safety shoes, gloves and fall
protection equipment• Basic hand tools, ladders, flashlights, mirrors and magnifying glasses• Tape measures, compasses, levels, protractors and solar shading calculators• Voltmeters, ammeters, watt and watt-hour meters, and power quality analyzers• Graph paper, calculator, audio recorders, cameras and electronic notebooks
Power and Energy Basics
An understanding of power and energy fundamentals is essential for the PV professional.
Electrical power is expressed in units of watts (W):
1 megawatt (MW) = 1,000 kilowatts (kW) = 1,000,000 watts (W)
Electrical energy is expressed in units of watt-hours (Wh):
1 kilowatt-hour (kWh) = 1000 Wh
Power and energy are related by time. Power is the rate of transferring work or energy, and
analogous to an hourly wage ($/hr) or the speed of a vehicle (mi/hr). Energy is the total amount
of work performed over time, and analogous to total income earned ($) or distance traveled (mi).
Simply stated, energy is equal to the average power multiplied by time:
Energy (Wh) = Avg. Power (W) × time (hr)
System Design • 15 NABCEP PV Certification Study Guide Copyright © 2019 NABCEP v.8
A PV installer must evaluate whether a proposed site will be suitable for the installation and proper operation of the system. In general, a site assessment involves determining:• A suitable location for the array• Whether the array can operate without being shaded during critical times• The mounting method for the array• Where the balance-of-system (BOS) components will be located• How the PV system will be interfaced with existing electrical systems
1.2.1 Array LocationPV arrays can be mounted on the ground, rooftops or any other suitable support structure. The primary considerations for optimal PV array locations include the following:• Is there enough surface area available to install the given size PV array?• Can the array be oriented to maximize the solar energy received?• Is the area minimally shaded, especially during the middle of the day?• Is the structure strong enough to support the array and installers?• How will the array be mounted and secured?• How far will the array be from other system equipment?• How will the array be installed and maintained?• Will the array be subjected to damage or accessible to unqualified persons?• Are there local fire codes or wind load concerns that limit rooftop areas for
PV installations?• Are there additional safety, installation or maintenance concerns?
The answers to these and other questions will help determine the best possible locations for installing PV arrays. There are many trade-offs, and designers and installers need to evaluate potential locations based on the site conditions and other available information, and determine if a PV installation is feasible.
2011 Jim Dunlop Solar System Components and Configurations: 4 - 6
Figure 6. A variety of tools and equipment may be required for a site survey.
Figure 6. A variety of tools and equipment may be required for a site survey.

16 • System Design Copyright © 2019 NABCEP v.8 NABCEP PV Certification Study Guide
Array AreaIndividual PV module characteristics and their layout dictate the overall surface area required for a PV array with a specified peak power output rating. The surface area required for a given array depends on many factors, including the individual module dimensions, their spacing in the array, and the power conversion efficiency of the modules used. Fire safety codes, wind loads and accessibility to the array for installation and maintenance must also be considered when evaluating suitable array locations and layouts, and may limit possible locations to install PV arrays. PV arrays installed in multiple rows of tilted racks or on trackers require additional spacing between each array mounting structure to prevent row to row shading.
Power densities for PV arrays can vary between 6 and 20 watts per square foot (W/sf ) and higher, depending on module efficiency and array layout. For example, the power density of a 260 watt crystalline silicon PV module with a surface area of 17.3 sf is calculated by:
260/17.3 = 15.0 W/sf
For a 4 kW PV array, the total module surface area required would be:
4000 W ÷ 15 = 267 sf
This is approximately the area of 10 sheets of plywood. Additional area is usually required for the overall PV array installation and other equipment. Given the required spacing for commercial rooftop installation, it usually takes about 80 to 100 sf of surface area for a 1 kWdc rated PV array using standard crystalline silicon PV modules. For example, assuming an array power density of 10 W/sf, a 1 MW PV array would require 100,000 sf of array area, slightly larger than two acres and the approximate size of the rooftops on big box retail establishments. See Fig. 7.
Sun Position and the Solar WindowThe location of the sun relative to any point on earth is defined by two ever-changing angles. The solar azimuth angle defines the direction of the sun’s horizontal projection relative to a point on earth, usually symbolized by the Greek letter Psi (c). For example, with compass headings, north is 0° or 360°, east is 90°, south is 180° and west is 270°. However, some solar equipment and computer programs use due south as the zero degree reference because it
2011 Jim Dunlop Solar System Components and Configurations: 4 - 7
Figure 7. For a power density of 10 watts per square foot, a 500 kW PV array can be installed in a 50,000 square foot area.
270 ft
370 ft
Total roof area: 100,000 sq. ft.
Figure 7. For a power density of 10 watts per square foot, a 500 kW PV array can be installed in a 50,000 square foot area.

/ Perfect Welding / Solar Energy / Perfect Charging
VISIT THE ALL NEW FRONIUS SOLAR.WEB AT WWW.SOLARWEB.COM
A NEW GENERATION OF SOLAR SYSTEMS THE FRONIUS SMART SOLUTION
COMMERCIAL AND RESIDENTIAL SNAPINVERTERS AVAILABLE FROM 1.5 - 24.0 KW
/ Experience high quality power conversion from a privately owned, bankable technology leader.
/ Fully integrated features include Wi-Fi, SunSpec Modbus, free lifetime monitoring, AFCI, and DC disconnect.
/ Maximize system design and flexiblity with dual MPPT, streamlined technology and multiple grid connections.
/ The only truly field serviceable option for long-term sustainability and security.
/ Conveniently installed in under 15 minutes on a pole, rooftop, or ground mount.
/ Learn more at www.fronius.com, www.24hoursofsun.com or contact us at [email protected] or 1 (219)-734-5500

18 • System Design Copyright © 2019 NABCEP v.8 NABCEP PV Certification Study Guide
simplifies the complex equations used to calculate sun position. In these cases, solar azimuth angles west of south are typically represented by negative angles (due west is -90°), and east of south is represented as a positive angle (due east is +90°).
The solar altitude angle defines the sun’s elevation above the horizon, and commonly symbolized by the Greek letter alpha (a). At sunrise and sunset, when the sun is on the horizon, the sun’s altitude is 0°. If the sun is directly overhead, then its altitude is 90° (at the zenith). The sun will be directly overhead at noontime some point during the year only between the Tropic of Cancer and Tropic of Capricorn. This range of tropical latitudes (23.45° north and south of the equator, respectively) is defined by the limits of solar
declination and sun position, which also define the beginnings of the seasons. See Fig. 8.
A sun path or sun position diagram is a graphical representation of the sun’s altitude and azimuth angles over a given day of the year, for the specified latitude. These charts can be used to determine the sun’s position in the sky, for any latitude, at any time of the day or year. Sun path diagrams are the basis for evaluating the effects of shading on PV arrays and other types of solar collectors.
Typically, these charts include the sun paths for the solstices and at the equinoxes, and sometimes the average monthly sun paths or for different seasons. At the equinoxes, the sun paths are identical, and define the average sun path for the year. The equinoxes define the first days of spring and fall, and everywhere on earth, the sun rises due east and sets due west, and the sun is above the horizon for exactly 12 hours. On the equinoxes, the sun is directly overhead (solar altitude is 90°), at solar noon everywhere along the equator.
Solar Noon
Solar noon is the local time when the sun is at its highest point in the sky and crossing the local
meridian (line of longitude). However, solar noon is not usually the same as 12 p.m. local time due
to offsets from Daylight Savings Time, and the site longitude relative to the time zone standard
meridian, and eccentricities in the earth-sun orbit. A simple method to determine solar noon is to
find the local sunrise and sunset times and calculate the midpoint between the two.
2011 Jim Dunlop Solar Solar Radiation: 2 - 8
Figure 8. Sun position is defined by the azimuth and altitude angles.
North
WestSouth
East
Zenith
Horizontal Plane
Altitude Angle
Azimuth Angle
Zenith Angle
Figure 8. Sun position is defined by the azimuth and altitude angles.
System Design • 19 NABCEP PV Certification Study Guide Copyright © 2019 NABCEP v.8
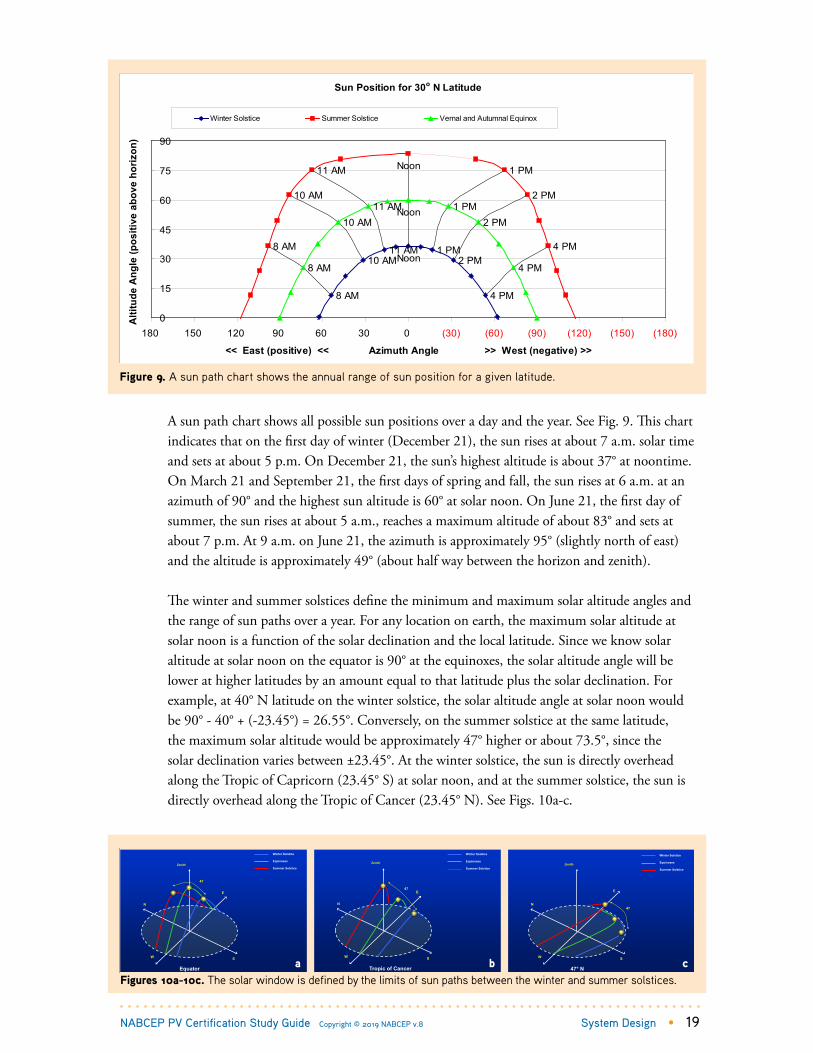
A sun path chart shows all possible sun positions over a day and the year. See Fig. 9. This chart indicates that on the first day of winter (December 21), the sun rises at about 7 a.m. solar time and sets at about 5 p.m. On December 21, the sun’s highest altitude is about 37° at noontime. On March 21 and September 21, the first days of spring and fall, the sun rises at 6 a.m. at an azimuth of 90° and the highest sun altitude is 60° at solar noon. On June 21, the first day of summer, the sun rises at about 5 a.m., reaches a maximum altitude of about 83° and sets at about 7 p.m. At 9 a.m. on June 21, the azimuth is approximately 95° (slightly north of east) and the altitude is approximately 49° (about half way between the horizon and zenith).
The winter and summer solstices define the minimum and maximum solar altitude angles and the range of sun paths over a year. For any location on earth, the maximum solar altitude at solar noon is a function of the solar declination and the local latitude. Since we know solar altitude at solar noon on the equator is 90° at the equinoxes, the solar altitude angle will be lower at higher latitudes by an amount equal to that latitude plus the solar declination. For example, at 40° N latitude on the winter solstice, the solar altitude angle at solar noon would be 90° - 40° + (-23.45°) = 26.55°. Conversely, on the summer solstice at the same latitude, the maximum solar altitude would be approximately 47° higher or about 73.5°, since the solar declination varies between ±23.45°. At the winter solstice, the sun is directly overhead along the Tropic of Capricorn (23.45° S) at solar noon, and at the summer solstice, the sun is directly overhead along the Tropic of Cancer (23.45° N). See Figs. 10a-c.
2011 Jim Dunlop Solar Solar Radiation: 2 - 10
Figure 10. The solar window is defined by the limits of sun paths between the winter and summer solstices.
Winter Solstice
Equinoxes
Summer Solstice
N
W S
E
Zenith
47
Equator 2011 Jim Dunlop Solar Solar Radiation: 2 - 11
Figure 10b.
Winter Solstice
Equinoxes
Summer Solstice
N
W S
E
Zenith
47
Tropic of Cancer 2011 Jim Dunlop Solar Solar Radiation: 2 - 12
Figure 10c.
Winter Solstice
Equinoxes
Summer Solstice
N
W S
E
Zenith
47
47° N
Figures 10a-10c. The solar window is defined by the limits of sun paths between the winter and summer solstices.
2011 Jim Dunlop Solar Solar Radiation: 2 - 9
Figure 9. A sun path chart shows the annual range of sun position for a given latitude.
Sun Position for 30o N Latitude
8 AM
8 AM
8 AM10 AM
10 AM
10 AM
Noon
Noon
Noon
11 AM
11 AM
11 AM
1 PM
1 PM
1 PM
2 PM
2 PM
2 PM
4 PM
4 PM
4 PM
0
15
30
45
60
75
90
(180)(150)(120)(90)(60)(30)0306090120150180
<< East (positive) << Azimuth Angle >> West (negative) >>
Alti
tude
Ang
le (p
ositi
ve a
bove
hor
izon
)Winter Solstice Summer Solstice Vernal and Autumnal Equinox
Figure 9. A sun path chart shows the annual range of sun position for a given latitude.
a b c

20 • System Design Copyright © 2019 NABCEP v.8 NABCEP PV Certification Study Guide
Solar Declination
Solar declination (d) is the ever changing angle between the earth’s equatorial plane and the sun’s rays. This is the primary geometric factor affecting the sun position and the solar energy received at any point on earth. Solar declination varies continuously from –23.45° to +23.45° over the year in a sinusoidal fashion, due the earth’s constant tilt and elliptical orbit around the sun. The limits of solar declination define the tropical and arctic latitudes, and the range of sun position in the sky relative to any point on earth. The winter and summer solstices are defined by the minimum and maximum limits of solar declination, respectively. Solar declination is 0° at the equinoxes, when the earth’s equatorial plane is aligned directly toward the sun’s rays.
Magnetic Declination
Magnetic declination is the angle between magnetic north and the true geographic North Pole, and varies with location and over time. Magnetic declination adjustments are made when using a magnetic compass and with some solar shading devices to accurately determine due south. Magnetic compasses and devices incorporating them usually have a revolving bezel to adjust for magnetic declination. See Fig. 11.
Magnetic declination is considered positive when magnetic north is east of true north and negative when magnetic north is west of true north. The western U.S. has positive (easterly) declination, and the eastern U.S. has negative (westerly) declination. Magnetic declination is near zero on a line running through Pensac-ola, FL, Springfield, IL and Duluth, MN, called an agonic line. The greatest magnetic declination occurs in the northeastern and northwestern most parts of the U.S. and North America. For example, a compass needle points 15° east of geographic north in Central California. Conversely, a compass needle points about 13° west of geographic north in New Jersey. In most of the central and southern U.S., magnetic declination is small and can usually be neglected, especially considering the small effects of changing array azimuth angle by a few degrees. See Fig. 12. For an accurate understanding of the magnetic declination of a specific location, the following website is available: http://www.ngdc.noaa.gov/geomag-web/.
The magnetic north pole shifts slightly on a regular basis. Old maps will show a slightly different pattern. This changing pattern is negligible related to solar energy.
Electronic compasses, such as the one on your phone and computer mapping programs are almost always orientated to true azimuth and need no magnetic correction when determining the sun path.
2011 Jim Dunlop Solar Solar Radiation: 2 - 13
Figure 11. Magnetic compass readings must be corrected for magnetic declination.
West East
Geographic North
South - 180
Magnetic North
270 90
0
180
Magnetic Declination (Positive, Eastern)
Figure 11. Magnetic compass readings must be corrected for magnetic declination.
Figure 12. The western U.S. has positive (easterly) declination, and will cause a compass needle to point east of geographic north.

System Design • 21 NABCEP PV Certification Study Guide Copyright © 2019 NABCEP v.8
The solar window represents the range of sun paths for a specific latitude between the winter and summer solstices. Wherever possible, PV arrays should be oriented toward the solar window for maximum solar energy collection. As latitudes increase to the north from the equator, the solar window is inclined at a closer angle to the southern horizon. The sun paths and days are longer during summer and shorter during winter. For any location, the maximum altitude of the sun paths at solar noon varies 47° between the winter and summer solstices.
1.2.2 Array OrientationPV arrays should be oriented toward the solar window to receive the maximum amount of solar radiation available at a site, at any time. The closer an array surface faces the sun throughout every day and over a year without being shaded, the more energy that system will produce, and the more cost-effective the PV system becomes with respect to alternative power options.
Similar to sun position, the orientation of PV arrays is defined by two angles. The array azimuth angle is the direction an array surface faces based on a compass heading or relative to due south. North is 0° or 360°, east is 90°, south is 180° and west is 270°. Unless site shading or local weather patterns dictate otherwise, the optimal azimuth angle for facing tilted PV arrays is due south (180° compass heading) in the Northern Hemisphere, and due north in the Southern Hemisphere.
The array tilt angle is the angle between the array surface and the horizontal plane. Generally, the higher the site latitude, the higher the optimal tilt angle will be to maximize solar energy gain. A horizontal array has a zero degree tilt angle, and a vertical array has a 90° tilt angle. The array azimuth angle has no significance for horizontal arrays, because they are always oriented horizontally no matter how they are rotated. See Fig. 13.
For unshaded locations, the maximum annual solar energy is received on a surface that faces due south, with a tilt angle slightly less than the local latitude. This is due to longer days and sun paths and generally sunnier skies during summer months, especially at temperate latitudes. Fall and winter performance can be enhanced by tilting arrays at angles greater than the local latitude, while spring and summer performance is enhanced by tilting arrays at angles lower than the local latitude. Adjustable-tilt or sun-tracking arrays can be used to increase the amount of solar energy received on a daily, seasonal or annual basis, but have higher costs and complexity than fixed-tilt arrays.
2011 Jim Dunlop Solar Solar Radiation: 2 - 1
Figure 13. The orientation of PV arrays is defined by the surface azimuth and tilt angles.
West
North
East
South
Zenith
South-facing array
Southwest-facing array
Tilt Angle
Azimuth Angle
Surface Normal
Surface Direction
Figure 13. The orientation of PV arrays is defined by the surface azimuth and tilt angles.

22 • System Design Copyright © 2019 NABCEP v.8 NABCEP PV Certification Study Guide
Varying the array tilt angle results in significant seasonal differences in the amount of solar energy received but has a smaller impact on the total annual solar energy received. See Fig 14. For stand-alone PV systems installed at higher than tropical latitudes, the optimal tilt angle can significantly reduce the size and cost of the system required to meet a given load. For systems that have winter-dominant loads, arrays should be tilted at an angle of latitude +15°. If the array is being designed to meet a summer-dominant load, the array should to be tilted at an angle of latitude –15° to maximize solar energy collection during summer months.
Take note that summer solstice is the first day of summer, so the sun will be highest in the sky equally the month before summer solstice (the end of spring) and the month after summer solstice. Essentially the spring and the summer have the same sun paths as each other. The winter and fall also have the same sun paths. There are slight differences because the earth’s orbit is slightly elliptical, and the earth is millions of miles closer to the sun in January than it is in July. The tilt of the earth is the major factor in determining solar energy here on earth.
The effects of non-optimal array orientation are of particular interest to PV installers and customers, because many potential array locations, such as rooftops do not have optimal solar orientations. When trade-offs are being made between orientation and aesthetics, having this information available can help the prospective owner and installer make decisions about the best possible array locations and their orientation.
Multiplication factors can be used to adjust PV system annual energy production for various tilt angles relative to the orientation that achieves the maximum annual energy production, and are region specific. See Table 1. These tables help provide a better understanding of the impacts of array orientation on the amount of solar energy received, and the total energy produced by a PV system. In fact, the amount of annual solar energy received varies little with small changes in the array azimuth and tilt angles.
2011 Jim Dunlop Solar Solar Radiation: 2 - 16
Figure 14. Array tilt angle affects seasonal performance.
West
North
East
South
Winter Solstice
Equinoxes
Summer Solstice
ZenithLatitude+15 tilt maximizes fall and winter performance
Close to Latitude tilt maximizes annual performance
Latitude-15 tilt maximizes spring and summer performance
Figure 14. Array tilt angle affects seasonal performance.


24 • System Design Copyright © 2019 NABCEP v.8 NABCEP PV Certification Study Guide
For south-facing arrays, array tilt angles close to 30º (a 7:12 pitch roof ) produce nearly the maximum amount of energy on an annual basis for much of the continental U.S. However, arrays oriented within 45º of due south (SE and SW) produce very close to the same energy (within 7%) as a south-facing array. Since shading losses are often much higher, these orientation losses tend to be smaller than one might expect. Even horizontally mounted (flat) arrays will produce more energy than systems using tilted arrays facing to the east or west.
For some utility-interactive PV system installations, it may be desirable to face an array toward the southwest or even due west, provided that the array tilt is below 45º. Westerly orientations tend to shift the peak array power output to the afternoon during utility peak hours, but do not necessarily maximize the energy production or financial benefit to the system owner if they are not the utility. Some net metering programs offer time-of-use rate structures to encourage the production of energy during utility peak hours. A careful analysis using an hourly computer simulation program is necessary to determine the cost benefit of these orientations. A minimum of six hours of unshaded operation is still important for best system performance.
As higher concentrations of solar is connected the grid, energy needed from traditional energy sources is decreased in the middle of the day and public utility commissions (PUCs) are making policies in places with high penetration of PV that encourage what has been called self-consumption systems. These systems will use energy storage (batteries) when connected
N e w Y o rkT i l t F la t 1 5 º 3 0 º 4 5 º 6 0 º V e r t ic a l
D ire c t io nS o u th 0 .8 7 0 .9 6 1 .0 0 0 .9 8 0 .9 2 0 .6 6
S E ,S W 0 .8 7 0 .9 3 0 .9 4 0 .9 1 0 .8 5 0 .6 2E ,W 0 .8 7 0 .8 5 0 .8 1 0 .7 4 0 .6 7 0 .4 9
F lo r id a
T i l t F la t 1 5 º 3 0 º 4 5 º 6 0 º V e r t ic a lD ire c t io n
S o u th 0 .9 3 0 .9 9 1 .0 0 0 .9 6 0 .8 6 0 .5 7S E ,S W 0 .9 3 0 .9 6 0 .9 6 0 .9 0 0 .8 2 0 .5 7
E ,W 0 .9 3 0 .9 1 0 .8 5 0 .7 7 0 .6 8 0 .4 9
C a l i f o r n iaT i l t F la t 1 5 º 3 0 º 4 5 º 6 0 º V e r t i c a l
D i r e c t io nS o u t h 0 .8 9 0 .9 7 1 .0 0 0 .9 7 0 . 8 9 0 .5 8
S E , S W 0 .8 9 0 .9 5 0 .9 6 0 .9 3 0 . 8 5 0 .6 0E ,W 0 .8 9 0 .8 8 0 .8 4 0 .7 8 0 . 7 0 0 .5 2
A r iz o n a
T i l t F la t 1 5 º 3 0 º 4 5 º 6 0 º V e r t i c a lD i r e c t io n
S o u t h 0 .8 9 0 .9 7 1 .0 0 0 .9 7 0 . 8 9 0 .6 0S E , S W 0 .8 9 0 .9 4 0 .9 5 0 .9 0 0 . 8 3 0 .5 9
E ,W 0 .8 9 0 .8 7 0 .8 2 0 .7 5 0 . 6 6 0 .4 8
Table 1. Array orientation factors can be used to adjust the maximum available solar radiation for non-optimal orientations
Note: The tables and charts showing the effects array orientation on the solar energy received and the energy produced by PV arrays were derived with data generated from PVWatts running simulations for various locations with different array tilt and azimuth angles.
System Design • 25 NABCEP PV Certification Study Guide Copyright © 2019 NABCEP v.8
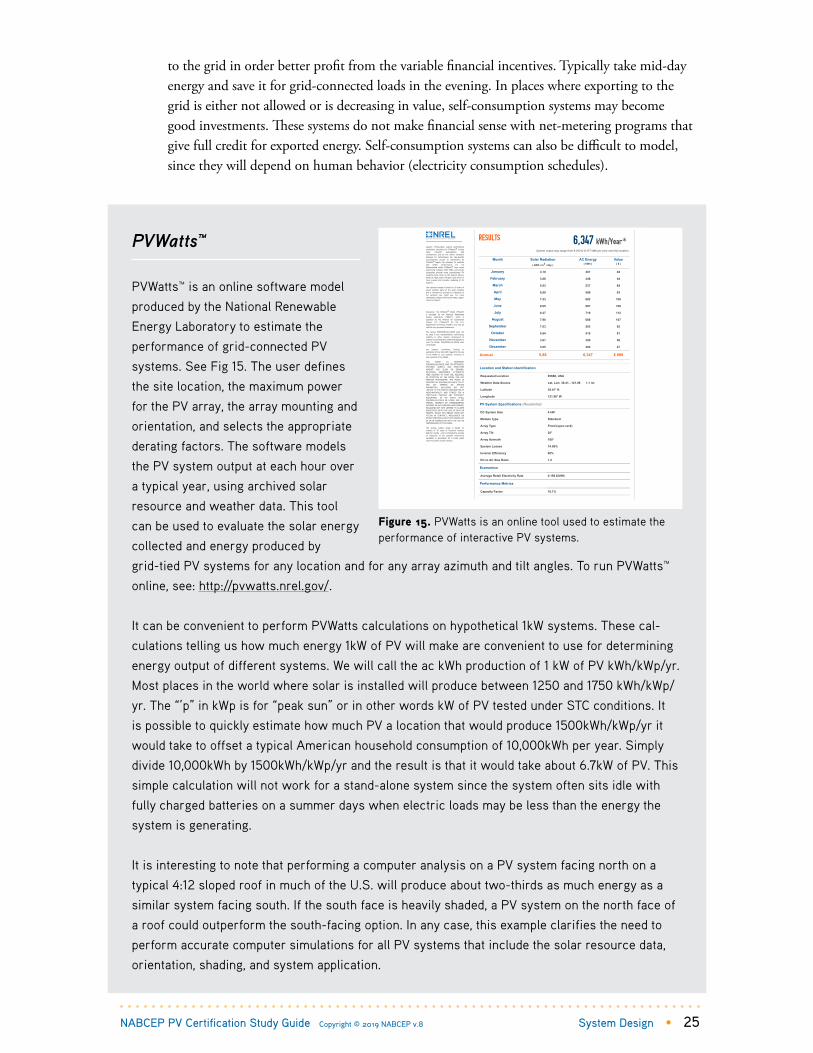
PVWatts™
PVWatts™ is an online software model
produced by the National Renewable
Energy Laboratory to estimate the
performance of grid-connected PV
systems. See Fig 15. The user defines
the site location, the maximum power
for the PV array, the array mounting and
orientation, and selects the appropriate
derating factors. The software models
the PV system output at each hour over
a typical year, using archived solar
resource and weather data. This tool
can be used to evaluate the solar energy
collected and energy produced by
grid-tied PV systems for any location and for any array azimuth and tilt angles. To run PVWatts™
online, see: http://pvwatts.nrel.gov/.
It can be convenient to perform PVWatts calculations on hypothetical 1kW systems. These cal-
culations telling us how much energy 1kW of PV will make are convenient to use for determining
energy output of different systems. We will call the ac kWh production of 1 kW of PV kWh/kWp/yr.
Most places in the world where solar is installed will produce between 1250 and 1750 kWh/kWp/
yr. The “’p” in kWp is for “peak sun” or in other words kW of PV tested under STC conditions. It
is possible to quickly estimate how much PV a location that would produce 1500kWh/kWp/yr it
would take to offset a typical American household consumption of 10,000kWh per year. Simply
divide 10,000kWh by 1500kWh/kWp/yr and the result is that it would take about 6.7kW of PV. This
simple calculation will not work for a stand-alone system since the system often sits idle with
fully charged batteries on a summer days when electric loads may be less than the energy the
system is generating.
It is interesting to note that performing a computer analysis on a PV system facing north on a
typical 4:12 sloped roof in much of the U.S. will produce about two-thirds as much energy as a
similar system facing south. If the south face is heavily shaded, a PV system on the north face of
a roof could outperform the south-facing option. In any case, this example clarifies the need to
perform accurate computer simulations for all PV systems that include the solar resource data,
orientation, shading, and system application.
to the grid in order better profit from the variable financial incentives. Typically take mid-day energy and save it for grid-connected loads in the evening. In places where exporting to the grid is either not allowed or is decreasing in value, self-consumption systems may become good investments. These systems do not make financial sense with net-metering programs that give full credit for exported energy. Self-consumption systems can also be difficult to model, since they will depend on human behavior (electricity consumption schedules).
Figure 15. PVWatts is an online tool used to estimate the performance of interactive PV systems.
3/19/2019 PVWatts Calculator
https://pvwatts.nrel.gov/pvwatts.php 1/1
Caution: Photovoltaic system performancepredictions calculated by PVWatts® includemany inherent assumptions anduncertainties and do not reflect variationsbetween PV technologies nor site-specificcharacteristics except as represented byPVWatts® inputs. For example, PV moduleswith better performance are notdifferentiated within PVWatts® from lesserperforming modules. Both NREL and privatecompanies provide more sophisticated PVmodeling tools (such as the System AdvisorModel at https://sam.nrel.gov) that allow formore precise and complex modeling of PVsystems.
The expected range is based on 30 years ofactual weather data at the given locationand is intended to provide an indication ofthe variation you might see. For moreinformation, please refer to this NREL report:The Error Report.
Disclaimer: The PVWatts® Model ("Model")is provided by the National RenewableEnergy Laboratory ("NREL"), which isoperated by the Alliance for SustainableEnergy, LLC ("Alliance") for the U.S.Department Of Energy ("DOE") and may beused for any purpose whatsoever.
The names DOE/NREL/ALLIANCE shall notbe used in any representation, advertising,publicity or other manner whatsoever toendorse or promote any entity that adopts oruses the Model. DOE/NREL/ALLIANCE shallnot provide
any support, consulting, training orassistance of any kind with regard to the useof the Model or any updates, revisions ornew versions of the Model.
YOU AGREE TO INDEMNIFYDOE/NREL/ALLIANCE, AND ITS AFFILIATES,OFFICERS, AGENTS, AND EMPLOYEESAGAINST ANY CLAIM OR DEMAND,INCLUDING REASONABLE ATTORNEYS'FEES, RELATED TO YOUR USE, RELIANCE,OR ADOPTION OF THE MODEL FOR ANYPURPOSE WHATSOEVER. THE MODEL ISPROVIDED BY DOE/NREL/ALLIANCE "AS IS"AND ANY EXPRESS OR IMPLIEDWARRANTIES, INCLUDING BUT NOTLIMITED TO THE IMPLIED WARRANTIES OFMERCHANTABILITY AND FITNESS FOR APARTICULAR PURPOSE ARE EXPRESSLYDISCLAIMED. IN NO EVENT SHALLDOE/NREL/ALLIANCE BE LIABLE FOR ANYSPECIAL, INDIRECT OR CONSEQUENTIALDAMAGES OR ANY DAMAGES WHATSOEVER,INCLUDING BUT NOT LIMITED TO CLAIMSASSOCIATED WITH THE LOSS OF DATA ORPROFITS, WHICH MAY RESULT FROM ANYACTION IN CONTRACT, NEGLIGENCE OROTHER TORTIOUS CLAIM THAT ARISES OUTOF OR IN CONNECTION WITH THE USE ORPERFORMANCE OF THE MODEL.
The energy output range is based onanalysis of 30 years of historical weatherdata for nearby , and is intended to providean indication of the possible interannualvariability in generation for a Fixed (openrack) PV system at this location.
6,347 kWh/Year*RESULTS
System output may range from 6,200 to 6,477 kWh per year near this location.
Month Solar Radiation( kWh / m2 / day )
AC Energy( kWh )
Value( $ )
January 3.10 307 48
February 3.88 346 54
March 5.63 537 84
April 6.59 598 93
May 7.53 682 106
June 8.05 697 109
July 8.27 719 112
August 7.90 688 107
September 7.03 593 92
October 5.64 519 81
November 3.91 359 56
December 3.05 302 47
Annual 5.88 6,347 $ 989
Location and Station Identification
Requested Location 95688, USA
Weather Data Source Lat, Lon: 38.41, -121.98 1.1 mi
Latitude 38.41° N
Longitude 121.98° W
PV System Specifications (Residential)
DC System Size 4 kW
Module Type Standard
Array Type Fixed (open rack)
Array Tilt 20°
Array Azimuth 180°
System Losses 14.08%
Inverter Efficiency 96%
DC to AC Size Ratio 1.2
Economics
Average Retail Electricity Rate 0.156 $/kWh
Performance Metrics
Capacity Factor 18.1%
26 • System Design Copyright © 2019 NABCEP v.8 NABCEP PV Certification Study Guide
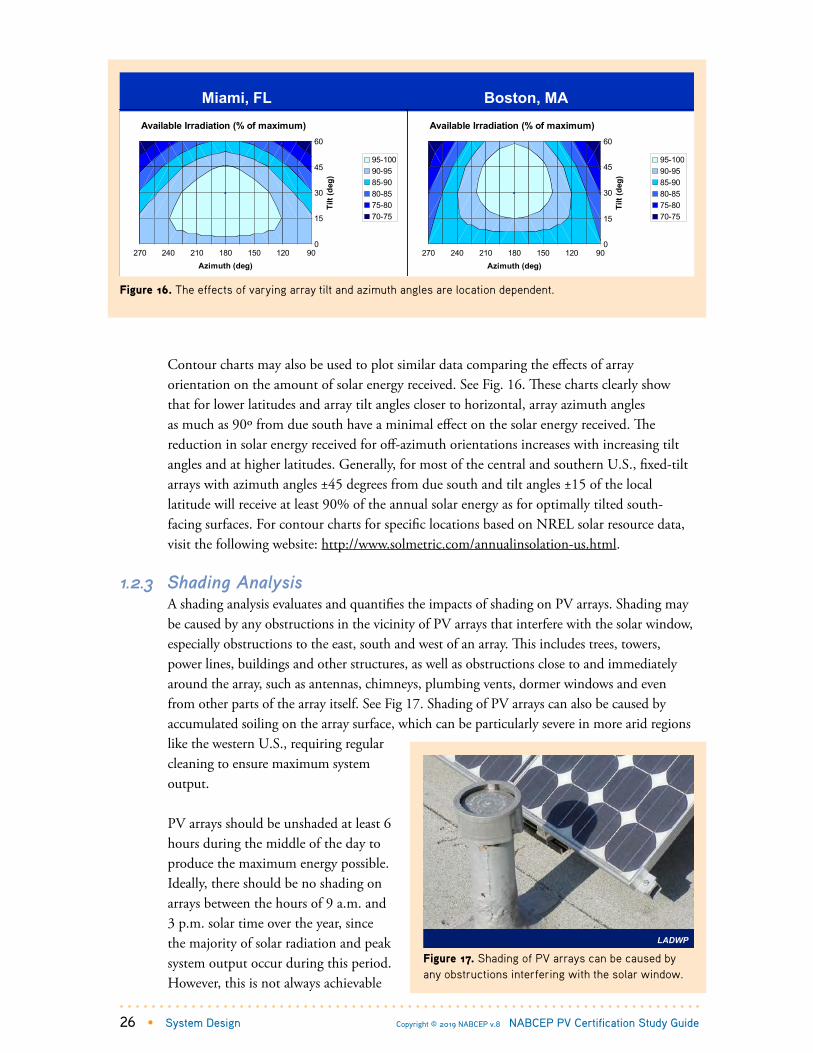
Contour charts may also be used to plot similar data comparing the effects of array orientation on the amount of solar energy received. See Fig. 16. These charts clearly show that for lower latitudes and array tilt angles closer to horizontal, array azimuth angles as much as 90º from due south have a minimal effect on the solar energy received. The reduction in solar energy received for off-azimuth orientations increases with increasing tilt angles and at higher latitudes. Generally, for most of the central and southern U.S., fixed-tilt arrays with azimuth angles ±45 degrees from due south and tilt angles ±15 of the local latitude will receive at least 90% of the annual solar energy as for optimally tilted south-facing surfaces. For contour charts for specific locations based on NREL solar resource data, visit the following website: http://www.solmetric.com/annualinsolation-us.html.
1.2.3 Shading AnalysisA shading analysis evaluates and quantifies the impacts of shading on PV arrays. Shading may be caused by any obstructions in the vicinity of PV arrays that interfere with the solar window, especially obstructions to the east, south and west of an array. This includes trees, towers, power lines, buildings and other structures, as well as obstructions close to and immediately around the array, such as antennas, chimneys, plumbing vents, dormer windows and even from other parts of the array itself. See Fig 17. Shading of PV arrays can also be caused by accumulated soiling on the array surface, which can be particularly severe in more arid regions like the western U.S., requiring regular cleaning to ensure maximum system output.
PV arrays should be unshaded at least 6 hours during the middle of the day to produce the maximum energy possible. Ideally, there should be no shading on arrays between the hours of 9 a.m. and 3 p.m. solar time over the year, since the majority of solar radiation and peak system output occur during this period. However, this is not always achievable
2011 Jim Dunlop Solar Solar Radiation: 2 - 17
Figure 15. The effects of varying array tilt and azimuth angles are location dependent.
270 240 210 180 150 120 900
15
30
45
60
Azimuth (deg)
Tilt
(deg
)
Available Irradiation (% of maximum)
95-10090-9585-9080-8575-8070-75
270 240 210 180 150 120 900
15
30
45
60
Azimuth (deg)
Tilt
(deg
)
Available Irradiation (% of maximum)
95-10090-9585-9080-8575-8070-75
Miami, FL Boston, MA
Figure 16. The effects of varying array tilt and azimuth angles are location dependent.
2011 Jim Dunlop Solar Solar Radiation: 2 - 19
Figure 17. Shading of PV arrays can be caused by any obstructions interfering with the solar window.
LADWP
Figure 17. Shading of PV arrays can be caused by any obstructions interfering with the solar window.

System Design • 27 NABCEP PV Certification Study Guide Copyright © 2019 NABCEP v.8
and tradeoffs are made concerning the specific array location, or mitigating the shading obstructions if possible (e.g., trimming or removing trees, etc.). Even a small amount of shading on PV arrays during peak generation times can dramatically reduce the output of the system. Understanding energy needs can also affect the importance of avoiding shading. Shading from 8am to 9am around summer solstice will reduce energy production more than a shadow from 10am to 11am around winter solstice in much of the US latitudes. However, for a stand-alone system, the winter energy production is likely much more scarce and valuable.
Sun path charts are the basis for conducting shading evaluations. By measuring the worst-case altitude and azimuth angles of a shading object from an array location, a scale image of the obstruction can be plotted on a sun position chart for the given latitude. This shows the portion of the solar window that is obstructed by shading. Knowing the amount of receivable solar energy during different periods of a day, the shading analysis can be used to estimate the reduction in solar radiation received during the shaded times of the day and year, and ultimately estimate the reduced energy production for a PV system. These are the fundamental principles used for a shading analysis. Most system design and performance estimating tools also incorporate shading factors to derate the system output accordingly.
To simplify shading evaluations, several devices and software tools have been commercially developed. See Fig. 18. These devices are all based on sun path charts and viewing the solar window at proposed array locations. The devices project or record obstructions in the solar window, and estimate the net solar energy received after shading. PV installers should be familiar with these tools, their principles of operation and how to obtain accurate results. More elaborate architectural software tools, such as Google Sketch-up and CAD programs can allow designers to simulate complex shading problems and provide detailed designs and renderings of proposed PV installations.
Sources for shading evaluation tools and software include:• Solar Pathfinder™: www.solarpathfinder.com• Solmetric SunEye™: www.solmetric.com• SketchUp™: www.sketchup.com
2011 Jim Dunlop Solar Solar Radiation: 2 - 20
Figure 18. Various devices are used to determine the extent of shading for potential PV array locations.
Solar Pathfinder
Solmetric SunEye
Wiley ASSET
Figure 18. Various devices are used to determine the extent of shading for potential PV array locations. 2011 Jim Dunlop Solar Solar Radiation: 2 - 20
Figure 18. Various devices are used to determine the extent of shading for potential PV array locations.
Solar Pathfinder
Solmetric SunEye
Wiley ASSET
2011 Jim Dunlop Solar Solar Radiation: 2 - 20
Figure 18. Various devices are used to determine the extent of shading for potential PV array locations.
Solar Pathfinder
Solmetric SunEye
Wiley ASSET
Solar Pathfinder Solmetric SunEye Wiley ASSET

28 • System Design Copyright © 2019 NABCEP v.8 NABCEP PV Certification Study Guide
If a device such as a Solmetric SunEye calculates the impact of shading based on the orientation and location of the PV array. If the output of the shade calculation is a loss of production per month, it can be used with other software simulators as an input for shading losses. If the output is kWh/kWp/month, then it is possible to double-count orientation losses since the shade calculator is also calculating orientation losses.
Computer Aided Design (CAD) software, such as Sketchup and Autocad do not give shading derating factors. They will often tell us where the shadow will be, but there are many variables with shading, such as weather and atmospheric density which solar software modeling, such as PVWatts can calculate, but a typical CAD program cannot.
For larger PV systems with multiple parallel rows one in front of another in the array, one row of modules can shade the one in back during winter months if the rows are too closely spaced. A six-inch shadow from an adjacent row of modules is capable of shutting down an entire string or row of modules depending on the direction of the shadows and the electrical configuration of the array. A simple rule for minimum spacing between rows is to allow a space equal to three times the height of the top of the row or obstruction in front of an array. This rule applies to the spacing for any obstructions in front of an array.
For example, if the height of an array is three (3) feet, the minimum separation distance should be nine (9) feet since the height of the adjacent row if it is three feet above the front of the next row. See Fig. 19. In the southern half of the United States, a closer spacing may be possible, depending on the prescribed limits to avoid shading. However, even at the lowest latitudes the spacing should not be less than two times the height of the top of the adjacent module. Multiple rows of PV arrays can also be more closely spaced using lower tilt angles,
2011 Jim Dunlop Solar Solar Radiation: 2 - 21
Figure 19. Multiple rows of rack-mounted PV arrays must be separated far enough apart to prevent shading.
D
Sun
PV Array H
β
Figure 19. Multiple rows of rack-mounted PV arrays must be separated far enough apart to prevent shading.

System Design • 29 NABCEP PV Certification Study Guide Copyright © 2019 NABCEP v.8
and even with the orientation penalty of a lesser tilt angle, it is usually a better option than to suffer shading losses.
The minimum required separation distances between PV array rows and other obstructions depends on latitude, the height of the obstruction, and the time of day and year that shading is desired to be avoided. To avoid shading at the winter solstice between 9 a.m. and 3 p.m. solar time, the separation distance between PV arrays and obstructions should be at least 2 times the height of the obstruction at latitudes around 30°, 2-1/2 times the height at latitudes around 35°, 3 times the height at 40° latitude and 4 times the height at 45° latitude. See Fig. 20.
Modeling using software is now common since the analysis is complex and should take many factors into consideration, including available space, tilt angle, PV price, energy exporting, loads, weather patterns, irradiance, etc.
Tilt angles decrease on low slope commercial roof systems to reduce wind-loading and to maximum the size of the PV array. Often a tilt angle of around 10 degrees is used to maximize roof space by needing less space between rows and leaving enough of a tilt in order to allow drainage, so that dust and debris do not end up pooling where the lip of the frame of the PV module is higher than the glass.
With thin film modules, the solar cells are arranged in stripes and if the orientation of the stripes are vertical, then shading can be proportional to the shadow, since each cell is shaded equally in a PV source circuit, which is unusual for PV. Since most PV modules are made of crystalline PV cells arranged in series, the effects of shading are worse than proportional to the shadow area because of how current flows in the module.
2011 Jim Dunlop Solar Solar Radiation: 2 - 22
Figure 20. The minimum required separation distances between PV array rows and other obstructions depends on latitude, the height of the obstruction, and the time of day and year.
D
Separation Factor vs. Latitude for South-Facing Array Rows To Avoid Shading on Winter Solstice at Specified Solar Time
0
2
4
6
8
10
12
10 15 20 25 30 35 40 45 50 55 60
Latitude (deg N)
Sepa
ratio
n Fa
ctor
, Dis
tanc
e/He
ight
(D/H
) 8 am - 4 pm
9 am - 3 pm
10 am - 2 pm
11 am - 1 pm
Figure 20. The minimum required separation distances between PV array rows or other obstructions depends on latitude, the height of the obstruction, and the time of day and year to avoid shading.

30 • System Design Copyright © 2019 NABCEP v.8 NABCEP PV Certification Study Guide
1.2.4 Array Mounting MethodsPV arrays can be mounted on the ground, rooftops and other structures that provide adequate protection, support and solar access. The site conditions usually dictate the best mounting system location and approach to use.
Rooftops are very popular locations for installing PV arrays. Because they are elevated, roof mounts offer some physical protection and limited access to the array for safety, and usually provide better sun exposure. Rooftop PV installations also do not occupy space on the ground that might be needed for other purposes. Rooftop and other building-mounted PV arrays must be structurally secured and any attachments and penetrations must be properly weather-sealed. Available rooftop areas for mounting PV arrays may be limited by any number of factors, including required spaces about the array for installation and service, pathways and ventilation access for fire codes, wind load setbacks, and spaces for other equipment. Sloped roofs also present a significant fall hazard, and require appropriate fall protection systems and/or personal fall arrest systems (PFAS) for installers and maintenance workers.
The layout of a PV array can have a significant effect on its natural cooling and operating temperatures. A landscape (horizontal) layout may have a slight benefit over a portrait (vertical) layout when considering the passive cooling of the modules. Landscape is when the dimension parallel to the eaves is longer than the dimension perpendicular to the eaves. In a landscape layout, air spends less time under the module before escaping and provides more uniform cooling. Standoff mounts operate coolest when they are mounted at least 3 inches above a roof.
Key items to evaluate during a site survey for roof-mounted PV arrays include:• Building type and roof design• Roof dimensions, slope and orientation• Roof surface type, condition and structural support• Fall protection methods required• Access for installation and maintenance• Fire setbacks• Rapid Shutdown requirements
Ground-mounted PV arrays are commonly used for larger systems, or where rooftop installations are not possible or practical. Ground-mounts can use a variety of racks, poles and other foundations to support the arrays. Ground-mounted arrays are generally more susceptible to damage than roof-mounted arrays, although their location and orientation is less constrained than for rooftop installations. If an array is mounted at ground level, the NEC [690.31(A)] requires that the wiring be protected from ready access. Several options may be possible to meet this requirement, including protecting the wiring with non-conductive screening like PVC, limiting access with security fencing, or by elevating the array. Elevating arrays also provides physical protection, and usually helps avoid shading concerns that may exist at lower heights.

System Design • 31 NABCEP PV Certification Study Guide Copyright © 2019 NABCEP v.8
Site surveys for ground-mounted PV arrays should consider:• Zoning and land use restrictions• Terrain, elevations and grading requirements• Soil type and array ground-cover• Water table, flood zones and drainage• Array foundation requirements• Security requirements and fencing• Access for vehicles, equipment and maintenance
The following are types of PV array mounting systems:
Integral mounting systems are where modules are integrated into the roofing or building exterior. These systems are sometimes referred to as building-integrated PV or BIPV.
Standoff mounting, referred to by some as flush mounting, uses standoffs attached to the roof to support rails on which PV modules are attached. This is the most common method for residential installations. See Fig. 21.
Ballasted mounting systems are often used in large-scale flat roof commercial projects. These mounting systems require engineering for roof structural loading and ballast requirements. Often roof tethers augment the ballast for seismic concerns or excessive wind requirements. See Fig. 22.
Rack mounting is typically used for non-tracking systems at ground level and on flat rooftops. This method is typical on large commercial or utility-scale arrays.
2011 Jim Dunlop Solar Solar Radiation: 2 - 23
Figure 21. Standoff mounts are the most common way PV arrays are attached to sloped rooftops.
Gary Lee Sharp Solar
2011 Jim Dunlop Solar Solar Radiation: 2 - 23
Figure 21. Standoff mounts are the most common way PV arrays are attached to sloped rooftops.
Gary Lee Sharp Solar
2011 Jim Dunlop Solar Solar Radiation: 2 - 23
Figure 21. Standoff mounts are the most common way PV arrays are attached to sloped rooftops.
Gary Lee Sharp SolarFigure 21. Standoff mounts are the most common way PV arrays are attached to sloped rooftops.
2011 Jim Dunlop Solar Solar Radiation: 2 - 24
Figure 22. Self-ballasted PV arrays are a type of rack mount that relies on the weight of a the PV modules, support structure and additional ballast material to secure the array.
Ascension Technology
University of Wyoming
2011 Jim Dunlop Solar Solar Radiation: 2 - 24
Figure 22. Self-ballasted PV arrays are a type of rack mount that relies on the weight of a the PV modules, support structure and additional ballast material to secure the array.
Ascension Technology
University of Wyoming
2011 Jim Dunlop Solar Solar Radiation: 2 - 24
Figure 22. Self-ballasted PV arrays are a type of rack mount that relies on the weight of a the PV modules, support structure and additional ballast material to secure the array.
Ascension Technology
University of Wyoming
Figure 22. Self-ballasted PV arrays are a type of rack mount that relies on the weight of a the PV modules, support structure and additional ballast material to secure the array.

32 • System Design Copyright © 2019 NABCEP v.8 NABCEP PV Certification Study Guide
Pole mounting, is typically used with manufactured racks mounted on top or attached to the side of a steel pole. Pole-top arrays are sometimes used for off-grid residential PV systems, since the weight of the array is balanced over the pole, allowing easy seasonal adjustment. Side-of-pole mounts are most common in small one- or two-module applications where Wthe entire system, such as remote telemetry application, is mounted on a single pole. See Fig. 23.
Tracking mounting systems are systems that follow the sun on a daily or seasonal basis. Tracking may increase summer gain by 30% or more, but winter gain may be 15% or less. Tracking may be two-axis for maximum performance or single-axis for simplicity and reliability. See Fig. 24.
Seasonal adjusting and tracking systems have become less common as the price of PV drops and it is cost-effective to install more PV to compensate for the potential increase in energy from seasonal tilting. The one exception to this trend is the horizontal-axis tracking systems used in large-scale PV systems. These large tracking arrays will face east in the morning, be flat midday and face west in the afternoon. These trackers need less maintenance than more complicated tracking systems, and they produce more energy in the mornings and afternoons, while producing a little less when flat at noontime. This production profile is often favorable to the increasingly PV saturated grid.
2011 Jim Dunlop Solar Solar Radiation: 2 - 25
Figure 23. Pole-mounted arrays use either fixed, adjustable, or sun-tracking arrays installed on a rigid metal pipe.
2011 Jim Dunlop Solar Solar Radiation: 2 - 25
Figure 23. Pole-mounted arrays use either fixed, adjustable, or sun-tracking arrays installed on a rigid metal pipe.
Figure 23. Pole-mounted arrays use either fixed, adjustable, or sun-tracking arrays installed on a rigid metal pipe.
2011 Jim Dunlop Solar Solar Radiation: 2 - 26
Figure 24. Sun-tracking arrays are typically mounted on poles and increase the amount of solar energy received.
NREL, Warren Gretz
2011 Jim Dunlop Solar Solar Radiation: 2 - 26
Figure 24. Sun-tracking arrays are typically mounted on poles and increase the amount of solar energy received.
NREL, Warren GretzFigure 24. Sun-tracking arrays can be mounted on poles and increase the amount of solar energy received.

System Design • 33 NABCEP PV Certification Study Guide Copyright © 2019 NABCEP v.8
Another interesting application that will change the production profile in a similar fashion is an east-west tilt system. There are ballasted racking systems that fill up the rooftop (no need for spaces between rows) and have east and west facing PV.
Roof Structure and ConditionAn important consideration for roof-mounted PV arrays is to assess the condition of the roofing system and determine whether the roof and its underlying structure can support the additional load.
Structural loads on buildings are due to the weight of building materials, equipment and workers, as well as contributions from outside forces like hydrostatic loads on foundations, wind loads and seismic loads. The requirements for determining structural loads on buildings and other structures are given in the standard ASCE 7 – Minimum Design Loads for Buildings and other Structures, which has been adopted into the building codes. A structural engineer should be consulted if the roof structure is in question, or if specific load calculations are required for local code compliance.
Common stand-off roof-mounted PV arrays, including the support structures generally weigh between 3 and 5 pounds per square foot (psf ), which should be fine for most roofs designed to recent standards. Generally, houses built since the early 1970’s have been through more rigorous inspection and tend to have more standard roof structures than those built prior to that period. If the attic is accessible, a quick inspection of the type of roof construction, including photos, is worthwhile, and will help determine the appropriate attachment system to use for the array. Span tables are available in various references, which can help quantify the load-bearing capabilities of roof trusses or beams. For further information see: www.solarabcs.org/permitting.
Wind loads are a primary concern for PV arrays, especially in hurricane-prone regions. The design wind loads for PV arrays in some Atlantic and Gulf coastal regions can exceed 50 pounds per square foot (psf ) and greater on certain portions of a roof or structure. While common stand-off PV arrays do not generally contribute to any additional wind loads on a structure, the array attachment points to the structure or foundation must be of sufficient strength to withstand the design loads.
For example, a 15 square-foot PV module could impose an uplift load of 750 pounds under a design load of 50 psf. A panel of four of these modules can impose a load of 3,000 pounds on the entire mounting structure. If the panel is secured by six roof attachments, and if the forces are distributed equally, there would be a 500-pound force on each attachment, and it must be designed and installed to resist this maximum uplift force. Several manufacturers of roof mounting systems provide engineering analysis for their mounting systems and attachment hardware. Without this documentation, local inspectors may require that a custom mounting system have a structural analysis from a professional engineer for approval. This engineering documentation easily justifies the additional costs of purchasing mounting hardware from a qualified mounting system manufacturer.

34 • System Design Copyright © 2019 NABCEP v.8 NABCEP PV Certification Study Guide
1.3 Configure Mechanical Design Task 41.3.1 Roof Mounting
ResidentialThe age and condition of the roof covering must also be evaluated. If the roof covering is due for replacement within the next 5 to 10 years, it typically makes sense to roof the building before installing the PV system, as the array would need to be removed and replaced before and after the roofing work. Different types of roof coverings have different lifetime expectations and degradation mechanisms, and wherever roofing issues are a concern for PV installation, it is highly advisable to engage a licensed roofing contractor in the project.
With a typical composition asphalt shingle residential roof, sometimes you can find 3 layers of roofing material installed over the decades. The weight of one layer is often close to the weight of the PV system. If there are already 2 layers of roofing material on the roof, it is generally not a good idea to install PV without reroofing.
Before recommending or deciding on any PV array mounting system, verify with the mounting system supplier that the hardware is appropriate for the given application. Also, it is generally not advisable to try to fabricate or copy a mounting system design for smaller projects. This usually costs much more than purchasing a pre-engineered system and may not meet the structural or environmental requirements of the application. PV array mounting structures also must be electrically connected to the equipment grounding system, and special bonding jumpers and connectors are available to maintain electrical continuity across separate structural components. Oftentimes, local jurisdictions require engineering documentation to certify the structural integrity of the mounting system and attachments.
CommercialPV arrays are mounted on large commercial buildings with low-slope (flat) composition and single-ply membrane roofs using a variety of racking systems. These mounting structures may be secured by fasteners and physical attachments to the building structure, or by using ballasted racking, or a combination of both to hold the array in place.
Ballasted mounting systems are significantly heavier than mounting systems designed for direct structural attachments, depending on the weight of ballast used, and usually require special load calculations. The main advantages of ballasted mounts include easier installation, and by eliminating direct structural attachments and penetrations into the structure, the possibility of roof leaks is greatly diminished. Ballasted mounting systems are engineered for specific wind loads and roof structures, and have very specific requirements on how to install the array. Even when wind loading is not a concern, additional restraints may be required on ballasted arrays for seismic loads.
The roof warranties for expensive industrial roofs should be maintained. Without directly addressing the warranty requirements, the roof warranty can be voided by performing modifications not certified by the roofing product manufacturer. If the single-ply membrane is being replaced in preparation for the PV array installation, it is recommended that a fire-resistant coverboard be installed under the new membrane to improve the fire performance of the roof.

System Design • 35 NABCEP PV Certification Study Guide Copyright © 2019 NABCEP v.8
1.3.2 Size the Module Mounting AreaIf a roof is selected for the array location, then it is necessary to determine whether the roof is large enough for the proposed number of PV modules. For roof areas with non-rectangular shapes, determining the amount of useable roof area can be a challenge.
When laying out a plan for mounting modules on a roof, access to the modules must be provided for maintenance. For easiest access, a walkway should be provided between rows of modules. However, this consumes valuable roof area, so a balance needs to be made between the area for the array and access. New requirements in the 2015 International Fire Code [IFC 605.11] require clear space at the edges and peaks of roofs for firefighter access. This poses a challenge to roof-mounted PV systems. Often, only 50% to 80% of the roof area that has a more suitable orientation can be used for mounting modules when room for maintenance, wiring paths, firefighter access and aesthetic considerations are taken into account.
To determine the size of the PV array (ultimately the power rating of the system) that can be installed, the usable roof area must be first established. The dimensions and orientation of individual modules may allow various layouts for the array that ultimately need to fit within the usable areas of the roof. The location of structural attachments, the desired electrical configuration, and wire routing are also important considerations when determining the best layout. Computer-aided drawing tools can be helpful in determining possible acceptable array layouts given module and roof dimensions.
Smaller array surface areas are required to generate the same amount of power with higher efficiency modules. By definition, a 15% efficient PV module has a power density of 150 W/m2 (approximately 15 W/sf) peak power output when exposed to 1000 W/m2 solar irradiance. Crystalline silicon PV modules may have efficiencies 15% to 20% and higher for special higher-price models. Higher efficiency modules means less support structure, wiring methods and other installation hardware are required for an array. Many thin-film PV module technologies have efficiencies below crystalline silicon, and require correspondingly larger array areas to produce an equal amount of power.
For example, consider a roof with overall dimensions of 14’ by 25’ (350 sf ) with a usable area of 250 sf (71% of total). This roof area would be sufficient for a 3.75 kW 15% efficient crystalline silicon array (250 sf x 15 W/sf= 3750 W) or an 8% efficient amorphous silicon thin film array of about 2 kW. Cadmium Telluride is the most common thin film and can be as efficient as some crystalline silicon PV.
1.3.3 Arrange Modules in Mounting AreaSiting the PV array in the available mounting area can have a large impact on the performance of a PV array. In addition to shading and orientation, the array layout must be consistent with the electrical string layout. A string is a series-connection of PV modules in an array. Each set of modules in a series string must be oriented in the same direction if the string is to produce its full output potential. For example, if a string has 12 modules in series, all 12 modules must be in the same or parallel planes of a roof and ideally be shade-free at the same time. It is possible to split a string between two roof faces, provided the modules face the same direction. The outputs of multiple strings having similar voltage but using different current output modules or facing different directions may be connected in parallel.

36 • System Design Copyright © 2019 NABCEP v.8 NABCEP PV Certification Study Guide
Historically, this characteristic of string inverters has posed a design challenge on many residential projects. For instance, a roof may be large enough to hold 24 modules on the south and west faces together. However, the south face may be large enough to mount 16 modules and the west face only large enough to mount 8 modules. If the inverter requires 12 modules in series, the west face is not usable and the south face will only permit 12 modules to be installed. This means that only half the potential array area can be utilized by that string inverter system. This example suggests that it might be reasonable to find an inverter with lower input voltage that only requires 8 modules in series and configure the array as three series strings of 8 modules. Most newer string inverters have multiple separate inputs with wide operating ranges to accommodate strings of different numbers of modules.
Other options for maximizing the amount of PV that can go onto a rooftop is using module level power electronics (MLPE). MLPE include microinverters and dc-to-dc converters (optimizers) connected directly to the PV modules. MLPE can have maximum power point tracking (MPPT) on the individual PV module level. Other benefits of having electronics under each PV module include the ability to shutdown at PV system at the module level so that firefighters can more safely respond to an emergency.
1.3.4 Fasteners Selection CriteriaIf the chosen design calls for installation on a sloped roof, most mounting systems are fastened solidly to the roof trusses or rafters rather than the roof decking. Depending upon the type of roof, the mounts need to be attached in a manner that will ensure that the roof will not leak at the penetrations. The residential building code now requires that all roof penetrations be flashed to prevent roof leakage. Products exist for flashing any roof type so compliance with this requirement is possible regardless of the roof type. Methods that do not attach directly to structural members require engineering and preferably product certification by the appropriate organization. For mounting systems, the ICC Evaluation Service is a typical choice for these types of certifications. Commercial rooftop PV systems often use ballasted mounting systems to secure the PV array on the roof. These ballasted systems require detailed engineering reports and evaluations to ensure that the wind loading and dead loading issues of the system have been properly addressed. Several companies that manufacture these systems provide professional engineering services to certify the drawings for submittal to the local jurisdiction. Some locations cannot use ballasted systems because of excess design wind speeds. Some designs allow for a combination of ballast and roof attachments to allow installation in high wind zones and high seismic zones.
Materials used for mounting structures and fasteners must be suitable for the environment and compatible with other materials they contact. In dry areas such as Southwestern United States, a plated steel fastener may not degrade much with time. In high corrosion environments, such as Florida, it is essential that fasteners be corrosion-resistant stainless steel. Manufacturers of commercial array mounts and racks generally supply the mounts with stainless steel hardware to be sure it will be adequate for most installation locations and site conditions. Materials for array mounts can also vary widely depending upon environmental requirements. In some areas, painted wooden mounts may be acceptable, while other locations require mounts made of galvanized steel or aluminum. A common structural material used for commercial array mounts is corrosion resistant aluminum of various alloys such as 6061 or 6063 aluminum.

System Design • 37 NABCEP PV Certification Study Guide Copyright © 2019 NABCEP v.8
Aluminum develops a thin oxide coating very quickly, and this coating prevents further oxidation. Anodizing is common with aluminum extrusions and can improve the corrosion resistance and aesthetics. Stainless steel is generally too expensive for structural materials, even though it is highly corrosion resistant. The combination of aluminum structural members and stainless steel fasteners is a practical solution to minimizing the cost while maximizing long-term structural reliability.
Lag Screw FastenersThe withdrawal load is the force required to remove a screw by pulling in line with the screw. The pull strength increases as the diameter of the screw increases and is directly proportional to the length of the screw thread imbedded in the wood. When a lag screw must pass through a metal L-bracket, then roof shingles and roof membrane, nearly one inch of the length of the screw does not enter rafter or truss. Also note that many lag screws in lengths over one inch are not threaded the entire length of the screw. Pilot or lead holes must be drilled for lag screws, typically in the range of 67%-80% of the lag screw shank diameter. Larger pilot holes are required for hard woods than for soft woods. Note that actual pull strengths will vary depending upon the wood that is used, and this is why using safety factors of four or more is not unusual. A safety factor of four simply means that if withdrawal strength of X pounds is needed, then the design requires withdrawal strength of 4X pounds. The allowable withdrawal loads for various lag screw sizes driven into the side grain of four common types of kiln-dried wood can be easily calculated. See Fig. 25.
The minimal wind loading of a PV array occurs when the array is mounted parallel to the roof surface at height of 6 inches or less and at least three feet away from the edges of the roof. In regions with high design wind speeds, it is best to keep the modules away from the edges of the roof.
Some roof structures above cathedral ceilings have structural insulated panels (SIPS) and may require the mounting screws to penetrate a sandwich of foam insulation between two layers of decking before the screw will enter a support beam. Other cathedral roof structures are built over scissors trusses with the insulation above the ceiling rather than under the roof decking. If there is any uncertainty over the roof composition, roof loads, uplift loads, or roof materials, the installer should consult with a structural engineer, professional roofer, or building contractor.
1.3.5 BOS LocationsAny site survey also includes identifying proposed locations for all BOS components, including inverters, disconnects, overcurrent devices, charge controllers, batteries, junction boxes, raceways, conductors and any other electrical apparatus or mechanical equipment associated with the system. The PV installer must ensure that all equipment locations are suitable for the intended equipment.
2011 Jim Dunlop Solar Cells, Modules and Arrays: 5 - 84
Figure 81. Allowable withdrawal loads for lag screws in lumber depend on the density and species of the wood, the diameter of the screw, and the thread penetration depth.
Lumber Type > Douglas Fir Southern Yellow Pine
White Spruce
Screw Nominal Shank Diameter (in) Specific Gravity
0.51 0.58 0.45
1/4 232 281 192
5/16 274 332 227
3/8 314 381 260
Allowable Withdrawal Loads for Lag Screws (lb/in)
Includes a factor of safety of 4 X
Figure 25. Allowable withdrawal loads for lag screws in lumber depend on the density and species of the wood, the diameter of the screw, and the thread penetration depth.

38 • System Design Copyright © 2019 NABCEP v.8 NABCEP PV Certification Study Guide
Considerations for BOS locations include providing for accessibility to the equipment for installation and maintenance. Some BOS components may need to be installed in weather-resistant or rain-tight enclosures if they are not installed indoors. Other components, including many utility-interactive inverters, may already be rated for wet and outdoor locations. Minimum clearances and working spaces are required for electrical equipment that may be serviced in an energized state. Dedicated clear spaces are also required above and in front of all electrical equipment. These and many other installation requirements are outlined in Article 110 of the NEC: Requirements for Electrical Installations.
Avoid installing electrical equipment in locations exposed to high temperatures and direct sunlight wherever possible, and provide adequate ventilation and cooling for heat-generating equipment such as inverters, generators and chargers. Considerations should also be taken to protect equipment from insects, rodents, and other debris. All electrical equipment must be properly protected from the environment unless the equipment has applicable ratings. This includes protection from dust, rain and moisture, chemicals and other environmental factors. All electrical equipment contains instructions on the proper installation of the equipment, and for the environmental conditions for which it is rated.
Some equipment has special considerations, covered under different sections of the electrical and building codes, and in manufacturer’s instructions. For example, battery locations should be protected from extreme cold, which reduces their available capacity. Battery containers and installation must follow the requirements in NECn480 or Article 706 Energy Storage Systems. The requirements for stand-alone systems have been moved from 690.10 to Article 710 Stand-Alone Systems. Major components are generally located as close together as possible, and to the electrical loads or services that they supply, in order to minimize the length of conductors, voltage drop and the costs for the installation.
1.4 Configure Electrical Design Task 51.4.1 Inverter Selection Criteria
String inverters, central inverters, microinverters and dc-to-dc convertersA string inverter is an inverter where source circuits (strings) come to an inverter. String inverters typically range in size from a few kW to 100kW. 100kW string inverters are mostly used for large utility scale PV systems. Often times 1 to 3 source circuits will go to a single MPP input. By having no more than 2 strings per input, we can avoid string fusing and we can more easily monitor string production and determine where there are problems, such as arc faults or failures.
A large central inverter (greater than 200 kW) is used for large-scale PV systems and will typically have PV source circuits connected at a dc combiner in the area of the array and then have PV output circuits coming together at the large inverter. Dc arc-fault protection can be at the dc combiner to protect the PV source circuits, but it is technically difficult if not impossible to detect individual PV source circuit arc-faults on large PV output circuits. To learn more about arc-fault protection requirements see 690.11 or 691.10.
A microinverter is often defined as an inverter that is connected to a single PV module. With an interactive (grid-tied) inverter connected to a module, we have the benefits of the ac circuit being off whenever utility power is off. Also there is MPPT at the module level and an easy

System Design • 39 NABCEP PV Certification Study Guide Copyright © 2019 NABCEP v.8
learning curve for electricians that are most comfortable working with ac power. There are however more points of failure and a greater expense to have a separate inverter at each module.
Dc-to-dc converters are also often called power optimizers and still require dc to ac conversion at an inverter. These systems do MPPT at the module level and can shutdown a PV system at the module level for safety.
1.4.2. Confirm String Size CalculationsPV array source circuits are usually designed to meet the voltage requirement of connected dc utilization equipment, such as batteries, charge controllers, or interactive inverters. All dc equipment must also have appropriate current ratings for the given PV array and source circuit currents. The PV array must also operate within acceptable voltage limits for the dc equipment, over all temperatures.
Battery charging applications require the PV array maximum power voltage to be greater than the battery regulation voltage at the highest array operating temperatures. This helps ensure that the maximum PV array current is delivered to the battery. Maximum power point tracking charge controllers permit the use of much higher array voltages than the battery voltage. See Fig. 26.
The experienced PV installer should be able to identify the advantages and disadvantages of systems that operate at different dc voltages, ranging from 12 V systems to systems operating up to 600 V and greater where permitted. The major disadvantage of lower voltage systems are much higher currents for the same power levels, requiring much larger and more expensive conductors, overcurrent devices and switchgear. For example, the currents in a 12 V system are twice as high as currents in a 24 V system, and four times as high as for 48 V systems. These higher currents require significantly larger wire sizes. In fact, to maintain a voltage drop within certain limits, say 3%, for the same load at 24 V as opposed to at 12 V, the allowable wire resistance is 4 times as high as for the 12 V loads because the 24 V system reduces the current by half and the percentage voltage drop is based on twice the voltage as 12 V.
Interactive inverters can usually handle PV array dc power input levels 110% to 130% or more of the continuous ac output power rating, especially in warmer climates. Inverters
Figure 26. Generally, 36 series-connected silicon solar cells are needed to provide adequate maximum power voltage to fully charge a 12 volt lead acid-battery. MPPT charge controllers can optimize dc voltages on each side of the charge controller, so that PV voltage is different than battery charging voltage. The example in this figure is not using a MPPT charge controller.
2011 Jim Dunlop Solar Cells, Modules and Arrays: 5 - 42
Figure 40. Generally, 36 series-connected silicon solar cells are needed to provide adequate maximum power voltage to fully charge a lead acid-battery.
PV module maximum power voltage must be higher than battery voltage at highest operating temperature
Voltage (V)
Cur
rent
(A)
Module with 36 series-connected cells operating at temperature of 50 C (optimal)
10 20
Operating voltage range for 12-volt lead-acid battery:11.5 to 14.5 volts.
Maximum power points
Module with 30 series-connectedcells at 50 C (voltage too low todeliver maximum current to battery)
Module with 42 series-connected cells at 50 C (voltage is more than adequate for charging, but power is wasted)

40 • System Design Copyright © 2019 NABCEP v.8 NABCEP PV Certification Study Guide
thermally limit array dc input and array power tracking at high temperatures and power levels. PV array must also not exceed the maximum dc input current limits for the inverter.
Array voltage requirements the most critical part of sizing arrays for interactive inverters. Array voltage is affected by the site ambient temperature range and the array mounting system design. The array voltage must be above the minimum inverter operating and MPPT voltage during hottest operating
conditions, factoring in annual array voltage degradation of 0.5% to 1% per year. Array voltage must also not exceed 600 Vdc or the maximum inverter operating voltage during the coldest operating conditions. Exceeding maximum voltage limits violates the NEC and can void manufacturer warranties. The proper approach is to use the ASHRAE 2% minimum design temperatures to determine maximum array voltage. See Fig. 27.
1.4.3. Review System Components SelectionThe PV installer is often required to make judgments and recommendations concerning the system design based on a variety of factors including site considerations and customer needs. The installer is often required to review or modify designs based on the application requirements, and they must ensure that the overall installation meets code requirements. It is not unusual for something to be left out of a design, and the installer may be responsible for identifying these discrepancies in the design review process. The installer should also know when and where to consult an experienced system designer when design issues extend beyond the installer’s capabilities.
Differentiating Among Available Modules and InvertersBoth PV modules and inverters used in PV systems are subject to UL standards and must be listed and approved for the application to meet code compliance. Inverters intended for use in interactive PV systems, or with ungrounded PV arrays must be specially labeled. Likewise ac modules, special modules manufactured with built-in inverters much be clearly labeled as ac modules with the appropriate specifications.
Product approval usually only provides a measure of safety and is not indicative of field performance or reliability. There are relatively few resources to find comprehensive and unbiased analyses on the field performance of these products, but certain periodicals provide annual reviews, results from independent testing, and comments from installers. Online forums are another good place to find out more about products. Manufacturer’s specifications are based on laboratory tests, and it is important to recognize that field performance is far more dynamic. A given product may perform quite well under one set of conditions but under-perform in other conditions (e.g. at given temperatures, voltages, etc.). Reference: CEC eligible equipment website: www.consumerenergycenter.org.
Figure 27. Properly configuring PV arrays for interactive inverters involves an understanding the array I-V characteristics and temperature effects.
2011 Jim Dunlop Solar Cells, Modules and Arrays: 5 - 42
Figure 40. Generally, 36 series-connected silicon solar cells are needed to provide adequate maximum power voltage to fully charge a lead acid-battery.
PV module maximum power voltage must be higher than battery voltage at highest operating temperature
Voltage (V)
Cur
rent
(A)
Module with 36 series-connected cells operating at temperature of 50 C (optimal)
10 20
Operating voltage range for 12-volt lead-acid battery:11.5 to 14.5 volts.
Maximum power points
Module with 30 series-connectedcells at 50 C (voltage too low todeliver maximum current to battery)
Module with 42 series-connected cells at 50 C (voltage is more than adequate for charging, but power is wasted)

System Design • 41 NABCEP PV Certification Study Guide Copyright © 2019 NABCEP v.8
In addition to electrical safety listing, the selection of PV modules for a given project may be based on any number of factors, including:
• Physical characteristics (dimensions and weight)• Electrical specifications (power tolerance and guaranteed power output)• Warranties, reliability and reputation of the manufacturer• Manufacturer certification to quality standards (ISO 9000)• Module warranty and design qualification (IEC 61215/61216)• Customer satisfaction and field results• Costs and availability
In addition to electrical safety listing, specifying inverters for PV installations includes the following considerations:• Interactive or stand-alone• Power rating and maximum current• Power conversion efficiency• Location environment rating• Size and weight• Nominal dc input and ac output voltages and limits of operation• Protective and safety features (array ground and arc faults, reverse polarity, etc.)• Warranties and reliability• Costs and availability• Additional features (monitoring, chargers, controls, MPPT etc.)
PV ModulesPhotovoltaic or solar cells convert sunlight to dc electricity. They are often referred to as direct energy conversion devices because they convert one basic form of energy to another in a single step. PV modules have no moving parts, and produce no noise or emissions during normal operation. Generally speaking, commercial PV modules are very reliable products with expected lifetimes exceeding 20-25 years in normal service.
PV cells are made from a variety of semi-conductor technologies. Most PV cells are made from multi (poly) or single crystalline silicon (mono) that is doped with certain elements
Solar Energy Powers the World
The U.S. currently has just over 1100 GW of peak electrical power generation capacity, supplying a
total annual electrical consumption of about 3,700 billion kWh. To produce this much energy would
require about 2,500 GW of peak PV generation distributed throughout the U.S. Using a reference
PV module efficiency of 15% (power density 150 W/m2), the total array surface area required would
be about 4 million acres (about 6400 square miles), or about 0.2% of the continental U.S. land area.
Considering over 50% of U.S. land area is already dedicated to the extraction of natural resources and
fossil fuels, including agriculture, forestry, mining and public lands, a significant contribution from PV
in meeting our national energy needs is not an unrealistic expectation.
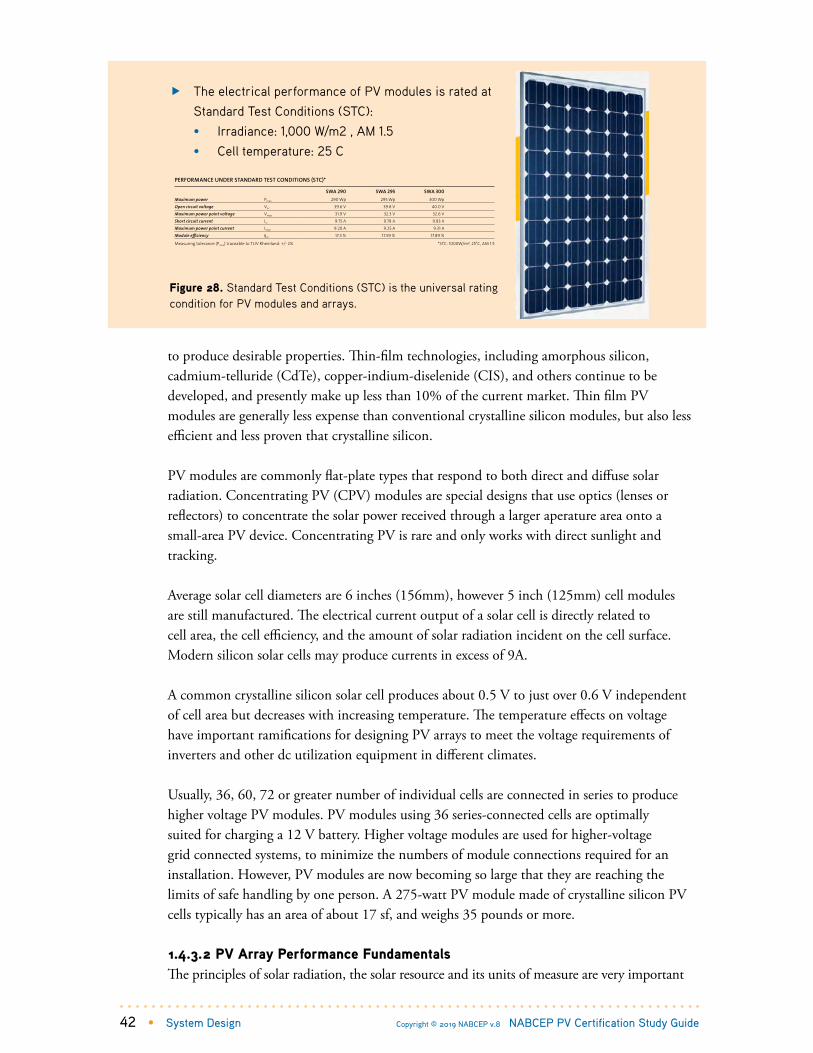
42 • System Design Copyright © 2019 NABCEP v.8 NABCEP PV Certification Study Guide
to produce desirable properties. Thin-film technologies, including amorphous silicon, cadmium-telluride (CdTe), copper-indium-diselenide (CIS), and others continue to be developed, and presently make up less than 10% of the current market. Thin film PV modules are generally less expense than conventional crystalline silicon modules, but also less efficient and less proven that crystalline silicon.
PV modules are commonly flat-plate types that respond to both direct and diffuse solar radiation. Concentrating PV (CPV) modules are special designs that use optics (lenses or reflectors) to concentrate the solar power received through a larger aperature area onto a small-area PV device. Concentrating PV is rare and only works with direct sunlight and tracking.
Average solar cell diameters are 6 inches (156mm), however 5 inch (125mm) cell modules are still manufactured. The electrical current output of a solar cell is directly related to cell area, the cell efficiency, and the amount of solar radiation incident on the cell surface. Modern silicon solar cells may produce currents in excess of 9A.
A common crystalline silicon solar cell produces about 0.5 V to just over 0.6 V independent of cell area but decreases with increasing temperature. The temperature effects on voltage have important ramifications for designing PV arrays to meet the voltage requirements of inverters and other dc utilization equipment in different climates.
Usually, 36, 60, 72 or greater number of individual cells are connected in series to produce higher voltage PV modules. PV modules using 36 series-connected cells are optimally suited for charging a 12 V battery. Higher voltage modules are used for higher-voltage grid connected systems, to minimize the numbers of module connections required for an installation. However, PV modules are now becoming so large that they are reaching the limits of safe handling by one person. A 275-watt PV module made of crystalline silicon PV cells typically has an area of about 17 sf, and weighs 35 pounds or more.
1.4.3.2 PV Array Performance FundamentalsThe principles of solar radiation, the solar resource and its units of measure are very important
Figure 28. Standard Test Conditions (STC) is the universal rating condition for PV modules and arrays.
+-
65.9
5 (16
75)
39.4 (1001)
∅ 0.35 (9)
39.3
7 (10
00)
4x
37.8 (961)
7.12(180.85)
4.20(106.65)
11.32(287.50)
43.3
0 (11
00)
∅ 0.26 (6.6)
∅ 0.35 (9)
1.30 (33)
SolarWorld Americas Inc. reserves the right to make specification changes without notice. This data sheet complies with the requirements of EN 50380. SW-0
1-750
6US
201
8012
6
All units provided are imperial. SI units provided in parentheses.
PERFORMANCE UNDER STANDARD TEST CONDITIONS (STC)*
SWA 290 SWA 295 SWA 300Maximum power Pmax 290 Wp 295 Wp 300 Wp
Open circuit voltage Voc 39.6 V 39.8 V 40.0 VMaximum power point voltage Vmpp 31.9 V 32.3 V 32.6 VShort circuit current Isc 9.75 A 9.78 A 9.83 AMaximum power point current Impp 9.20 A 9.25 A 9.31 AModule efficiency ηm 17.3 % 17.59 % 17.89 %
Measuring tolerance (Pmax) traceable to TUV Rheinland: +/- 2% *STC: 1000W/m², 25°C, AM 1.5
PERFORMANCE AT 800 W/m², NOCT, AM 1.5
SWA 290 SWA 295 SWA 300Maximum power Pmax 219.6 Wp 223.6 Wp 226.7 Wp
Open circuit voltage Voc 36.7 V 36.9 V 37.0 VMaximum power point voltage Vmpp 29.5 V 29.9 V 30.2 VShort circuit current Isc 7.99 A 8.01 A 8.06 AMaximum power point current Impp 7.43 A 7.47 A 7.52 A
Minor reduction in efficiency under partial load conditions at 25 °C: at 200 W/m², 97% (+/-3%) of the STC efficiency (1000 W/m²) is achieved.
PARAMETERS FOR OPTIMAL SYSTEM INTEGRATION
Power sorting -0 Wp / +5 Wp
Maximum system voltage SC II / NEC 1000 V
Maximum reverse current 25 A
Number of bypass diodes 3
Operating temperature -40 to +85 °C
Maximum design loads (Two rail system)* 113 psf downward, 64 psf upward
Maximum design loads (Three rail system)* 178 psf downward, 64 psf upward
*Please refer to the Sunmodule installation instructions for the details associated with these load cases.
COMPONENT MATERIALS
Cells per module 60
Cell type Monocrystalline PERC
Cell dimensions 6 in x 6 in (156 mm x 156 mm)
Front Tempered safety glass with ARC (EN 12150)
Back Multi-layer polymer backsheet, white
Frame Black anodized aluminum
J-Box IP65
Connector PV wire (UL4703) with Amphenol UTX connectors
Module fire performance (UL 1703) Type 1
DIMENSIONS / WEIGHT THERMAL CHARACTERISTICS
Length 65.95 in (1675 mm) NOCT 46 °C
Width 39.40 in (1001 mm) TC Isc 0.07 % /C
Height 1.30 in (33 mm) TC Voc -0.29 % /C
Weight 39.7 lb (18.0 kg) TC Pmpp -0.39 % /C
ORDERING INFORMATION
Order number Description82000482 Sunmodule Plus SWA 290 mono (black frame)
82000430 Sunmodule Plus SWA 295 mono (black frame)
82000432 Sunmodule Plus SWA 300 mono (black frame)
CERTIFICATES AND WARRANTIES
CertificatesIEC 61730 IEC 61215 UL 1703IEC 62716 IEC 60068-2-68 IEC 61701
Warranties*Product Warranty 20 yearsLinear Performance Guarantee 25 years
*Supplemental warranty coverage available through SolarWorld Assurance™ Warranty Protection Program – www.solarworld-usa.com/assurance
SWA 290 - 300 MONO
2011 Jim Dunlop Solar Cells, Modules and Arrays: 5 - 46
Figure 44. Standard Test Conditions (STC) is the universal rating condition for PV modules and arrays.
The electrical performance of PV modules is rated at Standard Test Conditions (STC): Irradiance: 1,000 W/m2 , AM 1.5 Cell temperature: 25 C
Source: SolarWorld USA
The electrical performance of PV modules is rated at
Standard Test Conditions (STC):
• Irradiance: 1,000 W/m2 , AM 1.5
• Cell temperature: 25 C

System Design • 43 NABCEP PV Certification Study Guide Copyright © 2019 NABCEP v.8
for the PV designer and installer to understand, especially as it concerns the performance of PV modules and arrays. This includes quantifying the amount of solar power incident on a PV array at any given point in time, as well as estimating the total solar energy received on monthly and annual basis. Solar radiation is the basic source of energy that drives a PV system. It must be accurately measured and quantified to make reasonable performance estimates in the design, in order to verify the proper operation of modules, arrays and complete systems.
Solar radiation is electromagnetic radiation ranging from about 200 to 2000 nanometers (nm) in wavelength, including the near ultra-violet (UV), visible light, and near infrared (IR) portions of the spectrum. The sun produces immense quantities of electromagnetic radiation as a product of fusion reactions at its core.
The tiny fraction reaching the earth’s surface amounts to approximately 170 million gigawatts (GW), many thousands of times greater than all of the electrical power used on earth.
Reference: U.S. Energy Information Administration, Annual Energy Outlook 2011: http://www.eia.gov/forecasts/aeo/pdf/0383(2011).pdf.
Solar irradiance (solar power) is the sun’s radiant power incident on a surface of unit area, commonly expressed in units of kW/m2 or W/m2. Due to atmospheric effects, typical peak values of terrestrial solar irradiance are on the order of 1000 W/m2 on surfaces at sea level facing the sun’s rays under a clear sky around solar noon. Consequently, 1000 W/m2 is used as a reference condition for rating the peak output for PV modules and arrays. This value of solar irradiance is often referred to as peak sun. However, higher values of irradiance are common at higher altitudes and on exceptionally clear days during winter months when the sun is closest to earth. In these
2011 Jim Dunlop Solar Cells, Modules and Arrays: 5 - 47
Figure 45. For fixed south-facing surfaces on a clear day, the incident solar irradiance varies over the day in a bell-shaped curve, peaking at solar noon.
Time of Day
Sola
r Irr
adia
nce
(W/m
2 )
Sunrise Noon Sunset
Figure 29. For fixed south-facing surfaces on a clear day, the incident solar irradiance varies in a bell-shaped curve, peaking at solar noon.
Solar Constant
The Solar Constant is the average value of solar irradiance outside the earth’s atmosphere on a
surface facing the sun’s rays, at the average earth-sun distance of 1 Astronomical Unit (AU), equal
to about 93 million miles. The Solar Constant represents the average value of extraterrestrial solar
irradiance, which is approximately 1366 W/m2. Due to the earth’s slightly elliptical orbit around the
sun, the actual values for extraterrestrial irradiance vary from the average value by about 7% between
the aphelion and perihelion (points in the earth’s orbit furthest and closest to the sun, respectively).
Approximately 30% of the extraterrestrial irradiance is reflected or absorbed by the atmosphere
before it reaches the earth’s surface. Perihelion is in July and Aphelion is in January so the southern
hemisphere can have the most intense sunlight on earth.
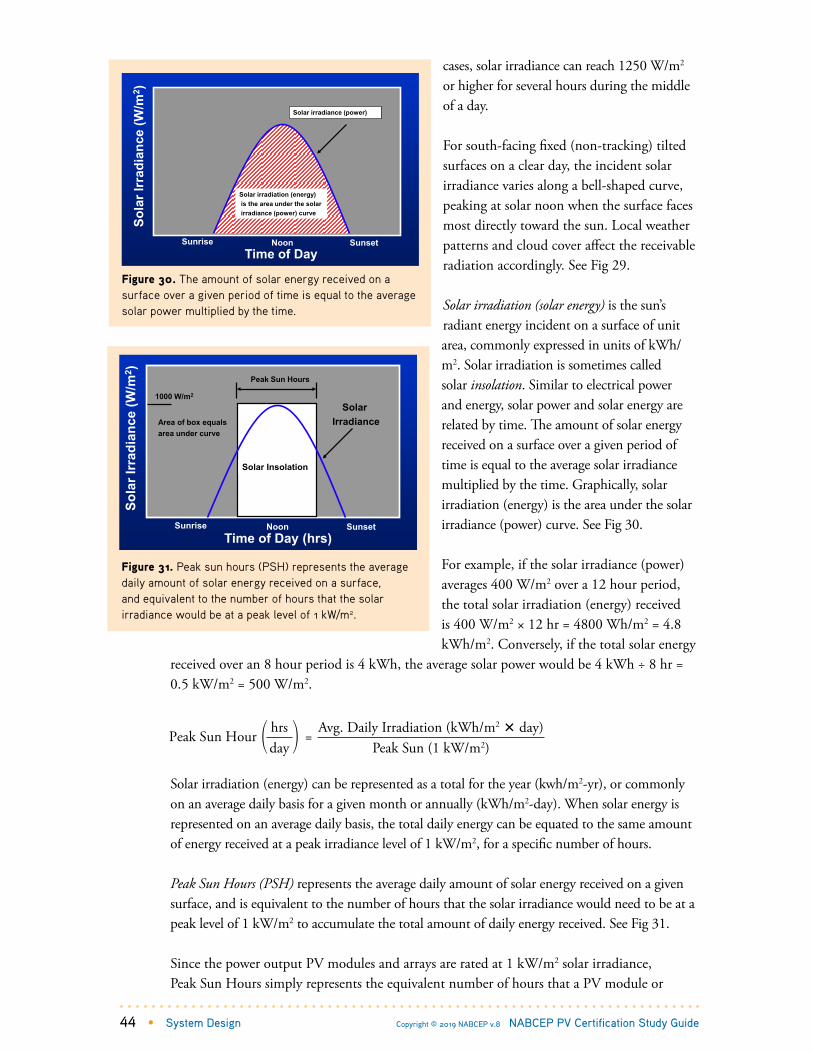
44 • System Design Copyright © 2019 NABCEP v.8 NABCEP PV Certification Study Guide
cases, solar irradiance can reach 1250 W/m2 or higher for several hours during the middle of a day.
For south-facing fixed (non-tracking) tilted surfaces on a clear day, the incident solar irradiance varies along a bell-shaped curve, peaking at solar noon when the surface faces most directly toward the sun. Local weather patterns and cloud cover affect the receivable radiation accordingly. See Fig 29.
Solar irradiation (solar energy) is the sun’s radiant energy incident on a surface of unit area, commonly expressed in units of kWh/m2. Solar irradiation is sometimes called solar insolation. Similar to electrical power and energy, solar power and solar energy are related by time. The amount of solar energy received on a surface over a given period of time is equal to the average solar irradiance multiplied by the time. Graphically, solar irradiation (energy) is the area under the solar irradiance (power) curve. See Fig 30.
For example, if the solar irradiance (power) averages 400 W/m2 over a 12 hour period, the total solar irradiation (energy) received is 400 W/m2 × 12 hr = 4800 Wh/m2 = 4.8 kWh/m2. Conversely, if the total solar energy
received over an 8 hour period is 4 kWh, the average solar power would be 4 kWh ÷ 8 hr = 0.5 kW/m2 = 500 W/m2.
Solar irradiation (energy) can be represented as a total for the year (kwh/m2-yr), or commonly on an average daily basis for a given month or annually (kWh/m2-day). When solar energy is represented on an average daily basis, the total daily energy can be equated to the same amount of energy received at a peak irradiance level of 1 kW/m2, for a specific number of hours.
Peak Sun Hours (PSH) represents the average daily amount of solar energy received on a given surface, and is equivalent to the number of hours that the solar irradiance would need to be at a peak level of 1 kW/m2 to accumulate the total amount of daily energy received. See Fig 31.
Since the power output PV modules and arrays are rated at 1 kW/m2 solar irradiance, Peak Sun Hours simply represents the equivalent number of hours that a PV module or
2011 Jim Dunlop Solar Cells, Modules and Arrays: 5 - 48
Figure 46. The amount of solar energy received on a surface over a given period of time is equal to the average solar power over the period multiplied by the time.
Time of Day
Sola
r Irr
adia
nce
(W/m
2 )
Sunrise Noon Sunset
Solar irradiation (energy)is the area under the solar irradiance (power) curve
Solar irradiance (power)
Figure 30. The amount of solar energy received on a surface over a given period of time is equal to the average solar power multiplied by the time.
2011 Jim Dunlop Solar Cells, Modules and Arrays: 5 - 49
Figure 47. Peak sun hours (PSH) represents the average daily amount of solar energy received on a surface, and equivalent to the number of hours that the solar irradiance would be at a peak level
of 1 kW/m2.
Time of Day (hrs)
Sola
r Irr
adia
nce
(W/m
2 )
1000 W/m2
Sunrise Noon Sunset
Peak Sun Hours
Solar Insolation
SolarIrradianceArea of box equals
area under curve
Figure 31. Peak sun hours (PSH) represents the average daily amount of solar energy received on a surface, and equivalent to the number of hours that the solar irradiance would be at a peak level of 1 kW/m2.
Peak Sun Hour hrs = Avg. Daily Irradiation (kWh/m2 day)
day Peak Sun (1 kW/m2)

System Design • 45 NABCEP PV Certification Study Guide Copyright © 2019 NABCEP v.8
array will operate at its peak rated output. For example, consider a PV array that produces a peak power output of 6 kW when exposed to 1 kW/m2 irradiance, at average operating temperatures. If the array surface receives 5 PSH per day on average, the expected daily energy production for this array would be 6 kW × 5 hrs/day = 30 kWh/day. Coincidentally, the average daily residential energy use in the U.S is about 30 kWh/day, and a 6 kW PV system is about the typical size that can be installed on an average residential rooftop.
Solar radiation measurements made over past years throughout the U.S. and around the world have been processed and archived in databases, and this data is used by designers to estimate the expected performance of PV systems. See Fig 32. The Renewable Resource Data Center (RReDC) at the
National Renewable Energy Laboratory (NREL) maintains an extensive collection of renewable energy data, maps, and tools for solar radiation, as well as biomass, geothermal, and wind resources.
Note that solar radiation is not electricity, it is electromagnetic radiation hitting a square meter of earth in these tables and a conversion factor must be used to estimate electricity production using a photovoltaic system.
NSRDB 1961-1990
• 30 years of solar radiation and meteorological
data from 239 NWS sites in the U.S.
• TMY2 hourly data files
NSRDB 1991-2005 Update
• Contains solar and meteorological data for
1,454 sites.
• TMY3 hourly data files
Figure 32. The National Solar Radiation Database includes data for over 1,400 sites in the U.S.
2011 Jim Dunlop Solar Cells, Modules and Arrays: 5 - 50
Figure 48. The National Solar Radiation Database includes data for over 1400 sites in the U.S.
NSRDB 1961-1990 30 years of solar radiation and
meteorological data from 239 NWS sites in the U.S.
TMY2 hourly data files
NSRDB 1991-2005 Update Contains solar and meteorological
data for 1,454 sites. TMY3 hourly data files
NREL
Tilt(deg) Jan Feb Mar Apr May Jun Jul Aug Sep Oct Nov Dec Year
0Average 3.1 3.9 5.0 6.2 6.4 6.1 6.0 5.7 4.9 4.2 3.4 2.9 4.8Minimum 2.7 3.2 4.2 5.6 5.3 5.4 5.5 4.8 4.3 3.5 2.9 2.4 4.6Maximum 3.7 4.4 5.5 6.8 7.0 7.0 6.6 6.3 5.5 4.8 3.7 3.3 5.1
Lat-15Average 3.8 4.5 5.5 6.4 6.4 6.0 5.9 5.8 5.2 4.7 4.1 3.6 5.2Minimum 3.2 3.7 4.5 5.8 5.3 5.3 5.4 4.8 4.5 3.8 3.4 2.8 4.8Maximum 4.6 5.2 6.1 7.1 7.0 6.8 6.4 6.5 6.0 5.5 4.6 4.1 5.5
LatAverage 4.3 4.9 5.7 6.3 6.0 5.5 5.5 5.6 5.3 5.0 4.6 4.1 5.2Minimum 3.6 4.0 4.6 5.7 5.0 4.9 5.1 4.6 4.5 4.0 3.8 3.1 4.9Maximum 5.4 5.8 6.3 7.0 6.6 6.3 6.0 6.3 6.1 5.9 5.2 4.9 5.7
Lat+15Average 4.6 5.1 5.6 5.9 5.4 4.8 4.9 5.1 5.1 5.1 4.8 4.4 5.1Minimum 3.8 4.1 4.5 5.3 4.5 4.3 4.5 4.2 4.3 4.0 3.9 3.3 4.7Maximum 5.8 6.0 6.3 6.5 5.8 5.5 5.3 5.7 5.9 6.0 5.6 5.3 5.5
90Average 3.9 3.8 3.6 2.9 2.1 1.8 1.9 2.4 3.0 3.6 4.0 3.9 3.1Minimum 3.1 3.1 2.9 2.7 2.0 1.6 1.8 2.0 2.5 2.7 3.1 2.8 2.8Maximum 5.1 4.7 4.0 3.1 2.2 1.9 2.0 2.6 3.4 4.3 4.7 4.7 3.3
City Daytona BeachState FL
WBAN No 12834Lat(N) 29.18
Long(W) 81.05Elev(m) 12
Pres(mb) 1017Stn Type Primary
Figure 33. Solar radiation data tables gives the total global solar radiation for fixed south-facing flat-plate collectors tilted at angles of 0°, Lat-15°, Lat, Lat+15° and 90°.
NREL

46 • System Design Copyright © 2019 NABCEP v.8 NABCEP PV Certification Study Guide
Reference: The National Solar Radiation Database includes data for over 1,400 sites in the U.S. and its territories, and many other sites around the world, see: www.nrel.gov/rredc/ Solar radiation data can be represented in tables, databases or in graphical form. See Fig. 33. Standard solar radiation data tables give several key sets of data for different fixed and tracking surfaces. The major limitation of the data tables is that they only provide data for south-facing fixed surfaces. Other tools, such as PVWatts™ can be used to predict the solar energy received on fixed-tilt surfaces facing directions other than due south.
The standard format spreadsheets provide minimum and maximum data for each month and annual averages for the following solar resource data and surface orientations:• Total global solar radiation for fixed south-facing flat-plate collectors tilted at angles of
0°, Lat-15°, Lat, Lat+15°, and 90°.• Total global solar radiation for single-axis, north-south tracking flat-plate collectors at tilt
angles of 0°, Lat-15°, Lat, Lat+15°.• Total global solar radiation for dual-axis tracking flat-plate collectors.• Direct beam radiation for concentrating collectors.• Average meteorological
conditions.
1.4.3.3 PV Module PerformancePhotovoltaic module electrical performance is characterized by its current-voltage (I-V) characteristic. I-V curves represent an infinite number of current and voltage operating point pairs for a PV device, at a given solar irradiance and temperature operating condition. Certain electrical parameters representing key points along the
PV device performance is specified by the following
I-V parameters at a given temperature and solar
irradiance condition:
• Open-circuit voltage (Voc)
• Short-circuit current (Isc)
• Maximum power point (Pmp)
• Maximum power voltage (Vmp)
• Maximum power current (Imp)
2011 Jim Dunlop Solar Cells, Modules and Arrays: 5 - 52
Figure 50. An I-V curve represents the electrical performance for PV modules and arrays.
PV device performance is specified by the following I-V parameters at a given temperature and solar irradiance condition:
Open-circuit voltage (Voc) Short-circuit current (Isc) Maximum power point (Pmp) Maximum power voltage (Vmp) Maximum power current (Imp)
Voltage (V)
Isc
Voc
Imp
Vmp
Pmp
Area = Pmp
Figure 34. An I-V curve represents the electrical performance for PV modules and arrays.
2011 Jim Dunlop Solar Cells, Modules and Arrays: 5 - 53
Figure 51. Current-voltage curves can also expressed as power-voltage curves where the maximum power point (Pmp) is clearly shown.
Voltage (V)
Isc
Imp
Vmp Voc
Pmp = Imp x Vmp
Pmp
Current vs. voltagePower vs. voltage
Figure 35. Current-voltage curves can also be expressed as power-voltage curves where the maximum power point (Pmp) is clearly shown.

System Design • 47 NABCEP PV Certification Study Guide Copyright © 2019 NABCEP v.8
I-V curve are rated by the manufacturer at the specified conditions, affixed on product labels, and are the basis for the designing the photovoltaic source and output circuits. See Fig. 34.
PV module performance is sometimes represented by power versus voltage curves, which contain the same information as I-V curves. Power versus voltage curves provide a clearer illustration of how the power output is affected by the operating voltage, and where peak power output occurs. See Fig. 35.
Key Module ParametersOpen-circit voltage (Voc) is the maximum dc voltage on an I-V curve, and is the operating point for a PV device with no connected load. Voc corresponds to an infinite resistanceor open-circuit condition, and zero current and zero power output. Open-circuit voltage is independent of cell area and increases with decreasing cell temperature, and is used to determine maximum circuit voltages for PV modules and arrays. For crystalline silicon solar cells, the open-circuit voltage is typically on the order of 0.5 V to 0.6 V at 25°C. Thin-film technologies have slightly higher cell voltages and different temperature coefficients, but lower current density than crystalline silicon cells.
Note that maximum voltage, as defined by NEC 690.7, for a PV module is greater than Voc at STC since the Voc is corrected for a lower operating temperature than STC. Short-circuit current (Isc) is the maximum current on an I-V curve. Isc corresponds to a zero resistance and short-circuit condition, at zero voltage and zero power output. Short-circuit current is directly proportional to solar irradiance, and rated values are used in calculations to size PV circuit conductors and overcurrent devices. Because PV modules are inherently current-limited, PV modules can be short-circuited without harming the modules using an appropriately rated shorting device. In fact, measuring the short-circuit current of a module or string when it is disconnected from the rest of the system is one way to test modules and strings. Some PV charge controllers regulate battery charging by short-circuiting the module or array. Note that short circuits for extended periods of time (greater than several minutes under high irradiance) may damage some thin-film modules. Manufacturers’ data sheets provide applicable cautions.
The maximum power point (Pmp) of a PV device is the operating point on its I-V curve where the product of current and voltage is at its maximum. The maximum power voltage (Vmp) is the corresponding operating voltage at Pmp, and is typically 75% to 85% of the open-circuit voltage. The maximum power current (Imp) is the operating current at Pmp, and typically 95% of the short-circuit current. The maximum power point is located on the “knee” of the I-V curve, and represents the highest efficiency operating point for a PV device under the given conditions of solar irradiance and cell temperature.
Note that maximum circuit current for a solar module as defined by 690.8(A)(1) is generally Isc x 1.25. Required ampacity of conductors for continuous current, as defined by 690.8(B)(1), is maximum circuit current x 1.25.
Operating PointThe specific operating point on an I-V curve is determined by the electrical load according to Ohm’s Law. Consequently, the load resistance to operate a PV module or array at its

48 • PV Design & Management Copyright © 2019 NABCEP v.8 NABCEP PV Certification Study Guide
maximum power point is equal to the maximum power voltage divided by the maximum power current (Vmp/Imp). For example, consider a PV module with maximum power voltage (Vmp) = 35.8 V, and maximum power current (Imp) = 4.89 A. The load resistance required to operate this module at maximum power is equal to Vmp ÷ Imp = 35.8 V ÷ 4.89 A = 7.32 ohms. The maximum dc power produced is simply the product of maximum power current and voltage. See Fig. 36.
In application, the operating point on the I-V curve is determined by the specific equipment connected to the output of the PV array. If the load is a battery, the battery voltage sets the operating point on the I-V curve, and sets the operating current. If the PV array is connected to an interactive inverter, the inverter circuits seek to operate the PV at its maximum power point as long as the array voltage operates within the inverter specifications. Maximum power point tracking (MPPT) refers to the process or electronic equipment used to operate PV modules or arrays at their maximum power point under varying conditions. MPPT circuits are integral to interactive inverters, many charge controllers and also available as separate equipment or part of PV array source circuit combiner boxes. Many inverters have multiple MPPT dc-to-dc converters for the dc input to the inverter.
Response to IrradianceChanges in solar radiation have a direct linear and proportional effect on the current and maximum power output of a PV module or array. See Fig. 37. Therefore, doubling the solar irradiance on the surface of the array doubles the current and maximum power output (assuming constant temperature). Changing irradiance has a smaller effect on voltage, mainly at lower irradiance levels. Because voltage varies little with changing irradiance at higher levels, PV devices are well-suited for battery charging applications. See Fig. 38.The short-circuit current (Isc), maximum power current (Imp), and maximum power (Pmp) at one condition of solar irradiance may be translated to estimate the value of these parameters at another irradiance level:
2011 Jim Dunlop Solar Cells, Modules and Arrays: 5 - 54
Figure 52. The specific operating point on an I-V curve is determined by the electrical load resistance according to Ohm’s Law.
Voltage
Decreasing
resistance
Constant Temperature
Increasing
resistance
R = 0
R = ∞
Load lines of constant resistance
Figure 36. The specific operating point on an I-V curve is determined by the electrical load resistance according to Ohm’s Law.
2011 Jim Dunlop Solar Cells, Modules and Arrays: 5 - 55
Figure 53. Changes in solar radiation have a direct linear and proportional effect on the current and maximum power output of a PV module or array.
Voltage
1000 W/m2
750 W/m2
500 W/m2
250 W/m2
Current increases with increasing irradiance
Voc changes little with irradiance
Maximum power increases with increasing irradiance
Maximum power voltage changes little with irradiance
Constant Temperature
2011 Jim Dunlop Solar Cells, Modules and Arrays: 5 - 56
Figure 54. PV module current and voltage are affected differently by solar irradiance.
Irradiance (W/m2)
1000
Isc increases with increasing irradiance
Voc changes little with irradiance above 200 W/m2
Constant Temperature
8006004002000
Figure 37. Changes in solar radiation have a direct linear and proportional effect on the current and maximum power output of a PV module or array.
Figure 38. PV module current and voltage are affected differently by solar irradiance.

PV Design & Management • 49 NABCEP PV Certification Study Guide Copyright © 2019 NABCEP v.8
Isc2 = Isc1 × (E2/E1)Pmp2 = Pmp1 × (E2/E1)Imp2 = Imp1 × (E2/E1)
whereIsc1 = rated short-circuit current at irradiance E1 (A) Isc2 = short-circuit current at new irradiance E2 (A) E1 = rated solar irradiance (W/m2)E2 = new solar irradiance (W/m2)Pmp1 = rated maximum power at irradiance E1 (W) Pmp2 = new maximum power at new irradiance E2 (W)Imp1 = rated maximum power current at irradiance E1 (A) Imp2 = new maximum power current at new irradiance E2 (A)
PV installers verify performance of PV systems in the field by measuring the solar irradiance incident on arrays with simple handheld meters, and correlating with the actual system power output. For example, if it has been established that the peak output of a PV array is 10 kW under incident radiation levels of 1000 W/m2 at normal operating temperatures, then the output of the array should be expected to be around 7 kW if the solar irradiance is 700 W/m2, assuming constant temperature. Response to TemperatureThe current and voltage output of a PV module are temperature dependent. For crystalline silicon PV devices, increasing cell temperature results in a measurable decrease in voltage and power, and a slight increase in current. Higher cell operating temperatures also reduce cell efficiency and lifetime. The temperature effects on current are an order of magnitude less than on voltage, and neglected as far as any installation or safety issues are concerned.
Temperature coefficients relate the effects of changing PV cell temperature on its voltage, current and power output. For crystalline silicon PV devices, the temperature coefficient for open circuit voltage on a percentage basis is approximately -0.3%/°C to -0.4%/°C, the temperature coefficient for short-circuit current is approximately +0.04 %/°C, and the temperature coefficient for maximum power is approximately -0.45 %/°C. The temperature coefficient for Vmp on a percentage basis is not the same as the temperature coefficient of Voc and is usually the same as the temperature coefficient of maximum power on a percentage basis. Note that the power and voltage temperature coefficients are negative, as these parameters decrease with increasing temperature. Thin-film PV modules have different temperature coefficients than crystalline silicon modules. See Fig. 39.
Figure 39. For crystalline silicon PV devices, increasing cell temperature results in a decrease in voltage and power, and a small increase in current.
2011 Jim Dunlop Solar Cells, Modules and Arrays: 5 - 57
Figure 55. For crystalline silicon PV devices, increasing cell temperature results in a decrease in voltage and power, and a small increase in current.
Voltage
T = 25°C
T = 50°C
T = 0 C
Increasing temperature reduces voltage
Increasing temperature reduces power output
Increasing temperature increases current
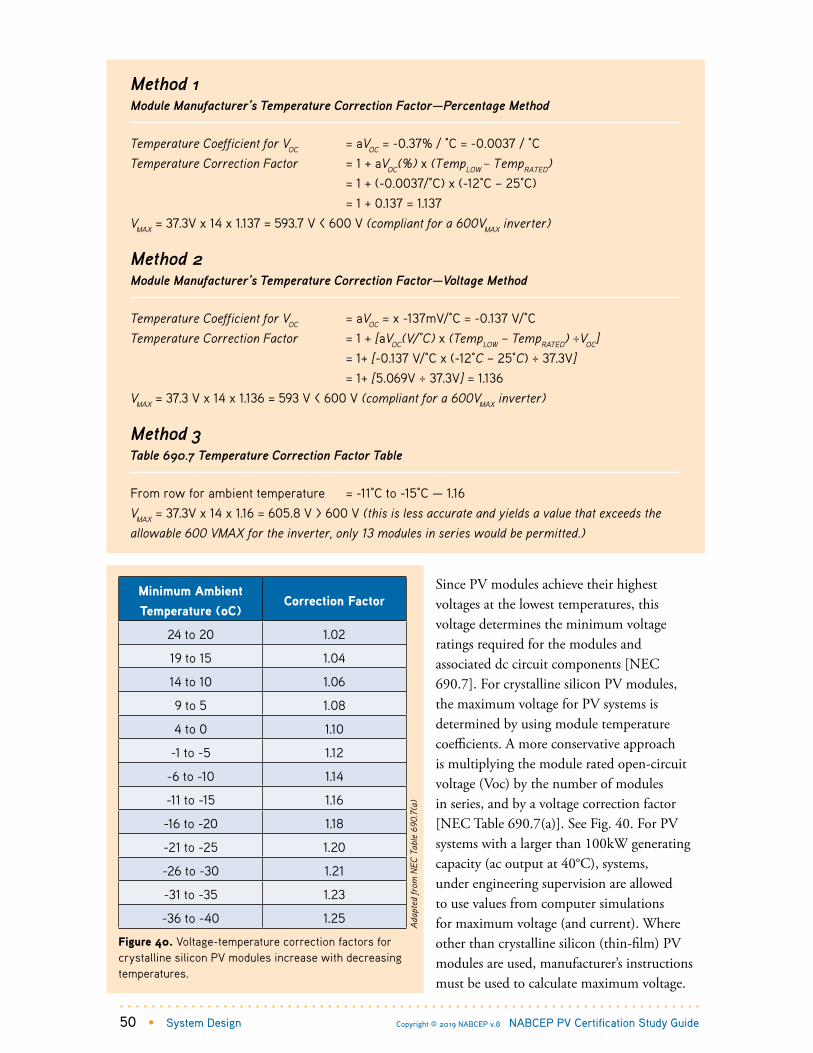
50 • System Design Copyright © 2019 NABCEP v.8 NABCEP PV Certification Study Guide
Since PV modules achieve their highest voltages at the lowest temperatures, this voltage determines the minimum voltage ratings required for the modules and associated dc circuit components [NEC 690.7]. For crystalline silicon PV modules, the maximum voltage for PV systems is determined by using module temperature coefficients. A more conservative approach is multiplying the module rated open-circuit voltage (Voc) by the number of modules in series, and by a voltage correction factor [NEC Table 690.7(a)]. See Fig. 40. For PV systems with a larger than 100kW generating capacity (ac output at 40°C), systems, under engineering supervision are allowed to use values from computer simulations for maximum voltage (and current). Where other than crystalline silicon (thin-film) PV modules are used, manufacturer’s instructions must be used to calculate maximum voltage.
Method 1 Module Manufacturer’s Temperature Correction Factor—Percentage Method
Temperature Coefficient for VOC = aVOC = -0.37% / °C = -0.0037 / °C
Temperature Correction Factor = 1 + aVOC(%) x (TempLOW – TempRATED) = 1 + (-0.0037/°C) x (-12°C – 25°C)
= 1 + 0.137 = 1.137
VMAX = 37.3V x 14 x 1.137 = 593.7 V < 600 V (compliant for a 600VMAX inverter)
Method 2 Module Manufacturer’s Temperature Correction Factor—Voltage Method
Temperature Coefficient for VOC = aVOC = x -137mV/°C = -0.137 V/°C
Temperature Correction Factor = 1 + [aVOC(V/°C) x (TempLOW – TempRATED) ÷VOC] = 1+ [-0.137 V/°C x (-12°C – 25°C) ÷ 37.3V] = 1+ [5.069V ÷ 37.3V] = 1.136
VMAX = 37.3 V x 14 x 1.136 = 593 V < 600 V (compliant for a 600VMAX inverter)
Method 3 Table 690.7 Temperature Correction Factor Table
From row for ambient temperature = -11°C to -15°C — 1.16
VMAX = 37.3V x 14 x 1.16 = 605.8 V > 600 V (this is less accurate and yields a value that exceeds the allowable 600 VMAX for the inverter, only 13 modules in series would be permitted.)
Minimum Ambient Temperature (oC)
Correction Factor
24 to 20 1.02
19 to 15 1.04
14 to 10 1.06
9 to 5 1.08
4 to 0 1.10
-1 to -5 1.12
-6 to -10 1.14
-11 to -15 1.16
-16 to -20 1.18
-21 to -25 1.20
-26 to -30 1.21
-31 to -35 1.23
-36 to -40 1.25 Ada
pted
from
NEC
Tab
le 6
90.7
(a)
Figure 40. Voltage-temperature correction factors for crystalline silicon PV modules increase with decreasing temperatures.

System Design • 51 NABCEP PV Certification Study Guide Copyright © 2019 NABCEP v.8
The following three methods are used to calculate maximum voltage. The example uses a PV module with rated open-circuit voltage (Voc) = 37.3 V, installed in a location with a -12°C lowest expected ambient temperature. The array design uses 14 series-connected PV modules.
Rating ConditionsStandard Test Conditions (STC) is a universal rating condition for PV modules and arrays, and specifies the electrical output at a solar irradiance level of 1000 W/m2 at AM 1.5 spectral distribution, and 25°C cell temperature. The conditions are conducive to testing indoors in a manufacturing environment but tend to overestimate actual field performance, as PV arrays rarely at a temperature of 25°C and an irradiance of 1000 W/m2 at the same time. An operating temperature of 50°C at Peak Sun is much more common when the module is at mild ambient temperatures. See Fig. 41. PV module performance is sometimes represented at other test conditions, including:• Standard Operating Conditions (SOC) Irradiance: 1,000 W/m2
Cell temperature: NOCT• Nominal Operating Conditions (NOC) Irradiance: 800 W/m2
Cell temperature: NOCT
Maximum System Voltage
The maximum system voltage is the PV array open-circuit voltage at the lowest expected ambient
temperature at a site. The NEC defines lowest expected ambient temperature in an informational
note in Art. 690.7 as the Extreme Annual Mean Minimum Design Dry Bulb Temperature from the
ASHRAE Handbook— Fundamentals. A table of these values for the United States is available in
the appendix of the Expedited Permit Process: www.solarabcs.org/permitting.
The ASHRAE temperatures represent statistically valid expected low temperatures, and fall
midway between the record low and the average low for a location. The record low temperature
for a location is overly conservative to use for PV module voltage-temperature corrections, and
module voltage really doesn’t reach its maximum until irradiance levels exceed 200 W/m2, well
after the record low temperature has occurred. Most PV module manufacturers now publish the
temperature coefficient for Voc in their specifications.
2011 Jim Dunlop Solar Cells, Modules and Arrays: 5 - 59
Figure 57. The differences between rating conditions can be clearly shown by the I-V curves.
Voltage
STCSOC
PTCNOC
Figure 41. The differences between rating conditions can be clearly shown by the I-V curves.

52 • System Design Copyright © 2019 NABCEP v.8 NABCEP PV Certification Study Guide
• Nominal Operating Cell Temperature (NOCT) Irradiance: 800 W/m2
Ambient Temp: 20°C PV Array: open-circuit Wind Speed: 1.0 m/s• PVUSA Test Conditions (PTC) 1000 W/m², 45°C, 1 m/s
A number of standards have been developed to address the safety, reliability and performance of PV modules. PV modules are classified as electrical equipment, and hence must conform to accepted product safety standards, and according to the NEC, they must be listed or approved by a recognized laboratory.
In the U.S., PV modules are listed for electrical safety to UL1703 “Safety Standard for FlatPlate Photovoltaic Modules and Panels”. These requirements cover flat-plate photovoltaic modules intended for installation in accordance with the NEC and for use in systems with a maximum voltage of 1500 volts or less. The corresponding international standard is IEC61730, which has been harmonized with UL 1703.
Figure 58. Air mass (AM) 1.5 defines the spectral irradiance characteristic for testing and rating the electrical performance of PV cells and modules.
2011 Jim Dunlop Solar Cells, Modules and Arrays: 5 - 60
Figure 58. Air mass (AM) 1.5 defines the spectral irradiance characteristic for testing and rating the electrical performance of PV cells and modules.
1cos z o
whereAM air mass
zenith angle (deg)zP local pressure (Pa)P sea level pressure (Pa)o
Air mass is calaculated by the following:
PAMP
θ
θ
====
=
Earth
Sun directly overhead(zenith)
Sun at mid-morningor mid-afternoon
Earth’s Surface
Limits of Atmosphere
Air Mass = 0 (AM0)
Air Mass = 1 (AM1.0)
Zenith Angle θz = 48.2 deg
Air Mass = 1.5 (AM1.5)
Horizon
Air mass is calaculated by the following:
AM = 1
cosz P Po
whereAM = air massz = zenith angle (deg) P = local pressure (Pa)Po = sea level pressure (Pa)
Air Mass
Air mass (AM) is the relative path
length of direct solar radiation through
the atmosphere. Air mass affects the
amount and spectral content of the solar
radiation reaching the earth’s surface,
and varies with sun position and altitude
(barometric pressure).
AM 1.5 defines the spectral irradiance
characteristic for testing and rating the
electrical performance of PV cells and
modules, and is representative of a solar
altitude angle of about 42°. Air mass is
equal to 1/cosθz, where θz is the zenith
angle (90°-altitude angle). AM 0 is taken
outside the earth’s atmosphere, and
represents extraterrestrial radiation.
When the sun is directly overhead in the
tropics, air mass is equal to one (AM 1).
Air mass is also corrected for higher
altitudes by average pressure ratios.
See Fig 58.

System Design • 53 NABCEP PV Certification Study Guide Copyright © 2019 NABCEP v.8
PV Module LabelsCertain key I-V parameters at Standard Test Conditions are required to be labeled on every listed PV module [NEC 690.51]. These nameplate electrical ratings govern the circuit design and application limits for the module, and must include the following information and ratings:• polarity of terminals• maximum overcurrent device rating for module protection• open-circuit voltage (Voc)• short-circuit current (Isc)• maximum permissible systems voltage• operating or maximum power voltage (Vmp)• operating or maximum power current (Imp)• maximum power (Pmp)
Other items found on PV modules labels include fire classification ratings, minimum conductor sizes and ratings, and additional design qualification and type testing certification [IEC 61215 or IEC 61646]. Additional information related to PV module installation is found in the installation instructions included with listed PV modules. All installers should thoroughly read this information before working with or installing any PV modules or arrays [NEC 110.2]. See Fig. 42.
PV modules may be evaluated for external fire exposure for building roof covering materials. The fire class is identified in the individual Recognitions as class A, B or C in accordance with UL’s Roofing Materials and Systems Directory. Modules not evaluated for fire exposure are identified as NR (Not Rated), and cannot be installed on buildings.
Series/Parallel ConnectionsPV arrays consist of building blocks of individual PV modules connected electrically in series and parallel to achieve the desired operating voltage and current. PV modules are usually connected in series first to build voltage suitable for connection to dc utilization equipment, such as interactive inverters, batteries, charge controllers or dc loads. PV source circuits are then connected in parallel at combiner boxes to build current and power output for the array.
Figure 42. PV module nameplate electrical ratings govern the circuit design and application limits for the product.
All PV modules must be marked with the following information [690.51]:
• Open-circuit voltage
• Short-circuit current
• Operating voltage
• Operating current
• Maximum power
• Polarity of terminals
• Maximum overcurrent device rating
• Maximum permissible system voltage
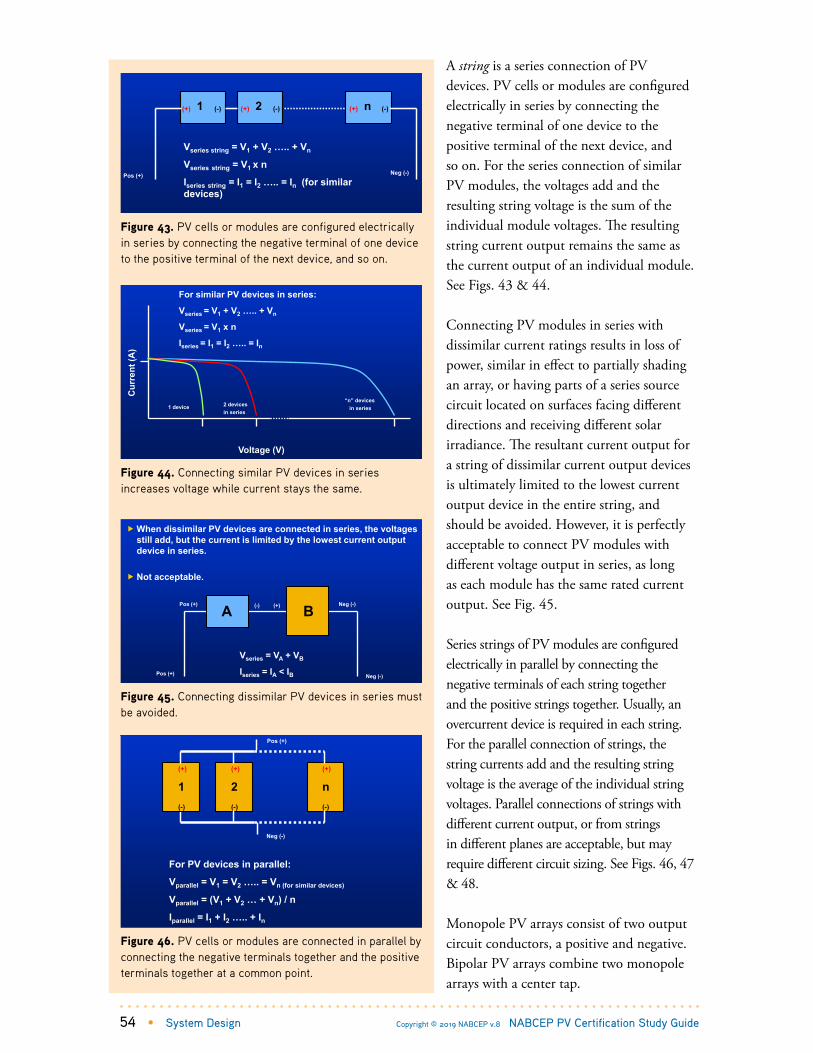
54 • System Design Copyright © 2019 NABCEP v.8 NABCEP PV Certification Study Guide
A string is a series connection of PV devices. PV cells or modules are configured electrically in series by connecting the negative terminal of one device to the positive terminal of the next device, and so on. For the series connection of similar PV modules, the voltages add and the resulting string voltage is the sum of the individual module voltages. The resulting string current output remains the same as the current output of an individual module. See Figs. 43 & 44.
Connecting PV modules in series with dissimilar current ratings results in loss of power, similar in effect to partially shading an array, or having parts of a series source circuit located on surfaces facing different directions and receiving different solar irradiance. The resultant current output for a string of dissimilar current output devices is ultimately limited to the lowest current output device in the entire string, and should be avoided. However, it is perfectly acceptable to connect PV modules with different voltage output in series, as long as each module has the same rated current output. See Fig. 45.
Series strings of PV modules are configured electrically in parallel by connecting the negative terminals of each string together and the positive strings together. Usually, an overcurrent device is required in each string. For the parallel connection of strings, the string currents add and the resulting string voltage is the average of the individual string voltages. Parallel connections of strings with different current output, or from strings in different planes are acceptable, but may require different circuit sizing. See Figs. 46, 47 & 48.
Monopole PV arrays consist of two output circuit conductors, a positive and negative. Bipolar PV arrays combine two monopole arrays with a center tap.
2011 Jim Dunlop Solar Cells, Modules and Arrays: 5 - 62
Figure 60. PV cells or modules are configured electrically in series by connecting the negative terminal of one device to the positive terminal of the next device, and so on.
(-)
Pos (+) Neg (-)
1 2(+) (-)(+) n (-)(+)
Vseries string = V1 + V2 ….. + Vn
Vseries string = V1 x n
Iseries string = I1 = I2 ….. = In (for similar devices)
2011 Jim Dunlop Solar Cells, Modules and Arrays: 5 - 63
Figure 61. Connecting similar PV devices in series increases voltage while current stays the same.
For similar PV devices in series:
Vseries = V1 + V2 ….. + Vn
Vseries = V1 x n
Iseries = I1 = I2 ….. = In
Voltage (V)
Cur
rent
(A)
1 device 2 devicesin series
“n” devicesin series
Figure 43. PV cells or modules are configured electrically in series by connecting the negative terminal of one device to the positive terminal of the next device, and so on.
Figure 44. Connecting similar PV devices in series increases voltage while current stays the same.
2011 Jim Dunlop Solar Cells, Modules and Arrays: 5 - 64
Figure 62. Connecting dissimilar PV devices in series must be avoided.
When dissimilar PV devices are connected in series, the voltages still add, but the current is limited by the lowest current output device in series.
Not acceptable.
Vseries = VA + VB
Iseries = IA < IB
Pos (+) (-) (+) Neg (-)
Pos (+) Neg (-)
A B
2011 Jim Dunlop Solar Cells, Modules and Arrays: 5 - 65
Figure 63. PV cells or modules are connected in parallel by connecting the negative terminals together and the positive terminals together at a common point.
For PV devices in parallel:
Vparallel = V1 = V2 ….. = Vn (for similar devices)
Vparallel = (V1 + V2 … + Vn) / n
Iparallel = I1 + I2 ….. + In
Pos (+)
Neg (-)
n(-)
(+)
1(-)
(+)
2(-)
(+)
Figure 45. Connecting dissimilar PV devices in series must be avoided.
Figure 46. PV cells or modules are connected in parallel by connecting the negative terminals together and the positive terminals together at a common point.

System Design • 55 NABCEP PV Certification Study Guide Copyright © 2019 NABCEP v.8
Certain inverters require the use of bi-polar arrays. See Fig. 49.
Bypass diodes are connected in parallel with series strings of cells to prevent cell overheating when cells or parts of an array are shaded. See Fig. 50. Bypass diodes are essentially electrical check valves that permit the flow of current in only one direction. When modules in series strings are partially shaded, it may cause reverse voltage across the shaded cells or modules. The bypass diode shunts current around the shaded area and prevents cell overheating. Most listed PV modules are equipped with factory installed bypass diodes. Bypass diodes may or may not be serviceable via module junction boxes in the field. See Fig. 51.
1.4.3.4 Inverter SelectionInverters are used in PV systems to produce ac power from a dc source, such as a PV array or batteries. Inverter sizes range from module-level inverters rated a few hundred watts to utility-scale inverters 1 MW and larger. Similar to the way PV systems are classified, types of PV inverters are also defined based on their application in stand-alone, utility-interactive, or a combination of both types of systems.
Stand-alone inverters operate from batteries and supply power independent of the electrical utility system. These inverters may also include a battery charger to operate from an independent ac source, such as the electric utility or a generator. See Fig 52.
Utility-interactive or grid-connected inverters operate from PV arrays and supply power in parallel with an electrical production and distribution network. They do not supply PV array power to loads during loss of grid voltage (energy storage is required). See Fig. 53.
2011 Jim Dunlop Solar Cells, Modules and Arrays: 5 - 66
Figure 64. Connecting similar PV devices in parallel increases current while voltage stays the same.
Voltage (V)
Cur
rent
(A)
Device 1+2independently
Devices 1+2in parallel
For PV devices in parallel:
Vparallel = V1 = V2 ….. = Vn (for similar devices)
Vparallel = (V1 + V2 … + Vn) / n
Iparallel = I1 + I2 ….. + In
2011 Jim Dunlop Solar Cells, Modules and Arrays: 5 - 67
Connecting Dissimilar PV Devices in Parallel
When dissimilar devices are connected in parallel, the individual currents add, and the voltage is the average of devices.
Vparallel = (VA + VB) / 2
Iparallel = IA + IB
B
A
Pos (+)Neg (-)
Figure 47. Connecting similar PV devices in parallel increases current while voltage stays the same.
Figure 48. Dissimilar current PV modules and strings having similar voltage may be connected in parallel.
2011 Jim Dunlop Solar Cells, Modules and Arrays: 5 - 68
Figure 65. Monopole PV arrays consist of two output circuit conductors; while bipolar PV arrays combine two monopole arrays with a center tap.
Bipolar ArrayMonopole Array
PV Array
Positive (+) Negative (-) Center Tap
PV Array
Positive (+) Negative (-)
PV Array
2012 Jim Dunlop Solar Cells, Modules and Arrays: 5 - 2
Bypass Diodes
When cells are not shaded, the bypass diode is reverse biased and does not conduct current
Shaded cell
When a cells is shaded, the bypass diode is forward biased and conducts current
Pos (+)Neg (-)
Figure 49. Monopole PV arrays consist of two output circuit conductors; bipolar PV arrays combine two monopole arrays with a center tap.
Figure 50. Bypass diodes are connected in parallel with series strings of cells to prevent cell overheating when cells or parts of an array are shaded.
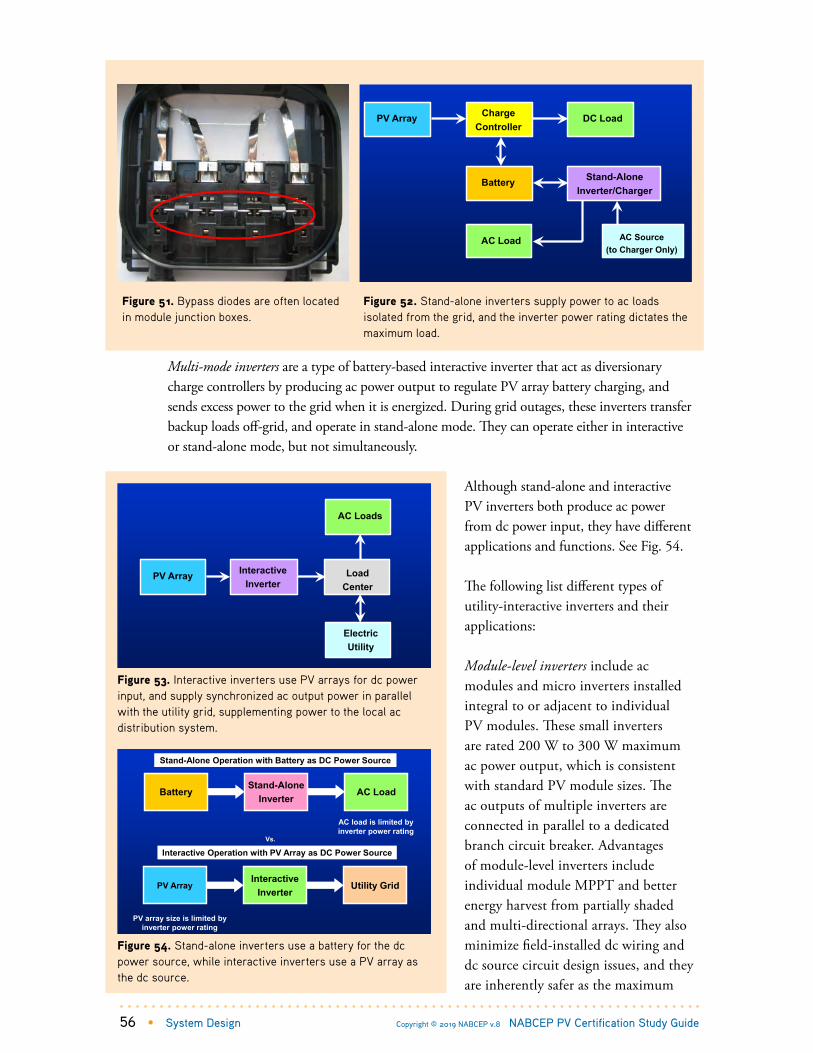
56 • System Design Copyright © 2019 NABCEP v.8 NABCEP PV Certification Study Guide
Multi-mode inverters are a type of battery-based interactive inverter that act as diversionary charge controllers by producing ac power output to regulate PV array battery charging, and sends excess power to the grid when it is energized. During grid outages, these inverters transfer backup loads off-grid, and operate in stand-alone mode. They can operate either in interactive or stand-alone mode, but not simultaneously.
Although stand-alone and interactive PV inverters both produce ac power from dc power input, they have different applications and functions. See Fig. 54.
The following list different types of utility-interactive inverters and their applications:
Module-level inverters include ac modules and micro inverters installed integral to or adjacent to individual PV modules. These small inverters are rated 200 W to 300 W maximum ac power output, which is consistent with standard PV module sizes. The ac outputs of multiple inverters are connected in parallel to a dedicated branch circuit breaker. Advantages of module-level inverters include individual module MPPT and better energy harvest from partially shaded and multi-directional arrays. They also minimize field-installed dc wiring and dc source circuit design issues, and they are inherently safer as the maximum
2011 Jim Dunlop Solar Cells, Modules and Arrays: 5 - 71
Figure 68. Stand-alone inverters supply power to ac loads isolated from the grid, and the inverter power rating dictates the maximum load.
DC LoadPV Array
Battery
ChargeController
Stand-AloneInverter/Charger
AC Load AC Source(to Charger Only)
Figure 51. Bypass diodes are often located in module junction boxes.
Figure 52. Stand-alone inverters supply power to ac loads isolated from the grid, and the inverter power rating dictates the maximum load.
2011 Jim Dunlop Solar Cells, Modules and Arrays: 5 - 70
Figure 67. Bypass diodes are often located in module junction boxes.
2011 Jim Dunlop Solar Cells, Modules and Arrays: 5 - 72
Figure 69. Interactive inverters use PV arrays for dc power input, and supply synchronized ac output power in parallel with the utility grid, supplementing power to the local ac distribution
system.
LoadCenter
PV Array InteractiveInverter
AC Loads
ElectricUtility
2011 Jim Dunlop Solar Cells, Modules and Arrays: 5 - 73
Figure 70. Stand-alone inverters use a battery for the dc power source, while interactive inverters use a PV array as the dc source.
BatteryStand-Alone
InverterAC Load
PV ArrayInteractive
InverterUtility Grid
Interactive Operation with PV Array as DC Power Source
AC load is limited by inverter power rating
PV array size is limited by inverter power rating
Stand-Alone Operation with Battery as DC Power Source
Vs.
Figure 53. Interactive inverters use PV arrays for dc power input, and supply synchronized ac output power in parallel with the utility grid, supplementing power to the local ac distribution system.
Figure 54. Stand-alone inverters use a battery for the dc power source, while interactive inverters use a PV array as the dc source.

System Design • 57 NABCEP PV Certification Study Guide Copyright © 2019 NABCEP v.8
dc voltages on the array are for a single module (35-60 V) as opposed to a series connection of several hundred volts for string inverters. See Fig. 55.
Residential string inverters are small inverters in the 1 kW to 12 kW size range, intended for residential and small commercial applications. They are generally single-phase and usually limited to 1 to 4 parallel-connected source circuits per input. Some integrate source circuit combiners, fuses and disconnects into a single unit. Larger systems using multiple string inverters offer a number of advantages in systems design and installation. Multiple inverters can be distributed at subarray locations, avoiding long dc circuits, and can be interconnected at distributed points in an electrical system. Multiple inverters also provide redundancy in the event of an individual inverter or subarray failure, and provide MPPT and monitoring at the subarray level, facilitating fault finding and optimizing the output of individual subarrays of different size, type, orientation or partially shaded. The ac output of multiple string inverters can be distributed equally across the three phases networks to avoid phase imbalance. See Fig. 56A and 56B.
3-phase string inverters start at 20 kW up to 150 kW, and interconnect to 3-phase grids. These inverters often have multiple inputs and can be used in commercial or large-scale PV systems.
Utility-scale inverters are very large equipment with power ratings 500 kW to 3 MW and higher, designed for solar farms. These types may also include medium-voltage (MV) transformers and switchgear, and are interconnected to the grid at voltages up to 500kV. For utility-controlled sites, certain variances with the NEC and product listing requirements may apply. Both utility-scale and central inverter installations require heavy equipment handling, larger conduit and switchgear, and should be installed by competent individuals having experience with the installation of large electrical equipment. See Fig. 57. These inverters are often used in large-scale plants meeting the requirements of the new Article 691.
Figure 56B. String inverters are small inverters in the 1 to 12 kW size range, intended for residential and small commercial applications.
Figure 56A. Stand-alone inverters convert DC power from batteries into AC power.
SMA Sunny Island
SolarEdge Inverter
Micro Inverter
Figure 55. AC modules and micro inverters are small inverters installed integral to or adjacent to individual PV modules.

58 • System Design Copyright © 2019 NABCEP v.8 NABCEP PV Certification Study Guide
Special controls may be used for utility-scale inverters that differ from smaller inverters due to their impact on grid operations. Smaller inverters are designed for near unity power factor output with tighter anti-islanding and power quality controls. Utility-scale inverters may be designed to deliver reactive power or low voltage ride through (LVRT), or provide other dynamic controls for grid support. As the amount of PV on the utility grid continues to increase, even small residential inverters are now capable of similar grid-support functions as large utility-scale inverters.
Multi-mode inverters are battery-based interactive inverters that provide grid backup to critical loads, with rated ac power output 2 kW to 10 kW. They can operate in either interactive or stand-alone mode, but not simultaneously, and many can interface and control auxiliary source, such as generators for hybrid system applications. These types of inverters and systems are used where a backup power supply is required for critical loads. Under normal circumstances when the grid is energized, the inverter acts as a diversionary charge controller, limiting battery voltage and state-of charge by supplying output power to ac loads or the grid. When the primary power source is lost, a transfer switch internal to the inverter opens the connection with the utility, and the inverter operates dedicated loads that have been disconnected from the grid. An external bypass switch is usually provided to allow the system to be taken off-line for service or maintenance, while not interrupting the operation of electrical loads. These inverters may also be used in hybrid system applications to control loads, battery charging, and generator starting.
2011 Jim Dunlop Solar Cells, Modules and Arrays: 5 - 76
Figure 73. Utility-scale inverters use higher DC input and AC output voltages to reduce losses, and the size and costs of the conductors and switchgear required.
Figure 57. Utility-scale inverters use higher DC input and AC output voltages to reduce losses, and the size and costs of the conductors and switchgear required.
AC Waveforms
For a pure sine wave, the peak voltage is related to the
RMS voltage by a factor of the square root of 2:
Vpeak = Vrms × 2 = Vrms × 1.414
Vrms = Vpeak × 0.707
For example, a typical AC voltage sine wave with peak
voltage of 170 V has an RMS voltage of 170 × 0.707 = 120 V.
For pure sine waves, the average voltage is also related to
RMS and peak voltage by:
Vrms = 1.11 × Vavg, or Vavg = 0.9 × Vrms.
Vavg = 0.637 × Vpeak, or Vpeak = 1.57 × Vavg.
For a square wave, Vavg, Vrms, and Vpeak are all equal.
See Fig. 76.
2011 Jim Dunlop Solar Cells, Modules and Arrays: 5 - 77
Figure 74. Sine waves, square waves and modified square waves are examples of common inverter ac waveforms.
Time >
Sine Wave
0
Modified Square Wave
Square Wave
Figure 58. For a pure sine wave, the peak voltage is related to the RMS voltage by a factor of the square root of 2.

System Design • 59 NABCEP PV Certification Study Guide Copyright © 2019 NABCEP v.8
Inverter circuits use high-speed switching transistors to convert dc to ac power. Large thyristors are used in high power applications up to several MW for HVDC power transmission at grid-interties. Most PV inverters use metal-oxide semiconductor field-effect transistors (MOSFETs) or insulated gate bi-polar transistors (IGBTs). Power MOSFETs operate at lower voltages with high efficiency and low resistance compared to IGBTs. They switch at very high speeds (up to 800 kHz) and are generally used in medium to low-power applications from 1 kW to 10 kW. IGBTs handle high current and voltage, but switch at lower speeds (up to 20 kHz), and are more common for high-voltage, large power applications up to an over 100 kW. Switching elements are connected in parallel to increase the current and power capability of an inverter.
Sine waves, square waves and modified square waves are examples of common inverter ac waveforms. Listed utility-interactive inverters produce utility-grade sine wave output. Some small, lower cost stand-alone inverters produce modified square wave or square wave output. See Fig. 59.
Selecting and specifying the best inverter for a given application involves considering the system design and installation requirements. Inverter specification sheets are critical. Inverter selection is often the first consideration in system design, and based on the type of loads or electrical service and voltage, and the size and location of the PV array.
Inverter Standards
The following standards apply to inverters used in PV systems, including requirements for
product listing, installation and interconnection to the grid.
UL 1741 Inverters, Converters, Controllers and Interconnection System Equipment for Use with Distributed Energy Resources addresses requirements for all types of distributed generation
equipment, including inverters and charge controllers used in PV systems, as well as the inter-
connection of wind turbines, fuel cells, microturbines and engine-generators.
IEEE 1547 Standard for Interconnecting Distributed Resources with Electric Power Systems, and IEEE
1547.1 Standard for Conformance Test Procedures for Equipment Interconnecting Distributed Resources
with Electric Power Systems are the basis for UL 1741 certification for interactive inverters.
Inverter installation requirements are governed by the NEC Articles 690 and 705. These articles cover
inverter installation requirement including sizing conductors and overcurrent protection devices,
disconnect means, grounding, and for connecting interactive inverters to the electric utility grid.
2011 Jim Dunlop Solar Cells, Modules and Arrays: 5 - 78
Figure 75. For a pure sine wave, the peak voltage is related to the RMS voltage by a factor of the square root of 2:
One cycle: 360Time >>
0
Sine wave has Vpeak = VRMS x √2
120
Volta
ge
170 Square wave has Vpeak = VRMS
-170
-120
Figure 59. Sine waves, square waves and modified square waves are examples of common inverter ac waveforms.

60 • System Design Copyright © 2019 NABCEP v.8 NABCEP PV Certification Study Guide
Specifications for inverters typically include:
DC Input• Maximum array or dc voltage (open-circuit, cold)• Recommended maximum array power• Start voltage and operating range (interactive inverters only)• MPPT voltage range (interactive inverters only)• Maximum usable input current (interactive inverters)• Maximum array and source circuit current• Array ground fault detection
AC Output• Nominal voltage• Maximum continuous output power• Maximum continuous output current• Maximum output overcurrent device rating• Power conversion efficiency• Power quality• Anti-islanding protection
Performance• Nominal and weighted efficiencies• Stand-by losses (nighttime)• Monitoring and communications interface
Physical• Operating temperature range• Size and weight• Mounting locations, enclosure type• Conductor termination sizes and torque specifications• Conduit knockout sizes and configurations
Other Features• Integral dc or ac disconnects• Number of source circuit combiner and fuse/circuit ratings• Standard and extended warranties
Inverter efficiency is calculated by the ac power output divided by the dc power input. Inverter efficiency varies with power level, input voltage and temperature, among other factors. For example, an inverter having an input power of
2011 Jim Dunlop Solar Cells, Modules and Arrays: 5 - 79
Figure 76. Inverter efficiency is calculated by the AC power output divided by the DC power input.
5700 0.95 95%6000
where = inverter efficiency = AC power ouput (W) = DC power input (W)
ACinv
DC
inv
AC
DC
PP
PP
η
η
= = = =
AC Output:5700 W
DC Input:6000 W
Losses: 300 W
Inverter
Figure 60. Inverter efficiency is calculated by the ac power output divided by the dc power input.

System Design • 61 NABCEP PV Certification Study Guide Copyright © 2019 NABCEP v.8
6000 Wdc and producing and output of 5700 Wac has an efficiency of 5700 ÷ 6000 = 0.95 = 95%. See Fig 60.
In addition to product safety testing and listing to the UL1741 standard, the California Energy Commission (CEC) has established requirements for independent inverter efficiency testing by an NRTL to be approved as eligible equipment. Incentive programs in other states also require the use of PV modules and inverters on the CEC list. A complete list of eligible inverters and test results are available online.
Inverter efficiency testing is conducted over the entire power range of the inverter, and at minimum, maximum and nominal dc operating voltages. Inverter efficiency rises quickly with a low power levels, and most inverters reach at least 90% efficiency at only 10% of their maximum continuous output power rating. See Fig 61.
Reference: List of Eligible Inverters per SB1 Guidelines, California Energy Commission: http://www.gosolarcalifornia.org/equipment/inverters.php
1.4.4. Conductor and Conduit Size Calculations
There are several circuits in PV systems depending on the type of system installed. Some circuits are dc and others are ac, operating at
2011 Jim Dunlop Solar Cells, Modules and Arrays: 5 - 81
Figure 78. The PV power source consists of the complete PV array dc power generating unit, including PV source circuits, PV output circuits, and overcurrent protection devices as required.
PV Module
PV Output Circuit
Photovoltaic Power Source
PV Array PV Source Circuits
To disconnect means and DC equipment
Figure 62. The PV power source consists of the complete PV array dc power generating unit, including PV source circuits, PV output circuits, and overcurrent protection devices as required.
2011 Jim Dunlop Solar Cells, Modules and Arrays: 5 - 82
Figure 79. For simple interactive PV systems, the PV array is connected to the dc input of inverters, and there is no energy storage.
Interactive System
PV Array
Source Circuit Combiner Box
DC Fused Disconnect
Ground FaultProtection
AC Fused Disconnect
Electric Utility
Utility Disconnect
Integral components in many small string inverters < 12 kW
PV Source CircuitsPV Output
Circuit Inverter Input Circuit Inverter Output Circuit
Inverter Main Service Panel
2011 Jim Dunlop Solar Cells, Modules and Arrays: 5 - 83
Figure 80. For stand-alone PV systems the PV array charges the battery, and the battery provides dc power to the inverter which can produce ac power output at any time.
Stand-Alone System
PV Array
Source Circuit Combiner Box
PV Fused Disconnect
Ground FaultProtection
Inverter Fused Disconnect
Auxiliary AC Source
PV Source Circuits
PV Output CircuitInverter DC input Circuit
Inverter/ Charger
Battery
Charge Controller Battery Fused
Disconnect
Inverter Output Circuit
AC Loads
DC Loads
Figure 63. For simple interactive PV systems, the PV array is connected to the dc input of inverters, and there is no energy storage.
Figure 64. For stand-alone PV systems the PV array charges the battery, and the battery provides dc power to the inverter which can produce ac power output at any time.
2011 Jim Dunlop Solar Cells, Modules and Arrays: 5 - 80
Figure 77. Inverter efficiency testing is conducted over a range of operating voltages and power levels.
California Energy Commission
Calif
orni
a En
ergy
Com
mis
sion
Figure 61. Inverter efficiency testing is conducted over a range of operating voltages and power levels.

62 • System Design Copyright © 2019 NABCEP v.8 NABCEP PV Certification Study Guide
different voltages and currents, and of varying length and environmental exposure. Some of these circuits have special requirements for sizing the circuit conductors and overcurrent protection. The PV installer should be able to clearly identify the different circuits in a PV system and their installation requirements [NEC 690.2]. See Figs. 62, 63 & 64.
1.4.4.1 Determine Circuit CurrentsPV Source Circuit Maximum CurrentThe required ampacity of the source circuit wiring, or conductors from modules to source circuit combiner box, depends upon the rated PV module short-circuit current (Isc). The maximum current for PV source circuits is determined by 125% of the sum of the module rated short-circuit currents in parallel [NEC 690.8(A)]. Since most crystalline silicon arrays only have one series string per source circuit, there is normally no need to account for parallel circuits in the source circuit calculation. The reason for the 125% factor is that in certain locations and times of the year, it is possible for the modules to operate at 125% of the STC short-circuit current rating for 3 hours or more around solar noon. For example, consider a module with short circuit rating of 8.41 A. The maximum continuous current rating of that module is 125% of the STC short-circuit current rating, or 1.25 × 8.41 A = 10.5 A.
PV Output Circuit Maximum CurrentThe maximum current for the PV output circuit and the entire PV power source is the sum of all parallel source circuits supplying dc power. The maximum circuit current for a typical PV array with three series strings is the sum of the three source circuit maximum currents. For the example with a maximum source circuit current of 10.5 A, the maximum current for the PV output circuit having three of these source circuits in parallel would be 3 × 10.5 A = 31.5 A.
Example:
A residential rooftop PV system has 3 pairs of conductors in a sunlit raceway mounted 1½” above the roof surface
in Palm Springs, California (2017 NEC no longer requires temperature adder for conduit 7/8” above roof). The
short-circuit current of each source circuit is 8.41 amps. What is the minimum size conductor for this scenario?
Answer:Step 1: Calculate Maximum Circuit Current [690.8(A)(1)]: Imax = Isc 1.25 = 8.41 A 1.25 = 10.5 A
Step 2: Calculate the minimum overcurrent protective device (OCPD) [690.9(B)(1)]: OCPD = Imax 1.25 = 10.5 A 1.25 = 13.1 A 14 A
Step 3: Calculate minimum conductor size without conditions of use [690.8(B)(1)]Minimum conductor ampacity = Imax 1.25 = 13.1A 14 AWG (minimum bldg wire, Table 310.15(B)(16)
Step 4: Calculate minimum conductor size based on Imax with conditions of use [690.8(B)(2)]:Conditions of use include conduit fill, sunlit conduit temperature adder, and ambient temperature adjustment factors. Conduit fill adjustment factor 0.8 according to Table 310.15(B)(3)(a)Ambient temperature adjustment factor 44°C 0.87 [Table 310.15(B)(2)(a)]Minimum conductor ampacity = Imax conduit fill adj factor temp adj factor = 10.5 0.8 0.87 = 15.1A 12 AWG
Step 5: Determine if 15 Amp overcurrent protection can protect the conductor under conditions of use [690.8(B)(2)(c)] 12 AWG ampacity = 30 A 0.8 0.87 = 20.88 A (okay)

System Design • 63 NABCEP PV Certification Study Guide Copyright © 2019 NABCEP v.8
Inverter Output Circuit Maximum CurrentThe inverter output circuit is defined as the ac circuit from the inverter output to the utilization load. In the case of utility-interactive installations, the inverter output circuit is the ac output that connects to the interactive point of utility connection. This pointof connection in residential PV systems is often a simple circuit breaker in a utility-fed service panel. The maximum current of the inverter output circuit is the continuous current capability of the inverter (continuous = 3-hour rating). The maximum continuous current of an inverter may be listed on the product specification sheet. If it is not available on the specification sheet, then the current can be calculated by taking the continuous power rating at 40°C and dividing that value by the nominal ac voltage. For example, the maximum current for an inverter with maximum continuous power output of 7,000 W at 240 Vac would be 29 A.
Battery Circuit CurrentBattery circuits are unique in that they carry not only the dc current required to run the inverter at full load continuously (for 3 hours), but they must also carry ac current. This may surprise some installers, but all inverters require an ac input in order to create and ac output. Since dc sources such as a PV array do not naturally provide these ac currents, a short-term storage device is necessary. In utility-interactive inverters, these storage devices are capacitors. Each time the ac power goes to zero, when the ac voltage goes to zero, the power from the PV array is stored in the capacitor. That energy is rereleased at the peak of the next waveform. Therefore current is stored and removed from the capacitor two times every cycle. When the required frequency is 60 Hertz, the frequency on the capacitors is 120 Hertz. This storage is sometimes called half-wave storage. In battery-based inverters, rather than installing capacitors, the battery is used for half-wave storage. Current that is needed to create the sine wave is stored and removed from the battery. This means that additional current is travelling on the battery input conductors that must be accounted for.
1.4.4.2 Calculate Required Ampacity of ConductorsTemperature and Conduit Fill Corrections for Ampacity of ConductorsThe required ampacity of conductors is based on the maximum circuit current, the size of the overcurrent protection device, the ambient temperature of the conductor, the type of conductor and insulation, the conduit fill of the conductor, and any limitations that the terminals may place on the conductor. PV systems are some of the most complex wiring systems to determine wire sizing due to the large number of factors that must be considered when choosing an adequate wire size. Fortunately, starting in the 2011 edition, the NEC has clearer direction on this subject that helps installers and system designers more accuratelyspecify wire sizes. To illustrate the proper code-approved method, it is beneficial to do an example using NEC 690.8.
PV Source CircuitsOutside ConduitExposed outdoor cables are common in PV systems and in industrial conventional electrical systems, but they are less common in commercial and residential electrical systems.

64 • System Design Copyright © 2019 NABCEP v.8 NABCEP PV Certification Study Guide
Conductors as single conductor cables, or bundles of three conductors or less, are commonly run in PV arrays from a few kilowatts up to megawatts. Since these conductors are often run for some distance in free air, it would be possible to claim free air ampacities for those exposed lengths of cables [NEC Table 310.15(B)(17)]. However, these exposed conductors are often run into raceways for physical protection and support. As long as the sections of raceway protection are not more than 10 ft or 10% of the circuit length, then free air ampacities can be used [NEC 310.15(A)(2)].
Bundled or Inside ConduitIn almost all cases, wiring behind modules will be exposed to elevated temperatures, sometimes as high as 75°C. The NEC also recognizes the fact that conductors installed in conduit exposed to direct sunlight, as is common in PV systems, can operate at temperatures that are 33°C above the ambient temperature where installed closer than 7/8˝ to the roof. This means that a conduit in an outdoor temperature of 40°C should actually be sized based on a 62°C operating temperature due to sunlight exposure. Suppose the conductors are exposed to 62°C and that 14 AWG THWN, with insulation rated at 75°C, is being considered. According to NEC Table 310.15(B)(16), when THWN wire is operated at 30°C or less, its ampacity is 20 A. But the correction factor associated with Table 310.15(B)(2)(a) requires that the ampacity of the wire be corrected to 47% of its 30°C value if it is operated at 62°C. This reduces the ampacity of the 14 AWG THWN wire to 20 A x 0.47 = 9.4 A.It is therefore recommended to never install conduit closer than 7/8˝ from the roof to prevent this adder from being required. Also, conduit that is closer than 7/8˝ to the roof is much more likely to capture debris, creating other problems. Simply elevating the conduit to 7/8˝ permits the 14 AWG THWN wire to have nearly double the ampacity (20 A x 0.88 = 17.6 A).
Wherever 4-6 current carrying conductors are bundled or enclosed in the same conduit or raceway, according to NEC Table 310.15(B)(3)(a), a further adjustment of 80% is needed for conduit fill. This reduces the ampacity of the 14 AWG THWN conductors to 17.6 A x 0.8 = 14.08 A. The ampacity of the conductor, after the application of these “conditions of use” factors must be equal to or greater than the maximum circuit current, or a larger size conductor is required.
The fuse protecting the conductors must also be rated at 1.25 times the maximum current (1.56 times Isc), which is 13.1 A, and that fuse must provide overcurrent protection for the conductor under its conditions of use. The fuse rating can be rounded up to the next higher standard value (15 A), which will protect the cable, which has a corrected ampacity of 14.08 A. The 14 AWG THWN conductor therefore is acceptable.
However, if a 14 AWG THWN-2 copper wire is used, the 30°C ampacity is 25 A. Furthermore, the temperature correction factor for 40°C operation is 0.91. The resulting ampacity of the 14 AWG THWN-2 conductor, when corrected for temperature and for conduit fill becomes 25 x 0.91 x 0.8 = 18.2 A, which is adequate to handle the maximum source circuit current. It can also be protected with a 20 A fuse.
When using conductors with insulation temperature ratings higher than the terminal temperature rating of the connected devices, a check must be made to ensure that the conductor temperature during normal operation does not exceed the maximum

System Design • 65 NABCEP PV Certification Study Guide Copyright © 2019 NABCEP v.8
temperature rating of the terminals of these devices. In this case the module terminals are rated at 90°C and the fuse terminals are typically rated at 75°C. The ampacity of the 14 AWG conductor taken from the 75°C insulation column in NEC Table 310.15(B)(16) is 20 A. The continuous current in this circuit is only 10.5 A so it is assured that the 14 AWG conductor will operate at temperatures well below 75°C at the fuse terminals if the terminals are in an ambient temperature of 30°C. Although there is no direction in the NEC to correct for terminals in hotter than 30°C temperatures, a conservative approach would be to correct fuse terminals in a 40°C environment similar to conduit not exposed to sunlight. The maximum allowable current would then be corrected by the 40°C correction factor of 0.88 (0.88 x 20 A = 17.6 A). Fortunately, the maximum continuous current is only 10.5 A which is well below the maximum of 17.6 A.
PV Output CircuitBundled or Inside ConduitPV power source circuits, similar to feeder circuits in conventional ac distribution in buildings are typically run inside conduit. Occasionally these circuits are bundled together and run in cable trays. In either case, adjustment factors must be applied to the allowable ampacity of the conductors to prevent the insulation from being damaged by overheating. Table 310.15(B)(3)(a) covers the adjustment factors required for conductors in raceways or multi-conductor cables. Bundles of single conductor cables would generally be required to use these adjustment factors.
Inverter Output CircuitThe inverter output circuit is sized according to 690.8(A)(3), which states that the conductor shall be sized according to the maximum continuous current output of the inverter. The overcurrent device protecting the wire must be sized at least 1.25 times the continuous current. The chosen overcurrent device should be the sized according to the conductor ampacity after conditions of use or the next standard size above that ampacity. If the overcurrent device is sized larger than the next available size, when the max OCPD rating for the inverter allows a larger size, then the conductor size must be increased to match the OCPD rating.
Battery CircuitTo properly calculate the required ampacity of the inverter input circuit in an energy storage system, the maximum input current needs of the inverter must be calculated and then the RMS ac current of the inverter operation should be numerically added. EXAMPLE: A 6000 Watt (Volt-Amp) inverter is connected to a large battery bank at 48 Volts. Inverter is operating at full capacity and lowest dc operating voltage of 44 Volts. What is the total current flowing through the inverter input circuit conductors for a 90% efficient inverter with 45 amps of ac ripple current on the battery?
Step 1: Calculate dc current: Idc = inverter power ÷ inverter efficiency ÷ dc voltage at minimum operating voltage = 6000 VA ÷ 0.9 ÷ 44 V = 152 A [690.8(A)(4)]Step 2: Total current = Idc + Iac ripple = 152 A + 45 A = 197 A Size Equipment Grounding Conductor for Each CircuitThe equipment grounding conductor (EGC) for the dc side of the PV system is sized according to NEC 690.45. Since most PV systems related to residential and commercial buildings must have ground-fault protection systems [NEC 690.41(B)]. NEC 690.45 requires

66 • System Design Copyright © 2019 NABCEP v.8 NABCEP PV Certification Study Guide
the minimum size EGC to be based on Table 250.122. The size of EGC size is not required to be increased if the current carrying conductors are increased in size to address voltage drop.
1.4.4.3 Calculate Voltage DropVoltage Drop for CircuitsIt is wasteful to dissipate energy to heat wires when the cost of larger wires is usually minimal compared with the cost of PV modules. Voltage drop is often the determining factor in wire sizing particularly for systems operating below 100 Volts. Voltage drop is not a safety issue, therefore it is not covered in great detail in the NEC. However PV systems with excessive voltage drop are inefficient and can perform poorly.
Once the NEC requirements for ampacity have been met, the voltage drop must be verified that it is within acceptable limits for efficiency and quality performance. For any given wire size, voltage drop increases with increasing currents and/or increasing wire lengths. Therefore circuits with high current and/or long lengths deserve close scrutiny with respect to voltage drop. This is particularly true of systems operating at 12 V, 24 V, or 48 V, but even higher voltage systems can have significant voltage drop issues as a result of long circuits.
There is no specified code compliance limit for voltage drop in any given circuit. Generally accepted practices within the industry limit overall system voltage drop within a range of 2% to 5% of the circuit operating voltage. The PV system designer must use their best judgment considering performance and economics.
Five percent is generally considered a maximum overall acceptable voltage drop from source to load. In order to achieve this 5% limit you will have to limit intermediate runs within a circuit to a lesser percentage voltage drop. For instance, intermediate circuit runs such as “PV array to PV combiner box” and “PV Combiner box to PV charge controller” must be limited to less than 2 % each in order to stay within 5% overall. Determining Voltage DropIf the one-way distance between two points is expressed as length (d) in feet, recognize that the total wire length of a circuit between these two points will be 2 x d. Ohm’s Law (Vd = I x R) provides the basic equation to find voltage drop in conductors, where Vd is the amount of voltage drop in the conductor at the highest expected current level. The Ω/kft term is the resistance of the conductor in ohms/1000 feet and is presented in the NEC Chapter 9, Table 8.
Vd I R
R 2 d kft Ω 1000 ft kft
Vd I 2 d
Ω 1000 ft / kft kft
2 d I Ω%Vdrop
Vd 100% 1000 ft / kft
kft
100% Vnom Vnom

System Design • 67 NABCEP PV Certification Study Guide Copyright © 2019 NABCEP v.8
Where I is the circuit current in Amperes, which for source circuits is usually taken as the maximum power current, Imp, Vnom is the nominal system voltage, which, in this case, is 24V, and Ω/kft is found from NEC Chapter 9, Table 8, “Conductor Properties.”
The resistance for 14 AWG stranded copper uncoated wire is 3.14, Ω/kft. Assuming the distance from junction box to source circuit combiner box to be 40 ft, the %Vdrop is found, after substituting all the numbers into the formula, to be
Clearly a value of 7.3% is high and is well above the recommended target of 1-3%. Even though 14 AWG THWN wire may meet the ampacity requirements of the NEC, it falls quite short of meeting the voltage drop requirements for system performance. If the target % Vdrop is less than 2% from junction box to combiner box, what would be the correct conductor size? To find the correct conductor size, substitute in the Ω/kft values for other wire sizes until a size is found that will meet the voltage drop requirements. Substituting the value for Ω/kft for 12 AWG stranded copper gives % Vdrop = 4.62%, which is still too high. For 10 AWG stranded copper, the result is % Vdrop = 2.89%, and for 8 AWG stranded copper, the result is % Vdrop = 1.82%, which meets the performance requirement. The distance from source-circuit combiner box to charge controller also must be calculated. Assuming a distance of 10 feet, the %Vdrop can be calculated using the equation below to be:
2 10 ft 14A Ω%Vdrop
1000 ft / kft 1.24
kft 100% 1.45%
24V
2 40 ft 7A Ω%Vdrop
1000 ft / kft 3.14
kft 100% 7.3%
24V
Circuit NameTotal
Distance(kft)Current (amps)
Wire Size
Ω/kft Vdrop %Vdrop
Dc circuits (@ 24 V)
Module wiring 0.012 7 12AWG 1.98 0.166 V 0.69 %
Array to J-box 0.02 7 10AWG 1.24 0.174 V 0.72%
J-box to Combiner 0.08 7 8AWG 0.778 0.436 V 1.82%
Combiner to CC 0.01 21 6AWG 0.491 0.103 V 0.43%
CC to Disco 0.006 21 6AWG 0.491 0.062 V 0.26%
Disconnect to inverter 0.006 21 6AWG 0.491 0.062 V 0.26%
Dc Vdrop total 1.003 V 4.18%
Ac Circuits (120 V)
Inverter to disconnect 0.01 6 amps 10AWG 1.2 0.072 V 0.06%
Disconnect to Service Panel 0.05 6 amps 10AWG 1.2 0.36 V 0.3%
Ac Vdrop total 0.36%
Overall Vdrop total 4.54%
Table 2. Conductor voltage drop example.

68 • System Design Copyright © 2019 NABCEP v.8 NABCEP PV Certification Study Guide
This voltage drop is high for such a short wire run, and as 8 AWG is being used for the wire runs from the junction box to the source-circuit combiner box, it is recommended that 6 AWG be used between the combiner box and the charge controller. The voltage drop over this circuit will then be reduced to 0.9%. This exercise shows how large the conductors must be in 24 V systems to carry small amounts of current.
To achieve overall system voltage drops that are within 3% to 5%, individual circuits must have much lower voltage drops. To illustrate the need to keep these voltage drops at reasonable levels, the following table (Table 2) shows one way of tracking voltage drop to maintain it within appropriate levels. Not all systems will have all these different circuits, but it becomes easy to see how voltage drops can add up if care is not taken throughout the wire sizing process. The following table shows how a typical wire sizing exercise would proceed.
The example in this table is very typical of a well-designed, 24 V PV system. It also illustrates where increasing wire size will initially have the most impact—in the J-box to combiner circuit. By increasing this circuit size from 8 AWG to 6 AWG, the voltage drop will reduce by about 0.7% overall. However, the larger size wire will require the next size larger conduit to accommodate these circuits. An overall voltage drop of less than 5% for a 24 V system is a good target and getting voltage drop below 3% is extremely difficult for these very low voltage systems. A 48 V system will drop the dc voltage drop impact to 25% of that seen with 24 V systems for the same wire sizes shown in the table, yielding an overall system voltage drop near 1%. This is one of the main reasons why 48 V battery-based systems are generally recommended over 24 V systems. Other unavoidable voltage drops not calculated in this table include voltage drops in fuses, circuit breakers, and switches which can add up to 0.5% for a 24 V system. Additionally, charge controllers can cause another 1% to 4% voltage drop depending on the product.
If the wiring from the modules to the junction box is exposed, the NEC requires the wire must be listed as or marked “sunlight-resistant.” A suitable insulation type for this application is USE-2 that is also rated RHW-2. The most common conductor used in the past several years is Type PV Wire which can be even better than USE-2/RHW-2. Even if exposed wiring is used, the ampacities of NEC Table 310.15(B)(16) must still be used if the conductors terminate at equipment (PV modules). As a final note on voltage drop, it is common practice to use smaller wiring between modules and junction boxes, and then increase the wire size between the junction box and the string combiner box. As the wire size is increased to meet voltage drop requirements, then it is important to be sure that lugs or terminals in each of the boxes can accommodate the larger wire size. It is required that the box itself be large enough for the wire. If wire sizes in junction boxes are 6 AWG and smaller, the minimum box size is found from either NEC Table 314.16(A) or Table 314.16(B). If conductors larger than 6 AWG are in the box, then the installation must comply with NEC 300.4(F), and the box size should be determined in accordance with NEC 314.28(A). Listed PV combiner boxes will have terminals and wire bending space consistent with the current ratings of the device. Some will accommodate the larger wires necessary to address voltage-drop requirements.


70 • System Design Copyright © 2019 NABCEP v.8 NABCEP PV Certification Study Guide
1.4.4.4 Select Size and Type of Conductor Based on Location, Required Ampacity, and Voltage Drop
The previous sections have described how to determine the required size of a conductorbased on the ampacity and voltage drop requirements. The NEC states that all conductors in conduit installed in exposed locations (outdoors, on rooftops), or underground must be rated for wet locations (NEC 300.9 and 300.5(B) respectively). A common misconception is that conductors in watertight conduit do not have to be wet rated. All outdoor and underground conduit systems have moisture in them that will condense under the right conditions.
When selecting conductors for outdoor conduit systems, the conductor should have a “W” in the wire designation for wet rating. Since rooftops are high temperature environments, it is often necessary to select 90°C rated conductors. The most commonly selected conductors for rooftop conduit in PV systems are THWN-2, XHHW-2, and RHW-2. The THHN designation, while rated for 90°C, is not rated for wet locations. The THWN and XHHW designations, while rated for wet locations are not rated for 90°C in wet locations. USE-2 and PV wire is often run from the PV modules to the inverter in conduit. This is acceptable as long as the conduit run is exterior to the building, or if run interior, the conductor carries an indoor conductor designation such as XHHW-2 or RHW-2 (USE-2 should always be ordered with RHW-2 designation as well because the combined rated product is required to pass the same sunlight tests as PV Wire). Most conductors carry multiple designations, which causes some confusion for installers. All that matters when reviewing conductor designations is that the one designation needed for the location is listed on the conductor insulation. Just because one designation, like USE-2, is prohibited indoors does not exclude the conductor from being installed indoors as long as the conductor has one of the allowed indoor designations like RHW-2.
1.4.4.5 Select Conduit for ConductorsSelect Conduit Type Based on ApplicationWhen using conduit as the wiring method, the type of conduit selected is based on a variety of factors including physical protection, sunlight resistance, temperature extremes, and corrosion resistance. In tropical climates where the temperature differences are small and corrosion is severe, PVC conduit systems are common. PVC is also commonly used underground because of its corrosion resistance and the fact that ground temperature does not fluctuate as much as air temperature. However, in climates with large temperature swings and less corrosion concerns like desert areas, steel conduit systems are much more common such as EMT and IMC. Occasionally, the physical protection needs of the installation are high in places like parking garages and hospitals. These locations often require rigid steel RMC conduit. Locations with large expansion and contraction concerns due to long conduit runs may favor IMC over EMT since the pipe is threaded and less susceptible to compression fittings vibrating loose over time.
Ultimately, whatever wiring method is selected will require some maintenance over time. The type and amount of maintenance will depend on the local conditions and the response of the selected conduit to those conditions. Life-cycle costs for conduit and wiring systems must be considered when selecting the most appropriate conduit for a PV project.
Select Conduit Size Based on Type and Conductor FillThe NEC states that the maximum fill for a conduit based on the ratio of the sum of the cross-sectional area of the wires to the inner cross-sectional area of the conduit can be no

System Design • 71 NABCEP PV Certification Study Guide Copyright © 2019 NABCEP v.8
more than 40% (NEC Chapter 9, Table 1). There is no differentiation made based on conduit type or conductor type. However, conductors with thicker rubberized insulation generally need more room than slicker thermoplastic insulations. Regardless of the conductor type, it is best for a goal of 25% conduit fill for easier pulling of conductors through conduit.
Select Expansion Joints Based on Type, Temperature, and Fixed DistanceExpansion fittings are required on straight runs between fixed points depending on the straight distance, the temperature fluctuations, and the type of conduit. PVC has the largest expansion rate of commonly used wiring methods having 5 times the expansion of steel conduit. Given the temperature changes in much of the United States, PVC rooftop conduit systems will require expansion fittings for all constrained straight runs over 20 feet (not a misprint) and require one 4" expansion fitting every 75 feet in the run [Table 352.44]. Steel conduit, such as IMC, requires expansion fittings for all constrained runs over 100 feet and requires one 4" fitting every 375 feet in the straight run.
1.4.5 Overcurrent Protection Selection CriteriaOnce the wire size from the junction box to the source-circuit combiner box has been determined, the source-circuit fuse sizes need to be determined. These fuses or circuit breakers (both known as overcurrent protective devices (OCPD)) are installed to protect the PV modules and wiring from excessive reverse current flow that can damage cell interconnects and wiring between the individual PV modules. The maximum size fuse is specified by the PV module manufacturer and approved as part of the module listing. The fuse size marked on the back of the module must be at least 156% (1.25 x Imax) of the STC-rated module short-circuit current to meet NEC requirements for overcurrent protection. It can be larger if the module manufacturer has tested and listed the module with a larger value. The fuse will generally be a dc-rated cartridge-type fuse that is installed in a finger-safe pullout-type fuse holder. The finger-safe holder is necessary, as each end of the fuse holder will typically be energized at a voltage close to the maximum system voltage. These fuses are available in 1-amp increments from 1 A to 10 A, with other larger sizes as provided for in NEC 240.6(A). However, even though the code may state the standard fuse sizes, fuse manufactures may not make all standard sizes.
1.4.6 Design Energy Storage SystemsA battery converts chemical energy to electrical energy when it is discharged, and converts electrical energy to chemical energy when it is charged. Because the power produced by PV arrays does not always coincide with electrical loads, batteries are commonly used in most stand-alone PV systems to store energy produced by the PV array, for use by system loads as required. Batteries also establish the dc operating voltage for the PV array, charge controllers and dc utilization equipment, including inverters and dc loads, as applicable. As solar PV and battery prices decrease and as intermittent renewable energy on the grid increases, policies in different places will often make grid-connected energy storage feasible. Energy storage includes losses due to “round trip efficiency” and the extra expense of the equipment.
Batteries when used in interactive systems require special types of battery-based inverters intended for interactive operation, also called multimode inverters. These inverters operate as diversionary charge controllers and dump excess PV array energy to the grid when it is energized. When there is a loss of grid voltage, these inverters are usually designed to transfer loads from the grid to operate in stand-alone mode. Interactive systems with battery backup
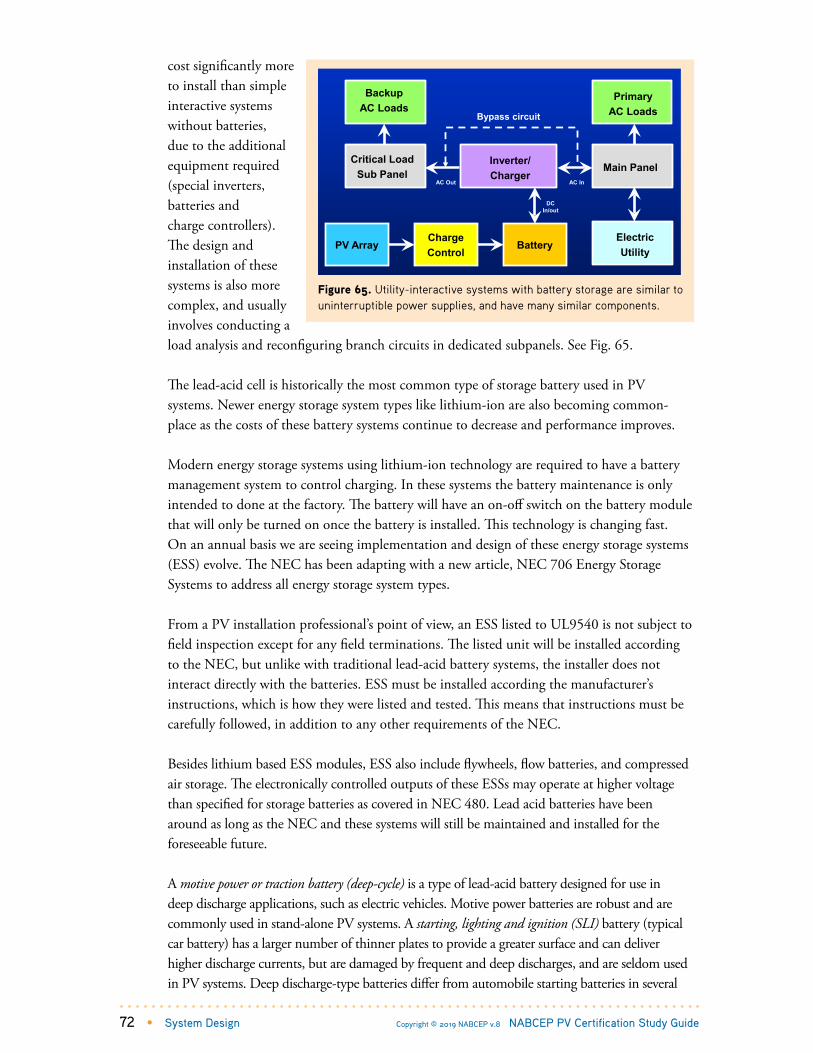
72 • System Design Copyright © 2019 NABCEP v.8 NABCEP PV Certification Study Guide
cost significantly more to install than simple interactive systems without batteries, due to the additional equipment required (special inverters, batteries and charge controllers). The design and installation of these systems is also more complex, and usually involves conducting a load analysis and reconfiguring branch circuits in dedicated subpanels. See Fig. 65.
The lead-acid cell is historically the most common type of storage battery used in PV systems. Newer energy storage system types like lithium-ion are also becoming common-place as the costs of these battery systems continue to decrease and performance improves.
Modern energy storage systems using lithium-ion technology are required to have a battery management system to control charging. In these systems the battery maintenance is only intended to done at the factory. The battery will have an on-off switch on the battery module that will only be turned on once the battery is installed. This technology is changing fast. On an annual basis we are seeing implementation and design of these energy storage systems (ESS) evolve. The NEC has been adapting with a new article, NEC 706 Energy Storage Systems to address all energy storage system types.
From a PV installation professional’s point of view, an ESS listed to UL9540 is not subject to field inspection except for any field terminations. The listed unit will be installed according to the NEC, but unlike with traditional lead-acid battery systems, the installer does not interact directly with the batteries. ESS must be installed according the manufacturer’s instructions, which is how they were listed and tested. This means that instructions must be carefully followed, in addition to any other requirements of the NEC.
Besides lithium based ESS modules, ESS also include flywheels, flow batteries, and compressed air storage. The electronically controlled outputs of these ESSs may operate at higher voltage than specified for storage batteries as covered in NEC 480. Lead acid batteries have been around as long as the NEC and these systems will still be maintained and installed for the foreseeable future.
A motive power or traction battery (deep-cycle) is a type of lead-acid battery designed for use in deep discharge applications, such as electric vehicles. Motive power batteries are robust and are commonly used in stand-alone PV systems. A starting, lighting and ignition (SLI) battery (typical car battery) has a larger number of thinner plates to provide a greater surface and can deliver higher discharge currents, but are damaged by frequent and deep discharges, and are seldom used in PV systems. Deep discharge-type batteries differ from automobile starting batteries in several
2011 Jim Dunlop Solar Solar Radiation: 2 - 27
Figure 25. Utility-interactive systems with battery storage are similar to uninterruptible power supplies, and have many similar components.
Inverter/Charger
Critical LoadSub Panel
BackupAC Loads
Main Panel
PrimaryAC Loads
ElectricUtility
Bypass circuit
BatteryPV Array
AC Out AC In
DC In/out
ChargeControl
Figure 65. Utility-interactive systems with battery storage are similar to uninterruptible power supplies, and have many similar components.
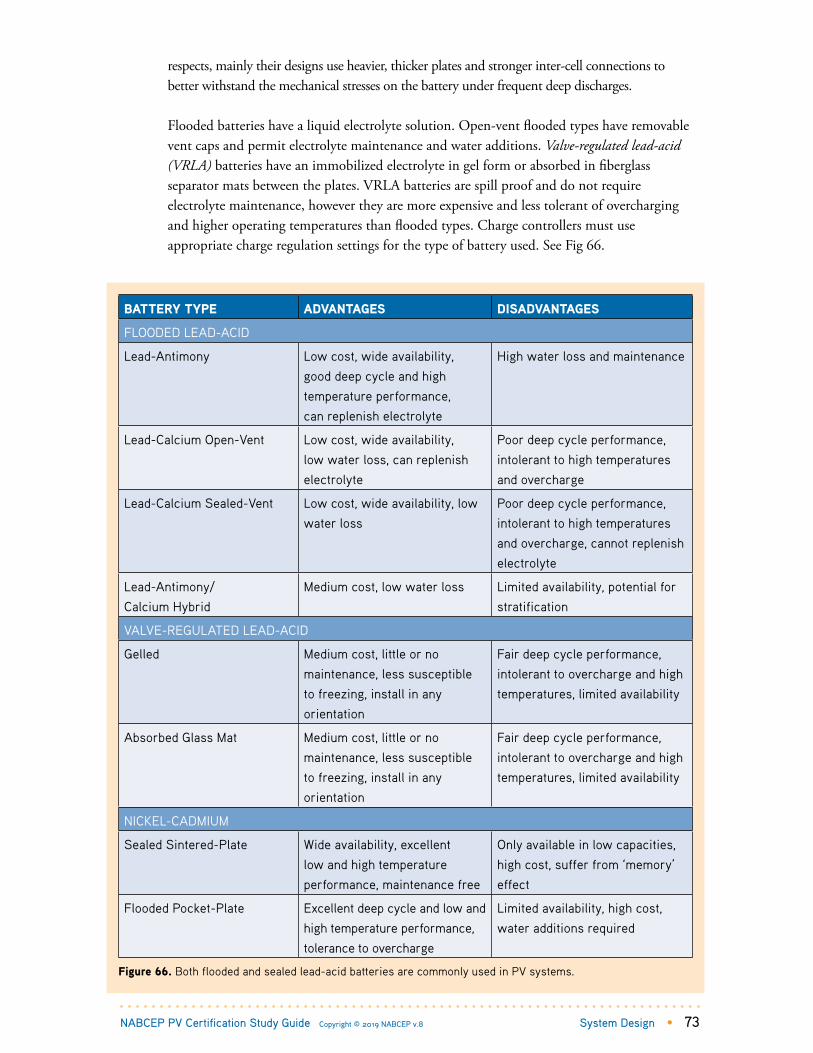
System Design • 73 NABCEP PV Certification Study Guide Copyright © 2019 NABCEP v.8
respects, mainly their designs use heavier, thicker plates and stronger inter-cell connections to better withstand the mechanical stresses on the battery under frequent deep discharges.
Flooded batteries have a liquid electrolyte solution. Open-vent flooded types have removable vent caps and permit electrolyte maintenance and water additions. Valve-regulated lead-acid (VRLA) batteries have an immobilized electrolyte in gel form or absorbed in fiberglass separator mats between the plates. VRLA batteries are spill proof and do not require electrolyte maintenance, however they are more expensive and less tolerant of overcharging and higher operating temperatures than flooded types. Charge controllers must use appropriate charge regulation settings for the type of battery used. See Fig 66.
BATTERY TYPE ADVANTAGES DISADVANTAGES
FLOODED LEAD-ACID
Lead-Antimony Low cost, wide availability,
good deep cycle and high
temperature performance,
can replenish electrolyte
High water loss and maintenance
Lead-Calcium Open-Vent Low cost, wide availability,
low water loss, can replenish
electrolyte
Poor deep cycle performance,
intolerant to high temperatures
and overcharge
Lead-Calcium Sealed-Vent Low cost, wide availability, low
water loss
Poor deep cycle performance,
intolerant to high temperatures
and overcharge, cannot replenish
electrolyte
Lead-Antimony/
Calcium Hybrid
Medium cost, low water loss Limited availability, potential for
stratification
VALVE-REGULATED LEAD-ACID
Gelled Medium cost, little or no
maintenance, less susceptible
to freezing, install in any
orientation
Fair deep cycle performance,
intolerant to overcharge and high
temperatures, limited availability
Absorbed Glass Mat Medium cost, little or no
maintenance, less susceptible
to freezing, install in any
orientation
Fair deep cycle performance,
intolerant to overcharge and high
temperatures, limited availability
NICKEL-CADMIUM
Sealed Sintered-Plate Wide availability, excellent
low and high temperature
performance, maintenance free
Only available in low capacities,
high cost, suffer from ‘memory’
effect
Flooded Pocket-Plate Excellent deep cycle and low and
high temperature performance,
tolerance to overcharge
Limited availability, high cost,
water additions required
Figure 66. Both flooded and sealed lead-acid batteries are commonly used in PV systems.

74 • System Design Copyright © 2019 NABCEP v.8 NABCEP PV Certification Study Guide
Vented lead-acid batteries release hydrogen and oxygen gases, under normal charging conditions. This is due to electrolysis of the electrolyte solution during final charging stages, and results in water loss. Consequently, adequate ventilation must be provided for both vented and sealed battery systems [NEC 480.10]. While it is difficult to determine adequate ventilation requirements, it is generally advisable to provide greater ventilation than necessary. A good rule is to provide similar ventilation to a battery room as is required for a combustion water heater. VRLA batteries do not release gasses under normal charging, and have lower ventilation requirements than flooded open vent types.
Capacity is a measure of battery energy storage, commonly rated in ampere-hours (Ah) or kilowatt-hours (kWh). For example, a nominal 6-volt battery rated at 220 Ah stores 1.32 kWh of energy. Battery design features that affect battery capacity include the quantity of active material, the number, design and physical size of the plates, and electrolyte specific gravity. Usable capacity is always less than the rated battery capacity. Operational factors that affect the usable battery capacity include discharge rate, cut-off voltage, temperature and age of the battery. See Fig. 67.
The rate of charge or discharge is expressed as a ratio of the nominal battery capacity (C) to the charge or discharge time period in hours. For example, a nominal 100 ampere-hour battery discharged at 5 amps for 20 hours is considered a C/20, or 20-hour discharge rate. The higher the discharge rate and lower the temperature, the less capacity that can be withdrawn from a battery to a specified cutoff voltage. See Fig. 68.
State-of-charge is the percentage of available battery capacity compared to a fully charged state. Depth-of-discharge is the percentage of capacity that has been removed from a battery compared to a fully charged state. The state-of-charge and depth-of-discharge for a battery add to 100 percent. The allowable depth-of-discharge is the maximum limit of battery discharge in operation. The allowable depth-of-discharge is usually limited to no more than 75 to 80% for deep cycle batteries, and must also be limited to protect lead-acid batteries from freezing in extremely cold conditions.
2011 Jim Dunlop Solar Batteries: 6 - 29
Figure 27. Battery capacity is a measure of the stored energy that a battery can deliver under specified conditions.
Volta
ge (V
)
Capacity (Ah)
Cut off voltage
High discharge rate
Low discharge rate
2011 Jim Dunlop Solar Batteries: 6 - 30
Figure 28. The higher the discharge rate and the lower the temperature, the less capacity that can be withdrawn from a battery to a specified cutoff voltage.
30
40
50
60
70
80
90
100
110
120
-30 -20 -10 0 10 20 30 40 50
C/500 C/120C/50 C/5C/0.5
Battery Operating Temperature ( oC )
Perc
ent o
f 25o C
Cap
acity
Figure 67. Battery capacity is a measure of the stored energy that a battery can deliver under specified conditions.
Figure 68. The higher the discharge rate and the lower the temperature, the less capacity that can be withdrawn from a battery to a specified cutoff voltage.
System Design • 75 NABCEP PV Certification Study Guide Copyright © 2019 NABCEP v.8
Specific gravity is the ratio of the density of a solution to the density of water. Sulfuric-acid electrolyte concentration is measured by its specific gravity, and related to battery state of charge. A fully charged lead-acid cell has a typical specific gravity between 1.26 and 1.28 at room temperature. The specific gravity may be increased for lead-acid batteries used in cold weather applications. Conversely, the specific gravity may be decreased for applications in warm climates to prolong battery life.
In very cold climates, batteries must be protected from freezing by installing in a suitable enclosure, or by limiting the depth of discharge. Because the density of electrolyte decreases with increasing temperature, specific gravity readings must be adjusted for temperature. Inconsistent specific gravity readings between cells in a flooded lead-acid battery indicate the need for an equalizing charge.
Many factors and trade-offs are considered in battery selection and systems design, and are often dictated by the application or site requirements. Among the factors to consider in the specification and design of battery systems include:• Electrical properties: voltage, capacity, charge/discharge rates• Performance: cycle life vs. DOD, system autonomy• Physical properties: Size and weight, termination types• Maintenance requirements: Flooded or VRLA• Installation: Location, structural requirements, environmental conditions• Safety and auxiliary systems: Racks, trays, fire protection, electrical BOS• Costs, warranty and availability
Most PV systems using batteries require a charge controller to protect the batteries from overcharge by the array. Only certain exceptions apply for special self-regulated systems, which are designed using very low charge rates, special lower voltage PV modules, larger batteries and well-defined, automated loads. If the maximum charge rates from the PV array multiplied by one hour is equal to 3% of the battery nominal amp-hour capacity or greater, a charge controller is required [NEC 690.72]. If a battery is overcharged, it can create a hazardous condition and its life is generally reduced, especially for sealed, valve-regulated lead-acid (VLRA) batteries. Many charge controllers also include overdischarge protection for batteries, by disconnecting loads at a predetermined low-voltage, low state-of-charge condition.
As of the publication of the 2017 NEC, most of the energy storage material in article 690 has been moved to other areas of the NEC, leaving only 690.72 Self-Regulated PV Charge Control. It is common to look to 710 Stand-Alone Systems and 706 Energy Storage Systems when designing modern PV systems with energy storage. Additionally, going to Article 712 for dc-microgrids and looking to Article 705 for ac microgrids may be necessary as well.
Article 706 covers ESS over 50V ac or 60V dc. Dwelling units are not permitted to have accessible terminals above 100V between conductors or to ground. Terminals not accessible during any required routine maintenance (e.g. adding water) would comply. Concealed lithium-ion battery compartments that do not require maintenance can operate at voltages above 100V in dwellings [706.30(A)]. Sufficient working spaces and clearances must be provided for any battery installations [NEC 480.10(C), 110.26]. Live parts shall be guarded in accordance with 110.27 [706.10(B), 706.34(A)].

76 • System Design Copyright © 2019 NABCEP v.8 NABCEP PV Certification Study Guide
Racks and trays are used to support battery systems and provide electrolyte containment. Racks can be made from metal, fiberglass or other structural nonconductive materials. Metal racks must be painted or otherwise treated to resist degradation from electrolyte and provide insulation between conducting members and the battery cells [NEC 480.8]. Due to the potential for ground faults, metal or other conductive battery racks, trays and cases are not allowed for open-vent flooded lead-acid batteries more than 60 volts nominal. Any conductive battery racks, cases or trays must also have proper equipment grounding [NEC 250.110].
If batteries are connected in series to produce more than 240 V (nominal), then the batteries must be connected in a manner that allows the series strings of batteries to be separated into strings of 240 V or less for maintenance by qualified persons [NEC 706.30(B)]. The means of disconnect may be non-load-break, bolted, or plug-in disconnects. For strings greater than 100 V, there must also be a means of disconnecting the grounded circuit conductors of all battery strings under maintenance without disconnecting the grounded conductors of operating strings [706.30(C)].
The overcurrent devices in the dc portion of an ESS must have sufficient voltage, current and interrupting ratings for the circuit to which is connected [NEC 706.21(C)]. While many dc-rated circuit breakers do not have sufficient interrupt ratings, current limiting fuses are available with interrupt rating 20,000 A and higher. Whenever these fuses may be energized from both sides, a disconnect means is required to isolate the fuse from all sources for servicing [NEC 706.21(E)].
To prevent battery installations from being classified as hazardous locations, ventilation of explosive battery gasses is required. However, the NEC does not provide specific ventilation requirements. Vented battery cells must incorporate a flame arrestor to help prevent cell explosions from external ignition sources, and cells for sealed batteries must have pressure relief vents [NEC 480.9, 480.10].
Special safety precautions, equipment and personal protective equipment (PPE) are required when installing and maintaining battery systems. Hazards associated with batteries include caustic electrolyte, high short-circuit currents, and explosive potential due to hydrogen and oxygen gasses produced during battery charging. Insulated tools should be used when working on batteries to prevent short-circuiting. High-voltage battery systems may present arc flash hazards, and special PPE, disconnecting means and equipment labeling may apply [See NFPA 70E]. Batteries are also very heavy and should only be lifted or supported by methods approved by the manufacturer. Battery installations over 400 lbs may also have to meet certain engineering requirements in seismic regions for the design of non-structural electrical components [See ASCE 7-10].
1.4.6.1 Determine LoadsThe sizing of batteries or any other energy storage system is based on the magnitude and duration of the applied electrical loads. The average power consumption of the electrical loads defines the maximum discharge rates as well as the total energy withdrawn from the battery on an average daily basis. The size of the battery (total capacity) is selected based on these system parameters and the desired maximum and average daily depth-of-discharge. The maximum battery depth-of-discharge in actual system operation is determined by the low-voltage load disconnect, the discharge rate, temperature and other factors.

System Design • 77 NABCEP PV Certification Study Guide Copyright © 2019 NABCEP v.8
Identify all existing and planned electrical loads that will be connected to the system, including their ac or dc operating voltage, their power or current consumption, and their expected average daily use. List all loads and multiply the power use by the average daily time of operation to determine daily energy consumption and peak power demand. See Fig. 69. In practice, the inverter should be large enough to power the total connected load, but is only required to be as large as the single largest load [NEC 710.15(A)].
1.4.6.2 Identify Circuits for Required LoadsLoad circuits supplied by stand-alone PV systems must be clearly identified and limited to the design loads. Additional loads beyond what the system has been designed to supply will ultimately result in decreasing battery state-of-charge and reduced battery lifetime. Ensure that only critical loads are connected and that the most efficient loads and practices are used wherever possible. In all cases, do not exceed the load estimates for which the system was designed unless additional generation resources are used.
Multiwire Branch CircuitsMany stand-alone PV systems use inverters with 120 Vac output, with the hot leg connected to both sides (phases) of a common 120/240 V split-phase load center. Normally with 240 V service, the current on one phase is 180 degrees opposed to the current on the other phase, and results in neutral conductor currents equal to the difference between the two phase currents. When the two phases (buses) in the panel are connected together to distribute the 120 V source, the currents on both sides of the panel are now in phase with each other and are additive. If multiwire branch circuits that share a neutral conductor for two branch circuits are connected to this modified distribution panel, the neutral conductor can potentially become overloaded and create a fire hazard. For these installations, a special warning sign is required on the panel to prohibit the connection of multiwire branch circuits [NEC 710.15(C)].
Electrical Load Power (W) Avg. Daily Time of Use (hr) Avg. Daily Energy (watt-hours)
Lighting 200 6 1200
Refrigerator 300 9.6 (40% duty cycle) 2880
Microwave 1200 0.5 600
Pumps 1000 1 1000
TV and entertainment
equipment
400 4 1600
Fans 300 6 1800
Washer 400 0.86 (3 hours 2 times per
week)
344
Miscellaneous plug loads 200 12 2400
Total all loads 4000 W (4 kW) 11,824 Wh (11.8 kWh)
Figure 69. A load assessment evaluates the magnitude and duration of electrical loads.

78 • System Design Copyright © 2019 NABCEP v.8 NABCEP PV Certification Study Guide
1.4.6.3 Batteries and Battery ConductorsThe goal of storage battery wiring is to create a circuit that charges and discharges all batteries equally. If batteries are connected in series, this is automatic, but if batteries are connected in parallel, the currents may be unequal due to subtle differences in cable resistance and connections. All batteries used in a battery bank must be the same type, same manufacturer, the same age, and must be maintained at equal temperatures. Batteries should have the same charge and discharge properties under these circumstances.
Series batteries connections build voltage while capacity stays the same as for one battery. See Fig. 70. Parallel battery connections build capacity while voltage stays the same. See Fig. 71. Parallel connections are made from opposite corners of the battery bank to help equalize the voltage drop and current flow through each string. In general, no more than four batteries or series strings of batteries should be connected in parallel. It is better to use larger batteries with higher ampere-hour ratings than to connect batteries in parallel. Large conductors, such as 2/0 AWG, 4/0 AWG or larger, are typically used to minimize voltage drop in battery connections. If you are connecting modern batteries with electronic components, such as lithium-ion batteries, be sure to comply with manufacturer’s instructions and all codes.
Listed flexible cables rated for hard service usage are permitted to be used for battery conductors, and can help reduce excessive terminal stress that can occur with standard stranded conductors [NEC Art. 400]. Welding cable (listed or not listed), automotive battery cables, diesel locomotive cables (marked DLO only) and the like may not meet NEC
OSHA requirements for battery installations include the following:
• Unsealed batteries must be installed in ventilated enclosures to prevent fumes, gases, or
electrolyte spray entering other areas, and to prevent the accumulation of an explosive mixture.
• Battery racks, trays and floors must be of sufficient strength and resistant to electrolyte.
• Face shields, aprons, and rubber gloves must be provided for workers handling acids or
batteries, and facilities for quick drenching of the eyes and body must be provided within
25 feet of battery handling areas.
• Facilities must be provided for flushing and neutralizing spilled electrolyte and for fire
protection.
• Battery charging installations are to be located in designated areas and protected from
damage by trucks.
• Vent caps must be in place during battery charging and maintained in a functioning condition.
2011 Jim Dunlop Solar Batteries: 6 - 32
Figure 30. Series battery connections increase voltage.
Battery 212 volts
100 amp-hours
24 volts
100 amp-hours
Total:
+ -
+ -
Battery 112 volts
100 amp-hours+ -
Figure 70. Series battery connections increase voltage. Figure 71. Parallel battery connections increase capacity.
2011 Jim Dunlop Solar Solar Radiation: 2 - 33
Figure 31. Parallel battery connections increase capacity.
Battery 212 volts
100 amp-hours
12 volts200 amp-hours
Total:
+ -
Battery 112 volts
100 amp-hours+ -
+
-

System Design • 79 NABCEP PV Certification Study Guide Copyright © 2019 NABCEP v.8
requirements for battery connections. Properly rated cable will have a conductor rating such as THW or RHW to meet building wiring requirements.
Many modern energy storage systems with batteries give you the energy and power of the ESS, such as 5kW and 10kWh. The maximum energy delivered by the battery is often not at full power so it is important to check the manual for the conditions of these specifications.
Size Batteries for LoadsBattery sizing in most PV systems is based on the average daily electrical load and a desired number of days of battery storage. The number of days of storage is selected based on the importance of the application, and the desired average daily depth-of-discharge for the battery.
Autonomy is defined as the number of days that a fully charged battery can meet system loads without any recharging. Autonomy is calculated by the nominal battery capacity, the average daily load and the maximum allowable depth-of-discharge. Larger autonomy means a larger battery with higher costs, and shallower average daily depth-of-discharge, lower charge and discharge rates, and usually longer battery life.
For example, consider a system load that is 100 Ah per day. A 400 Ah battery is selected, with a desired allowable depth-of-discharge of 75% (300 Ah usable). This battery design would deliver 3 days of autonomy in this system (3 days × 100 Ah/day = 300 Ah). Critical applications, such as vaccine refrigeration systems, telecommunications or defense and public safety applications may be designed for greater than 3 days of autonomy to help improve system reliability. PV hybrid systems using generators or other backup sources may require less autonomy to achieve the same level of system availability.
Charge Controller OperationA battery charge controller limits the voltage and or current delivered to a battery from a charging source to regulate state-of-charge [NEC 690.2]. See Fig 72. A charge controller is required in most PV systems that use battery storage, to prevent damage to the batteries or hazardous conditions resulting from overcharging [NEC 706.23]. Many charge controllers also provide overdischarge protection for the battery by disconnecting dc loads at low state-of-charge. Additional functions performed by charge controllers include controlling loads or backup energy source and providing monitoring and indicators of battery voltage and other system parameters. Special controllers are also available that regulate battery charge by diverting excess power to auxiliary loads. See Fig 73.
Many charge controllers protect the battery from overdischarge by disconnecting dc loads at low battery voltage and state-of-charge, at the allowable maximum depth of discharge
limit. See Fig. 74. Some smaller charge controllers incorporate overcharge and overdischarge functions within a single controller. Generally, for larger dc load currents, separate charge
2011 Jim Dunlop Solar Solar Radiation: 2 - 34
Figure 32. A charge controller is required in most PV systems that use battery storage to regulate battery state-of-charge.
Charge controller protects battery from overcharge by PV array
ChargeController
BatteryPV Array
Figure 72. A charge controller is required in most dc coupled PV systems that use battery storage to regulate battery state-of-charge.

80 • System Design Copyright © 2019 NABCEP v.8 NABCEP PV Certification Study Guide
controllers or relays are used. If two charge controllers are used, it is possible that they may be the same model but simply installed with different settings for different purposes; one on the array side for charge regulation and one on the load side of the battery for load control.
Battery-based inverters usually have programmable set-points for the low voltage load disconnect and load reconnect voltages. An alarm or indicator usually notifies the operator when the batteries are getting close to or have reached the LVD. It is also possible to employ multiple LVD controllers on the load side of the batteries, to have different LVD settings based on load priorities. Factory defaults for LVDs are often set at a low levelso it may be desirable to raise the settings to provide greater protection of the batteries, however this reduces available capacity.
Charge controllers have maximum input voltage and current ratings specified by the manufacturer and the listing agency. The PV array must not be capable of generating voltage or current that will exceed the charge controller input voltage and current limits. The charge controller rated continuous current (sometimes specified as input current, sometimes as output current) must be at least 125% of the PV array short-circuit output current, and the charge controller maximum input voltage must be higher than the maximum system voltage [NEC 690.7].
Figure 73. Charge controllers used in PV systems vary widely in their size, functions and features.
Morningstar TriStar controller Xantrex C-series controller
Outback MPPT controller
Morningstar lighting controller
2011 Jim Dunlop Solar Solar Radiation: 2 - 35
Figure 33. Charge controllers used in PV systems vary widely in their size, functions and features.
Morningstar TriStar controller
Morningstar ProStar controller
Morningstar lighting controller
Outback MPPT controller
Xantrex C-series controller
2011 Jim Dunlop Solar Solar Radiation: 2 - 35
Figure 33. Charge controllers used in PV systems vary widely in their size, functions and features.
Morningstar TriStar controller
Morningstar ProStar controller
Morningstar lighting controller
Outback MPPT controller
Xantrex C-series controller
2011 Jim Dunlop Solar Cells, Modules and Arrays: 5 - 36
Figure 34. Charge controllers are also used to protect a battery from excessively deep discharges.
This controller protects battery from overcharge
This controller protects battery from overdischarge
PV Array
Battery
DC LoadLoad
ControllerCharge
Controller
Figure 74. Charge controllers are also used to protect a battery from excessively deep discharges.
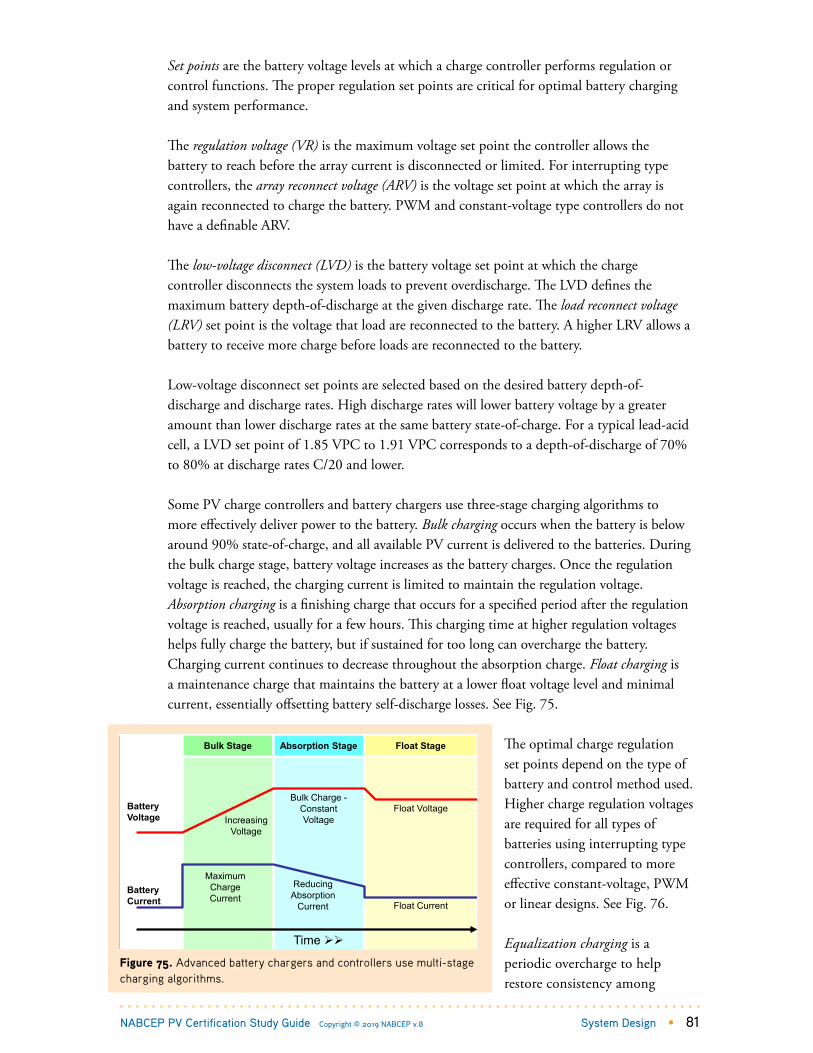
System Design • 81 NABCEP PV Certification Study Guide Copyright © 2019 NABCEP v.8
Set points are the battery voltage levels at which a charge controller performs regulation or control functions. The proper regulation set points are critical for optimal battery charging and system performance.
The regulation voltage (VR) is the maximum voltage set point the controller allows the battery to reach before the array current is disconnected or limited. For interrupting type controllers, the array reconnect voltage (ARV) is the voltage set point at which the array is again reconnected to charge the battery. PWM and constant-voltage type controllers do not have a definable ARV.
The low-voltage disconnect (LVD) is the battery voltage set point at which the charge controller disconnects the system loads to prevent overdischarge. The LVD defines the maximum battery depth-of-discharge at the given discharge rate. The load reconnect voltage (LRV) set point is the voltage that load are reconnected to the battery. A higher LRV allows a battery to receive more charge before loads are reconnected to the battery.
Low-voltage disconnect set points are selected based on the desired battery depth-of-discharge and discharge rates. High discharge rates will lower battery voltage by a greater amount than lower discharge rates at the same battery state-of-charge. For a typical lead-acid cell, a LVD set point of 1.85 VPC to 1.91 VPC corresponds to a depth-of-discharge of 70% to 80% at discharge rates C/20 and lower.
Some PV charge controllers and battery chargers use three-stage charging algorithms to more effectively deliver power to the battery. Bulk charging occurs when the battery is below around 90% state-of-charge, and all available PV current is delivered to the batteries. During the bulk charge stage, battery voltage increases as the battery charges. Once the regulation voltage is reached, the charging current is limited to maintain the regulation voltage. Absorption charging is a finishing charge that occurs for a specified period after the regulation voltage is reached, usually for a few hours. This charging time at higher regulation voltages helps fully charge the battery, but if sustained for too long can overcharge the battery. Charging current continues to decrease throughout the absorption charge. Float charging is a maintenance charge that maintains the battery at a lower float voltage level and minimal current, essentially offsetting battery self-discharge losses. See Fig. 75.
The optimal charge regulation set points depend on the type of battery and control method used. Higher charge regulation voltages are required for all types of batteries using interrupting type controllers, compared to more effective constant-voltage, PWM or linear designs. See Fig. 76.
Equalization charging is a periodic overcharge to help restore consistency among
2011 Jim Dunlop Solar Batteries: 6 - 37
Figure 35. Advanced battery chargers and controllers use multi-stage charging algorithms.
Reducing Absorption
Current Float Current
Float Voltage
Maximum Charge Current
Increasing Voltage
Bulk Charge -Constant Voltage
Bulk Stage
Battery Voltage
Absorption Stage Float Stage
Battery Current
Time
Figure 75. Advanced battery chargers and controllers use multi-stage charging algorithms.

82 • System Design Copyright © 2019 NABCEP v.8 NABCEP PV Certification Study Guide
battery cells. Equalization charging is performed on flooded, open-vent batteries to help minimize differences and restore consistency in capacity between individual cells, and can help reduce sulfation and stratification. Some charge controllers provide the capability for manual or automatic or equalization charging. Flooded lead-acid batteries are normally equalized at approximately 2.6 volts per cell (VPC) at 25°C for 1-3 hour periods once or twice a month. Equalization is generally not recommended for VRLA batteries; see manufacturer’s instructions.
Temperature compensation is a feature of charge controllers that automatically adjusts the charge regulation voltage for battery temperature changes. Charge controllers may have internal temperature compensation, or use external sensors attached to the batteries. Where battery temperatures vary seasonally more than 10°C, compensation of the charge regulation set point is normally used. Temperature compensation is recommended for all types of sealed batteries, which are much more sensitive to overcharging than flooded types. Temperature compensation helps to fully charge a battery during colder conditions, and helps protect it from overcharge and excessive electrolyte loss during warmer conditions.
The standard temperature compensation coefficient for lead-acid cells is -5 mV/°C. When the battery is cold, the charge regulation voltage is increased, and conversely when the battery is warm, the charge regulation voltage is reduced. For example, consider a nominal 24 V charge controller with a regulation voltage of 28.2 V at 25°C. When the battery temperature is 10°C, the temperature compensated regulation voltage is 29.7 V. Conversely, if the battery temperature is 40°C, the charge regulation voltage will be reduced to 27.3 volts.
For larger systems, the output of multiple charge controllers may be connected in parallel and used to charge a single battery bank. See Fig. 37. Depending on the specific controller, the multiple controllers may regulate independently or through a master-slave arrangement. One subarray may be left unregulated if the maximum charge current multiplied by one hour is less than 3% of the battery capacity. This can help improve the finishing charge.
Figure 76. Optimal charge regulation set points depend on the type of battery and control method used.
Battery Type
Regulator Design Type
Charge Regulation Voltage at 25 oC
Flooded Lead-
Antimony
Flooded Lead-
Calcium
Sealed, Valve Regulated Lead-Acid
Flooded Pocket Plate
Nickel- Cadmium
On-Off, Interrupting
Per nominal 12 volt battery
14.6 - 14.8 14.2 - 14.4 14.2 - 14.4 14.5 - 15.0
Per Cell 2.44 - 2.47 2.37 - 2.40 2.37 - 2.40 1.45 - 1.50
Constant- Voltage, PWM,
Linear
Per nominal 12 volt battery
14.4 - 14.6 14.0 - 14.2 14.0 - 14.2 14.5 - 15.0
Per Cell 2.40 - 2.44 2.33 - 2.37 2.33 - 2.37 1.45 - 1.50
System Design • 83 NABCEP PV Certification Study Guide Copyright © 2019 NABCEP v.8
A diversionary charge controller diverts excess PV array power to auxiliary loads when the primary battery system is fully charged, allowing a greater utilization of PV array energy. Whenever a diversionary charge controller is used, a second independent charge controller isrequired to prevent battery overcharge in the event the diversion loads are unavailable or the diversion charge controller fails [NEC 706.23(B)]. The additional charge controller uses a higher regulation voltage, and permits the diversionary charge controller to operate as the primary control. See Fig 78.
Several requirements apply to PV systems using dc diversionary loads and dc diversion charge controllers. Typical dc diversionary loads include resistive water heating elements, dc water pumps or other loads that can utilize or store the energy in some other form. These requirements are intended to help prevent hazardous conditions and protect the battery if the diversion controller fails or the dc loads are unavailable [706.23(B)].• The dc diversion load current must be no greater than the controller maximum current rating.• The dc diversion load must have a voltage rating greater than the maximum battery voltage.• The dc diversion load power rating must be rated at least 150 percent of the maximum
PV array power output.• The conductors and overcurrent protection for dc diversion load circuits must be sized
for at least 150 percent of controller maximum current rating.
Some interactive PV systems use battery-based inverters as a backup power source when the utility is de-energized. Normally, these systems regulate the battery charge by diverting excess PV array dc power through the inverter to produce ac power to feed site loads or the grid. When the grid de-energizes, an automatic transfer switch disconnects loads from the utility network and the system operates in stand-alone mode. If all loads have been met and the grid is not available, the battery can be overcharged. These systems must also have a second independent charge controller to prevent battery overcharge when the grid or loads are not available to divert excess power [NEC 706.23(B)]. See Fig. 79.
Maximum Power Point Tracking MPPT Charge ControllersMaximum power point tracking (MPPT) charge controllers operate PV arrays at maximum power under all operating conditions independent of battery voltage. Typically, the PV array is configured at higher voltages than the battery, and dc to dc power conversion circuits in the controller automatically provides a lower voltage and higher current output to the battery. MPPT controllers can improve array energy utilization and allow non-standard and higher array operating voltages, requiring smaller conductors and fewer source circuits to charge lower voltage battery banks. MPPT charge controllers are advantageous on cold sunny days in the winter when stand-alone systems have lower battery voltage and the array voltage is high due to the cold operating temperature.
Normally, the output current of a charge controller will be less than or equal to the input current. The exception to this rule is a MPPT charge controller, in which the output current may exceed the input current but at lower voltage. If a MPPT charge controller is used, it is important to consult the manufacturer’s specifications to determine the maximum output current. The maximum rated output current of the charge controller must be posted on a sign at the dc disconnect [NEC 690.53].

84 • System Design Copyright © 2019 NABCEP v.8 NABCEP PV Certification Study Guide
Modern ESS units may contain a variety of devices, such as batteries, charge controllers and inverters combined together as a single unit that is listed and tested as a unit. While it is called an energy storage system, it can be a combination of familiar devices. Different battery technologies have specific parameters for charge control. Lithium-ion batteries are always installed in a unit that includes a battery management system. Often these devices are connected to the internet and firmware can be updated when new charging parameters become relevant.
Power Requirements of Auxiliary SystemsElectrical generators are often interfaced with PV systems to supplement the PV array when it cannot produce enough energy alone to meet the system loads or charge the batteries. These are often referred to as hybrid systems, because they use more than one energy source. Generators may be directly interfaced with stand-alone systems or with battery-based utility-interactive systems. In regions where the summer solar resource is significantly more than the winter resource, an auxiliary electric generator may be useful to reduce the size of the PV array and battery required to meet the wintertime loads alone.
Many battery-based PV inverters have built-in battery chargers that permit the connection of an auxiliary ac source, such as a generator, to provide supplemental battery charging, or to directly power ac loads. Some of these inverters are programmable and have relay circuits that can automatically start the generator whenever the batteries reach a prescribed low voltage. When the batteries have been recharged to an adequate state of charge, defined by the inverter programming, the inverter will automatically shut down the generator. Most of these advanced inverters can also exercise the generator on a regular basis to ensure that it will start when needed. 2011 Jim Dunlop Solar Cells, Modules and Arrays: 5 - 41
Figure 39. Battery-based interactive inverters operate as diversionary charge controllers to regulate battery state-of-charge.
PV ArrayCharge
ControllerBattery
InteractiveInverter
Utility Grid
This controller protects the battery when the grid is unavailable
The inverter normally protects the battery from overcharge by diverting power to the grid
Power may flow in reverse directions if inverter also includes a battery charger
Figure 79. Battery-based interactive inverters operate as diversionary charge controllers to regulate battery state-of-charge.
2011 Jim Dunlop Solar Batteries: 6 - 39
Figure 37. Multiple charge controllers may be used on individual subarrays for larger systems.
PV Subarray #1 ChargeController #1
One subarray may be directly connected to battery without charge control if charge current x 1 hr is less than 3% of battery capacity.
PV Subarray #2 ChargeController #2
PV Subarray #3 ChargeController #3
PV Subarray #4
Battery
DC Load
Note: No overdischarge protection shown.
Figure 77. Multiple charge controllers may be used on individual subarrays for larger systems.
2011 Jim Dunlop Solar Solar Radiation: 2 - 40
Figure 38. A diversionary charge controller diverts excess PV array power to auxiliary loads.
PV ArrayCharge
ControllerBattery
DiversionController
DiversionLoad
This controller protects the battery when the diversion load is unavailable
Diversionary controller protects the battery from overcharge by diverting
power to a diversionary load
Figure 78. A diversionary charge controller diverts excess PV array power to auxiliary loads.

System Design • 85 NABCEP PV Certification Study Guide Copyright © 2019 NABCEP v.8
Utility-interactive PV systems without batteries require a separate generator transfer switch to isolate the electrical loads from the grid and the PV system when the generator is operated, because most generators alone cannot interface directly to the grid without additional synchronizing and protective equipment. In this design, the generators are either started automatically or manually in the event of a utility outage.
Charging Batteries with a GeneratorTypically, PV-generator hybrid systems may be designed to fully charge the batteries in 5 to 10 hours, or at a C/5 to C/10 rate. This means that if the batteries are 80% discharged and the generator is programmed to charge the batteries until they are only 30% discharged, that it would take 5 hours to do so at the C/10 rate. Generally, it is not advantageous to fully charge batteries with the generator, which can be inefficient, and can result in wasting valuable PV energy that may have been available to contribute to the charge. The basic idea to optimize generator run time is to load the generator as high a power level and minimum operation time as possible, to minimize fuel consumption and maintenance.
MAKE WAY FOR THE NEW #1. The Panasonic HIT® is quite simply one of the world’s best solar panels, combining high efficiency with the industry’s lowest degradation rate. We back up that claim with a powerful 25-year warranty which guarantees a degradation rate of less than 0.26% a year—tops in the industry. So you’ll achieve a robust 90.76% of rated output power after 25 years. And unlike our competitors, HIT® panels won’t fizzle when the mercury rises. A low, –0.258%/°C temperature coefficient helps maintain high energy output on the hottest days. Best of all, a partnership with Panasonic means you have the power of a nearly 100-year-old company and 40-year solar industry pioneer standing behind you.
Want to be the best? Start by installing the best. Panasonic HIT®.Learn more at business.panasonic.com/solarpanels
CLIENT: Panasonic TRIM: 7.5" x 4.75"
AD: Solar 25 Years Warranty BLEED: N/A
PUB: PV Installer Resource Guide LIVE: N/A
JOB#: 81926 FILE NAME: Solar 40 Years Ad PV_Resource Guide_81926.indd
1012 GRAND STREET. STUDIO 407 | HOBOKEN, NJ | 07030 | 201.408.5056 WWW.BRANDVOICEAGENCY.COM

86 • PV Installation Copyright © 2019 NABCEP v.8 NABCEP PV Certification Study Guide
2. Installing Electrical Components
National Electrical Code OverviewThe requirements for PV systems and most other electrical installations are governed by the National Electrical Code (NEC), NFPA 70. Notable exceptions include vehicles, boats, aircraft, trains, and certain utility-controlled properties such as power plants, substations and distribution systems [90.2]. The NEC is adopted in all 50 U.S. states, U.S. territories, and other countries, and its purpose “is the practical safeguarding of persons and property from hazards arising from the use of electricity” [90.1]. The NEC “is not intended as a design specification or an instruction manual for untrained persons” [90.1]. The first edition of the NEC was published in 1897, and since 1911 has been sponsored and published every three years by the National Fire Protection Association (NFPA). The current edition is the 2017 NEC.
The NEC is adopted into law by states and enforced by the authority having jurisdiction (AHJ) as part of model building codes. The AHJ may be a federal, state or local department or individual such as a fire chief; fire marshal; building official; electrical inspector; or others having statutory authority to enforce the Code requirements. The AHJ reviews plans submitted by installers and contractors, issues construction permits, and evaluates the installation and equipment through a field inspection process for approval. The AHJ has the responsibility for making interpretations of the rules, for deciding on the approval of equipment and materials, and for granting the special permissions covered by the NEC [90.4].
The NEC is divided into an introduction, nine chapters, informative annexes and an index. Chapters 1, 2, 3, and 4 apply generally to all electrical installations; and Chapters 5, 6, and 7 apply to special occupancies, special equipment, or other special conditions. These latter chapters supplement or modify the general rules. Chapters 1 through 4 apply except as amended by Chapters 5, 6, and 7 for the particular conditions or equipment. Chapter 8 covers communications systems and is not subject to the requirements of Chapters 1 through 7 except where referenced in Chapter 8. Chapter 9 consists of tables that are applicable as referenced in earlier chapters [90.3].
In 1984, Article 690 Solar Photovoltaic Systems was first introduced in the NEC. Significant modifications and amendments to Article 690 have been incorporated into subsequent editions. The 2017 NEC consists of the following eight major parts:
Many other articles in the NEC also apply to PV installations. However, when the requirements of other articles and Article 690 differ, the requirements of Article 690 apply since the purpose of Article 690 is to establish the requirements for installation of PV systems. The requirements of Article 690 are not permitted to be used for any
1 See: http://www.nfpa.org/codes-and-standards/document-information-pages?mode=code&code=70
I. GeneralII. Circuit RequirementsIII. Disconnecting MeansIV. Wiring Methods
V. Grounding and BondingVI. MarkingVII. Connection to Other SourcesVIII. Energy Storage Systems

PV Installation • 87 NABCEP PV Certification Study Guide Copyright © 2019 NABCEP v.8
installations other than PV systems. There are other articles referenced from Article 690 and applicable to many PV system installations, including:
The NEC requires that electrical equipment be approved by the AHJ. Equipment is generally approved when it is listed, labeled, or evaluated for safety by an approved testing laboratory [90.7, 110.3]. Verification of code compliance is largely based on by the AHJ’s examination of the installation for safety, in accordance with the listing and labelling of the equipment. A key element of a safe and code-compliant electrical installation is adherence to product installation and use instructions included with listed and labeled products [110.3(B)].
Nearly every major component in a solar PV systems is covered by a UL listing standard, including PV modules (UL 1703), inverters, converters, charge controllers and combiner boxes (UL 1741), and racking systems (UL 2703). Recently, listing categories have been created for photovoltaic (PV) wire (UL 4703) and fuses for photovoltaic systems (UL 2579). These products are specifically identified and labelled for use in solar PV systems. Certain PV products are also identified for specific applications and conditions of use, such as inverters intended for utility interconnection [NEC 690.4(B), 705.6]. The listing labels also provide safety information and equipment specifications necessary to properly size the equipment and connected wiring systems for the application.
Underwriter’s Laboratory (UL) is one of several organizations known as Nationally Recognizing Testing Laboratories (NRTL). UL is unique in that they are tasked by the American National Standards Institute (ANSI) to develop electrical product safety standards for solar PV systems. UL and other recognized testing laboratories such as TUV, CSA and Intertek, evaluate electrical equipment to the UL standards and authorize their respective listing marks to be applied to approved products.
The requirements of Article 690 have continually been updated to reflect the developing and ever changing technology. Notable additions and clarifications to the NEC requirements for solar PV systems over the past few code cycles have included:• New labeling requirements to warn operators, fire fighters and maintenance
personnel of the hazards.• New requirements for rapid shutdown provisions for emergency response.• Specific wiring methods and wire management practices to improve safety and
system durability.• New requirements for calculating voltages and currents.• New requirements for the use of listed PV-rated overcurrent protective devices.• Revised requirements for PV system disconnects and equipment isolation.
Article 110 Requirements for Electrical Installations
Article 230 ServicesArticle 240 Overcurrent Protection Article 250 Grounding and Bonding Article 300 Wiring MethodsArticle 310 Conductors for
General Wiring
Article 480 Storage BatteriesArticle 691 Large-Scale PV Power
Production FacilityArticle 705 Interconnected Electric
Power Production SourcesArticle 706 Energy Storage SystemsArticle 710 Stand-Alone SystemsArticle 712 DC Microgrids

88 • PV Installation Copyright © 2019 NABCEP v.8 NABCEP PV Certification Study Guide
• Clarifying the options and requirements for system grounding and equipment bonding.• Clarifying the options and requirements for ac connections within building
electrical systems.• New exception to arc fault detection for certain PV output circuits not on buildings.
2.1 Install Wiring Methods (including raceways) Task 3Wiring methods include all conductors, cables, conduits, raceways, fittings, connectors, terminals, junction boxes and other equipment used for electrical connections between system components. The installation requirements for wiring methods are covered in Chapter 3 of the NEC: Wiring Methods and Materials. Manufacturers provide additional product-specific instructions, and installation of some wiring methods do require specialized training and experience.
Much of the installation work in all electrical systems is mechanical in nature. Conduit systems are the most common wiring methods for circuits leaving the vicinity of PV arrays. Conduit is used to support and protect string conductors and to install the PV output circuits from combiner boxes to inverters. Each type of conduit or raceway system has specific application and installation requirements [NEC Chapter 3].
Conduit runs must be supported properly at the intervals required by the specific conduit type. While the NEC does not require conduit to be held at any specific distance above the roof surface, the building codes do not permit items on a rooftop that could cause damming of leaves and other debris. Although the building code does not specifically address electrical conduit systems, it is wise to keep a minimum of one inch of airspace beneath conduit runs, to help prevent smaller debris from being trapped under the conduit. The one inch airspace also has the advantage of reducing the conduit temperature [NEC Table 310.15(B)(3)(c) in the 2014 NEC]. The 2017 NEC removes Table 310.15(B)(3)(c) and simply establishes a single adder of 33°C for conduit that is less than 7/8" off of the roof. The height of 7/8" inch was chosen for the 2017 NEC since it the height of a typical strut thickness often used to support and fasten conduit. This means that PV systems with properly installed conduit on rooftops no longer require temperature adders for rooftop conduit. This will often reduce the required conductor size by one or two standard sizes relative to a 2014 NEC installation.
Since in conventional ac systems it is uncommon to have long rooftop feeders, like those in large PV systems, there exists little field experience from electrical workers on installing these wiring methods on rooftops. Setting up a conduit run with multiple expansion fittings is not trivial and requires painstaking adherence to manufacturer’s directions that account for the conduit temperature and where in the expansion process that temperature falls. Expansion joints must be installed so that the conduit moves relative to the joint. In addition to the concerns over the conduit system, the conductors inside the conduit also move relative to the conduit system and the end terminations. Several systems in recent history have not properly accounted for this relative motion which has caused significant conductor insulation damage resulting in fires in some cases. Since this type of damage is likely in large conduit systems, operation and maintenance programs must periodically check for this damage, in some cases resulting in fires. Some installers of larger PV systems have moved away from conduit systems to cable tray systems where thermal expansion is less problematic.

PV Installation • 89 NABCEP PV Certification Study Guide Copyright © 2019 NABCEP v.8
2.2 Install Dc PV System Conductors Task 5The installer should pay careful attention to the location of module junction boxes so the lengths of electrical wiring can be minimized and organized into source circuits as needed, once modules are mounted. Modules are normally installed in groups that produce the desired source-circuit voltage. Junction boxes do not have to be readily accessible, but must permit ready access by temporarily removing modules connected by flexible wiring methods [NEC 690.34].
The layout of BOS components should be done in a neat and professional manner that provides for convenient access, testing, and disconnecting of system components. If the array is on a residential roof, it is generally preferable to install a minimum of equipment at the roof. Because most PV modules carry warranties of 20 years or more, any other components installed on the roof should be also be capable of operating for 20 years without significant maintenance. The BOS layout should minimize distances for dc wiring if the system operates at 48 V or less. However, residential PV arrays operating at more than 300 V dc may use longer dc runs without significant voltage drop. Keeping the ac voltage drop as low as reasonably possible will improve system performance by reducing the likelihood of inverters tripping offline due to high utility voltage. General guidance for circuits from the inverter to the service entrance is to keep the voltage below 1%. If voltage drop exceeds 1%, then it is recommended that a voltage recorder be installed on the utility service to make sure that the utility service voltage never exceeds 5% above nominal voltage levels.
2.3 Install Electrical Equipment Task 4Working spaces must be allowed for installers and maintenance personnel to safely work on electrical equipment [NEC 110.26]. Proper working spaces are the first priority when locating balance of system hardware for a PV system. Generally, clearances in front of equipment that may be serviced in an energized state must be at least 3 feet back from the front of the equipment, but several qualifiers determine the appropriate clearance to use. Voltages from 150 V to 600 V require greater clearances if live parts are on one side and grounded parts on the other, or if live parts are on both sides of the working space. The width of working spaces must be the width of the equipment or 30 inches, whichever is wider. For equipment operating at dc voltages less than 60 V, smaller working spaces may be permitted by special permission of the AHJ. Permission must be obtained before mounting the equipment should smaller clearances be sought.
Some PV installations may involve working in attic spaces, which usually requires wearing a breathing mask, eye protection, and clothing that will protect skin from irritating insulation. Ensure that the attic floor will support the weight of a worker and take care to step only on structural members to prevent falling through the ceiling. Attics can be extremely hot and workers should limit their exposures and maintain hydration. Additional lighting is also usually required when working in attics or other confined spaces.
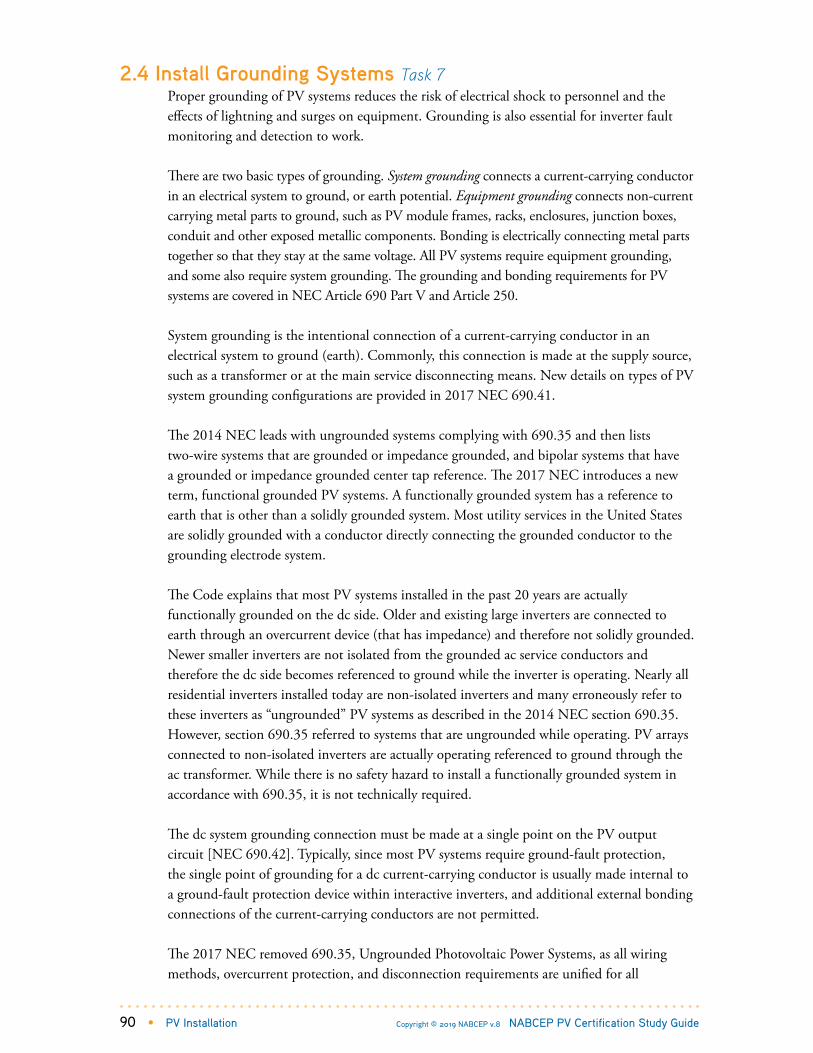
90 • PV Installation Copyright © 2019 NABCEP v.8 NABCEP PV Certification Study Guide
2.4 Install Grounding Systems Task 7Proper grounding of PV systems reduces the risk of electrical shock to personnel and the effects of lightning and surges on equipment. Grounding is also essential for inverter fault monitoring and detection to work.
There are two basic types of grounding. System grounding connects a current-carrying conductor in an electrical system to ground, or earth potential. Equipment grounding connects non-current carrying metal parts to ground, such as PV module frames, racks, enclosures, junction boxes, conduit and other exposed metallic components. Bonding is electrically connecting metal parts together so that they stay at the same voltage. All PV systems require equipment grounding, and some also require system grounding. The grounding and bonding requirements for PV systems are covered in NEC Article 690 Part V and Article 250.
System grounding is the intentional connection of a current-carrying conductor in an electrical system to ground (earth). Commonly, this connection is made at the supply source, such as a transformer or at the main service disconnecting means. New details on types of PV system grounding configurations are provided in 2017 NEC 690.41.
The 2014 NEC leads with ungrounded systems complying with 690.35 and then lists two-wire systems that are grounded or impedance grounded, and bipolar systems that have a grounded or impedance grounded center tap reference. The 2017 NEC introduces a new term, functional grounded PV systems. A functionally grounded system has a reference to earth that is other than a solidly grounded system. Most utility services in the United States are solidly grounded with a conductor directly connecting the grounded conductor to the grounding electrode system.
The Code explains that most PV systems installed in the past 20 years are actually functionally grounded on the dc side. Older and existing large inverters are connected to earth through an overcurrent device (that has impedance) and therefore not solidly grounded. Newer smaller inverters are not isolated from the grounded ac service conductors and therefore the dc side becomes referenced to ground while the inverter is operating. Nearly all residential inverters installed today are non-isolated inverters and many erroneously refer to these inverters as “ungrounded” PV systems as described in the 2014 NEC section 690.35. However, section 690.35 referred to systems that are ungrounded while operating. PV arrays connected to non-isolated inverters are actually operating referenced to ground through the ac transformer. While there is no safety hazard to install a functionally grounded system in accordance with 690.35, it is not technically required.
The dc system grounding connection must be made at a single point on the PV output circuit [NEC 690.42]. Typically, since most PV systems require ground-fault protection, the single point of grounding for a dc current-carrying conductor is usually made internal to a ground-fault protection device within interactive inverters, and additional external bonding connections of the current-carrying conductors are not permitted.
The 2017 NEC removed 690.35, Ungrounded Photovoltaic Power Systems, as all wiring methods, overcurrent protection, and disconnection requirements are unified for all

Introducing Solectria XGIThe Next Generation of Inverters
Yaskawa Solectria Solar presents the latest innovation in inverter technology with the XGI Inverter Series. The XGI 1000 Commercial String Inverter and XGI 1500 Utility-Scale Inverter set a new standard for quality and reliability in the PV industry. Backed by Yaskawa’s quality standards, the XGI Inverters are built to last with each component tested and verified to last well beyond 25 years.
•Made in the USA with global components• Lowest total installed cost• Lowest O&M cost• Advanced grid features•Remote diagnostics and upgrades
Contact the Yaskawa Solectria Solar team today to learn how the XGI Inverter Series’ unrivaled quality can help meet your project needs.
Yaskawa Solectria Solar 1-978-683-9700 solectria.com

92 • PV Installation Copyright © 2019 NABCEP v.8 NABCEP PV Certification Study Guide
functionally grounded and ungrounded PV systems. There are many reasons for this unification process in the 2017 NEC. Among these reasons is to make them safer and to simply the process of installing PV systems. Also, the wrong interpretation of 690.35 in 2014 and earlier version of the NEC would cause some AHJs to require replacement of the PV array if a fuse-grounded inverter were replaced with a new non-isolated inverter. The reasoning given would be that older PV modules and arrays did not have special PV wire that was required for compliance with 690.35.
Comparing and contrasting the interpretations of 2014 NEC with the new 2017 NEC language, we can see that non-isolated inverters can be installed more simply:
Non-isolated Inverter Installations: 2014 NEC [690.35] (common interpretation)1. Disconnect both positive and negative to equipment [690.35(A)]2. Overcurrent protection (where required) in both positive and negative
circuit conductors [690.35(B)]3. Ground-fault protection required ([690.35(C)])4. PV wire required for single conductor cables in PV array [690.35(D)]5. Inverter listed for ungrounded PV arrays ([690.35(F)] and general requirement
[690.4(B)])
Fuse-grounded PV Systems: 2014 NEC 1. Disconnect only ungrounded dc conductors to equipment [690.15]2. Overcurrent protection (where required) in ungrounded dc circuit conductors
(either positive or negative) [690.9(E)]3. Ground-fault protection required (general requirement [690.5])4. PV wire or USE-2 required for single conductor cables in PV array [690.31(C)(1)]5. Inverter listed for the purpose (general requirement [690.4(B)])
2017 NEC (all PV systems except solidly grounded)1. Disconnect both positive and negative to equipment [690.15]2. Overcurrent protection (where required) in either positive or negative
circuit conductors [690.9(C)(1)]3. Ground-fault protection required [690.41(B)]4. PV wire or USE-2 required for single conductor cables in PV array [690.31(C)(1)]5. Inverter listed for the purpose (general requirement [690.4(B)])
As you can see from this comparison of 2014 and 2017 NEC requirements, the primary difference between fuse-grounded PV systems in the 2014 NEC and nearly all PV systems in 2017 NEC is that the 2017 requires that both positive and negative conductors be disconnected to equipment. The reason for this change is for safety in that fuse grounded conductors can be raised to open circuit voltage levels during a ground fault to the ungrounded conductor. With no disconnect in the fuse grounded conductor, the only way to work on a ground-faulted inverter, without having to work on live terminals (violation of NFPA 70E), is to work at night. Now, in the 2017 NEC, provisions must be provided to disconnect both conductors to equipment so the inverter or other equipment can be properly isolated and worked on safely during daylight hours.

PV Installation • 93 NABCEP PV Certification Study Guide Copyright © 2019 NABCEP v.8
Many smaller non-isolated systems have two or more separate dc inputs. If the inverter is certified to not backfeed the PV array, and each dc input has no more than two strings connected to the input, then these PV systems can be installed without source circuit fusing. The reason source circuit fusing is not required is that 690.9 does not require overcurrent protection on circuits that are sized to carry the short circuit current of the circuit. Since the short circuit current of a PV circuit is short circuit limited, the source circuit wiring is sufficient for the maximum short circuit current since 690.8(B) requires that these circuits be sized based on the short circuit current.
Equipment grounding is the connection of non-current carrying metal parts to ground. Equipment grounding requires electrical bonding of PV module frames, racks, enclosures, junction boxes, conduit and other metallic components that are likely to become energized in a fault. This ensures that metal components in the system will be at the same voltage level, and reduces the risk of electrical shock. The installation of an equipment grounding conductor (EGC) is required for all metal framed PV module systems and any PV array that has exposed conductors in contact with metal support structures, regardless of system voltage [NEC 250, 690.43]. The EGC can be a conductor, busbar, metallic raceway, or structural component. EGCs must be installed with the PV circuit conductors upon leaving the vicinity of an array. System grounding and equipment grounding conductors are separate and only connected together (bonded) at the source of supply.
Several methods are permitted to provide equipment grounding for PV modules. Traditional methods use thread-forming screws and cup washers, or lay-in lugs attached to the module frames to connect the EGC. Other methods include using bonding washers or clips between module frames and supports, and the EGC is connected to the support structure. EGCs smaller than 6 AWG must be installed such that they are not exposed to physical damage. Bare copper grounding conductors should not be allowed to contact aluminum module frames or supports. Special washers or lugs are used to make the connection between copper and aluminum. Refer to PV module and mounting system manufacturer’s installation instructions for specific grounding requirements. See Fig. 80.
For some interactive systems, the grounded dc conductor, the dc EGC, and the ac EGC are terminated in the inverter. Where a PV system has a functionally grounded dc conductor, this grounded conductor is connected to ground through the ground-fault protection circuit that gets its reference to ground through the ac EGC. The grounding electrode system for the utility service provides for the connection to ground for the ac grounding system, and the dc connection to ground is accomplished with the ac EGC. Functionally grounded PV systems do not require a separate grounding electrode conductor (GEC).
2011 Jim Dunlop Solar Cells, Modules and Arrays: 5 - 99
Figure 96. Devices listed and identified for bonding the exposed metallic frames of PV modules to grounded mounting structures are permitted, but are not approved for all modules and mounting
structures.
Unirac
Figure 80. Devices listed and identified for bonding the exposed metallic frames of PV modules to grounded mounting structures are permitted, but are not approved for all modules and mounting structures.
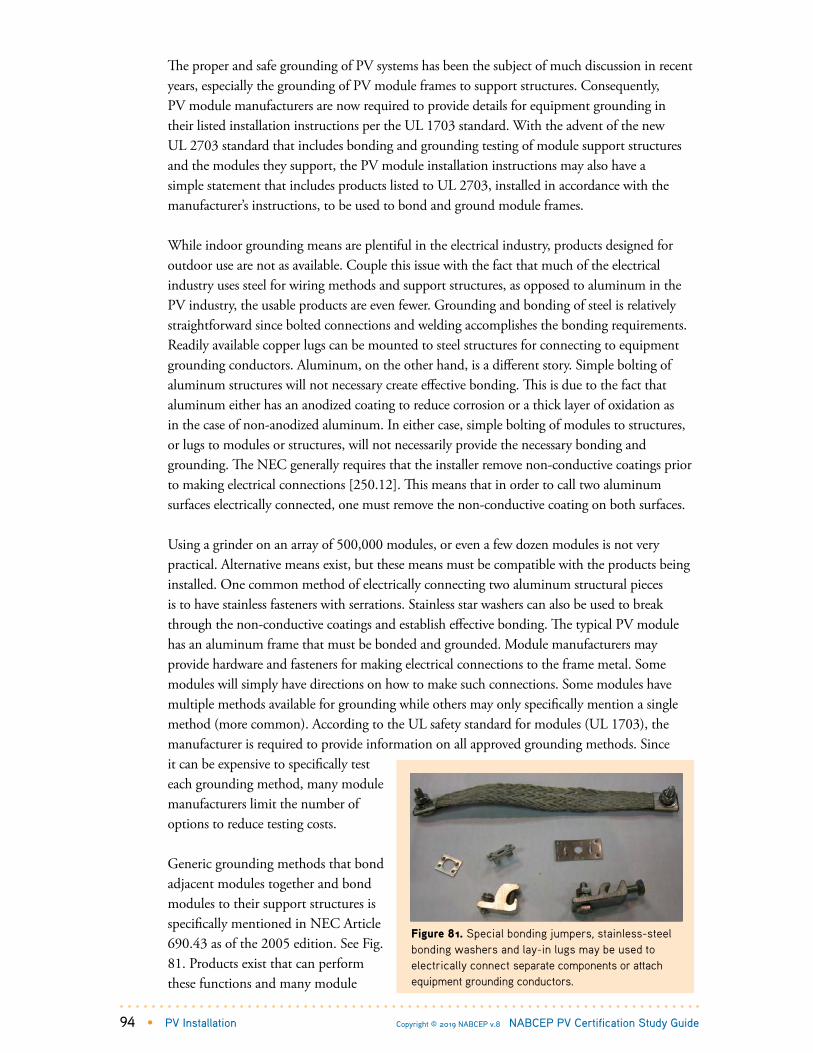
94 • PV Installation Copyright © 2019 NABCEP v.8 NABCEP PV Certification Study Guide
The proper and safe grounding of PV systems has been the subject of much discussion in recent years, especially the grounding of PV module frames to support structures. Consequently, PV module manufacturers are now required to provide details for equipment grounding in their listed installation instructions per the UL 1703 standard. With the advent of the new UL 2703 standard that includes bonding and grounding testing of module support structures and the modules they support, the PV module installation instructions may also have a simple statement that includes products listed to UL 2703, installed in accordance with the manufacturer’s instructions, to be used to bond and ground module frames.
While indoor grounding means are plentiful in the electrical industry, products designed for outdoor use are not as available. Couple this issue with the fact that much of the electrical industry uses steel for wiring methods and support structures, as opposed to aluminum in the PV industry, the usable products are even fewer. Grounding and bonding of steel is relatively straightforward since bolted connections and welding accomplishes the bonding requirements. Readily available copper lugs can be mounted to steel structures for connecting to equipment grounding conductors. Aluminum, on the other hand, is a different story. Simple bolting of aluminum structures will not necessary create effective bonding. This is due to the fact that aluminum either has an anodized coating to reduce corrosion or a thick layer of oxidation as in the case of non-anodized aluminum. In either case, simple bolting of modules to structures, or lugs to modules or structures, will not necessarily provide the necessary bonding and grounding. The NEC generally requires that the installer remove non-conductive coatings prior to making electrical connections [250.12]. This means that in order to call two aluminum surfaces electrically connected, one must remove the non-conductive coating on both surfaces.
Using a grinder on an array of 500,000 modules, or even a few dozen modules is not very practical. Alternative means exist, but these means must be compatible with the products being installed. One common method of electrically connecting two aluminum structural pieces is to have stainless fasteners with serrations. Stainless star washers can also be used to break through the non-conductive coatings and establish effective bonding. The typical PV module has an aluminum frame that must be bonded and grounded. Module manufacturers may provide hardware and fasteners for making electrical connections to the frame metal. Some modules will simply have directions on how to make such connections. Some modules have multiple methods available for grounding while others may only specifically mention a single method (more common). According to the UL safety standard for modules (UL 1703), the manufacturer is required to provide information on all approved grounding methods. Since it can be expensive to specifically test each grounding method, many module manufacturers limit the number of options to reduce testing costs.
Generic grounding methods that bond adjacent modules together and bond modules to their support structures is specifically mentioned in NEC Article 690.43 as of the 2005 edition. See Fig. 81. Products exist that can perform these functions and many module
Figure 81. Special bonding jumpers, stainless-steel bonding washers and lay-in lugs may be used to electrically connect separate components or attach equipment grounding conductors.
2011 Jim Dunlop Solar Cells, Modules and Arrays: 5 - 100
Figure 97. Special bonding jumpers, stainless-steel bonding washers and lay-in lugs may be used to electrically connect separate components or attach equipment grounding conductors.

PV Installation • 95 NABCEP PV Certification Study Guide Copyright © 2019 NABCEP v.8
manufacturers list these options in their installation manuals. While these methods work well with most PV modules manufactured today, problems arise when module instructions do not specifically mention these options. Many jurisdictions take a strict interpretation of the requirement that all products must be installed according to the supplied manufacturer’s instructions [NEC 110.3(B)]. For those jurisdictions, only specifically mentioned methods will likely be allowed. Many module installation manuals will allow any code-approved grounding method. The UL1703 module standard and a new standard UL2703 for module racking systems now better accommodate grounding systems listed to UL2703.
A grounding electrode system consists of a rod, pipe, plate, metal water pipe, building steel or concrete-encased electrode, and includes all grounding electrodes at a building or structure, which must be bonded together. The grounding electrode conductor (GEC) connects the grounded system conductor or the equipment grounding conductor (EGC) to a grounding electrode system. The GEC must be a continuous length without splices except for irreversible connections. A 6 AWG GEC may be secured to and run along building surfaces where protected from damage. GECs smaller than 6 AWG must be in metal raceways or use armored cables [NEC 250.64(B)].
Specific requirements are given for the grounding electrode system used for PV installations [NEC 690.47]. Prior to the 2017 NEC, the requirements were specified separately for ac systems, dc systems, and systems with both ac and dc grounding requirements. The existing grounding electrode system should be checked as part of any PV installation, particularly for older facilities that may have degraded grounding systems. Verify that all available grounding electrodes at the facility are bonded together, and that the grounding electrode conductors are properly installed and sized.
Energy storage systems (ESS) over 100 volts are permitted in dwellings but have several requirements [NEC 706.30] in the 2014 NEC. First, if routine maintenance is required, which would not be the case for lithium-ion or valve-regulated lead-acid (VRLA) batteries, then the terminals must be guarded to prevent contact during that maintenance. [NEC 706.30(A) Exception]. Second, a ground-fault detector-indicator is also required for any ESS operating over 100 volts.
2.5 Install AC PV System Conductors Task 6The point of connection, or point of common coupling, is the point where a distributed generator interfaces with the electric utility network. The point of connection may be located on the supply side or the load side of a facility service disconnecting means, and special rules apply to each type of connection [705.12]. See Fig. 82. While many smaller PV systems can meet the requirements for load side connections, larger systems commonly use supply side connections when the requirements for load side connections cannot be feasibly met.
Additionally, the NEC recognizes that PV systems may be safely interconnected at other distribution equipment on a premise.
Load Side ConnectionsFor some residential and small commercial PV systems, the point of connection can often be made on the load side of the utility service disconnect means at any distribution equipment on

96 • PV Installation Copyright © 2019 NABCEP v.8 NABCEP PV Certification Study Guide
the premises, such as a load center, panelboard or by tapping a feeder conductor [705.12(B)]. See Fig 83.
For load side connections, where the distribution equipment is supplied by both the utility and one or more utility-interactive inverters, and where the distribution equipment is capable of supplying multiple branch circuits or feeders, or both, load side connections must comply with the following six requirements [705.12(B)]. See Fig 84.
1. Dedicated Overcurrent and Disconnect. The interconnection of one or more inverters in a system must have a dedicated disconnecting means and overcurrent protection [705.12(B)(1)]. The key distinction related to the term “dedicated” in this section is that there are no loads on the circuit. The circuit is dedicated to the interconnected inverter(s). This can be a fusible disconnect or circuit breaker and need not be rated as service equipment. For many central inverters, there is often a dedicated disconnect means and overcurrent protection for each inverter [690.9(A), 690.15]. However, a single disconnect means and overcurrent device is permitted for multiple inverters whether string inverters, microinverters, or ac modules connected in parallel to a common output circuit [690.6(C), 690.15].
A maximum of six (6) disconnecting means are permitted for each source of power supplying a premises, and the disconnecting means for each source must be grouped together [230.71,
2011 Jim Dunlop Solar Cells, Modules and Arrays: 5 - 102
Figure 99. Interactive inverters may be connected to either the load side or the supply side of the service disconnecting means.
Distribution Equipment
To Utility
To Branch Circuits
Service Disconnect
Supply Side
Load Side
Figure 82. Interactive inverters may be connected to either the load side or the supply side of the service disconnecting means.
2011 Jim Dunlop Solar Cells, Modules and Arrays: 5 - 103
Figure 100. Many small residential and commercial PV systems can be interconnected by adding backfed circuit breakers to distribution panels as long as certain conditions are met.
Distribution Equipment
To Utility
To Branch Circuits
Service Disconnect
InteractiveInverter
Backfed Circuit Breaker
Figure 83. Many small residential and commercial PV systems can be interconnected by adding backfed circuit breakers to distribution panels as long as certain conditions are met.
2011 Jim Dunlop Solar Cells, Modules and Arrays: 5 - 104
Figure 101. Load side connections require that the sum of the ampere ratings of overcurrent devices supplying power to a busbar or conductor does not exceed 120% of busbar or conductor
rating.
Distribution Equipment
To Utility
To Branch Circuits
Service Disconnect
InteractiveInverter
Backfed Circuit Breaker
200 A
40 A
Figure 84. Load side connections require that the sum of the ampere ratings of overcurrent devices supplying power to a busbar or conductor does not exceed 120% of busbar or conductor rating.

PV Installation • 97 NABCEP PV Certification Study Guide Copyright © 2019 NABCEP v.8
690.13(D)]. For example, six disconnects are permitted for a single utility service, and an additional six disconnects would be permitted for a PV system. Where a facility is supplied by a utility service and a PV system, a permanent plaque or directory is required that provides the location of the service disconnecting means and the location of the PV system disconnecting means if these disconnecting means are not co-located [705.10].
Where multiple PV systems are remotely located from each other, a directory is required at each dc disconnecting means, at each ac disconnecting means, and at the main service disconnecting means showing the location of all PV system ac and dc disconnecting means in the building [690.4(D), 705.10]. Oftentimes, multiple PV systems are combined in parallel at inverter collection subpanels. A circuit breaker is provided for each inverter output and a single disconnecting means and overcurrent protection is provided for the entire subpanel. This common installation practice consolidates and groups the inverter ac disconnecting means in one location. Regardless of where inverters are installed, such as on rooftops, each inverter must have a dc and ac disconnecting means located within sight and within 10 feet of the inverter [690.15.This requirement allows service personnel to easily verify the PV dc source and ac source have been disconnected for safety purposes.
2. Bus or Conductor Ampere Rating. The main concern addressed in this section is preventing possible overloading of a panel bus or feeder conductor due to the addition of inverter output current. Starting with the 2014 NEC, ampacity calculations for feeders, taps and busbars are based on 125 percent of the rated inverter ac output circuit current [705.12(B)(2)]. Formerly in the 2011 NEC, ampacity calculations were based on the ampere rating of the overcurrent device for the inverter ac output circuit. However, this calculation does not always yield a standard size overcurrent device, and the next standard size overcurrent device is permitted up to 800 A [690.9(B), 240.4(B)]. Where the overcurrent device is rated over 800 A, the ampacity of the conductors it protects shall be equal to or greater than the rating of the overcurrent device specified in 240.6. [240.4(C)].
For example, an inverter with maximum current of 25 A would require an overcurrent device rated no less than 25 A x 1.25 = 31.25 A [690.9(B)], and permits the use of the next higher standard-sized overcurrent device which is 35 A [240.6(A)]. Based on the 2014 NEC, ampacity calculations for feeders, taps and busbars may now use 31.25 A rather than the higher 35 A overcurrent device rating required under the 2011 NEC. In the cases where 125 percent of the maximum inverter current does not exactly correspond to a standard-sized overcurrent device, this change permits inverters with slightly higher current output to be connected to a given size busbar or conductor. This change more accurately reflects maximum conditions, in that inverters are current-limited output devices.
Interconnecting to FeedersLoad side connections for PV systems are permitted to be made at points along a feeder by tapping the feeder conductors [705.12(B)(2)(1)]. By definition, a feeder includes all circuit conductors between the service equipment and the final branch-circuit overcurrent device [100, 215]. Commonly, feeders are used between service equipment and other distribution equipment that serve branch circuit loads, including panelboards or fusible disconnecting means. Feeder conductors are protected by an overcurrent device at their source of supply [215.3, 240.21]. If an inverter output connection is made at any location along the feeder

98 • PV Installation Copyright © 2019 NABCEP v.8 NABCEP PV Certification Study Guide
other than at the opposite end of the feeder from the primary source overcurrent device, the potential exists to overload the portion of the feeder on the load side of the inverter output connection due to the additional inverter current. In these cases, the load side portion of the feeder requires additional protection from overcurrent and can be accomplished by either of the following two methods.
One method allowed is to increase the conductor size for the load side portion of the feeder, which is required to be not less than the sum of the primary source overcurrent device plus 125 percent of the inverter output circuit current [705.12(B)(2)(1)(a)]. For example, consider an inverter ac output circuit connected midway along a feeder. The overcurrent device protecting the feeder at the source of supply is 150 A, and the inverter maximum ac output current is 32 A. The feeder conductor on the load side of the inverter ac output connection must then be sized for not less than 150 A + (32 A x 1.25) = 190 A (see Figure 85). This would require a minimum 3/0 AWG THWN copper conductor rated for 75ºC [Table 310.15(B)(16)] for the portion of the feeder on the load side of the inverter output connection. If an existing feeder has already been oversized (to minimize voltage drop) and protected by a smaller overcurrent device than permitted for the conductor size, upsizing the portion of the feeder conductor on the load side of the inverter output connection may not always be required. However, sizing calculations must verify that this portion of the feeder has sufficient ampacity to account for the additional inverter current.
The other method allowed to protect the feeder is to install an overcurrent device on the load side portion of the feeder from inverter output connection, which must be rated no greater than the ampacity of the feeder [705.12(B)(2)(1)(b)]. Consider the previous example with a feeder having a rated ampacity of 150 A and protected by a 150 A overcurrent device at the source of supply. A 150 A overcurrent device would be required for the load side portion of the feeder at the point of the inverter output connection, and protects that portion of the feeder. This new feeder breaker on the load side of the inverter connection effectively prevents the inverter from contributing to an overcurrent condition (see Figure 86).
Figure 85. Inverter connection to a feeder-load side of feeder must have ampacity of sum of feeder breaker and inverter

PV Installation • 99 NABCEP PV Certification Study Guide Copyright © 2019 NABCEP v.8
Tap SizingIn general, conductors are protected from overcurrent at their point of supply [240.21]. The required overcurrent protection is based on the rated conductor ampacity [310.15], and the next highest standard-sized overcurrent device is permitted to be used up to 800 A [240.4(B)]. On the other hand, tap conductors are a special class of conductors, smaller than the feeders to which they are connected, that have overcurrent protection downstream from their point of supply. Tap conductors are subject to special sizing and overcurrent protection requirements specified in 240.21. The use of the next highest standard-sized device allowed by 240.4(B) is not permitted for feeder tap conductor applications [240.21(B)].
Inverter output circuits connected to a feeder are not considered tap conductors, because these conductors are protected by an overcurrent device based on the rated ampacity of the conductors. However, the feeder conductors on the load side (downstream) from the inverter connection may be considered tap conductors if these conductors are not protected by an overcurrent device at the inverter connection and are less than 25 feet in length (see Figure 87). In this specific case, the subpanel is required to have a maximum of a 150 A main overcurrent device to prevent overcurrent of the feeder and tap.
In the cases where a feeder conductor has already been oversized for voltage drop considerations and uses a smaller overcurrent device than required, the conductors on the load side of an inverter connection may simply be a continuation of the feeder, not a tap conductor. For example, consider a 200 A feeder conductor protected by a 150 A overcurrent device that supplies a main lug only (MLO) panelboard rated at 150 A, and an inverter with 32 A rated output current is connected to this feeder. Because the sum of the primary source overcurrent device and 125 percent of the inverter output circuit current (150 A + 32 A x 1.25 = 190 A) does not exceed the feeder conductor rating of 200 A [705.12(B)(2)(1)(a)], the conductors on the load side of an inverter connection are feeder conductors, not tap conductors. However the busbar rating in the subpanel is required to be rated at a minimum of 200 A (see Figure 85).
Figure 86. Inverter connection to feeder-no upgrade necessary

100 • PV Installation Copyright © 2019 NABCEP v.8 NABCEP PV Certification Study Guide
Whenever inverter output connections are made to a feeder, any tap conductors are required to be sized based on the sum of 125 percent of the inverter output circuit current plus the rating of the overcurrent device protecting the feeder conductors as calculated in 240.21(B) [705.12(B)(2)(2)]. Tap conductors up to 10 feet in length have different sizing requirements for tap conductors more than 10 feet but not greater than 25 feet in length.
Tap Rules for Taps of 10 or 25 Feet without PV inverters on the Feeder:In general, for tap conductors up to 10 feet in length [240.21(B)(1)], the first requirement is to ensure the tap conductor have sufficient ampacity. The ampacity of the tap conductors is must not be less than a) the combined calculated circuit loads supplied by the tap conductors, and b) the rating of the equipment containing an overcurrent device(s) supplied by the tap conductors, or not less than the rating of the overcurrent at the terminationof the tap conductors [240.21(B)(1)(1)]. For example, a tap conductor rated 100 A minimum would be required for termination at a 100 A main breaker panelboard. The second requirement is that the tap conductors must terminate and not extend beyond the equipment that they supply [240.21(B)(1)(2)]. The third requirement is that the tap conductors are enclosed in a raceway, which extends from the tap to the equipment enclosure, excluding point of connection to the feeder [240.21(B)(1)(3)]. Lastly, the ampacity of the tap conductors must not be less than one-tenth of the rating of the overcurrent device protecting the feeder conductors [240.21(B)(1)(4)].
Tap conductors more than 10 feet but not greater than 25 feet in length must meet three requirements [240.21(B)(2)]. First, the ampacity of the tap conductors must not be less than one-third of the rating of the overcurrent device protecting the feeder conductors [240.21(B)(2)(1)]. Second, the tap conductors must terminate at a single circuit breaker or a single set of fuses that limit the load to the ampacity of the tap conductors [240.21(B)(2) (2)]. This overcurrent device is permitted to supply any number of additional overcurrent devices on its load side. Third, the tap conductors must be protected from physical damage by being enclosed in a raceway or by other approved means [240.21(B)(2)(3)].
Tap Rules for Taps of 10 or 25 Feet with PV inverters on the Feeder:When the output of power sources like PV inverters are added to a feeder, additional current is available to the feeder. For example, consider a feeder conductor rated for 150 A that is protected by a 150 A overcurrent device and supplies a panelboard. An inverter with rated
Figure 87. Inverter connection within 25 of the end of the feeder (end of feeder becomes a tap)

PV Installation • 101 NABCEP PV Certification Study Guide Copyright © 2019 NABCEP v.8
output current of 32 A is connected midway along the feeder. First, we will consider an existing feeder tap midway on the same feeder where a PV inverter is being connected. The language in 705.12(B)(2)(2) requires that the minimum tap be sized based on both the feeder breaker and 125% of the inverter current in accordance with 240.21(B). For taps of 10 feet or less, the minimum size can be no smaller than 1/10 of the sum of the feeder breaker and 125% of the inverter current [(150 A + 1.25 x 32 A)/10 = 19 A]. For feeder taps of between 10 and 25 feet, the minimum size can be no smaller than 1/3rd of the sum of the feeder breaker and 125% of the inverter current [(150 A + 1.25 x 32 A)/3 = 63.3 A]. Either tap scenario would permit the tap conductors to supply a 60 A panelboard that is protected by a 60 A overcurrent device provided that the tap conductor has sufficient ampacity. Sufficient ampacity for these two tap cases would be 60 A for a 10-foot tap and 63.3 A for a tap between 10 and 25 feet in length (see Figure 88).
Interconnecting to BusbarsStarting with the 2014 edition, the NEC permits four methods of interconnecting inverter ac output circuits to busbars. The first method (a) has no limitation on the number of loads or sources connected to busbars or the location of the overcurrent devices. The second and third methods (b & c) allow connections to busbars with limitations and require special warning labels. The fourth method (d) permits connections to multiple-ampacity busbars or center-fed panelboards, and these special cases must be designed under engineering supervision that include fault studies and busbar load calculations.
For the first method (a), the sum of 125 percent of the inverter(s) output circuit current and the rating of the overcurrent device protecting the busbar shall not exceed the ampacity of the busbar. For example, consider a PV system having two interactive inverters each having a rated output current of 25 A, and connected to a 200 A busbar. Based on method (a), the maximum allowable size overcurrent device protecting the busbar would be 200 A – (2 x 25 A x 1.25) = 137.5 A. The next smallest standard size overcurrent device is 125 A, and would protect this busbar from possible overloading with no limitations on the number of loads connected to the busbar, or the location of the overcurrent devices (see Figure 89).
Figure 88. Sizing tap with inverter on the same feeder

102 • PV Installation Copyright © 2019 NABCEP v.8 NABCEP PV Certification Study Guide
The second method (b) permits the connection of a utility source and inverter to opposite ends of a busbar that also serves loads, with the limitation that the sum of 125 percent of the inverter(s) output circuit current and the rating of the overcurrent device protecting the busbar shall not exceed 120 percent of the ampacity of the busbar. This provision is similar to earlier NEC editions, with the difference being that 125 percent of the inverter output current may now be used for the ampacity calculations instead of the overcurrent device rating.
For example, consider a 200 A busbar fed from the top with a 200 A overcurrent device from the utility supply. Using method (c), the maximum allowable inverter rated output current feeding the busbar would be: [(200 A x 1.2) – 200 A]/1.25 = 32 A (see Figure 90). This method also requires that the busbar is sized for connected loads in accordance with Article 220, which may limit the ability to downsize the overcurrent device protecting the busbar in order to gain more available ampacity for interconnecting larger inverters. Whenever method (b) is employed, a permanent warning label is required in accordance with 110.21(B) on the equipment adjacent to the inverter output connection breaker with the following or equivalent wording: WARNING: INVERTER OUTPUT CONNECTION; DO NOT RELOCATE THIS OVERCURRENT DEVICE. The concern with method (b) is to ensure distributed loading of the busbar fed from sources at opposite ends of the busbar. Moving the inverter breaker to another location on the busbar could potentially result in greater loading than the busbar rating.
The third method (c) allowed for connecting interactive inverters to busbars requires that the sum of the ampere ratings of all overcurrent devices on panelboards, both load and supply devices, excluding the rating of the primary overcurrent device protecting the busbar, must not exceed the ampacity of the busbar. This option was placed in the NEC to provide for an ac combiner panel for PV systems. For example, consider a 200-amp panel busbar fed by a 200-amp overcurrent device from the utility supply, this would allow up to 10, 20-amp circuit breakers. All of these breakers could be connected to inverters or a combination of inverters and one or two load breakers. With this same 200-amp panel, it would also be possible to use this panel to combine 5, larger 40-amp inverter circuit breakers.
Figure 89. Sum of main supply breaker plus 125% of inverter(s) rated output current no greater than busbar rating
Figure 90. 120% of busbar rule requiring inverter breaker at opposite end
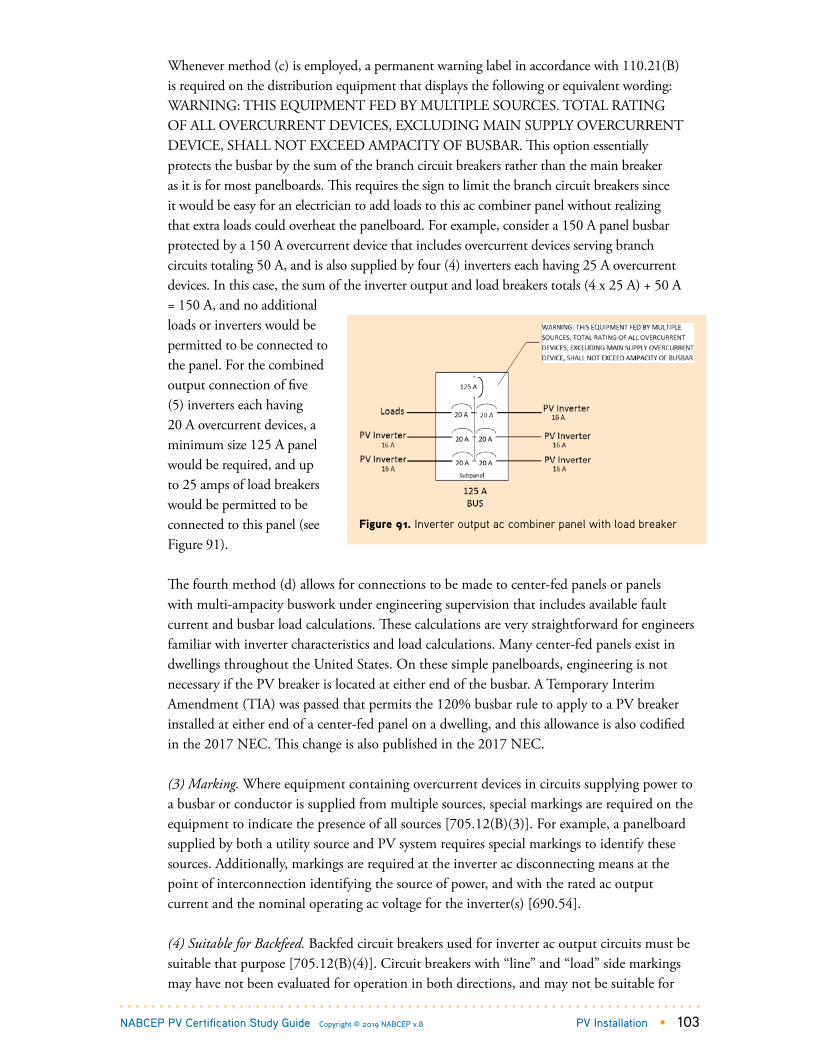
PV Installation • 103 NABCEP PV Certification Study Guide Copyright © 2019 NABCEP v.8
Whenever method (c) is employed, a permanent warning label in accordance with 110.21(B) is required on the distribution equipment that displays the following or equivalent wording: WARNING: THIS EQUIPMENT FED BY MULTIPLE SOURCES. TOTAL RATING OF ALL OVERCURRENT DEVICES, EXCLUDING MAIN SUPPLY OVERCURRENT DEVICE, SHALL NOT EXCEED AMPACITY OF BUSBAR. This option essentially protects the busbar by the sum of the branch circuit breakers rather than the main breaker as it is for most panelboards. This requires the sign to limit the branch circuit breakers since it would be easy for an electrician to add loads to this ac combiner panel without realizing that extra loads could overheat the panelboard. For example, consider a 150 A panel busbar protected by a 150 A overcurrent device that includes overcurrent devices serving branch circuits totaling 50 A, and is also supplied by four (4) inverters each having 25 A overcurrent devices. In this case, the sum of the inverter output and load breakers totals (4 x 25 A) + 50 A = 150 A, and no additional loads or inverters would be permitted to be connected to the panel. For the combined output connection of five (5) inverters each having 20 A overcurrent devices, a minimum size 125 A panel would be required, and up to 25 amps of load breakers would be permitted to be connected to this panel (see Figure 91).
The fourth method (d) allows for connections to be made to center-fed panels or panels with multi-ampacity buswork under engineering supervision that includes available fault current and busbar load calculations. These calculations are very straightforward for engineers familiar with inverter characteristics and load calculations. Many center-fed panels exist in dwellings throughout the United States. On these simple panelboards, engineering is not necessary if the PV breaker is located at either end of the busbar. A Temporary Interim Amendment (TIA) was passed that permits the 120% busbar rule to apply to a PV breaker installed at either end of a center-fed panel on a dwelling, and this allowance is also codified in the 2017 NEC. This change is also published in the 2017 NEC. (3) Marking. Where equipment containing overcurrent devices in circuits supplying power to a busbar or conductor is supplied from multiple sources, special markings are required on the equipment to indicate the presence of all sources [705.12(B)(3)]. For example, a panelboard supplied by both a utility source and PV system requires special markings to identify these sources. Additionally, markings are required at the inverter ac disconnecting means at the point of interconnection identifying the source of power, and with the rated ac output current and the nominal operating ac voltage for the inverter(s) [690.54].
(4) Suitable for Backfeed. Backfed circuit breakers used for inverter ac output circuits must be suitable that purpose [705.12(B)(4)]. Circuit breakers with “line” and “load” side markings may have not been evaluated for operation in both directions, and may not be suitable for
Figure 91. Inverter output ac combiner panel with load breaker

104 • PV Installation Copyright © 2019 NABCEP v.8 NABCEP PV Certification Study Guide
backfeeding. Circuit breakers without “line” and “load” side markings have been evaluated for operation in both directions, and are suitable for backfeeding. Fused disconnects are also suitable for backfeeding unless otherwise marked.
(5) Fastening. Normally, plug-in-type circuit breakers backfed from a utility source require an additional fastener to prevent the supply circuit breaker from being easily removed, in accordance with 408.36(D). Because the terminals of these supply breakers are usually energized, this requirement reduces the hazard that personnel will come into contact with energized conductors if the circuit breaker is removed. Typically, supply breakers are bolted into panelboards thus making the live terminals not readily accessible.
In the case of circuit breakers used for the ac output of interactive inverters, removing the breaker removes the utility source and the inverter stops supplying output immediately. For this reason, and the fact that panel covers usually hold these breakers in place, the additional fastener is not required for utility-interactive inverters. However, the load terminals of plug-in type back-fed circuit breakers connected to a stand-alone or multimode inverter output circuits can remain energized when the breaker is removed, and must be secured in accordance with 408.36(D) [710.15(E)].
(6) Wire Harness and Exposed Cable Arc-Fault Protection. Introduced in the 2014 NEC, any utility-interactive inverter(s) that has a wire harness or cable output circuit rated 240 V, 30 amperes, or less, not installed within an enclosed raceway, shall be provided with listed ac AFCI protection [705.12(D)(6)]. Most ac modules and microinverters use exposed cables and wiring harnesses for the inverter ac output connections. Since no products are available to meet this requirement, a Temporary Interim Amendment (TIA) was approved for the 2014 that completely removes this requirement. This relieves the problem of having to find products that do not exist or asking the jurisdiction to apply section 90.4 of the NEC which allows jurisdictions to use the previous version of the Code when a product is not available. Supply Side ConnectionsWhen the requirements for load side connection become impractical or too costly to implement, interactive PV systems and other interconnected power sources may be connected to the supply side of the service disconnecting means [705.12(A), 230.82(6)]. These requirements are similar to installing another service disconnecting means, which involves tapping the existing service conductors or bus, or installing new service equipment. Supply side interconnections are often required for larger installations. See Fig 92.
The sum of the ratings for overcurrent devices supplying service conductors must not exceed the ratings of those conductors. Supply side connections must have a service-rated disconnect and overcurrent device, with a minimum rating of at least 60 A, and have an ampere interrupting capacity
2011 Jim Dunlop Solar Cells, Modules and Arrays: 5 - 105
Figure 102. Supply side connections are made on the utility side of the service disconnecting means.
Distribution Equipment
To Utility
To Branch Circuits
Service Disconnect
InteractiveInverter
Service Rated Fused Disconnect
Figure 92. Supply side connections are made on the utility side of the service disconnecting means.

Learn more about Trojan’s products including our new Lithium Ion solutions for renewable energy applications.
trojanbattery.com
We don’t just manufacture batteries - we
innovate, engineer and develop energy
solutions. We provide extraordinary life,
quality, and performance for all your off-
grid and mini-grid applications. At Trojan
Battery Company, we’re charging forward.

106 • PV Installation Copyright © 2019 NABCEP v.8 NABCEP PV Certification Study Guide
(AIC) rating sufficient for the maximum available fault current. The available fault current for residential services is generally 10,000-amps or less unless otherwise identified. The most straightforward way to determine available fault current is to look at the AIC rating of the existing service equipment, and use the same or higher rated equipment. The utility can provide the available fault current as well, but it can take time to get that value from the utility. The connection can be made by tapping the service conductors at or before the main distribution panel prior to the existing service disconnect, or it may be made on the load side of the meter socket if the terminals permit. Additional junction boxes may be installed to provide sufficient room for the tap. Service equipment for larger commercial facilities may have busbars with provisions for connecting tap conductors. Often large commercial switchgear will require a NRTL to field evaluate the connection to maintain the listing of the equipment.
In cases of very large PV installations, existing service conductor ampacity or distribution transformers may not be sufficient and separate services may be installed. Power flow can occur in both directions at the point of connection, and the interface equipment and any metering must be sized and rated for the operating conditions.
2.6 Utility Interconnection Task 8Interconnection refers to the technical and procedural matters associated with operating interactive PV systems and other distributed generation sources in parallel with the electric utility system. Technical interconnection issues include safety, power quality, and impacts on the utility system, and are addressed in national codes and standards. Interconnection procedures are based on state and utility policies, and include the application process and schedule, customer agreements, and permitting and inspection. Contractual aspects of interconnection policies may include fees, metering requirements, billing arrangements, and size restrictions on the PV system. Check with the local utility company to determine the specific interconnection procedures and policies applicable for a specific location.
IEEE 1547 Standard for Interconnection of Distributed Resources with Electrical Power Systems3 establishes the technical requirements for interconnecting all types of distributed generation equipment, including PV, fuel cells, wind generators, reciprocating engines, microturbines, and larger combustion turbines with the electrical power system. It also establishes requirements for testing, performance, maintenance and safety of the interconnection, as well as response to abnormal events, anti-islanding protection and power quality.
The focus of IEEE 1547 is on distributed resources with capacity less than 10 MVA, and interconnected to the electrical utility system at primary or secondary distribution voltages. The standard provides universal requirements to help ensure a safe and technically sound interconnection. It does not address limitations or impacts on the utility system in terms of energy supply, nor does it deal with procedural or contractual issues associated with the interconnection. Based on utility concerns about increasing penetration of PV systems and impacts on the utility grid, a full revision of the standard is underway including a new title: IEEE P1547 Draft Standard for Interconnection and Interoperability of Distributed Energy Resources with Associated Electric Power Systems Interfaces.
UL 1741 Standard for Inverters, Converters, Controllers and Interconnection System Equipment for Use with Distributed Energy Resources addresses requirements for many

PV Installation • 107 NABCEP PV Certification Study Guide Copyright © 2019 NABCEP v.8
types of distributed generation equipment, including inverters, charge controllers and combiner boxes used in PV systems, as well as equipment used for the interconnection of wind turbines, fuel cells, microturbines and engine-generators. This UL standard covers requirements for the utility interface, and provides product certification in accordance with IEEE 1547 and other electrical safety standards. The products covered by the UL 1741 listing are intended to be installed in accordance with the NEC.
All inverters and ac modules that are specifically intended to be used in interactive PV systems must be listed and identified for interactive operations, and this information must be marked on the product label. Battery-based inverters intended only for stand-alone off-grid applications do not have these special identification markings, and may not be used for grid-connected applications. However, all inverters used in PV systems must be listed to the UL 1741 standard, whether they are used for stand-alone or interactive systems. See Fig 93.
NEC Article 690 Part VII addresses the connection of PV systems to other electrical sources, and applies to any interactive PV system interconnected to the utility grid. For the 2011 NEC, most of the interconnection requirements for PV systems were moved from Article 690 to Article 705 Interconnected Electric Power Production Sources. For the 2014 NEC, a number of changes were made to Article 705, including new details and options for load side interconnections. The 2017 NEC completes the process by removing specifics from 690 and simply providing reference to Article 705.
For safety reasons, all utility-interactive inverters and ac modules are required to automatically de-energize their output to the utility network upon loss of voltage in that system and must remain in that state until the voltage has been restored [690.61]. This requirement ensures that a PV system will not energize utility system conductors that have been otherwise de-energized and is intended to prevent electrical shock. Interactive inverters must remain disconnected from the grid until the voltage has been restored to normal operating conditions for a period of five minutes. This five-minute wait period is a feature of all smaller interactive inverters, and occurs anytime an inverter is turned on and energized by utility power. An exception to this requirement permits a normally interactive solar PV system to operate as a stand-alone system to supply loads that have been disconnected from the utility network, as is the case for multimode inverters or other types of inverters that permit the operation of emergency loads during utility outages.
The NEC requires that any PV system equipment, including any electrical power production sources operating in parallel with a primary source of electricity be installed only by qualified persons [690.4(C), 705.6]. PV systems have unique hazards, and a qualified person must
Figure 93. Inverters and ac modules used in utility-interactive PV systems must be listed and identified for interactive operations.
2011 Jim Dunlop Solar Cells, Modules and Arrays: 5 - 101
Figure 98. Inverters and AC modules used in utility-interactive PV systems must be listed and identified for interactive operations.

108 • PV Installation Copyright © 2019 NABCEP v.8 NABCEP PV Certification Study Guide
have special training, skills and knowledge to safely work on these systems. See Article 100 for the definition of Qualified Person. For interactive PV systems, a permanent plaque or directory must be installed at the location for each service and at power sources capable of being interconnected, denoting all electric power sources on or in the premises [705.10].
2.7 Large-Scale PV SystemsOften large-scale PV systems are designed to export electricity to the utility. In these cases, there can be many factors that impact the design specifically for larger PV systems. For instance, NEC Article 691 Large-Scale Photovoltaic (PV) Electric Power Production Facility can be used for PV systems that are no less than 5,000kW generating capacity (ac output) and meet all the requirements in Article 691. Section 691.4 sets forth five criteria that must be met in order for a large-scale PV system to be permitted to use the provisions of Article 691. Among these criteria include that the facility must be directly connected to the electric distribution or transmission system and that the facility cannot be mounted on buildings. The purpose of having separate requirements for large-scale PV system is to differentiate large facilities that are operated as power plants in a similar manner to large conventional power stations. These power plants are not accessible to the public and have specific procedures that limit the hazards to the operators of the facilities.
2.8 Installing Mechanical ComponentsPV modules and array mounting systems must be installed in accordance with mounting system and module manufacturer’s instructions. Not following these instructions may void product warranties and may violate the listing and applicable codes. Specialized training and experience may be required to install products and systems, such as building-integrated products, large tracking systems, and other mounting systems.
2.8.1 Install Mounting System Tasks 11 and 12PV arrays are constructed from building blocks of individual PV modules, panels, and sub arrays that form a mechanically and electrically integrated power generation unit. The mechanical and electrical layout and installation of PV arrays involves many interrelated considerations and tradeoffs. Some of the many factors to consider include:• Module physical and electrical characteristics• Array electrical design and output requirements• Mounting location, orientation and shading• Type of mounting surface (roof or ground mount)• Access, pathways, and setbacks for installation, maintenance, and fire codes• Structural loads on modules, mounting system, and attachments• Thermal characteristics of modules and effects of mounting system• Weather sealing of building penetrations and attachments• Materials and hardware compatibilities with the application environment• Aesthetics
Mounting system designs have a strong effect on average and peak array operating temperatures. Higher PV module operating temperatures reduce array voltage, power output, energy production, and accelerate degradation of modules and their performance.

PV Installation • 109 NABCEP PV Certification Study Guide Copyright © 2019 NABCEP v.8
Maximum passive cooling gains are generally achieved with the bottom of PV modules 2 to 6 inches above the surface to which they are attached. Modules with sufficient air space can experience a temperature rise from 15°C to 25°C above ambient temperatures under solar irradiance levels of 1000 W/m2. Mounting structures with insufficient air space underneath can experience higher than desirable operating temperatures. Arrays with steep pitch angles have more efficient thermal cooling than arrays with low pitch angles.
Steep slope roof mounted PV arrays are typically mounted above and parallel to the rooftop. Low slope roof mounted PV arrays may be pitched up off the roof surface. PV modules are typically bolted or clamped to the mounting system. Roof mounting systems for steep sloped roofs are mechanically secured with attachments specifically designed for a particular roof type, and are weather sealed to the building structure. Low slope roof mounting systems are either mechanically attached to the roof structure, or weighted down with ballast. If ballast blocks are used to weigh the mounting system down, the blocks must not degrade over the life of the system. Low slope roof mounting systems in areas of high wind and seismic loads often include a combination ballast and mechanical attachment to meet loading requirements.
PV arrays installed in higher wind and snow load regions require stronger mounting systems, and may require smaller spans between attachments (meaning more attachment points) to avoid excessive racking and module deflections. Smaller spans between attachments also serve to distribute loading among roofing members to prevent overload of individual rafters or trusses. Attachments support the entire structural loads of the PV array and any externally applied loads (wind, snow, installers) are supported by the attachments (roof or ground).
Prior to installation, the roof condition should be carefully evaluated to determine remaining life. Installing a new roof under the array minimizes the need to remove and reinstall the array during its productive life.
Figure 94.

110 • PV Installation Copyright © 2019 NABCEP v.8 NABCEP PV Certification Study Guide
Roof attachments (See Fig. 95) must be installed per roof attachment manufacturer's instructions. Per IBC and IRC regulations, flashing must be used to seal all penetrations in the roof using approved methods. While fasteners applied through roofing materials are not strictly defined as penetrations in the IBC and IRC, industry standard recommendations include using products that are capable of flashing fasteners as well. Flashing of asphalt shingles must be performed per the shingle manufacturer’s instructions. The National Roofing Contractors Association (NRCA) publishes flashing guidelines endorsed by most major shingle manufacturers, and the Tile Roofing Institute publishes installation requirements for flashing that are required by most roof tile manufacturers. Non-penetrating attachments, such as standing seam metal roof clamps and ballasted low-slope systems, should be approved for use by the roofing manufacturer in order to maintain the roofing system warranty. Conduit penetrations should be flashed and weather-sealed per the guidelines listed above.
Inverters, rapid shutdown controls, and/or transition boxes that mount to the roof should be secured from movement through sufficient mechanical attachment or ballasting with sufficient capacity to withstand wind, seismic, and snow loading as determined by a qualified structural design professional. Any penetrations in the roof must be flashed and weather sealed per industry standards.
Per the American Wood Council’s National Design Specifications, where lag screws are used, they must be centered into the truss or rafter following location guidelines specified. As a result, for the vast majority of rafters/trusses, you must pre-drill a hole using the proper drill bit diameter before installing a lag screw. The drill bit must be long enough to drill a full depth hole preventing damage to the
Figure 95. Roof attachments
Figure 97. Flashed transition box
Figure 96. Flashed conduit penetration

PV Installation • 111 NABCEP PV Certification Study Guide Copyright © 2019 NABCEP v.8
rafter by the lag screw. Lag screws should include threads for the entire depth of embedment in rafters or trusses. Should any portion of a shank include an unthreaded portion that will enter the roofing member, an additional pilot hole must be drilled to the full dimension of the shank for the depth the unthreaded portion is in the wood member. That is why it is always recommended to use fully threaded lag screws to simplify the pilot hole drilling process.
There are multiple techniques used to locate rafters. When access is possible, attic rafter mapping is the preferred approach as it is accurate and minimizes roof damage. It also allows inspecting the attic for any existing leaks or structural issues. Another technique involves using a deep-penetrating stud finder, but this may not work well with all roof types. Echo-location with a hammer tapping on the roof surface may be a viable approach, but extreme care should be exercised to avoid damaging the roofing material. Exploratory drilling may also be possible using a small drill bit to locate the edge of the rafter. Any holes drilled should be properly flashed and sealed using approved methods.
Sealant compatible with the roof materials and temperature range should be applied to all penetrations in conjunction with flashings.
Where structural members are not located in the area required to install a roof attachment, then the best approach may be to install wood blocking between rafters/trusses. This may also be true when attaching to a hip truss as the truss members may not be parallel to the roof sheathing. Typical blocking consists of two 2x6 boards or a 4x4 attached between rafters or trusses. These configurations provide 3 to 3.5 inches of wood into which a lag screw can penetrate. In order to provide proper support for the array, the boards must be nailed or screwed securely onto the rafters or trusses with at least two fasteners on each side of each board. See Fig. 98.
Figure 98.

112 • PV Installation Copyright © 2019 NABCEP v.8 NABCEP PV Certification Study Guide
PV array mounting system designs and all components must be able to withstand the maximum forces related to the specific site and configuration of the installationn. The mounting system should be evaluated for shear, pullout, and uplift load capacity to ensure the system can withstand all loads (wind, snow, seismic, etc.) In many applications, a structural engineering evaluation may be required to validate the system design with the AHJ. Particular focus should be placed on the roof attachments for structural integrity and long term waterproofing considerations. When using a sheathing attachment system, a qualified structural design professional should validate the roof attachment layout and the attachment of the sheathing to the roofing structure.
When attaching to low slope membrane or foam roof types, consult with the roofing system manufacturer to determine proper waterproofing methods. Where using the membrane as a structural attachment, consult the roofing system manufacturer and qualified structural design professional to ensure that all structural loads are addressed.
When attaching to concrete roof decks, a qualified structural design professional should evaluate the condition and structural capacity of the roof and ensure attachments will not adversely degrade the structural integrity of the deck with particular focus on the weather sealing of the roof.
When attaching to metal panel roofs (standing seam and through fastened), a qualified structural design professional should evaluate the attachment method of the metal panels to the roof structure to ensure they are able to withstand the applied loads (e.g. upward, downward, downslope) of the PV array. It may be necessary to validate that the metal panels are properly attached so that uplift forces are properly transferred to the roof structure.
Structurally Insulated Panels (SIP panels) may not be suitable for mounting PV. A qualified structural design professional should evaluate the structural capacity of mounting on SIP panels to assure they will be able to handle the added load, structural impact of attachment, and weather-sealing methods over the life of the array.
Accessories such as pest fencing and wind deflectors (aka skirts/shields) should be installed per manufacturer's installation instructions taking care to avoid damage to the mounting system, modules, and roof.
Snow retention systems may be used to avoid snow sliding off the array in a damaging avalanche. When snow retention systems are used, the modules, mounting system, and roof must be evaluated by a qualified structural design professional to ensure they will withstand the maximum snow load capacity.
PV mounting systems that are certified with a fire classification (A, B, or C) are rated with PV modules that are certified to a fire classification type (type 1 through 15) per UL 1703/2703 in order to meet a specific fire classification.
For ground mounting installations, soil conditions should be evaluated by a qualified design professional to verify the mounting surface can withstand the loads required by the site conditions, racking configuration, and loading variables (wind, snow, seismic, etc.)

PV Installation • 113 NABCEP PV Certification Study Guide Copyright © 2019 NABCEP v.8
2.8.2 Install PV Modules Task 13Care must be exercised when transporting and handling PV modules to avoid damaging the frame to glass connection. Most PV modules are not designed to be carried with one hand like a suitcase. Typically it is advisable to carry the module with two hands from underneath the bottom frame rail.
Most standard flat-plate PV modules are glass laminates enclosed in an aluminum frame. The frame provides mechanical support for the laminate, and a means to structurally attach the module to a mounting system. PV modules are typically bolted or clamped to the mounting system. Clamped connections are typically top down or bottom lip clamps. Bolted connections must use PV module frame holes intended for mounting. Drilling new holes in the PV module is not a permissible option for most PV modules. See Fig. 99. In common steep-slope rooftop applications, the rails are usually laid out perpendicular to the roofing members, which permits variable spacing of attachments. Staggering attachments is a common practice to distribute the load more equally across the roofing structure. In areas of high wind and snow loading, staggering attachments may be required to meet loading requirements.
PV modules require the mounting supports to be located at certain points on the module frame to support the specified mechanical loads. Refer to the module manufacturer’s instructions regarding mounting system support locations and permissible cantilevers. Follow any specific mounting hardware requirements specified by the manufacturer to meet specific loading requirements. See Fig. 117.
Rail Type Racking – Top Clamp
Rail Free Racking – Top Clamp
Bolted Connection Ballasted Racking – Bottom Lip Clamp
Figure 99.
Figure 100.

114 • PV Installation Copyright © 2019 NABCEP v.8 NABCEP PV Certification Study Guide
Refer to the module and mounting system manufacturer installation instructions for permissible attachment methods and clamping zones with consideration for the module loading capacity for that specific attachment method and position of attachment device. The installation location may constrain which methods are permissible.
Some mounting systems use the module frame rather than external rails (rail-free, rail-less, etc). Manufacturers of this type of mounting system will typically mechanically test or evaluate each module frame series with a nationally recognized testing laboratory (NRTL) to determine suitability when listing to UL 2703. Reference the mounting system manufacturers UL 2703 listing and for the list of approved PV modules prior to design and installation. Installation should carefully follow the manufacturer’s installation instructions for proper use of the product and to ensure compliance with the applicable codes and standards.
When clamps are used to fasten PV modules to the mounting system, it is important to install the proper clamps for the specific modules used, and torque to the proper values so the clamps are secured without crushing the module frame. Using an impact driver is never appropriate for metal to metal connections as it will foften exceed the allowable torque specified in mounting system installation instructions. Fasteners with damaged threads should be discarded as the torque readings are meaningless with thread damage.
For mounting systems that use adhesive attachment of the PV module to the mounting surface, the adhesive must be compatible with both the mounting surface and the PV module. Consult with the roofing material manufacturer to verify the adhesive is compatible with that roof material type. Consideration should also be given to the impact of thermal expansion and contraction of the PV module vs the mounting surface. Heat transmission of the PV module to the mounting surface should be evaluated to ensure the mounting surface can tolerate the temperature extremes of the system. The freeze/thaw forces of water can become a structural problem for adhered modules if moisture can get between adhered surfaces. Residual moisture can lead to biological growth which can lead to premature roof degradation.
When using ballasted mounting systems, pathways to roof drains should not be blocked. Water ponding can cause excessive roof loading and lead to premature roofing degradation. Consult with the roofing manufacturer for information on protection of the membrane when using ballasted mounting systems. Sacrificial slip sheets may be needed to protect the roof membrane where the mounting system touches the membrane.
When using ballasted mounting systems, it may be advisable to include structural attachments to the roof to reduce movement of the mounting system. A structural design professional should consulted to determine the need for mechanical attachments.
When mounting module level power electronics (MLPE), transition boxes, or other equipment to the mounting system or modules, secure the equipment per the manufacturer’s installation instructions. When mounting to the PV module frame, it is often best to locate the device near the corner of the PV module where it is strongest. It is also advisable to avoid obstructing the PV module junction box to preserve the heat dissipation characteristic of the junction box. Exposed metal of energized components generally must be bonded to one another and connected to the equipment grounding conductor with an approved method.
PV Installation • 115 NABCEP PV Certification Study Guide Copyright © 2019 NABCEP v.8
The best way to achieve this result is to use a mounting listed to UL 2703 for bonding and grounding.
Cable management should be installed to last the life of the array. Where metal clips are used, the devices should have sufficient retention strength to ensure the wire is retained by the clip and the clip should remain secure to the module or mounting system. Follow manufacturer's installation instructions to ensure cable insertion and extraction forces will not damage the module or mounting equipment. Where using straps for wire retention, the strap should be selected with 20+ year life expectancy. Inexpensive unlisted plastic zip-ties are not suitable for more than 1-5 years of reliable service life. Nylon 6 wire ties work well connected to aluminum whereas Nylon 12 should be used in contact with galvanized steel. Newer compounds may outperform some of the Nylon compounds.
Wiring methods specifically called out in the NEC have support and securement requirements. Spacing between cable management devices is discussed for PV wire in 690.31. Cabling systems listed with specific equipment, such as microinverters, will include support and securement requirements specific to the application. Quality installation practices and safety considerations dictate using a sufficient number of cable clips/straps to ensure that cables are properly supported and do not have excessive slack. Care should also be taken to prevent conductors from being installed too tightly which may not account for thermal
The Industry Standard in Solar Roof Mounts
Works With AllRoof Types
Fast, SimpleInstallation
SuperiorWaterproofing
www.quickmountpv.com | 925.478.8269
Congratulations on 15 years of promoting
solar excellence! Renova is proud
to have been the first NABCEP-accredited
company.

116 • PV Installation Copyright © 2019 NABCEP v.8 NABCEP PV Certification Study Guide
expansion and contraction of the cables. Since most PV systems are installed during warmer weather, contraction is cold weather has been known to damage cables and connections. The minimum bend radius called out in the NEC or specified by the cable manufacturer must also be observed.
Although PV modules are designed to withstand environmental extremes for many years, they can be damaged if improperly stored, handled, or installed. Some modules are more durable than others, but care should be taken to ensure that the module back-sheets are not scratched or damaged. Unframed laminates are particularly susceptible to edge damage and require significantly more care in handling. Small chips or nicks in the glass edge result in high stress points that become cracks that destroy the module. Excessive deflection of the module glass can cause micro-cracking of the PV cells, resulting in poor performance and even module failure. Walking or kneeling on modules, or placing heavy loads on modules should be avoided to minimize the potential of cell and module damage.
Care in handling, transporting, storing, and installing PV modules includes the following:• Leave modules in packaging until they are to be installed.• Carry modules with both hands, do not use PV cables or connectors as a handle.• Do not stand modules on hard ground or on their corners.• Do not place modules on top of each other or stand on them.• Do not use marker on the backsheet or expose the backsheet to sharp objects.• Keep all electrical contacts clean and dry.• Do not install modules in high winds.• Carrying a module up a ladder by hand is not permissible by OSHA safety standards.
General safety precautions for installing PV modules include the following:• Use appropriate safety equipment (insulated tools/gloves, fall protection, hardhats, etc.)• Never disconnect or connect non-load break connectors under load, or if dirty or wet• Never use damaged modules• Whenever performing service on PV modules, follow the module and mounting system
manufacturer’s installation instructions for the proper procedure.• Do not remove any listing label applied by the manufacturer• Never treat the rear of the laminate with paint, adhesives or mark it using sharp objects• Do not artificially concentrate sunlight on flat plate modules

System Commissioning • 117 NABCEP PV Certification Study Guide Copyright © 2019 NABCEP v.8
3. System CommissioningOnce PV systems are installed, they are inspected, tested, and commissioned to verify the installation matches the design and applicable code requirements, and to verify that performance expectations are met.
3.1 Commission the SystemCommissioning of PV systems follows similar requirements to any electrical installation, involving visual observations, testing, and measurements to verify the safety and quality of the installation in accordance with project-specific requirements and applicable codes and standards (national and international), and to verify the proper operation and performance of the system.
3.1.1 Review or Develop Commissioning Protocol Task 1A standard protocol or procedure is required to ensure that the system is verified against applicable codes and standards, and is operating correctly. Commissioning documentation must either be developed or existing documentation must be reviewed — and often customized. The commissioning protocol and documents is the checklist that is used when undertaking the inspection and testing of the system.
Applicable Codes and StandardsThe commissioning protocol must identify applicable codes and standards, including but not limited to:• NFPA 70 (National Fire Protection Association) National Electrical Code and in
particular those Articles relevant to the solar industry: 690, 691, 705, 706, 710, and, in some projects, 712.
• NFPA 70E Standard for Electrical Safety in the Workplace.• IEC 62446-1 Grid connected photovoltaic systems – Minimum requirements for system
documentation, commissioning tests and inspection. This standard provides a framework for system commissioning that is widely accepted in the solar industry.
System-specific RequirementsIn preparation for undertaking a commissioning of a particular system the protocol must be updated to include any particular requirements for that installation, which could include:• Local AHJ (authority having jurisdiction) requirements.• Manufacturer-specific requirements.• Specific project and contract requirements.• PPE (personal protective equipment) requirements.• Testing tools, equipment, and procedures to be used.• Reporting and documentation requirements.
Outline of ProtocolKey steps of a commissioning protocol include:• Ensuring a safe workplace and documenting personal protective equipment (PPE)
requirements.• Verifying final installation details.
118 • System Commissioning Copyright © 2019 NABCEP v.8 NABCEP PV Certification Study Guide
• Completing a system checkout and visual inspection of mechanical and electrical systems.• Verifying proper termination torque of mechanical and electrical connections.• Performing electrical and mechanical tests on the system.• Performing initial start-up and operational tests.• Verifying expected output and performance.• Demonstrating and verifying shutdown and emergency procedures.• Completing system documentation, including an as-built planset.• Conducting user training and orientation.
SafetyCommissioning requires working on energized equipment and circuits. Shock and arc-flash hazards will be present. In addition to the usual construction site personal protective equipment such as eye protection, appropriate footwear, hard-hats, and safety vests, additional PPE may also include insulated gloves, face-shields, ear plugs, and arc-rated clothing. Furthermore, some locations may require the use of personal fall arrest systems or other forms of fall protection. Prior to conducting any commissioning work:• Verify disconnects are open and lockout/tagout (LOTO) procedures are in place.• Identify any workplace hazards such as arc-flash, fall hazards, etc.• Mitigate any workplace safety hazards.• Select the appropriate PPE.
Inspection ChecklistA final visual and mechanical inspection confirms that the installation is complete before beginning operations. The commissioning inspection checklist must include all the key codes, standards, and project-specific requirements, which are then verified by the person undertaking the inspection. This is then a record that the system has been installed correctly and details whether the system is compliant or non-compliant with specific requirements. In addition to this inspection, the overall commissioning will include testing of the system which is detailed in Section 3.2. The inspection checklist could be many pages, and should include, but is not limited to, the following activities:• Verify at the start of commissioning that disconnects (dc and ac) are open and lockout/
tagout procedures are in place.• Visually inspect all components and connections (structural, mechanical, and electrical).• Verify appropriate sizes and ratings for major components and balance-of-systems equipment.• Verify conductor and overcurrent device sizes and ratings.• Verify disconnecting means. • Verify wiring methods and connectors.• Verify equipment and system grounding.• Verify proper bonding. • Verify connections to other sources.• Verify battery and charge controller installation if part of the system.• Verify terminal torque specifications. • Verify that all equipment and the overall installation is completed in a workmanlike
manner in compliance with all applicable codes.• Verify consistency of overall installation with system design and code and standard
compliance.

System Commissioning • 119 NABCEP PV Certification Study Guide Copyright © 2019 NABCEP v.8
• Verify appropriate equipment listings and labeling, intended for the conditions of use, and installed in accordance with instructions.
• Identify and complete any unresolved items.
Electrical Testing ChecklistMany of the electrical tests performed during commissioning are the same from one system to the next, but there may also be specific tests required by contractual obligation, the AHJ, or the utility. The checklists for electrical testing will need to be customized for each individual project, and provide the means for capturing the data during testing. See Section 3.2.2 for more details.
Tools and Test EquipmentA list of all the test equipment required should be developed, and all equipment should be checked for operational integrity prior to beginning work. Other tools such as torque wrenches and screwdrivers and standard hand tools will be required. Follow manufacturer and contractual requirements for calibration of meters and torque tools. Test equipment that could be used in commissioning a solar system include:• Digital multimeter• Clamp-on ammeter• Irradiation (sunlight intensity) meter• Infrared temperature sensor / gun or thermocouple• Torque tools (wrench(es) and screwdriver)• Insulation resistance tester (megohmmeter)• Thermal imaging (IR) camera or scanner• I-V curve tracer• Hydrometer (for flooded lead acid batteries)• Other solar-specific commissioning / test tools
3.1.2 Visual and Mechanical Inspection Task 2A visual and mechanical inspection is performed as part of commissioning to verify and ensure that the system is in satisfactory condition for use, and that it conforms to the electrical and mechanical design, as well as applicable codes and standards laid out in the commissioning protocol. During the visual and mechanical inspection, the inspection checklist is completed and any compliance issues are identified and, if possible, rectified.
Conformity to Electrical DesignDepending on the nature of the project, the electrical engineer, system designer, or a third-party may conduct a field review to verify the system is installed per the electrical design, or it may be the responsibility of the contractor to do so. This will usually require the preparation of as-built or record drawings that reflect the actual electrical installation (noting any deviations or changes from the original plans). The verification will include:• The physical location and installation method of electrical equipment and wiring.• The rating of electrical equipment and wiring.• The functional location of electrical equipment (i.e. between specific components, in
series or parallel, etc.).

120 • System Commissioning Copyright © 2019 NABCEP v.8 NABCEP PV Certification Study Guide
Adherence to Codes, Standards, and AHJ and Utility RequirementsIn addition to verifying the installed system matches the design, the inspection is also the time to verify that the installation meets applicable codes and standards, including:• Verification of appropriate equipment listings and labeling (must be intended for the
conditions of use and installed in accordance with their instructions).• Verification of appropriate sizes and ratings for major components and balance-of-
systems equipment.• Verification of proper grounding and bonding methods.• Verification that all equipment and the overall installation is completed in a workmanlike
manner in compliance with all applicable codes and standards.One key aspect of this visual inspection is ensuring that all the signs, labels, and directories are correctly installed. These are important not just for meeting code requirements but for the end user and future service personnel.
Numerous markings, labels and signs are required to identify PV systems and their components, and to warn operators, service personnel, or emergency responders of hazardous conditions. Manufacturer markings and labels identify the size, type, specifications, and ratings for PV modules, inverters, controllers, combiner boxes, conductors, raceways, overcurrent devices, switchgear, and all other electrical components. These markings are placed on the product at the time of manufacture, and include listing marks from the testing laboratory, such as UL. Code officials may verify these markings during final inspections, and use them for the basis of their approval.
Additional markings and labels are required for the overall system and certain components, and are to be provided and placed by the installer. These include additional labels on conductors, enclosures, conduits, disconnecting means, and at the point of utility connection.
Conformity to Mechanical DesignVisual confirmation of the mechanical design varies depending on whether the system is ground- or roof-mounted, and includes verifying:• The location of attachments, piles, footings, or ballast.• The quantity and dimensions of piles, footings, or ballast.• The assembly of structural members match the design drawings.• The quantity and method of attachment to the structure.• The location of expansion joints.• Proper flashing and/or waterproofing methods.• Access and pathways for installation, maintenance, and fire codes.• The size of inlet and outlet vents used for lead acid battery storage (for appropriate ventilation).
3.2 Testing the System Tasks 3 & 4Testing PV systems requires qualified persons with knowledge of electrical system measurements, the test equipment used, and the specifications and characteristics of the equipment or systems under test. PV systems should be thoroughly tested at the time of commissioning and periodically over the system life to ensure proper and safe operation. The key tests will be either included within the commissioning protocol, could be provided

System Commissioning • 121 NABCEP PV Certification Study Guide Copyright © 2019 NABCEP v.8
as a separate testing sheet, or could be combination of standard protocol tests combined with project-specific requirements. Measured values for voltages, currents, insulation resistance must be recorded to verify proper installation and operation, as well as to establish a baseline for future comparison.
3.2.1 Conduct Mechanical Tests Task 3Generally commissioning and testing is undertaken on site, however for some projects testing of components can be undertaken at the factory of manufacturer. For mechanical systems this could include: • Wind or snow loading of module. • Structural strength testing for array structure components.
Field mechanical tests may include:• Soil testing for arrays using screwed or driven piles.• Concrete slump test for any foundations.• Torque testing to the manufacturer’s specification for mounting structures and module
attachments, wire terminations, and battery terminals.
Depending on the scale and scope of a project, mechanical tests may be the responsibility of sub-contractors, engineers, or the prime contractor. Soil testing, for example, must be carried out by a specialist, such as a Geotechnical Engineer, as part of their field review. Concrete testing is usually specified by the structural engineer and is conducted during the installation process.
Torque settings are tested using a suitable, calibrated torque tool set to the equipment manufacturer’s specification, and should be performed on mechanical (racking) and electrical connections. Results of field tests are either recorded in the commissioning documentation as actual results (e.g torque values), or else as a “√” or “YES” when the installation is compliant and an “X” or “NO” when it is not compliant.
For other equipment, simply pulling/shaking it can verify that it is securely mounted. Additional testing for mechanical integrity includes:• Verifying all sections of the array structure are securely connected.• Verifying all modules are firmly mounted on the array structures.• Verifying all balance-of-system equipment is securely mounted.
3.2.2 Conduct Electrical Tests Task 4All PV arrays should be tested in accordance to the requirements of the international standard IEC 62446-1: Grid connected photovoltaic systems – Minimum requirements for system documentation, commissioning tests and inspection. Other electrical components and subsystems should be tested in accordance with ANSI/NETA ATS-2017: Standard for Acceptance Testing Specifications for Electrical Power Equipment and Systems. In addition, all equipment, including components not covered in the above referenced documents, must be tested in accordance with manufacturer’s requirements or any other relevant codes and standards. Note that specific tests, meters, and methodologies may be a contractual obligation.

122 • System Commissioning Copyright © 2019 NABCEP v.8 NABCEP PV Certification Study Guide
Testing PV systems should only be performed by qualified personnel. Prior to conducting any testing identify all safety hazards; mitigate the hazards; select the appropriate PPE; and ensure that all tools and meters are properly rated for the system voltage and current.
The pre-operational electrical tests that should be undertaken and recorded include:• Continuity of grounding and bonding.• AC circuit voltage and phasing.• Insulation resistance for PV array source and output circuits.• PV circuit open-circuit voltage and polarity.• PV source circuit short circuit current.• Other tests for systems with energy storage: • Voltage and polarity between solar controller and battery banks. • Voltage and polarity between battery bank and inverters. • Battery voltage (individual cells and battery banks). • Specific gravity of flooded lead acid batteries.
Continuity of Grounding and BondingA low resistance path for fault current is critical to ensure the operation of overcurrent and ground-fault protection devices. There is no prescribed value for bonding resistance but as a general guide, 50 V is identified as a hazardous voltage. So long as the resistance in the bonding system is below 50 V/ Io-c then the resistance is sufficiently low to prevent hazardous voltage before a fault clears. For example, if the overcurrent device on a circuit is 30 A, the measured resistance for the bonding of that circuit should be less than 1.67 Ohm (50 V / 30 A = 1.67 Ω).
Also verify a low-resistance connection from the equipment grounding system to the grounding electrode system.
Low resistance ohmmeters or specialty solar commissioning tools are available to perform this test. Extra-long test leads may be required to verify continuity between sections of racking.
Remember that if the ac and/or dc system is connected to ground, this should only happen at a single location (e.g. the main bonding jumper between neutral and ground in an ac service panel, or the ground-fault protection device in an isolated, transformer-based inverter).
Test ac Circuit Voltage and PhasingSome inverters are capable of being connected to several different ac voltages (e.g. 208, 240, or 277); some of these may need to be programmed or may do this automatically. Either way, the ac voltage needs to be verified and recorded. Additionally, some inverters sense phasing in three-phase systems, while others must be connected in a particular order, requiring the use of a phase rotation meter to ensure it is correctly wired.
Testing ac circuits should include:• Testing for continuity, phasing, and voltage.• Testing for voltage drop.
System Commissioning • 123 NABCEP PV Certification Study Guide Copyright © 2019 NABCEP v.8
Insulation Resistance TestingInsulation resistance testing involves using a megohmmeter to measure the resistance from ungrounded conductors to ground, and is used to verify and demonstrate integrity of wiring systems. These tests can be used to identify damage or insulation faults in PV modules and interconnect wiring, to locate ground faults, or to assess the degradation of array wiring, PV modules, and other system components.
Insulation resistance for large PV arrays is generally measured at PV source circuit combiners, where the individual source circuits can be accessed for disconnection and testing, or entire combiner boxes of PV circuits are tested at the same time, and compared to the results from other similar combiners.
Testing should also be performed on PV output and inverter output circuit conductors to verify the integrity of the insulation in those circuits. Note: grounded conductors must be ungrounded before performing insulation resistance testing.
Insulation tests on circuits containing PV modules may be performed using either of the following two methods: 1. Between the positive dc conductor and ground, and between the negative dc conductor
and ground. 2. Between the shorted positive and negative dc conductors and ground. This requires an
appropriate shorting device rated for the circuit current and voltage. See the section on testing short circuit current for precautions while short circuiting a PV circuit.
The grounding connection is made to metallic module frames or support structures, the building grounding electrode systems, or directly to earth. For systems not bonded to ground, the tests should be carried out between array conductors and the equipment grounding system, and also between array conductors and frame/rack structures.
Performing insulation resistance testing presents a potential electric shock hazard, it is important to fully understand the procedure before starting any work. It is recommended that the following safety measures are followed: • Use insulated gloves with leather protectors. • Protect the test area and equipment from access by unauthorized persons. • Isolate circuits for testing and use LOTO. Note: grounded conductors must be
ungrounded for testing.• Grounded test lead should always be first to make, and last to break.• Never conduct insulation tests in an explosive environment or around combustible
materials. • Never conduct insulation tests on circuits with electronic equipment, including inverters,
charge controllers, instrumentation, or surge suppression equipment.• Never conduct insulation tests on batteries or other energy storage systems. • Ensure that circuits are properly discharged before and after insulation tests, either
through the test equipment or externally with a load resistor.

124 • System Commissioning Copyright © 2019 NABCEP v.8 NABCEP PV Certification Study Guide
PV Circuit Open-circuit Voltage and PolarityPrior to connecting PV source circuits in parallel (before installing source circuit fuses) and before closing the PV array dc disconnects, the open-circuit voltage (Voc) for each PV source circuit should be tested and compared with expectations. This test can also be used to verify proper polarity. These tests simply verify correct installation, and are not intended to verify performance. Open-circuit voltage tests require a suitable voltmeter capable of reading dc voltages of 600 V to 1,500 V, depending on system configuration, and proper PPE.
Measured voltage will differ from the nameplate value based on cell temperature; use an infrared temperature gun and calculate an expected voltage based on the module STC Voc, the number of modules in series, the module temperature coefficient of Voc, and the measured temperature at the time of the test. Some solar-specific commissioning tools can calculate an expected value based on a temperature sensor input at the same time that Voc is measured.
Typical pass/fail values for Voc are ±5% from the expected value, assuming stable irradiance (note that Voc can vary considerably at irradiance less than 350 W/m2), although a tighter range may be stipulated in contracts or may simply be preferable, perhaps to detect diodes that may have failed closed.
While measuring and recording Voc, polarity can simultaneously be verified. If conductor polarity is reversed in a multi-circuit combiner, circuits end up connected in series rather than parallel and this will result in excessive voltages that may exceed the rating of connected equipment.
TEST METHODMAXIMUM SYSTEM
VOLTAGE [V]TEST VOLTAGE [V]
MINIMUM INSULATION RESISTANCE [MΩ]
Test Method 1
(unshorted)
< 120 250 0.5
120 – 500 500 1
> 500 1000 1
Test Method 2
(shorted)
< 120 250 0.5
120 – 500 500 1
> 500 1000 1
Table 3 IEC 62446-1 Insulation Test Criteria (Pass/Fail) for PV Source Circuits
NOMINAL RATING OF EQUIPMENT (VOLTS)
RECOMMENDED MINIMUM INSULATION RESISTANCE (MΩ)
250 25
600 100
1,000 100Table 4 ANSI/NETA ATS Table 100.1 Recommended Minimum Insulation Resistance (for Circuits Without PV Modules)

System Commissioning • 125 NABCEP PV Certification Study Guide Copyright © 2019 NABCEP v.8
On larger systems, with PV output circuits, voltage and polarity testing is performed at recombiners / sub-combiners, after it has been verified at the source circuit level, series fuses have been installed, and dc disconnects closed.
PV Source Circuit Short-Circuit CurrentShort-circuit current tests are conducted on PV source circuits to verify proper array configuration and that the circuits are clear from major faults (this is typically not done on higher current PV output circuits). As with open-circuit voltage tests, these tests are only intended to verify proper system operation, not performance. Suitable test equipment, capable of safely short-circuiting high-voltage dc circuits is required. Many digital multi-meters can measure dc current up to 10 A, but require a suitable shorting device to safely measure the current: do not simply short out a solar array with the meter leads, as this will create an arc and may damage the terminals to which the leads are connected. Clamp-on ammeters are also available for dc current measurements, but they also require an external shorting device. There are solar-specific commissioning tools that are capable of shorting PV source circuits and performing this test.
It is usually necessary to disconnect and re-connect PV source circuits through a circuit breaker or switch in order to safely short and measure the circuits. It is important to ensure circuits are de-energized before disconnecting and reconnecting them and to ensure that, when shorting a particular source circuit, all parallel source circuits are disconnected. Quick connects are not intended to operate under load and should not be used to short a solar array.
Short circuit current is directly proportional to the irradiance in the plane of the array. Short circuit current of multiple PV source circuits must be measured quickly, under steady, clear sky conditions at as close to the same irradiance level as possible. Make sure the array is not shaded or particularly soiled prior to testing. Short-circuit current readings of identical parallel strings, taken under steady conditions, should be within at least 5% of one another for acceptance. If irradiance measurements are made simultaneously with short-circuit current measurements, the measured Isc can be compared to the STC Isc adjusted for irradiance [Measured Isc ≈ STC Isc x (Measured Irradiance / 1000)].
3.2.3 Startup and System Verification Tests Task 5The initial startup for a PV system is conducted after all inspections and checks have been completed with all outstanding items resolved. All system components should be started in accordance with the manufacturers start-up procedure. Typical startup procedures include:• Installing overcurrent devices.• Closing all dc and ac disconnects and turning on the inverter(s).• Verifying system output.
The key indicators for system performance of grid-interactive PV systems are ac power output (kW) and energy production (kWh). Measurement and verification of ac power output can be performed at any time, but ideally the system is operating under steady sunlight conditions near peak output (but not power clipping). Energy production must be measured over time and either compared with modelling expectations or, ideally, actual solar resource data collected from the site.
126 • System Commissioning Copyright © 2019 NABCEP v.8 NABCEP PV Certification Study Guide
Power Performance VerificationOne method of verifying performance is to compare the ac power output of a grid-interactive PV system to the rated nameplate (STC) dc power of the array adjusted for a number of system derating factors. These system derating factors account for various losses on both the dc and ac side of the system, including inverter efficiency, module mismatch, voltage drop, and more. Total losses typically result in ac power output of about 70 to 85 percent of the PV array dc rating at Standard Test Conditions. Determination of losses and calculation of expected ac power and energy output are part of the System Design process. Once the losses are accounted for, the actual instantaneous ac output of an interactive PV system can be compared with measured output by applying the following data:• PV array STC dc watts.• Product of system derating factors.• Irradiance factor (Plane of array irradiance / 1,000).• Temperature factor (correction for change in array power based on PV cell temperature
and temperature coefficient of maximum power per the PV module manufacturer).• Ac output power (read from inverter or DAS, or computed from ac output current and
voltage).
Deviations of 5% or more should be investigated. Double check derating factors, equipment specifications, and field measurements – irradiance in particular can change quickly and lead to bad test results.
Dc Current TestingTesting dc operating current (Imp) is a valuable way to ensure each PV circuit is operating correctly. As long as the inverter is not power clipping, all homogenous PV circuits (same make/model of module, orientation, and tilt angle) should be providing the same amount of current. Imp values measured from one like string to the next can be compared to each other, and with a corresponding plane of array irradiance measurement, the measured current can also be compared to the STC value. Other TestsDepending on the project, other startup and performance verification tests may include:• I-V curve tracing• MPP tracking verification• Inverter efficiency measurement• Power quality measurement• Thermal imaging
3.2.4 Functional TestsFunctional tests (sometimes referred to as witness tests) verify that equipment operates as intended both under normal operation and during a loss of utility power (loss of mains). Functional tests include:• Switchgear and other control equipment shall be tested to ensure correct operation.• All inverters PV system must be tested to ensure correct operation. The test procedure is
defined by the inverter manufacturer and may include arc-fault testing and verification of other protective functions.

System Commissioning • 127 NABCEP PV Certification Study Guide Copyright © 2019 NABCEP v.8
• A loss of mains test must be performed: With the system operating, open the main ac disconnect – it should be observed (e.g. on a display meter) that the PV system immediately ceases to generate. Following this, the ac disconnect should be re-closed and it should be observed that the system reverts to normal operation (perhaps after a five-minute delay in reconnection). Verify that interactive inverters and ac modules de-energize their output upon loss
of grid voltage. This is a safety requirement to prevent interactive inverters from operating as an islanded electrical system without voltage or frequency control, and preventing them back feeding de-energized electrical systems. These functions are performed internally by all utility-interactive inverters listed according to the IEEE 1547, CSA 22.1 107.1, and UL1741 standards.
Verify that interactive inverters automatically reconnect to their output to the grid once the voltage has been restored for at least 5 minutes.
In addition, some systems require additional functional tests, such as verifying:• Correct operation of other protective and safety functionality such as rapid shutdown
devices.• Correct operation of monitoring or data acquisition systems (DAS) and associated
sensors and communications equipment.• That all single-phase inverters, if required by the interconnection agreement, shutdown
upon loss of any single phase. Otherwise, only the inverters connected to the open phase must cease to energize the open phase.
• That battery-based interactive inverters disconnect from the utility source when operating in stand-alone or island mode.
3.3 Confirm Project Completion Task 6Confirming project completion involves finalizing all documentation in the commissioning protocol; demobilizing the installation and testing staff; finalizing any contractual requirements and handing over the system to the owner; and completing all accounting requirements. How detailed these activities will be depends on the size of the installation and the project specific requirements.
Regardless of size the PV system, adequate documentation for PV systems is an essential part of the completion process, and helps ensure safe and reliable operation over decades of operation. A list of minimum system documentation requirements can be found in IEC 62446-1.
Complete documentation is particularly important for safety concerns, routine maintenance, later modifications, and for systems having a change in ownership or those responsible for operating and maintaining the system. In most jurisdictions, system documentation is required by the building officials for the plan review and permitting process, and also for interconnection approval from the local utility. In some cases, incentive programs may require additional documentation, such as a shading analysis and system performance estimates. Final system documents should always be provided to the owners and caretakers and should be accessible at the system site for future reference. The installation contractor should also keep a copy of the system modifications, for systems having a change in ownership, and for those responsible for operating and maintaining the system.

128 • System Commissioning Copyright © 2019 NABCEP v.8 NABCEP PV Certification Study Guide
A complete system documentation package is a well-organized collection of all relevant documents depicting the as-built system design, major components, and relevant information on safety, operations, and maintenance. While the details may vary with the size and scope of specific projects, key components of a final PV system documentation package should include the following:• General information should include
the system dc and ac power ratings; the manufacturer, model and quantity of PV modules, inverters, batteries, controllers, and all other major components, as applicable. The dates of the system installation, commissioning and inspection should also be noted.
• Contact information should include the names, postal addresses, phone numbers, and email addresses for the customer/owner, system designer, installation contractor, and any other responsible parties or subcontractors.
• A site layout drawing is often required by local jurisdictions for permitting purposes, and to identify equipment locations on buildings or relative to property lines or easements. In some cases, a shading analysis and performance estimates may be provided with project proposals, and should also be including with the final system documents.
• A single line diagram should be provided depicting the overall system design, including the types of modules, total number of modules, modules per string and total number of strings; the types and number of inverters; and any other major components. For larger projects, complete as-built electrical and mechanical drawings are usually required.
• The types, sizes and ratings for all balance-of-system components should also be an- notated on the single line diagram, or noted and provided in a separate table,
THE LONGEST LASTING BATTERY
FOR YOUR OFF-GRID HOME.
ROLLSBATTERY.COM
THAT’S WHAT WEGIVE THEM.
OURCUSTOMERS
EXPECT A LOT.
DIAMOND

System Commissioning • 129 NABCEP PV Certification Study Guide Copyright © 2019 NABCEP v.8
including specifications for all conductors, raceways, junction boxes, source circuit combiner boxes, disconnects, overcurrent protection devices, and grounding equipment, as applicable.
• Data sheets and specifications should be provided for PV modules, inverters, and other major components, including module mounting systems. For most products, installation and user/operator manuals are available and provide important information regarding the safe operation and maintenance of the equipment.
• Operation and maintenance (O&M) information should include procedures for verifying proper system operation and performance, and how to determine if there is a problem and what to do. Procedures for isolating/disconnecting equipment and emergency shutdown procedures should also be provided. A maintenance plan and intervals should be provided for all routine (scheduled) system maintenance, such as array cleaning as required. Operating and maintenance guidelines should differentiate what tasks can be performed by the owner or caretakers, from those that require professional service due to the complexity of the tasks, special equipment needs, or safety concerns. Maintenance agreements, plans, and recordkeeping forms or sheets should also be provided to document maintenance activities over time.
• Warranty details on major components should be clearly identified, indicating the terms and conditions, and how the warranty process is handled, and by whom. System warranties should also be addressed, including quality of workmanship, roof weather sealing, or performance warranties as applicable.
• Copies of all commissioning test reports and verification data shall be provided as applicable.• Contracting and financial details are also an important part of system documentation,
and may be included with the technical items discussed above or under a separate file. These documents should include construction contracts, invoices and payments for materials and labor, building permits, inspection certificates, interconnection agreements, and applications and approvals from incentive programs, such as rebates and tax forms.
Completing the documentation helps confirm that the system has been installed in accordance with all the project contractual requirements and that all permits have been completed. Detailed documentation is required when handing the system over the end-user and obtaining their sign-off that the system is accepted. This will allow the finalization of all the accounting pf the project including preparing finals bills and requesting final payments.
3.4 Orient End User to System Task 7The system documentation should include a detailed system manual which is used to help inform the end-user about the system and to train them on its operation, safety features, and maintenance requirements. The training shall include:• Showing the location and explaining the operation of all the components of the system.• Showing how to safely start up and shutdown the system.• Explaining and showing what to do in an emergency.• Describing the overall system design and expected performance.• Explaining how the system can be monitored, and in particular what are the key
parameters that indicate the system is operating correctly.• Warranty documentation terms and coverage.• Details on maintenance requirements and schedules.• Explaining who to contact if they have any problems.

130 • System Commissioning Copyright © 2019 NABCEP v.8 NABCEP PV Certification Study Guide
OPERATIONS AND MAINTENANCE (O&M)PV systems require periodic maintenance to ensure safe and reliable operations over the long-term, and to maximize performance. Although most PV systems usually require little maintenance, a maintenance plan ensures that essential service is performed on a regular schedule. Preventive maintenance helps identify and avoid potential problems that affect system functions, performance, or safety. When problems do occur, a systematic troubleshooting process is used to diagnose and identify the problems, and take corrective actions.
All PV systems require some maintenance. A maintenance plan includes a list and schedule for all required system maintenance and service, such as:• Inspections of components and wiring systems• Evaluation of structural attachments and weathersealing• Cleaning and removing debris around arrays• Performing battery maintenance• Conducting electrical tests and verifying performance• Replacement of damaged or failed system components
7.1 Verify System Operations and Performance Task 1 Safety First and Lock-Out Tag-Out: Ensure that the system can be disconnected and shut down safely and that it starts properly. Use Lock-Out Tag-Out (LOTO) procedures that are specific to your site and equipment. LOTO of PV systems involves identifying both dc and ac power sources and isolating them, removing fuses and turning off breakers. Knowledge of the specific equipment used and the product installation and operation instructions are crucial to verifying their safe and proper operation. When testing system performance on an
energized circuit be sure to wear electrical safety gloves and use insulated tools.
Performance data can be used to verify output expectations and identify problems that require service or maintenance. See Fig. 101. Most inverters and charge controllers provide some indication of performance and operating status, such as power output or energy production, and fault or error indications. This information is extremely helpful in verifying proper system operation.
For simple interactive PV systems without energy storage, the key indicators for system performance are ac
power output (kW) and ac energy production (kWh). The ac power output for an interactive system is determined by the rated dc power output of the array, the inverter efficiency and systems losses, and is proportional to solar irradiance on the array. Measurement of ac power output is usually given on inverter output displays, or can be recorded over time and accessed remotely. Power measurements may be an instantaneous (snap-shot) measurement, or averaged over a certain interval.
Figure 101. Operating parameters in PV systems are measured to verify expected performance.

System Commissioning • 131 NABCEP PV Certification Study Guide Copyright © 2019 NABCEP v.8
The ac power output of an interactive PV system at any moment can be com- pared with expectations, using the basic translation formulas for solar irradiance and temperature. The ac power output can be read from inverter displays or by additional power meters, and the array temperatures and solar radiation in the plane of the array can be measured with simple handheld meters without working on energized equipment. Power verification can be done any time when the system is operating under steady sunlight conditions, preferably at higher irradiance levels.
Generally, the maximum ac power output for interactive systems can be related to the rated maximum dc power output rating for the array and adjusted by a number of derating factors. The factors include several types of dc and ac system losses and power conversion efficiencies, which in combination result in ac power output varying between 70% to 85% of the PV array dc rating at Standard Test Conditions (STC), depending on temperature.
The ac energy production (kWh) for grid-connected PV systems is measured over periods of months and years to compare with sizing and long-term performance expectations. The ac energy production for grid-connected PV systems with no energy storage can be estimated using popular tools such as PVWATTS. PVWATTS performs an hour-by-hour simulation for a typical year to estimate average power output for each hour and totals energy production for the entire year. PVWATTS uses an overall dc to ac derate factor to determine the rated ac power at STC. Power corrections for PV array operating temperature are per- formed for each hour of the year as PVWATTS reads the meteorological data for the location and computes the performance. A power correction of -0.5%/°C for crystalline silicon PV modules is used.
Actual solar irradiation (insolation) and array temperatures can be used to more precisely compare with the ac energy produced. The average daily ac energy production divided by the product of the PV array dc peak power rating at STC and peak sun hours is a key indicator of system performance:
ac kWh / (dc kWp x PSH) = 0.7 to 0.85(depending on temperature and system losses)
Solar Radiation Measurements
A pyranometer
measures total global
solar irradiance (solar
power). Irradiance
measurements are
used in the field to
translate the actual
output of PV array
and systems to a
reference condition to
verify performance.
Small inexpensive meters using calibrated PV cells as
sensors are available from $150 and up. See Fig. 102. A
small PV module with calibrated short-circuit current can
also be used to approximate solar radiation levels.
Figure 102. Handheld solar meters use a small PV cell to measure solar irradiance.

132 • System Commissioning Copyright © 2019 NABCEP v.8 NABCEP PV Certification Study Guide
The installer must be capable of making a good estimate of the PV array power output based on the system design and environmental conditions. System adjustment factors for module mismatch and dc and ac wire losses vary based upon the actual installation. Another factor that can limit irradiance is soiling on the array. This is particularly a concern in climates in the western U.S. that can go for several months without rain.
Example:How much power should a 4,800 Watt (STC) crystalline silicon array produce when the array temperature is 45°C and the irradiance is 840 W/m2? The inverter efficiency is 95%; module mismatch and the dc and ac wiring losses are 2% and 3% respectively, and soiling is minimal.
System Adjustment Factors:1. Temperature: [1 - (45°C–25°C) x (–0.005/°C)] = 0.902. Irradiance: (IRR ÷ 1000W/m2) = 840 ÷ 1000 = 0.843. Inverter Efficiency: 0.954. Mismatch and dc and ac wire losses: 5% total = 0.955. Soiling: 0% = 1.0
Inverter Output Power = 4800 x (0.9) x (0.84) x (0.95) x (0.95) x (1.0) = 3275 W
STC array rating TemperatureIrradianceInverter Efficiency Mismatch and wiringSoiling
For a utility-interactive system with battery backup, the calculation of expected voltages, currents, and powers is more complicated. The difference between a bat- tery backup system and a system without batteries is that the PV array does not operate at its maximum power voltage unless a MPT charger is used. The battery also requires constant charging to remain fully charged. The output power of the system can be estimated when the system is operating in utility-interactive mode, and if the batteries are fully charged.
Typical maximum power tracking controlled battery-based systems will lose 2% (0.98) for maximum power tracking losses and about 5% (0.95) for additional inverter losses. These systems will operate at about 93% of the same size PV systems without batteries. Battery-based systems without maximum power tracking controllers will lose another 5% to 10% instantaneous power due to operation off the maximum power point. All battery-based systems will lose energy keeping the battery fully charged. This charging can reduce the annual energy production by 2% to 5%. All standby power systems have these battery charging losses.
Watt-hour meters measure electrical power and energy, and are commonly used at electrical service entrances by utility companies for customer billing purposes. Watt-hour meters essentially measure current, voltage and their phase angle to determine ac power and energy. They can be electronic or electro-mechanical types. Advanced electronic types use microprocessors to measure directional and time of use power flows and other electrical properties such as reactive power,
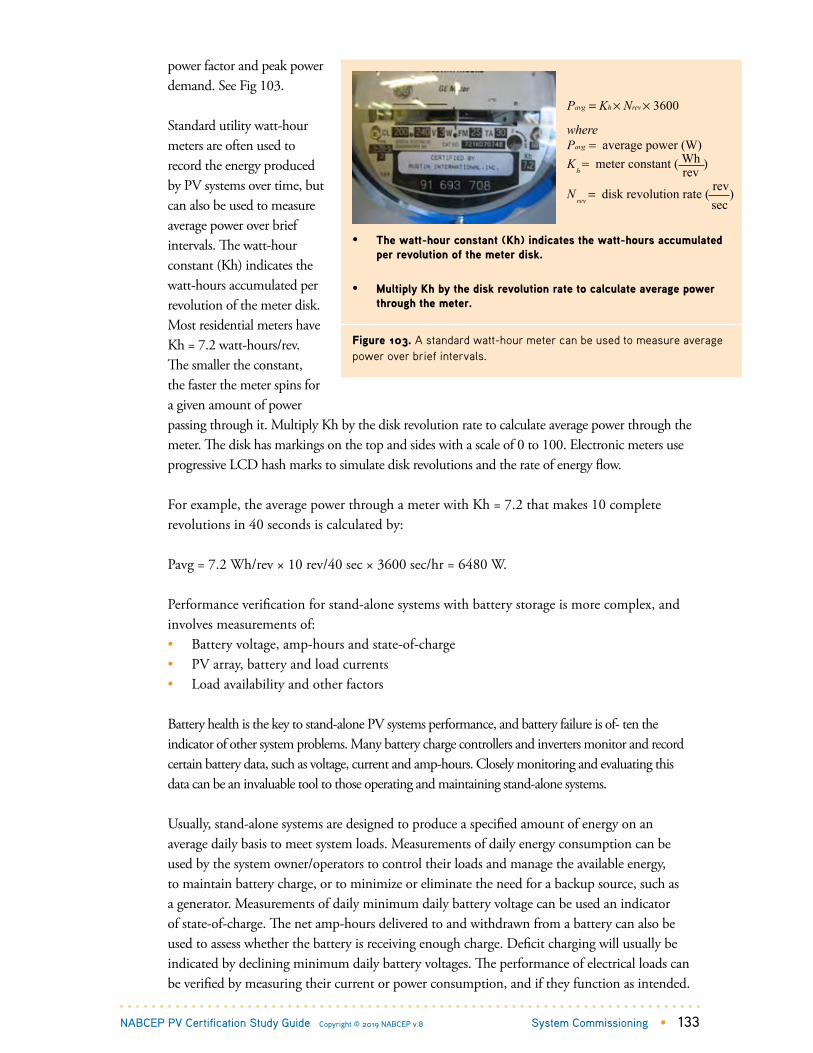
System Commissioning • 133 NABCEP PV Certification Study Guide Copyright © 2019 NABCEP v.8
power factor and peak power demand. See Fig 103.
Standard utility watt-hour meters are often used to record the energy produced by PV systems over time, but can also be used to measure average power over brief intervals. The watt-hour constant (Kh) indicates the watt-hours accumulated per revolution of the meter disk. Most residential meters have Kh = 7.2 watt-hours/rev. The smaller the constant, the faster the meter spins for a given amount of power passing through it. Multiply Kh by the disk revolution rate to calculate average power through the meter. The disk has markings on the top and sides with a scale of 0 to 100. Electronic meters use progressive LCD hash marks to simulate disk revolutions and the rate of energy flow.
For example, the average power through a meter with Kh = 7.2 that makes 10 complete revolutions in 40 seconds is calculated by:
Pavg = 7.2 Wh/rev × 10 rev/40 sec × 3600 sec/hr = 6480 W.
Performance verification for stand-alone systems with battery storage is more complex, and involves measurements of:• Battery voltage, amp-hours and state-of-charge• PV array, battery and load currents• Load availability and other factors
Battery health is the key to stand-alone PV systems performance, and battery failure is of- ten the indicator of other system problems. Many battery charge controllers and inverters monitor and record certain battery data, such as voltage, current and amp-hours. Closely monitoring and evaluating this data can be an invaluable tool to those operating and maintaining stand-alone systems.
Usually, stand-alone systems are designed to produce a specified amount of energy on an average daily basis to meet system loads. Measurements of daily energy consumption can be used by the system owner/operators to control their loads and manage the available energy, to maintain battery charge, or to minimize or eliminate the need for a backup source, such as a generator. Measurements of daily minimum daily battery voltage can be used an indicator of state-of-charge. The net amp-hours delivered to and withdrawn from a battery can also be used to assess whether the battery is receiving enough charge. Deficit charging will usually be indicated by declining minimum daily battery voltages. The performance of electrical loads can be verified by measuring their current or power consumption, and if they function as intended.
Pavg = Kh × Nrev × 3600
wherePavg = average power (W)K = meter constant ( Wh )
h rev
N = disk revolution rate ( rev )secrev
• The watt-hour constant (Kh) indicates the watt-hours accumulated per revolution of the meter disk.
• Multiply Kh by the disk revolution rate to calculate average power through the meter.
Figure 103. A standard watt-hour meter can be used to measure average power over brief intervals.

134 • System Commissioning Copyright © 2019 NABCEP v.8 NABCEP PV Certification Study Guide
With the rise in popularity of Module Level Power Electronics (MLPEs), such as microinverters and power optimizers, it has become increasingly important for technicians to be able to read and interpret human machine interfaces (HMIs).
Courtesy Mastering Green, LLC
Figure 104. Module Operating Data displayed on Microinverter Communications Unit
Inverters display a variety of indicators that aid in problem diagnosis. Aside from its main task of inverting dc to ac power, the inverter is designed to maximize conversion efficiency, track and capture the “maximum power” between the voltage and current at the PV array, monitor and relay errors from the array, and disconnect from the grid. Inverter diagnostics permit enhanced data monitoring and performance analytics to determine if issues exist. Once it is determined that performance is below expectations, additional field tests can be performed to determine if issues such as hot spots and shading, are present. Most of the HMIs for communications units can be accessed remotely.
Seasonal Impacts on System Performance
Rated performance of PV arrays and the balance of systems, including power electronics, have been tested at Standard Test Conditions (STC). Seasonal changes impact power output, in a few critical ways. High tempera-tures decrease voltage output since more electrons are lost in heat dissipation, lowering the MPP. In addition, high temperatures reduce the conversion efficiency of inverters and increase heat loss in wires, which are also rated for particular temperature ranges (See NEC 690.8 for more details on conductor sizing and temperature adders). Both hot and cold temperatures can adversely affect battery performance. Nominal battery performance is typically between 20 and 30 degrees Celsius. Hot temperatures increase the rate of unwanted chemical reactions and electrolyte evaporation, reducing battery life, and cold temperatures reduce chemical reactions.
Standard Test Conditions
Irradiance: 1,000 Watts/Square Meter
Cell Temperature: 25°C Air Mass: 1.5
Figure 105. Inverter Display
Courtesy Mastering Green, LLC

System Commissioning • 135 NABCEP PV Certification Study Guide Copyright © 2019 NABCEP v.8
Site Weather and Climate Data Sources
As with system design, site weather and climate data is critical to performance. Weather data can
be found online at the National Ocean and Atmospheric Administration’s (NOAA) National Weather
Service website, http://www.weather.gov/, and climate data on their Climate Data Online site,
https://www.ncdc.noaa.gov/cdo-web/.
Perform Preventive Maintenance Task 2Visual inspections of the complete system should be performed regularly. Unlike the initial inspection, however, the code compliance aspects of the system do not necessarily need to be evaluated during preventive maintenance, as the equipment would not normally have been changed.
The integrity of the electrical installation must be carefully evaluated for deteriorating effects over time, due to the site conditions, or even for poor quality components or damage for outside influences. Visual inspections and observations are supplemented with electrical tests and measurements to fully verify system integrity and performance.
PV modules should be visually inspected for signs of any physical damage, including bent frames or broken glass. See Fig. 106. Modules with fractured or damaged laminates will eventually admit moisture and develop high leakage currents and should be removed from the array and replaced. Most PV modules use tempered glass, which shatters into small pieces when stressed or impacted. Physical damage may be quite obvious in the case of impacts, but fractured glass in a PV module may not be clearly evident from a distance.
Figure 106. Inspect PV arrays for any signs of physical damage, such as impacts or fractures.
Obvious impact damage
Less obvious fractured glass
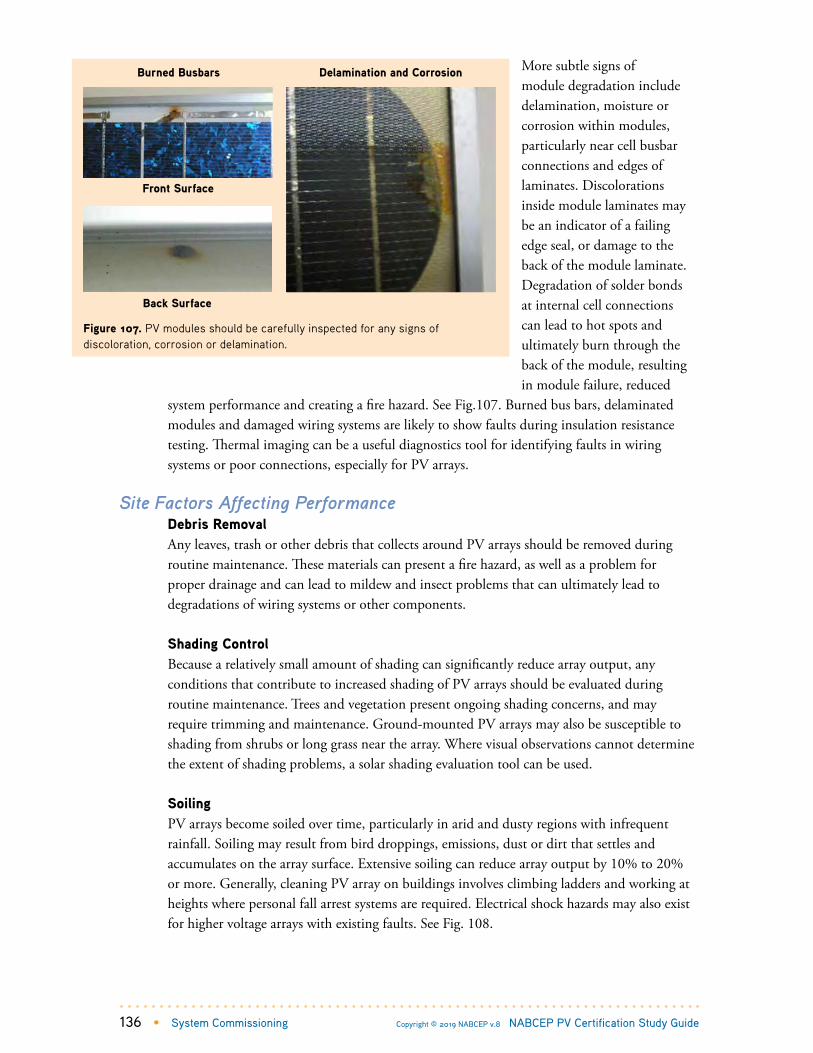
136 • System Commissioning Copyright © 2019 NABCEP v.8 NABCEP PV Certification Study Guide
More subtle signs of module degradation include delamination, moisture or corrosion within modules, particularly near cell busbar connections and edges of laminates. Discolorations inside module laminates may be an indicator of a failing edge seal, or damage to the back of the module laminate. Degradation of solder bonds at internal cell connections can lead to hot spots and ultimately burn through the back of the module, resulting in module failure, reduced
system performance and creating a fire hazard. See Fig.107. Burned bus bars, delaminated modules and damaged wiring systems are likely to show faults during insulation resistance testing. Thermal imaging can be a useful diagnostics tool for identifying faults in wiring systems or poor connections, especially for PV arrays.
Site Factors Affecting PerformanceDebris RemovalAny leaves, trash or other debris that collects around PV arrays should be removed during routine maintenance. These materials can present a fire hazard, as well as a problem for proper drainage and can lead to mildew and insect problems that can ultimately lead to degradations of wiring systems or other components.
Shading ControlBecause a relatively small amount of shading can significantly reduce array output, any conditions that contribute to increased shading of PV arrays should be evaluated during routine maintenance. Trees and vegetation present ongoing shading concerns, and may require trimming and maintenance. Ground-mounted PV arrays may also be susceptible to shading from shrubs or long grass near the array. Where visual observations cannot determine the extent of shading problems, a solar shading evaluation tool can be used.
SoilingPV arrays become soiled over time, particularly in arid and dusty regions with infrequent rainfall. Soiling may result from bird droppings, emissions, dust or dirt that settles and accumulates on the array surface. Extensive soiling can reduce array output by 10% to 20% or more. Generally, cleaning PV array on buildings involves climbing ladders and working at heights where personal fall arrest systems are required. Electrical shock hazards may also exist for higher voltage arrays with existing faults. See Fig. 108.
Back Surface
Delamination and Corrosion
Front Surface
Burned Busbars
Figure 107. PV modules should be carefully inspected for any signs of discoloration, corrosion or delamination.

System Commissioning • 137 NABCEP PV Certification Study Guide Copyright © 2019 NABCEP v.8
Weathersealing and StructuralThe weathersealing of all attachment points and building penetrations should be routinely inspected for signs of deterioration or water leakage, and repairs made as required. All structural attachments should be inspected for security and signs of degradation.
Battery MaintenanceBatteries can be one of the more maintenance-intensive components in a PV system. Regular care and service is important to maximizing battery life, and to mitigate any hazardous conditions. All battery maintenance should be conducted using proper procedures and safety precautions. Battery maintenance includes checking and replenishing electrolyte, cleaning, re-tightening terminals, measuring cell voltages, specific gravity and any other periodic maintenance or testing recommended by the manufacturer.
Battery maintenance involves various tasks depending on the type of battery and manufacturer requirements, including:• Inspecting and cleaning battery racks, cases trays and terminations• Inspecting battery disconnects, overcurrent devices and wiring systems• Checking termination torques• Measuring voltage and specific gravity• Adding water• Inspecting auxiliary systems• Load and capacity testing
Observe all safety precautions and wear appropriate PPE when conducting any battery maintenance. Personal safety precautions for battery maintenance include:• Wearing face shields, aprons and rubber gloves when dealing with electrolytes• Using insulated tools to prevent short circuits• Providing eye wash facilities, water and baking soda for flushing and neutralizing
spilled electrolyte• Providing disconnecting means to isolate battery system• Fire protection equipment
Figure 108. Cleaning soiled PV arrays is a common maintenance need.
Jim TetroSharp Solar
Sharp SolarJim Tetro

138 • System Commissioning Copyright © 2019 NABCEP v.8 NABCEP PV Certification Study Guide
Battery test equipment includes:• DC voltmeters are used to measure battery and cell voltages• DC ammeters (clamp-on type) are used to measure battery currents• Hydrometers are used to measure electrolyte specific gravity• Load testers discharge the battery at high rates for short periods while the voltage drop
is recorded• Impedance and conductance testers may be used on some VRLA batteries
Battery terminals are made of soft lead alloys, and connections may become loose over time. This can lead to increased resistance and voltage drop within the battery bank, re- sulting in unequal charge and discharge currents among individual cells. In severe cases, loose terminals can cause accelerated corrosion, and overheat to a point where the battery post
or cable connection deforms or even melts, creating a fire hazard and destroying the battery. Regular battery maintenance should include checks of all terminals for corrosion and proper torque. Terminals may be coated with petroleum jelly, grease, or special bat- tery terminal corrosion inhibitors to retard corrosion. See Fig. 109.
Specific gravity should be checked for open- vent flooded lead-acid batteries as part of annual maintenance, and may be used to estimate battery state-of-charge. Abnormally low readings may indicate failing or shorted cells.
A fully charged lead-acid cell has a typical specific gravity between 1.26 and 1.28 at room temperature. Specific gravity decreases with increasing electrolyte temperature,and measurements must be corrected to a reference temperature for comparison. Four “points” of specific gravity (0.004) are added for every 5.5°C (10°F) increment above a reference temperature and four points are subtracted for every 5.5°C (10°F) decrease in temperature. For example, at 90°F (32°C) a hydrometer reading of 1.250 would be corrected to 1.254 at 80°F. See Fig 110.
Figure 109. Periodic battery maintenance should include checks of all terminals for corrosion and proper torque.
2011 Jim Dunlop Solar Cells, Modules and Arrays: 5 - 118
Figure 114. Periodic battery maintenance should include checks of all terminals for corrosion and proper torque.
Periodic battery maintenance should include checks of all terminals for corrosion and proper torque.
2011 Jim Dunlop Solar Cells, Modules and Arrays: 5 - 118
Figure 114. Periodic battery maintenance should include checks of all terminals for corrosion and proper torque.
Periodic battery maintenance should include checks of all terminals for corrosion and proper torque.
STATE-OF-CHANGE SPECIFIC GRAVITY OPEN-CIRCUIT VOLTAGE (V)
100% 1.265 12.6
75% 1.225 12.4
50% 1.190 12.2
25% 1.155 12.0
0 1.120 11.8
For typical lead-battery at 25o C
Figure 110. Battery specific gravity and open-circuit voltage are measured during maintenance to evaluate battery health and estimate state-of-charge.
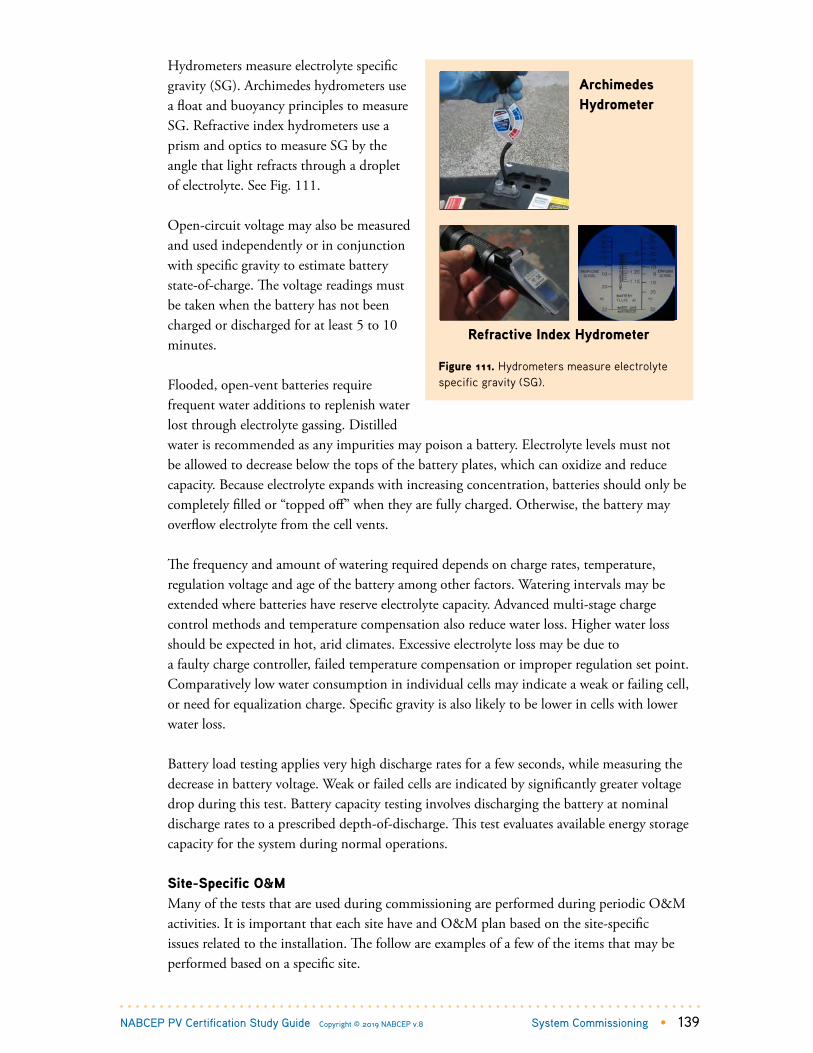
System Commissioning • 139 NABCEP PV Certification Study Guide Copyright © 2019 NABCEP v.8
Hydrometers measure electrolyte specific gravity (SG). Archimedes hydrometers use a float and buoyancy principles to measure SG. Refractive index hydrometers use a prism and optics to measure SG by the angle that light refracts through a droplet of electrolyte. See Fig. 111.
Open-circuit voltage may also be measured and used independently or in conjunction with specific gravity to estimate battery state-of-charge. The voltage readings must be taken when the battery has not been charged or discharged for at least 5 to 10 minutes.
Flooded, open-vent batteries require frequent water additions to replenish water lost through electrolyte gassing. Distilled water is recommended as any impurities may poison a battery. Electrolyte levels must not be allowed to decrease below the tops of the battery plates, which can oxidize and reduce capacity. Because electrolyte expands with increasing concentration, batteries should only be completely filled or “topped off” when they are fully charged. Otherwise, the battery may overflow electrolyte from the cell vents.
The frequency and amount of watering required depends on charge rates, temperature, regulation voltage and age of the battery among other factors. Watering intervals may be extended where batteries have reserve electrolyte capacity. Advanced multi-stage charge control methods and temperature compensation also reduce water loss. Higher water loss should be expected in hot, arid climates. Excessive electrolyte loss may be due toa faulty charge controller, failed temperature compensation or improper regulation set point. Comparatively low water consumption in individual cells may indicate a weak or failing cell, or need for equalization charge. Specific gravity is also likely to be lower in cells with lower water loss.
Battery load testing applies very high discharge rates for a few seconds, while measuring the decrease in battery voltage. Weak or failed cells are indicated by significantly greater voltage drop during this test. Battery capacity testing involves discharging the battery at nominal discharge rates to a prescribed depth-of-discharge. This test evaluates available energy storage capacity for the system during normal operations.
Site-Specific O&MMany of the tests that are used during commissioning are performed during periodic O&M activities. It is important that each site have and O&M plan based on the site-specific issues related to the installation. The follow are examples of a few of the items that may be performed based on a specific site.
Figure 111. Hydrometers measure electrolyte specific gravity (SG).
2011 Jim Dunlop Solar Cells, Modules and Arrays: 5 - 120
Figure 116. Hydrometers measure electrolyte specific gravity (SG).
Archimedes Hydrometer
Refractive Index Hydrometer 2011 Jim Dunlop Solar Cells, Modules and Arrays: 5 - 120
Figure 116. Hydrometers measure electrolyte specific gravity (SG).
Archimedes Hydrometer
Refractive Index Hydrometer 2011 Jim Dunlop Solar Cells, Modules and Arrays: 5 - 120
Figure 116. Hydrometers measure electrolyte specific gravity (SG).
Archimedes Hydrometer
Refractive Index HydrometerRefractive Index Hydrometer
Archimedes Hydrometer
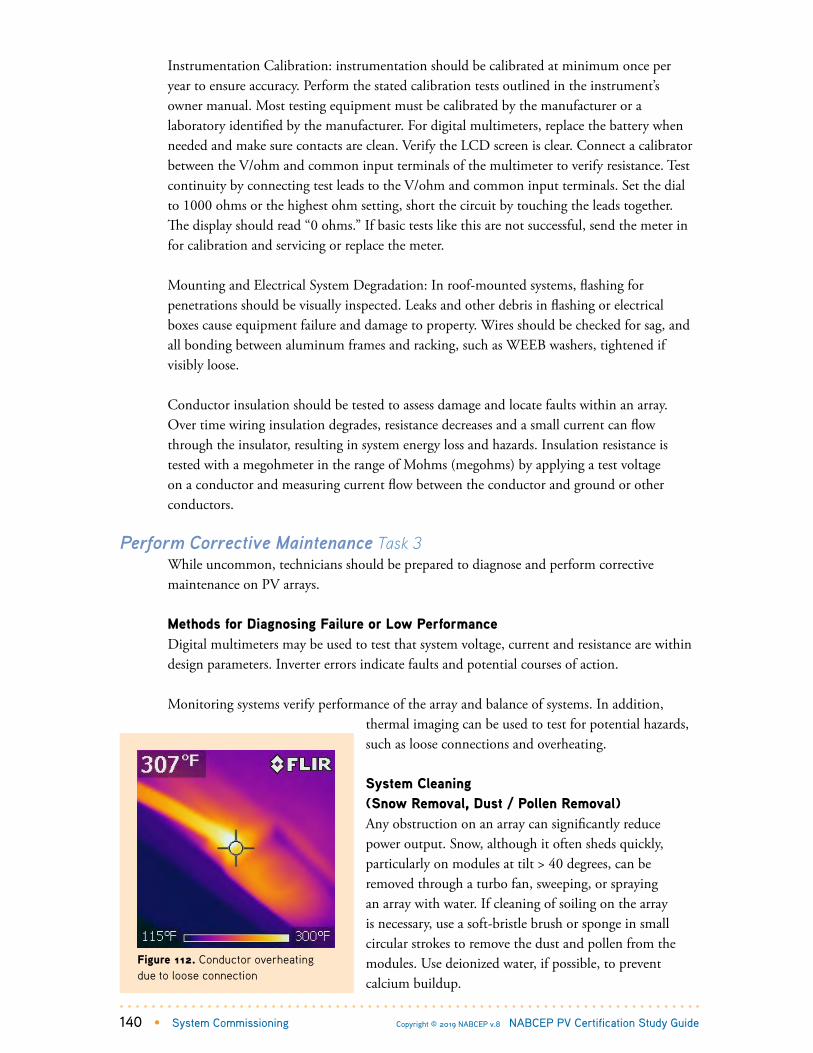
140 • System Commissioning Copyright © 2019 NABCEP v.8 NABCEP PV Certification Study Guide
Instrumentation Calibration: instrumentation should be calibrated at minimum once per year to ensure accuracy. Perform the stated calibration tests outlined in the instrument’s owner manual. Most testing equipment must be calibrated by the manufacturer or a laboratory identified by the manufacturer. For digital multimeters, replace the battery when needed and make sure contacts are clean. Verify the LCD screen is clear. Connect a calibrator between the V/ohm and common input terminals of the multimeter to verify resistance. Test continuity by connecting test leads to the V/ohm and common input terminals. Set the dial to 1000 ohms or the highest ohm setting, short the circuit by touching the leads together. The display should read “0 ohms.” If basic tests like this are not successful, send the meter in for calibration and servicing or replace the meter.
Mounting and Electrical System Degradation: In roof-mounted systems, flashing for penetrations should be visually inspected. Leaks and other debris in flashing or electrical boxes cause equipment failure and damage to property. Wires should be checked for sag, and all bonding between aluminum frames and racking, such as WEEB washers, tightened if visibly loose.
Conductor insulation should be tested to assess damage and locate faults within an array. Over time wiring insulation degrades, resistance decreases and a small current can flow through the insulator, resulting in system energy loss and hazards. Insulation resistance is tested with a megohmeter in the range of Mohms (megohms) by applying a test voltage on a conductor and measuring current flow between the conductor and ground or other conductors.
Perform Corrective Maintenance Task 3While uncommon, technicians should be prepared to diagnose and perform corrective maintenance on PV arrays.
Methods for Diagnosing Failure or Low PerformanceDigital multimeters may be used to test that system voltage, current and resistance are within design parameters. Inverter errors indicate faults and potential courses of action.
Monitoring systems verify performance of the array and balance of systems. In addition, thermal imaging can be used to test for potential hazards, such as loose connections and overheating.
System Cleaning (Snow Removal, Dust / Pollen Removal)Any obstruction on an array can significantly reduce power output. Snow, although it often sheds quickly, particularly on modules at tilt > 40 degrees, can be removed through a turbo fan, sweeping, or spraying an array with water. If cleaning of soiling on the array is necessary, use a soft-bristle brush or sponge in small circular strokes to remove the dust and pollen from the modules. Use deionized water, if possible, to prevent calcium buildup.
Figure 112. Conductor overheating due to loose connection

System Commissioning • 141 NABCEP PV Certification Study Guide Copyright © 2019 NABCEP v.8
Methods of Repair or ReplacementElectrical wiring and disconnects can be more easily repaired and replaced than modules and electronics. PV wire with 90o wet rating and up to 150o dry rating and 1000 V to 2000 V for use in systems with voltage greater than 600 V and for grounded and ungrounded arrays should be readily available to repair damaged wiring. Be sure to have spare ground fault fuse and AC fuses on hand as these are non-standard items.
Inverters and modules are most often replaced when faulty or damaged. When replacing any major system component follow LOTO procedures to de-energize the equipment.
Field Modification and Equipment Substitution Fuses and disconnects can be substituted with those of the same amperage rating from a different brand. It is best if modules, inverters, and batteries, be replaced with the same manufacturer as differences exist between module cell types and inverter features that can diminish PV output. However, it is often difficult or impossible to find exact replacements for products that are several years old. Knowledgeable engineers should be consulted when updating equipment in a PV system. Communications units should be checked for compatibility with existing or new equipment.
INVERTER ERROR ACTION
Dc undervoltage Steps to diagnosing underperforming systems
Dc overvoltage Voc string testing
Dc ground fault Ground fault detection procedure
Gating faultCheck connections
Contact manufacturer
Ac undervoltage
Confirm all breakers are on
Check ac voltage with voltmeter
If within range, perform a manual restart
If outside of range, contact utility
Ac overvoltage
Check ac voltage with voltmeter
If within range, perform a manual restart
If outside of range, contact utility
Low power
System is likely just shutting down because
of lack of sun; if it is sunny, perform steps to
diagnose underperforming systems
Over temperature—
fan not operating
Check power supply to fan—if good, replace
fan; if bad, replace power supply
Over temperature—
fan is not operating
Check to confirm sensor readings—if bad,
replace sensor; if good, investigate further
Over temperature—
fan is operating,
sensors are accurate
Check intake and exhaust filters for excessive
buildup, and clean or replace if necessary
Software fault Contact manufacturer
Common Reported Inverter Errors
Courtesy PV System Operations and Maintenance Fundamentals
Figure 113. Example of Impact of Cleaning Array on System Economic Performance for a Specific Location

142 • Appendixes Copyright © 2019 NABCEP v.8 NABCEP PV Certification Study Guide
APPENDIXESExam References & Case Study Examples
Exam ReferencesNABCEP’s exam committees use the following textbooks and reference materials to develop four of NABCEP’s Board Certification exams: PV Installation Professional, PV Design Specialist, PV Installer Specialist, and PV Commissioning & Maintenance Specialist. This list is not complete and does not include all of the available textbooks and materials for studying photovoltaics systems. Although this list is not all-inclusive as additional material in the form of books, videos, articles, and websites are continually produced, it is intended to give exam candidates a place to start as they prepare for these exams.
1. 2015 Uniform Solar Energy and Hydronics Code, 2015, International Association of Plumbing and Mechanical Officials (IAPMO), www.iapmo.org
2. 2017 National Electrical Code® (NEC®), 2017, National Fire Protection Association®, www.nfpa.org
3. 2017 National Electrical Code® Handbook, 2017, National Fire Protection Association®, www.nfpa.org
4. A Homeowner’s Guide to Solar Financing, 2015, by Nate Hausman, Clean Energy States Alliance, https://www.cesa.org/assets/2015-Files/Homeowners-Guide-to-Solar-Financing.pdf
5. The 2018 National Design Specification (NDS) for Wood Construction, American Wood Council, https://awc.org
6. Code of Federal Regulations, Chapter 29 Part 1926 – Safety and Health Regulations for Construction, Occupational Safety and Health Administration, www.osha.gov
7. Electrical Safety in the Workplace, NFPA 70E, 2017, National Fire Protection Association, www.nfpa.org
8. NABCEP Photovoltaic (PV) Installation Professional Resource Guide v.6.0, 2016, by William Brooks and James Dunlop, North American Board of Certified Energy Practitioners (NABCEP), www.nabcep.org
9. National Design Specification® (NDS®), 2005, American Wood Council, http://www.awc.org
10. NFPA 70E Standard for Electrical Safety in the Workplace, 2017, National Fire Protection Association. www.nfpa.org
11. Photovoltaics Design and Installation Manual, 2007, Solar Energy International, www.solarenergy.org
12. Photovoltaic Power Systems for Inspectors and Plan Reviewers: 2nd Edition, 2014, by John Wiles, International Association of Electrical Inspectors, www.iaei.org
13 Photovoltaic Systems, 3rd Ed., 2012, by Jim Dunlop, National Joint Apprenticeship and Training Committee and American Technical Publishers, www.jimdunlopsolar.com
14. Practical PV: An Illustrated Guide to Photovoltaics, 2012, Douglas Walker.
15. Protecting Roofing Workers, n.d., U.S. Department of Labor Occupational Safety and Health Administration, https://www.osha.gov/
16. Soares Book on Grounding and Bonding: 12th Edition, 2014, International Association of Electrical Inspectors, www.iaei.org
17. Solar Electric Handbook, Photovoltaic Fundamentals and Applications: Second Edition, 2013, Solar Energy International, www.solarenergy.org
18. SolarPro Magazine, https://solarprofessional.com
19. Solmetric PVA-600 PV Analyzer Users Guide, 2012, Solmetric Corporation
20. Troubleshooting Electrical/Electronics Systems. 2010, by Glen Mazur
21. Understanding NEC Requirements for Solar Photovoltaic Systems, 2017, by Mike Holt, Mike Holt Enterprises, Inc., www.mikeholt.com

Appendixes • 143 NABCEP PV Certification Study Guide Copyright © 2019 NABCEP v.8
Case Study Examples
Example 1: String Inverter System Connected toLoad Side of Service Panel.
1 CASE STUDY EXAMPLES
1.1 Example 1: String Inverter System Connected to Load Side of Service Panel.
Module Ratings:
Inverter Ratings:
Location: St. Louis, Missouri
Design questions:
1. What does the NEC consider the maximum voltage of this PV module at this location? temperature coefficient for VOC = αVOC = -0.28%/C = -0.0028/C temperature correction factor = 1 + α VOC (%) x (TLOW – TRATING) = 1 + (-0.0028/C) x (-19C – 25C) = 1 + 0.123 = 1.123 Answer: Vmax(module) = Voc x temp. corr. factor = 47.4 V x 1.123 = 53.2 V
MAX POWER-POINT CURRENT (IMP)
MAX POWER-POINT VOLTAGE (VMP)
OPEN-CIRCUIT VOLTAGE (VOC)
SHORT-CIRCUIT CURRENT (ISC)
MAX SERIES FUSE (OCPD)
MAXIMUM POWER (PMAX)
MAX VOLTAGE (TYP 1000VDC)
VOC TEMP COEFF (mV/oC or %/oC )
9.1 A
39.4 V
47.4 V
9.7 A
25 A
360 W
1000 V
-0.28
MODULE MAKE
MODULE MODEL
AMERICAN SOLAR
AS-360
MAX DC VOLT RATING
MAX POWER @ 40oC
NOMINAL AC VOLTAGE
MAX AC CURRENT
MAX OCPD RATING
600 V
7680 W
240 V
32 A
40 A
INVERTER MAKE
INVERTER MODEL
AMERICAN CONVERTER
AC-7680i
LOWEST EXPECTED AMBIENT TEMPERATURE BASED ON ASHRAE MINIMUM MEAN EXTREME DRY BULB TEMPERATURE FOR ASHRAE LOCATION MOST SIMILAR TO INSTALLATION LOCATION. LOWEST EXPECTED AMBIENT TEMP -19 oC

144 • Appendixes Copyright © 2019 NABCEP v.8 NABCEP PV Certification Study Guide
2. What is the maximum number of modules that may be installed in series where all dc
equipment is rated for 600 Vdc? Answer: max. number of modules = 600 V ÷ 53.2 = 11.3 11 modules
3. What is the maximum voltage for 10 modules in series as defined by NEC 690.7? Answer: Vmax(module) x # of modules in series = 53.2 V x 10 = 532 volts
4. If the module degradation is -0.5%/year, minimum voltage of the inverter is 295 Vdc, and the module Vmp temperature coefficient is -0.4%/°C, what is the minimum number of modules in series that will keep the Vmp above 295 Vdc in 20 years at a cell temperature of 65°C? Step 1: What is the adjustment factor for Vmp after 20 years of degradation?
20 years of voltage loss @ -0.5%/year = 1 + (20 x (-0.5%)) = (1 – 0.1) = 0.9 Step 2: What is the adjustment factor for Vmp from STC to 65°C?
Vmp loss due to temperature @ 65°C = 1 + [(65°C – TSTC) x (-0.4%/°C)] = 1 + [(65°C – 25°C) x (-0.4%/°C)] = 1 + [40°C x (-0.4%/°C)] = 1 – 0.16 = 0.84.
Step 3: Apply both adjustment factors to Vmp. Vmp @ 20 years and 65°C = Vmp x 0.9 x 0.84 = 39.4 V x 0.9 x 0.84 = 29.8 V
Step 4: Divide adjusted Vmp into 295 V to determine minimum number of modules.
Answer: min. # of modules = 295V ÷ 29.8 V = 9.9 10 modules
5. The inverter recommend maximum STC watts of modules is 10,900 WSTC. What is the recommended maximum number of modules that can be installed on this inverter? Answer: 10,900 W ÷ 360 W = 30.3 30 modules
6. What array configuration provides for the best utilization of the array and inverter power? Answer: 3 strings of 10, which is 30 modules 10,800 WSTC of modules
Note: This is right at the recommended limit of array size for the inverter. An array with 2 strings of 11 modules results in a 7920-WSTC array that would be more suited to an inverter between 6 kW and 7 kW. A location at higher elevation may favor a 7-kW inverter with 2 strings of 11 modules because of higher irradiance.
7. If the PV array is on detached garage roof and a combiner box and disconnect is mounted outside the garage accessible at ground level before proceeding to the house where the inverter is mounted next to the main panel. What is maximum current of the PV output circuit and what is the minimum conductor ampacity required to be run underground to the inverter?

Appendixes • 145 NABCEP PV Certification Study Guide Copyright © 2019 NABCEP v.8
Answer: Imax = Isc x 3 x 1.25 = 9.7 A x 3 x 1.25 = 36.4 A Minimum conductor ampacity according to NEC 690.8(B) is Imax x 1.25 = 36.4 A x 1.25 = 45.5 A. Since the circuit is run underground 8 AWG will work for 75°C terminals and higher.
8. At what distance does the voltage drop for the 8 AWG output circuit equal 2% for maximum operating current? Assume an 8 AWG uncoated copper conductor is used. A larger size conductor should be considered for a longer wire run. The maximum operating current = Imp x 3 = 9.1 A x 3 = 27.3 A = I in equation below. Solve for “d” in feet in the equation below.
%V = 2% =V
V× 100% =
2 × d × I1000 FT
kFT× Ω
kFT
V× 100%
0.02 × Vnom =2 × d × I
1000 FTkFT
× Ω
kFT
20 FT × 240V = 2 × d × 27.3 A × (0.778 Ω)
20 FT × 240V
2 × 27.3 A × 0.778 Ω = d = 113 FT
9. If all three circuits are run separately to the inverter inputs using 12 AWG uncoated copper conductors, at what distance does the wire run voltage drop equal 2% for maximum operating current? A larger size conductor should be considered for a longer wire run. The maximum operating current = Imp = 9.1 amps = I in equation below. Solve for “d” in feet in the equation below.
%V = 2% =V
V× 100% =
2 × d × I1000 FT
kFT× Ω
kFT
V× 100%
0.02 × Vnom =2 × d × I
1000 FTkFT
× Ω
kFT
20 FT × 240V = 2 × d × 9.1 A × (1.98 Ω)
20 FT × 240V
2 × 9.1 A × 1.98 Ω = d = 133 FT
10. What is the minimum ac breaker allowed for this inverter?
Answer: min. breaker size = inverter maximum ac current x 1.25 = 32 A x 1.25 = 40 A
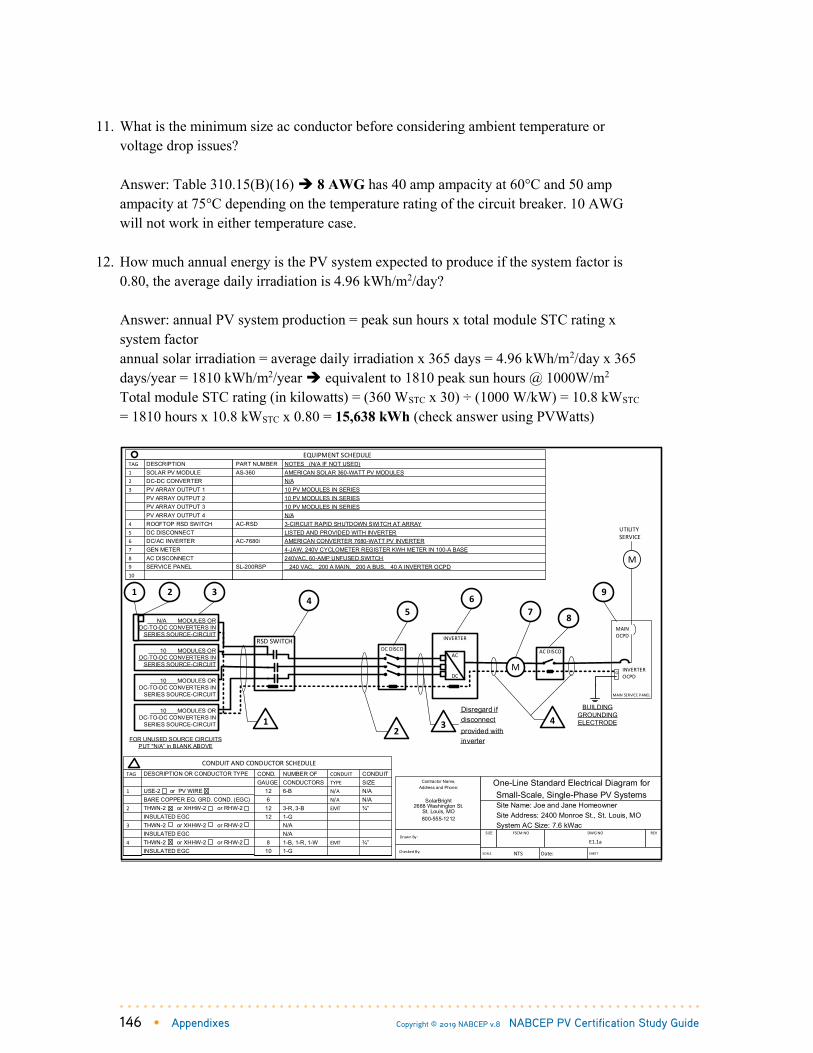
146 • Appendixes Copyright © 2019 NABCEP v.8 NABCEP PV Certification Study Guide
11. What is the minimum size ac conductor before considering ambient temperature or
voltage drop issues? Answer: Table 310.15(B)(16) 8 AWG has 40 amp ampacity at 60°C and 50 amp ampacity at 75°C depending on the temperature rating of the circuit breaker. 10 AWG will not work in either temperature case.
12. How much annual energy is the PV system expected to produce if the system factor is 0.80, the average daily irradiation is 4.96 kWh/m2/day? Answer: annual PV system production = peak sun hours x total module STC rating x system factor annual solar irradiation = average daily irradiation x 365 days = 4.96 kWh/m2/day x 365 days/year = 1810 kWh/m2/year equivalent to 1810 peak sun hours @ 1000W/m2 Total module STC rating (in kilowatts) = (360 WSTC x 30) ÷ (1000 W/kW) = 10.8 kWSTC = 1810 hours x 10.8 kWSTC x 0.80 = 15,638 kWh (check answer using PVWatts)
Contractor Name, Address and Phone:
SolarBright2688 Washington St.
St. Louis, MO800-555-1212
One-Line Standard Electrical Diagram for Small-Scale, Single-Phase PV Systems
Site Name: Joe and Jane Homeowner Site Address: 2400 Monroe St., St. Louis, MO System AC Size: 7.6 kWac
SIZE FSCM NO DWG NO REV
E1.1a
SCALE NTS Date: SHEET
Drawn By:
Checked By:
DESCRIPTION OR CONDUCTOR TYPE
USE-2 or PV WIRE BARE COPPER EQ. GRD. COND. (EGC)THWN-2 or XHHW-2 or RHW-2 INSULATED EGCTHWN-2 or XHHW-2 or RHW-2 INSULATED EGCTHWN-2 or XHHW-2 or RHW-2INSULATED EGC
TAG
1
2
3
4
CONDUIT AND CONDUCTOR SCHEDULECOND.GAUGE
126
1212
810
NUMBER OFCONDUCTORS6-B
3-R, 3-B1-GN/AN/A1-B, 1-R, 1-W1-G
CONDUITTYPEN/AN/AEMT
EMT
CONDUITSIZEN/AN/A¾”
¾”
DESCRIPTION SOLAR PV MODULEDC-DC CONVERTERPV ARRAY OUTPUT 1PV ARRAY OUTPUT 2 PV ARRAY OUTPUT 3PV ARRAY OUTPUT 4ROOFTOP RSD SWITCHDC DISCONNECTDC/AC INVERTERGEN METERAC DISCONNECTSERVICE PANEL
TAG123
45678910
NOTES (N/A IF NOT USED)AMERICAN SOLAR 360-WATT PV MODULESN/A10 PV MODULES IN SERIES10 PV MODULES IN SERIES10 PV MODULES IN SERIESN/A3-CIRCUIT RAPID SHUTDOWN SWITCH AT ARRAYLISTED AND PROVIDED WITH INVERTERAMERICAN CONVERTER 7680-WATT PV INVERTER4-JAW, 240V CYCLOMETER REGISTER KWH METER IN 100-A BASE240VAC, 60-AMP UNFUSED SWITCH 240 VAC, 200 A MAIN, 200 A BUS, 40 A INVERTER OCPD
FOR UNUSED SOURCE CIRCUITS PUT "N/A” in BLANK ABOVE
EQUIPMENT SCHEDULEPART NUMBERAS-360
AC-RSD
AC-7680i
SL-200RSP
N/A MODULES OR DC-TO-DC CONVERTERS IN
SERIES SOURCE-CIRCUIT
DC DISCO
INVERTER
AC DISCOAC
DCM
BUILDINGGROUNDING ELECTRODE
G
M
UTILITY SERVICE
MAIN SERVICE PANEL
MAINOCPD
INVERTEROCPD
1
1 34
56
9
4
7
2
10 MODULES OR DC-TO-DC CONVERTERS IN
SERIES SOURCE-CIRCUIT
10 MODULES ORDC-TO-DC CONVERTERS IN
SERIES SOURCE-CIRCUIT
10 MODULES ORDC-TO-DC CONVERTERS IN
SERIES SOURCE-CIRCUIT
8
Disregard if disconnect provided with inverter
32
RSD SWITCH

Appendixes • 147 NABCEP PV Certification Study Guide Copyright © 2019 NABCEP v.8
Contractor Name, Address and Phone:
SolarBright2688 Washington St.
St. Louis, MO800-555-1212
Bill
Ted
Notes for One-Line Standard Electrical Diagram for Single-Phase PV Systems
Site Name: Joe and Jane Homeowner Site Address: 2400 Monroe St., St. Louis, MO System AC Size: 7.6 kWac
SIZE FSCM NO DWG NO REV
E1.2a
SCALE NTS Date: SHEET
Drawn By:
Checked By:
MAX POWER-POINT CURRENT (IMP)
MAX POWER-POINT VOLTAGE (VMP)
OPEN-CIRCUIT VOLTAGE (VOC)
SHORT-CIRCUIT CURRENT (ISC)
MAX SERIES FUSE (OCPD)
MAXIMUM POWER (PMAX)
MAX VOLTAGE (TYP 1000VDC)
VOC TEMP COEFF (mV/oC or %/oC )
9.1 A
39.4 V
47.4 V
9.7 A
25 A
360 W
1000 V
-0.28
MODULE MAKE
MODULE MODEL
AMERICAN SOLAR
AS-360
PV MODULE RATINGS @ STC
LOWEST EXPECTED AMBIENT TEMPERATURE BASED ON ASHRAE MINIMUM MEAN EXTREME DRY BULB TEMPERATURE FOR ASHRAE LOCATION MOST SIMILAR TO INSTALLATION LOCATION. LOWEST EXPECTED AMBIENT TEMP -19 oC
NOTE FOR ARRAY CIRCUIT WIRING
OCPD = OVERCURRENT PROTECTION DEVICE
NATIONAL ELECTRICAL CODE® REFERENCES SHOWN AS (NEC XXX.XX)
NOTES FOR ALL DRAWINGS:
1) IF UTILITY REQUIRES A VISIBLE-BREAK SWITCH, DOES THIS SWITCH MEET THE REQUIREMENT? YES NO N/A
2) IF GENERATION METER REQUIRED, DOES THIS METER SOCKET MEET THE REQUIREMENT? YES NO N/A
3) SIZE INVERTER OUTPUT CIRCUIT (AC) CONDUCTORS ACCORDING TO INVERTER OCPD AMPERE RATING. (See Table 705.12)
4) DOES TOTAL SUPPLY BREAKERS COMPLY WITH 120% BUSBAR RULE IN 705.12(D)? YES NO
*SIGN FOR DC DISCONNECT
SIGN FOR PV SYSTEM DISCONNECT
MAX VOLTAGE
MAX CIRCUIT CURRENT
MAX OUTPUT CURRENT
532 V
12.1 A
N/A
PHOTOVOLTAIC POWER SOURCE
WARNING: ELECTRICAL SHOCK HAZARD–LINE AND LOAD MAY BE ENERGIZED IN OPEN POSITION
AC OUTPUT CURRENT
NOMINAL AC VOLTAGE
32 A
240 V
SOLAR PV SYSTEMDISCONNECT
NOTES FOR INVERTER CIRCUITS:
SIGN FOR DISTRIBUTION PANELSTHIS PANEL FED BY MULTIPLE
SOURCES (UTILITY AND SOLAR)
SIGN FOR NEC 705.12(D)(2)(3)(b) (if used)
WARNING:INVERTER OUTPUT CONNECTION;
DO NOT RELOCATE THIS OVERCURRENT DEVICE.
SIGN FOR NEC 690.12 (for roof-mounted systems)
PHOTOVOLTAIC SYSTEM EQUIPPED WITH RAPID SHUTDOWN
MAX DC VOLT RATING
MAX POWER @ 40oC
NOMINAL AC VOLTAGE
MAX AC CURRENT
MAX OCPD RATING
600 V
7680 W
240 V
32 A
40 A
INVERTER MAKE
INVERTER MODEL
AMERICAN CONVERTER
AC-7680i
INVERTER RATINGS
MAX CURRENT
MAX VOLTAGE
MAXIMUM POWER
MAX OUTPUT CIRCUIT V (TYP 600VDC)
CONVERTER MAKE
CONVERTER MODEL
DC-TO-DC CONVERTER RATINGS (if used)
*NOTE: MICROINVERTER AND AC MODULE SYSTEMS DO NOT NEED DC DISCONNECT SIGN SINCE 690.51 MARKING ON PV MODULE COVERS NEEDED INFORMATION

148 • Appendixes Copyright © 2019 NABCEP v.8 NABCEP PV Certification Study Guide
Example 2: DC-to-DC Converters with String Inverter System Connected to Load Side of Service Panel.
1.2 Example 2: DC-to-DC Converters with String Inverter System Connected to Load Side of Service Panel.
Module Ratings:
Dc-to-Dc Converter Ratings:
Inverter Ratings:
Location: Albany, NY
MAX POWER-POINT CURRENT (IMP)
MAX POWER-POINT VOLTAGE (VMP)
OPEN-CIRCUIT VOLTAGE (VOC)
SHORT-CIRCUIT CURRENT (ISC)
MAX SERIES FUSE (OCPD)
MAXIMUM POWER (PMAX)
MAX VOLTAGE (TYP 1000VDC)
VOC TEMP COEFF (mV/oC or %/oC )
9.1 A
39.4 V
47.4 V
9.7 A
25 A
360 W
1000 V
-0.28
MODULE MAKE
MODULE MODEL
AMERICAN SOLAR
AS-360
MAX CURRENT
MAX VOLTAGE
MAXIMUM POWER
MAX OUTPUT CIRCUIT V (TYP 600VDC)
12 A
80 V
360 W
600 V
CONVERTER MAKE
CONVERTER MODEL
AMERICAN CONVERTER
AI-360
MAX DC VOLT RATING
MAX POWER @ 40oC
NOMINAL AC VOLTAGE
MAX AC CURRENT
MAX OCPD RATING
600 V
7680 W
240 V
32 A
40 A
INVERTER MAKE
INVERTER MODEL
AMERICAN CONVERTER
AC-7680i
LOWEST EXPECTED AMBIENT TEMPERATURE BASED ON ASHRAE MINIMUM MEAN EXTREME DRY BULB TEMPERATURE FOR ASHRAE LOCATION MOST SIMILAR TO INSTALLATION LOCATION. LOWEST EXPECTED AMBIENT TEMP -23 oC

Appendixes • 149 NABCEP PV Certification Study Guide Copyright © 2019 NABCEP v.8
Design questions:
1. What does the NEC consider the maximum voltage of this PV module at this location? temperature coefficient for VOC = αVOC = -0.28%/C = -0.0028/C temperature correction factor = 1 + α VOC (%) x (TLOW – TRATING) = 1 + (-0.0028/C) x (-23C – 25C) = 1 + 0.134 = 1.134 Answer: Vmax(module) = Voc x temp. corr. factor = 47.4 V x 1.134 = 53.8 V
2. What is the maximum number of modules that may be installed in series where all dc equipment is rated for 60 Vdc? Answer: max. number of modules in series = 60 V ÷ 53.8 = 1.1 1 module
3. What is the maximum power per dc-to-dc converter source circuit is 6,000 watts? How many converters can be placed in a single source circuit? Answer: Pmax(conv) ÷ Pmax(module) = 6000 W ÷ 360 W = 16.7 16 converters
4. The inverter recommend maximum Watts of converters is 10,900 WSTC, what is the maximum number of modules that can be installed on this inverter? Answer: 10,900 W ÷ 360 W = 30.3 30 modules
5. The minimum number of dc-to-dc converters for this inverter is 8. Provide two configurations for a 30-converter array using source circuits with the same number of converters? Answer 1: Two converter source circuits of 15 converters each. Answer 2: Three converter source circuits of 10 converters each.
6. If the PV array is on detached garage roof and a combiner box and disconnect is mounted outside the garage accessible at ground level before proceeding to the house where the inverter is mounted next to the main panel. What is maximum current of the PV output circuit and what is the minimum conductor ampacity required to be run underground to the inverter for each answer in question 5? Answer 1: I max = I max(conv) x 2 = 12 A x 2 = 24 Amps Minimum conductor ampacity according to NEC 690.8(B) is I max x 1.25 = 24 A x 1.25 = 30 A Since the circuit is run underground 10 AWG will work for all terminals. Answer 2: I max = I max(conv) x 3 = 12 A x 3 = 36 Amps Minimum conductor ampacity according to NEC 690.8(B) is I max x 1.25 = 36 A x 1.25 = 45 A Since the circuit is run underground 8 AWG will work for 75°C terminals and higher.

7. At what distance does the combined two-circuit 10 AWG wire run voltage drop equal 3% for maximum operating current? A larger size conductor should be considered for a longer wire run. The maximum operating current = Imax x 2 = 12 A x 2 = 24 A = I in equation below. Solve for “d” in feet in the equation below.
%V = 2% =V
V× 100% =
2 × d × I1000 FT
kFT× Ω
kFT
V× 100%
0.02 × Vnom =2 × d × I
1000 FTkFT
× Ω
kFT
20 FT × 240V = 2 × d × 24 A × (1.24 Ω)
20 FT × 240V
2 × 24 A × 1.24 Ω = d = 81 FT
8. At what distance does the combined three-circuit 8 AWG wire run voltage drop equal 3% for maximum operating current? A larger size conductor should be considered for a longer wire run. The maximum operating current = Imax x 3 = 12 A x 3 = 36 A = I in equation below. Solve for “d” in feet in the equation below.
%V = 2% =V
V× 100% =
2 × d × I1000 FT
kFT× Ω
kFT
V× 100%
0.02 × Vnom =2 × d × I
1000 FTkFT
× Ω
kFT
20 FT × 240V = 2 × d × 36 A × (0.778 Ω)
20 FT × 240V
2 × 36 A × 0.778 Ω = d = 86 FT
9. If two circuits are run separately to the inverter inputs using 12 AWG conductors, at what
distance do these circuits have a voltage drop equal to 3% for maximum operating current? A larger size conductor should be considered for a longer wire run. The maximum operating current = Imax = 12 A = I in equation below. Solve for “d” in feet in the equation below.

%V = 2% =V
V× 100% =
2 × d × I1000 FT
kFT× Ω
kFT
V× 100%
0.02 × Vnom =2 × d × I
1000 FTkFT
× Ω
kFT
20 FT × 240V = 2 × d × 12 A × (1.98 Ω)
20 FT × 240V
2 × 12 A × 1.98 Ω = d = 101 FT
10. How much annual energy is the PV system expected to produce if the system factor is
0.80, the average daily irradiation is 4.46 kWh/m2/day? Answer: annual PV system production = peak sun hours x total module STC rating x system factor annual solar irradiation = average daily irradiation x 365 days = 4.46 kWh/m2/day x 365 days/year = 1628 kWh/m2/year equivalent to 1628 peak sun hours @ 1000W/m2 total module STC rating (in kilowatts) = (360 WSTC x 30) ÷ (1000 W/kW) = 10.8 kWSTC = 1628 hours x 10.8 kWSTC x 0.80 = 14,066 kWh (check answer using PVWatts)
Contractor Name, Address and Phone:
SolarBright2688 Washington St.
St. Louis, MO800-555-1212
One-Line Standard Electrical Diagram for Small-Scale, Single-Phase PV Systems
Site Name: Joe and Jane Homeowner Site Address: 2400 Monroe St., St. Louis, MO System AC Size: 7.6 kWac
SIZE FSCM NO DWG NO REV
E1.1a
SCALE NTS Date: SHEET
Drawn By:
Checked By:
DESCRIPTION OR CONDUCTOR TYPE
USE-2 or PV WIRE BARE COPPER EQ. GRD. COND. (EGC)THWN-2 or XHHW-2 or RHW-2 INSULATED EGCTHWN-2 or XHHW-2 or RHW-2 INSULATED EGCTHWN-2 or XHHW-2 or RHW-2INSULATED EGC
TAG
1
2
3
4
CONDUIT AND CONDUCTOR SCHEDULECOND.GAUGE
126
1212
810
NUMBER OFCONDUCTORS4-B
2-R, 2-B1-GN/AN/A1-B, 1-R, 1-W1-G
CONDUITTYPEN/AN/AEMT
EMT
CONDUITSIZEN/AN/A¾”
¾”
DESCRIPTION SOLAR PV MODULEDC-DC CONVERTERPV ARRAY OUTPUT 1PV ARRAY OUTPUT 2 PV ARRAY OUTPUT 3PV ARRAY OUTPUT 4ROOFTOP RSD SWITCHDC DISCONNECTDC/AC INVERTERGEN METERAC DISCONNECTSERVICE PANEL
TAG123
45678910
NOTES (N/A IF NOT USED)AMERICAN SOLAR 360-WATT PV MODULESAMERICAN CONVERTER SOLARBUCK 360-WATT DC-TO-DC CONVERTERN/A15 DC-TO-DC CONVERTERS IN SERIES15 DC-TO-DC CONVERTERS IN SERIESN/AN/ALISTED AND PROVIDED WITH INVERTERAMERICAN CONVERTER 7680-WATT PV INVERTER4-JAW, 240V CYCLOMETER REGISTER KWH METER IN 100-A BASE240VAC, 60-AMP UNFUSED SWITCH 240 VAC, 200 A MAIN, 200 A BUS, 40 A INVERTER OCPD
FOR UNUSED SOURCE CIRCUITS PUT "N/A” in BLANK ABOVE
EQUIPMENT SCHEDULEPART NUMBERAS-360AC-SB360
AC-7680i
SL-200RSP
N/A MODULES OR DC-TO-DC CONVERTERS IN
SERIES SOURCE-CIRCUIT
DC DISCO
INVERTER
AC DISCOAC
DCM
BUILDINGGROUNDING ELECTRODE
G
M
UTILITY SERVICE
MAIN SERVICE PANEL
MAINOCPD
INVERTEROCPD
1
1 34
56
9
4
7
2
15 MODULES OR DC-TO-DC CONVERTERS IN
SERIES SOURCE-CIRCUIT
15 MODULES ORDC-TO-DC CONVERTERS IN
SERIES SOURCE-CIRCUIT
N/A MODULES ORDC-TO-DC CONVERTERS IN
SERIES SOURCE-CIRCUIT
8
Disregard if disconnect provided with inverter
32
RSD SWITCH

Contractor Name, Address and Phone:
SolarBright2688 Washington Ave.
Albany, NY800-555-1212
Bill
Ted
Notes for One-Line Standard Electrical Diagram for Single-Phase PV Systems
Site Name: Joe and Jane Homeowner Site Address: 2400 Monroe St., Albany, NY System AC Size: 7.6 kWac
SIZE FSCM NO DWG NO REV
E1.2a
SCALE NTS Date: SHEET
Drawn By:
Checked By:
MAX POWER-POINT CURRENT (IMP)
MAX POWER-POINT VOLTAGE (VMP)
OPEN-CIRCUIT VOLTAGE (VOC)
SHORT-CIRCUIT CURRENT (ISC)
MAX SERIES FUSE (OCPD)
MAXIMUM POWER (PMAX)
MAX VOLTAGE (TYP 1000VDC)
VOC TEMP COEFF (mV/oC or %/oC )
9.1 A
39.4 V
47.4 V
9.7 A
25 A
360 W
1000 V
-0.28
MODULE MAKE
MODULE MODEL
AMERICAN SOLAR
AS-360
PV MODULE RATINGS @ STC
LOWEST EXPECTED AMBIENT TEMPERATURE BASED ON ASHRAE MINIMUM MEAN EXTREME DRY BULB TEMPERATURE FOR ASHRAE LOCATION MOST SIMILAR TO INSTALLATION LOCATION. LOWEST EXPECTED AMBIENT TEMP -23 oC
NOTE FOR ARRAY CIRCUIT WIRING
OCPD = OVERCURRENT PROTECTION DEVICE
NATIONAL ELECTRICAL CODE® REFERENCES SHOWN AS (NEC XXX.XX)
NOTES FOR ALL DRAWINGS:
1) IF UTILITY REQUIRES A VISIBLE-BREAK SWITCH, DOES THIS SWITCH MEET THE REQUIREMENT? YES NO N/A
2) IF GENERATION METER REQUIRED, DOES THIS METER SOCKET MEET THE REQUIREMENT? YES NO N/A
3) SIZE INVERTER OUTPUT CIRCUIT (AC) CONDUCTORS ACCORDING TO INVERTER OCPD AMPERE RATING. (See Table 705.12)
4) DOES TOTAL SUPPLY BREAKERS COMPLY WITH 120% BUSBAR RULE IN 705.12(D)? YES NO
*SIGN FOR DC DISCONNECT
SIGN FOR PV SYSTEM DISCONNECT
MAX VOLTAGE
MAX CIRCUIT CURRENT
MAX OUTPUT CURRENT
575 V
15 A
12 A
PHOTOVOLTAIC POWER SOURCE
WARNING: ELECTRICAL SHOCK HAZARD–LINE AND LOAD MAY BE ENERGIZED IN OPEN POSITION
AC OUTPUT CURRENT
NOMINAL AC VOLTAGE
32 A
240 V
SOLAR PV SYSTEMDISCONNECT
NOTES FOR INVERTER CIRCUITS:
SIGN FOR DISTRIBUTION PANELSTHIS PANEL FED BY MULTIPLE
SOURCES (UTILITY AND SOLAR)
SIGN FOR NEC 705.12(D)(2)(3)(b) (if used)
WARNING:INVERTER OUTPUT CONNECTION;
DO NOT RELOCATE THIS OVERCURRENT DEVICE.
SIGN FOR NEC 690.12 (for roof-mounted systems)
PHOTOVOLTAIC SYSTEM EQUIPPED WITH RAPID SHUTDOWN
MAX DC VOLT RATING
MAX POWER @ 40oC
NOMINAL AC VOLTAGE
MAX AC CURRENT
MAX OCPD RATING
600 V
7680 W
240 V
32 A
40 A
INVERTER MAKE
INVERTER MODEL
AMERICAN CONVERTER
AC-7680i
INVERTER RATINGS
MAX CURRENT
MAX VOLTAGE
MAXIMUM POWER
MAX OUTPUT CIRCUIT V (TYP 600VDC)
12 A
80 V
360 W
600 V
CONVERTER MAKE
CONVERTER MODEL
AMERICAN CONVERTER
AI-360
DC-TO-DC CONVERTER RATINGS (if used)
*NOTE: MICROINVERTER AND AC MODULE SYSTEMS DO NOT NEED DC DISCONNECT SIGN SINCE 690.51 MARKING ON PV MODULE COVERS NEEDED INFORMATION
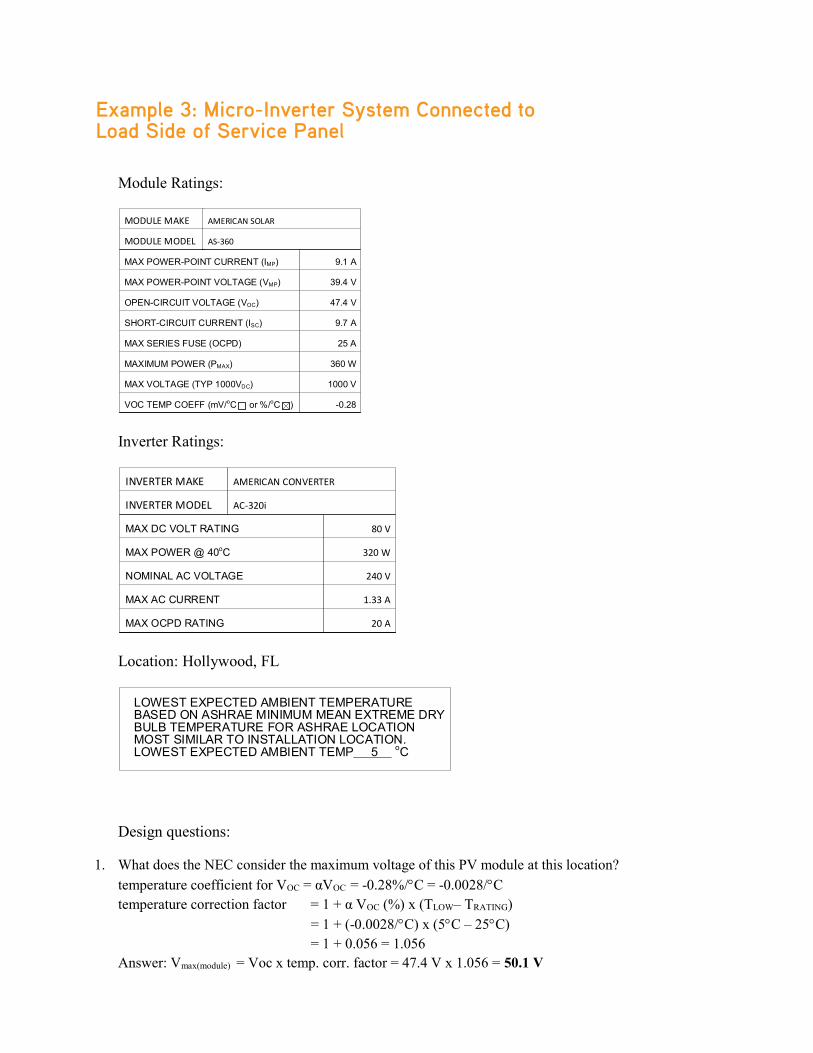
1.3 Example 3: Micro-Inverter System Connected to Load Side of Service Panel.
Module Ratings:
Inverter Ratings:
Location: Hollywood, FL
Design questions:
1. What does the NEC consider the maximum voltage of this PV module at this location? temperature coefficient for VOC = αVOC = -0.28%/C = -0.0028/C temperature correction factor = 1 + α VOC (%) x (TLOW– TRATING) = 1 + (-0.0028/C) x (5C – 25C) = 1 + 0.056 = 1.056 Answer: Vmax(module) = Voc x temp. corr. factor = 47.4 V x 1.056 = 50.1 V
MAX POWER-POINT CURRENT (IMP)
MAX POWER-POINT VOLTAGE (VMP)
OPEN-CIRCUIT VOLTAGE (VOC)
SHORT-CIRCUIT CURRENT (ISC)
MAX SERIES FUSE (OCPD)
MAXIMUM POWER (PMAX)
MAX VOLTAGE (TYP 1000VDC)
VOC TEMP COEFF (mV/oC or %/oC )
9.1 A
39.4 V
47.4 V
9.7 A
25 A
360 W
1000 V
-0.28
MODULE MAKE
MODULE MODEL
AMERICAN SOLAR
AS-360
MAX DC VOLT RATING
MAX POWER @ 40oC
NOMINAL AC VOLTAGE
MAX AC CURRENT
MAX OCPD RATING
80 V
320 W
240 V
1.33 A
20 A
INVERTER MAKE
INVERTER MODEL
AMERICAN CONVERTER
AC-320i
LOWEST EXPECTED AMBIENT TEMPERATURE BASED ON ASHRAE MINIMUM MEAN EXTREME DRY BULB TEMPERATURE FOR ASHRAE LOCATION MOST SIMILAR TO INSTALLATION LOCATION. LOWEST EXPECTED AMBIENT TEMP 5 oC
Example 3: Micro-Inverter System Connected to Load Side of Service Panel
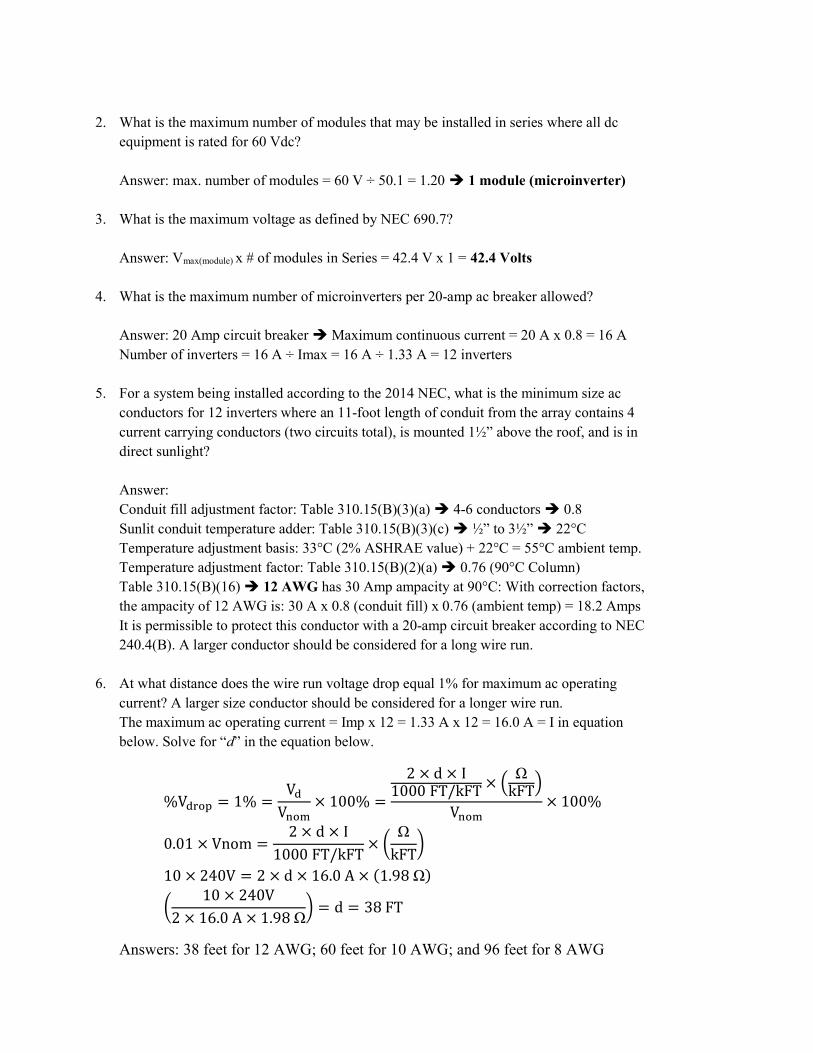
2. What is the maximum number of modules that may be installed in series where all dc equipment is rated for 60 Vdc? Answer: max. number of modules = 60 V ÷ 50.1 = 1.20 1 module (microinverter)
3. What is the maximum voltage as defined by NEC 690.7? Answer: Vmax(module) x # of modules in Series = 42.4 V x 1 = 42.4 Volts
4. What is the maximum number of microinverters per 20-amp ac breaker allowed? Answer: 20 Amp circuit breaker Maximum continuous current = 20 A x 0.8 = 16 A Number of inverters = 16 A ÷ Imax = 16 A ÷ 1.33 A = 12 inverters
5. For a system being installed according to the 2014 NEC, what is the minimum size ac conductors for 12 inverters where an 11-foot length of conduit from the array contains 4 current carrying conductors (two circuits total), is mounted 1½” above the roof, and is in direct sunlight? Answer: Conduit fill adjustment factor: Table 310.15(B)(3)(a) 4-6 conductors 0.8 Sunlit conduit temperature adder: Table 310.15(B)(3)(c) ½” to 3½” 22°C Temperature adjustment basis: 33°C (2% ASHRAE value) + 22°C = 55°C ambient temp. Temperature adjustment factor: Table 310.15(B)(2)(a) 0.76 (90°C Column) Table 310.15(B)(16) 12 AWG has 30 Amp ampacity at 90°C: With correction factors, the ampacity of 12 AWG is: 30 A x 0.8 (conduit fill) x 0.76 (ambient temp) = 18.2 Amps It is permissible to protect this conductor with a 20-amp circuit breaker according to NEC 240.4(B). A larger conductor should be considered for a long wire run.
6. At what distance does the wire run voltage drop equal 1% for maximum ac operating current? A larger size conductor should be considered for a longer wire run. The maximum ac operating current = Imp x 12 = 1.33 A x 12 = 16.0 A = I in equation below. Solve for “d” in the equation below.
%V = 1% =V
V× 100% =
2 × d × I1000 FT/kFT × Ω
kFT
V× 100%
0.01 × Vnom =2 × d × I
1000 FT/kFT×
ΩkFT
10 × 240V = 2 × d × 16.0 A × (1.98 Ω)
10 × 240V
2 × 16.0 A × 1.98 Ω = d = 38 FT
Answers: 38 feet for 12 AWG; 60 feet for 10 AWG; and 96 feet for 8 AWG

7. If the house can handle 30 modules, two full branch circuits, how much annual energy is the PV system expected to produce if the system factor is 0.8, the average daily irradiation is 5.81 kWh/m2/day? Answer: annual PV system production = peak sun hours x total module STC rating x system factor annual solar irradiation = average daily irradiation x 365 days = 5.81 kWh/m2/day x 365 days/year = 2121 kWh/m2/year equivalent to 2121 peak sun hours @ 1000W/m2 total module STC rating (in kilowatts) = (360 WSTC x 30) ÷ (1000 W/kW) = 10.8 kWSTC = 2121 hours x 10.8 kWSTC x 0.8 = 18,325 kWh (check answer using PVWatts)
Contractor Name, Address and Phone:
SolarBright2688 Washington St.
Hollywood, FL800-555-1212
Bill
Ted
One-Line Standard Electrical Diagramfor Micro-Inverter or AC Module PV Systems Site Name: Joe and Jane Homeowner Site Address: 2400 Monroe St., Hollywood, FL System AC Size: 7.6 kWac
SIZE FSCM NO DWG NO REV
E1.1b 0
SCALE NTS Date: SHEET
Drawn By:
Checked By:
DESCRIPTION OR CONDUCTOR TYPE
USE-2 or PV WIRE or MFG CableEQUIPMENT GROUNDING CONDUCTOREXTERIOR CABLE LISTED W/ INV.THWN-2 or XHHW-2 or RHW-2 EQUIPMENT GROUNDING CONDUCTORTHWN-2 or XHHW-2 or RHW-2EQUIPMENT GROUNDING CONDUCTOR
TAG
1234
5
CONDUIT AND CONDUCTOR SCHEDULE
COND.GAUGEMFG6 AWGMFG12 AWG12 AWG8 AWG 10 AWG
NUMBER OFCONDUCTORSMFG Cable1 BARE CUMFG Cable2-B, 2-R, 2-W1 GREEN1-R, 1-B, 1-W1 GREEN
CONDUITTYPEN/AN/AN/AEMTSAME EMTSAME
CONDUITSIZEN/AN/AN/A¾"SAME¾"SAME
DESCRIPTION PV DC or AC MODULEDC/AC INVERTER (MICRO)J-BOX (IF USED)PV ARRAYAC COMB. PANEL (IF USED)GEN METER (IF USED)AC DISCONNECT (IF USED)SERVICE PANEL
TAG12345678
PART NUMBERAS 360AI-320
N/ASD125SLFORM 2SD223NRBSD200SL
NOTESAMERICAN SOLAR, QUANTITY - 24 (SEE NOTES SHEET FOR DETAILS)320 WATT, SINGLE PHASE (SEE NOTES SHEET FOR DETAILS)6"x6"x4" NEMA 4, PVC JUNCTION BOX2,20-A AC CIRCUITS WITH 12 MICRO-INVERTERS PER CIRCUIT240VAC, 125-A MAIN LUG PANEL4-JAW, 240V CYCLOMETER REGISTER KWH METER IN 100-A BASE240VAC, 60-AMP UNFUSED SWITCH240VAC, 200-A MAIN, 200-A BUS, 40-A INVERTER OCPD
FOR UNUSED MODULESPUT "N/A” in BLANK ABOVE
1
1
3
2
3
EQUIPMENT SCHEDULE
2
MOD__1__
DC
AC
MOD__1__
DC
AC
MOD__1__
DC
AC
MOD__1__
DC
AC
MOD__1__
DC
AC
MOD__1__
DC
AC
J-BOX
4
AC DISCO
BUILDINGGROUNDING ELECTRODE
G
M
UTILITY SERVICE
MAIN SERVICE PANEL
MAINOCPD
INVERTEROCPD
67
8
5
45
G
AC COMBINER PANEL
G
____ MICRO-INVERTERS
IN BRANCH-CIRCUIT
___ MICRO-INVERTERS
IN BRANCH-CIRCUIT
12
12
M

Contractor Name, Address and Phone:
SolarBright2688 Washington St.
Hollywood, FL800-555-1212
Bill
Ted
Notes for One-Line Standard Electrical Diagram for Single-Phase PV Systems
Site Name: Joe and Jane Homeowner Site Address: 2400 Monroe St., Hollywood, FL System AC Size: 7.6 kWac
SIZE FSCM NO DWG NO REV
E1.2a
SCALE NTS Date: SHEET
Drawn By:
Checked By:
MAX POWER-POINT CURRENT (IMP)
MAX POWER-POINT VOLTAGE (VMP)
OPEN-CIRCUIT VOLTAGE (VOC)
SHORT-CIRCUIT CURRENT (ISC)
MAX SERIES FUSE (OCPD)
MAXIMUM POWER (PMAX)
MAX VOLTAGE (TYP 600VDC)
VOC TEMP COEFF (mV/oC or %/oC )
9.1 A
39.4 V
47.4 V
9.7 A
25 A
360 W
1000 V
-0.28
MODULE MAKE
MODULE MODEL
AMERICAN SOLAR
AS-360
PV MODULE RATINGS @ STC
LOWEST EXPECTED AMBIENT TEMPERATURE BASED ON ASHRAE MINIMUM MEAN EXTREME DRY BULB TEMPERATURE FOR ASHRAE LOCATION MOST SIMILAR TO INSTALLATION LOCATION. LOWEST EXPECTED AMBIENT TEMP 5 oC
NOTE FOR ARRAY CIRCUIT WIRING
OCPD = OVERCURRENT PROTECTION DEVICE
NATIONAL ELECTRICAL CODE® REFERENCES SHOWN AS (NEC XXX.XX)
NOTES FOR ALL DRAWINGS:
1) IF UTILITY REQUIRES A VISIBLE-BREAK SWITCH, DOES THIS SWITCH MEET THE REQUIREMENT? YES NO N/A
2) IF GENERATION METER REQUIRED, DOES THIS METER SOCKET MEET THE REQUIREMENT? YES NO N/A
3) SIZE INVERTER OUTPUT CIRCUIT (AC) CONDUCTORS ACCORDING TO INVERTER OCPD AMPERE RATING. (See Table 705.12)
4) DOES TOTAL SUPPLY BREAKERS COMPLY WITH 120% BUSBAR RULE IN 705.12(D) YES NO
*SIGN FOR DC DISCONNECT
SIGN FOR PV SYSTEM DISCONNECT
MAX VOLTAGE
MAX CIRCUIT CURRENT
MAX OUTPUT CURRENT
V
A
A
PHOTOVOLTAIC POWER SOURCE
WARNING: ELECTRICAL SHOCK HAZARD–LINE AND LOAD MAY BE ENERGIZED IN OPEN POSITION
AC OUTPUT CURRENT
NOMINAL AC VOLTAGE
31.9 A
240 V
SOLAR PV SYSTEMDISCONNECT
NOTES FOR INVERTER CIRCUITS :
SIGN FOR DISTRIBUTION PANELSTHIS PANEL FED BY MULTIPLE
SOURCES (UTILITY AND SOLAR)
SIGN FOR NEC 705.12(D)(2)(3)(b) (if used)
WARNING:INVERTER OUTPUT CONNECTION;
DO NOT RELOCATE THIS OVERCURRENT DEVICE.
SIGN FOR NEC 690.12 (for roof-mounted systems)
PHOTOVOLTAIC SYSTEM EQUIPPED WITH RAPID SHUTDOWN
MAX DC VOLT RATING
MAX POWER @ 40oC
NOMINAL AC VOLTAGE
MAX AC CURRENT
MAX OCPD RATING
80 V
320 W
240 V
1.33 A
20 A
INVERTER MAKE
INVERTER MODEL
AMERICAN CONVERTER
AC-320i
INVERTER RATINGS
MAX CURRENT
MAX VOLTAGE
MAXIMUM POWER
MAX OUTPUT CIRCUIT V (TYP 600VDC)
CONVERTER MAKE
CONVERTER MODEL
DC-TO-DC CONVERTER RATINGS (if used)
*NOTE: MICROINVERTER AND AC MODULE SYSTEMS DO NOT NEED DC DISCONNECT SIGN SINCE 690.51 MARKING ON PV MODULE COVERS NEEDED INFORMATION

Waldo Renewable Electric
9369
%
%%
of respondents said online reviews impacted purchase decisions (Solar Power
World/Podium Study)
chose their residential solar installer because they were the most trusted or highest rated (Enphase)
@
"
"
'