put your money where your butt is: a commitment savings ... · prior empirical studies •...
TRANSCRIPT

Put Your Money Where Your Butt Is: A Commitment Savings Account for Smoking Cessation
Xavier GineDean Karlan
Jonathan Zinman

Motivation
• Theories on consumption preference over time:
– Hyperbolic Preferences for addictive substances (Laibson, Thaler, Loewenstein, Rabin, etc….)
– Dual‐self (Fudenberg and Levine)– Models of temptation (Gul and Pesendorfer)
– All similar prediction:– Preference for commitment
– Requires some level of sophistication

Prior Empirical Studies
• Empirical literature on commitment savings– Ashraf, Karlan, and Yin (2006)—Philippines
– Thaler and Benartzi (2004)—U.S.
– Dellavigna and Malmendier (2005)
• Literature on commitment contract on smoking– Paxton (1979; 1980; 1982)—but not a randomized study
• Several more underway– Exercise– weight loss– voting (?) etc.– stickK.com…

CARES Product Design
“Committed Action to Reduce and End Smoking”
• Minimum deposit of 50 pesos ($1.25)• CARES lock box to help clients save daily• No access to the money in the account for 6
months• No interest‐bearing• Weekly deposit collection service (the service stops
if the client fails to deposit for 3 consecutive weeks)
• Must pass a urine test within 1 week of the 6 month maturity date in order to gain access to the
money in the account

CARES Product DesignCARES Lockbox

CARES Product DesignUrine Test—NicCheck
• a semi‐quantitative urine test for cotinine
• Test strips are dipped into a urine sample
• A chemical reaction that changes the test strip’s color
Positive (L‐7)Negative“Passing”
Threshold

CUES Treatment
• Testing the theory of aversive signaling• Pocket‐sized card with anti‐smoking image
• Subjects are encouraged to put the image at places that make them want to smoke
• Over 99% of those who were offered cue cards received them.

Experimental Design
Sample Frame:• Smokers in the vicinity of Butuan
City
• Smokes everyday (identified during the short baseline survey conducted by Green Bank
marketers)
Randomization:• Pre‐randomized survey forms (phase 1 & 2)• Using respondent’s birth date: the residual of
“(dd
+ mm + yy) / 3”
(phase 3)

Project FlowBaseline Survey: Smokers in the target villages
“Do you smoke everyday?”
Yes ‐> Continue with the survey
Phase 1 & 2Check the Randomization
Assignment (under the sticker in
the back of the survey form)
Phase 3‐Take the respondent’s birthday‐Calculate the residual of (dd
+ mm + yy)/3‐1: CARES, 2: CUES, 3: Control
1. CARES Offer
with deposit
collection
2.
CARES Offer
without deposit
collection
3. CUES 4. Control
1. CARES 2. CUES 3. Control
Follow‐Up Visit for Urine Test after 6 months and 12 months

Experimental Design
Interventions Phase 1:Butuan
Phase 2:Butuan
Phase 2:Ampayon
Aug‐Oct
2006
Oct‐Dec2006
Jan‐Jun2007
CARES 1 ‐Pamphlet on smoking cessation‐CARES offer
with deposit collection
45% 15% 33%
CARES 2 ‐Pamphlet on smoking cessation‐CARES offer
without deposit collection
45% 15% ‐‐
CUES ‐Pamphlet on smoking cessation‐Aversive Cue Cards
5% 30% 33%
Control ‐Pamphlet on smoking cessation 5% 40% 33%

Analysis
• Uses two assumptions:1)
Those who did not take the urine tests during the
follow‐up visits continue smoking
2)
CARES clients who did not take the urine tests during the follow‐up visit continue smoking; others
who didn’t take the test have the same quit rate
• Specifications1)
OLS (ITT)
2)
Probit (ITT)
3)
IV/IV‐probit (TOT, using Treatment assignment as a predictor for taking up the product)

Table I: Usage of CARES Bank Account Summary Statistics, Philippine Pesos (P50 = US$1)
# of Accounts Min Average Max Std. Dev(1) (2) (3) (4) (5)
Opening balance 85 50 57.18 410 40.49
# of deposits made into CARES account 85 1 11.75 29 9.35
Balance at 6 months 85 50 551.12 3410 665.01
Balance at 6 months returned to clients (successes) 29 282.75 1079.58 3410 703.37Balance at 6 months forfeited to charity (failures) 56 50 277.45 2657.75 414.62
Proportion of clients who missed 3 deposits & lost deposit collection service 85 0 0.14 1 0.35

Table IIa.1: Summary Statistics, Baseline Variables Baseline Measures
CARES Group
All CARES Cues Controlt-test of
(2) vs (4)t-test of
(3) vs (4) Took upDid Not Takeup
t-test of (7) vs (8)
(1) (2) (3) (4) (5) (6) (7) (8) (9)Female 0.058 0.061 0.599 0.053 0.528 0.609 0.072 0.069 0.905
(0.005) (0.008) (0.010) (0.009) (0.029) (0.010)Age 36.572 36.952 35.671 36.972 0.978 0.102 38.341 37.181 0.465
(0.310) (0.493) (0.547) (0.576) (1.367) (0.520)# cigs per day, past 7 14.532 14.184 15.052 14.462 0.609 0.344 14.122 14.067 0.962
(0.234) (0.350) (0.463) (0.417) (1.105) (0.369)Tried to stop smoking in the past 12 months 0.457 0.446 0.453 0.476 0.275 0.419 0.422 0.427 0.927
(0.011) (0.018) (0.020) (0.020) (0.055) (0.019)Wants to stop smoking sometime in life 0.723 0.725 0.690 0.754 0.223 0.013 0.855 0.723 0.010
(0.010) (0.138) (0.019) (0.351) (0.039) (0.017)
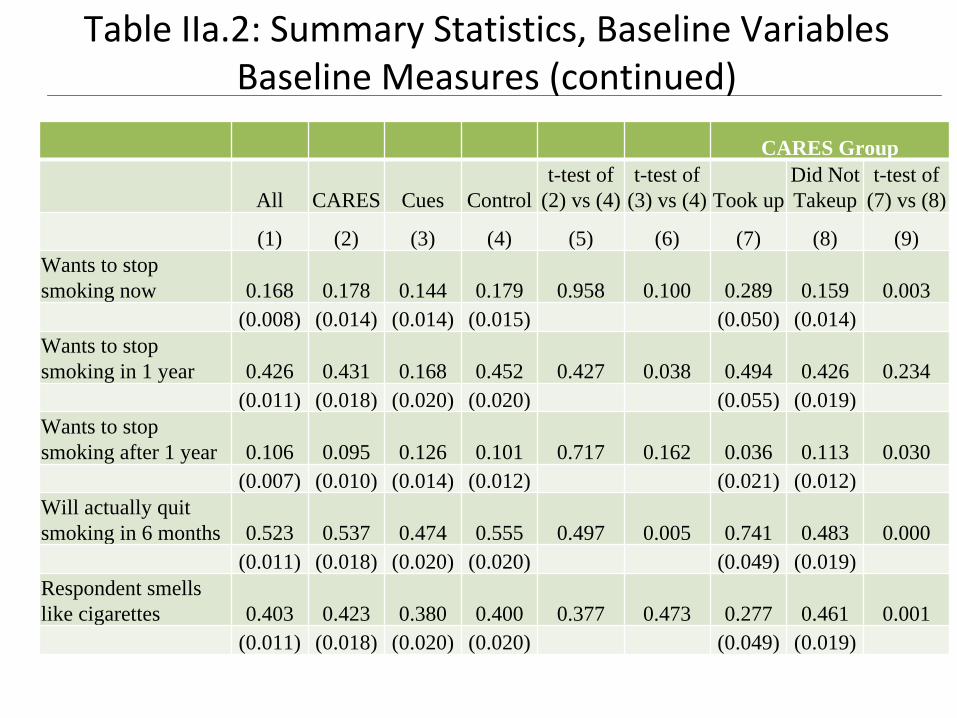
Table IIa.2: Summary Statistics, Baseline Variables Baseline Measures (continued)
CARES Group
All CARES Cues Controlt-test of
(2) vs (4)t-test of
(3) vs (4) Took upDid Not Takeup
t-test of (7) vs (8)
(1) (2) (3) (4) (5) (6) (7) (8) (9)Wants to stop smoking now 0.168 0.178 0.144 0.179 0.958 0.100 0.289 0.159 0.003
(0.008) (0.014) (0.014) (0.015) (0.050) (0.014)Wants to stop smoking in 1 year 0.426 0.431 0.168 0.452 0.427 0.038 0.494 0.426 0.234
(0.011) (0.018) (0.020) (0.020) (0.055) (0.019)Wants to stop smoking after 1 year 0.106 0.095 0.126 0.101 0.717 0.162 0.036 0.113 0.030
(0.007) (0.010) (0.014) (0.012) (0.021) (0.012)Will actually quit smoking in 6 months 0.523 0.537 0.474 0.555 0.497 0.005 0.741 0.483 0.000
(0.011) (0.018) (0.020) (0.020) (0.049) (0.019)Respondent smells like cigarettes 0.403 0.423 0.380 0.400 0.377 0.473 0.277 0.461 0.001
(0.011) (0.018) (0.020) (0.020) (0.049) (0.019)

Table IIa.3: Summary Statistics, Baseline Variables Baseline Measures (continued)
CARES Group
All CARES Cues Controlt-test of
(2) vs (4)t-test of
(3) vs (4) Took upDid Not Takeup
t-test of (7) vs (8)
(1) (2) (3) (4) (5) (6) (7) (8) (9)There are situations that make him/her want to smoke 0.933 0.954 0.912 0.928 0.046 0.292 0.927 0.888 0.285
(0.006) (0.008) (0.012) (0.010) (0.029) (0.012)Tries to avoid areas that make him/her want to smoke 0.571 0.565 0.578 0.573 0.781 0.858 0.658 0.505 0.010
(0.011) (0.018) (0.020) (0.020) (0.054) (0.019)So addicted that s/he needs help to stop smoking 0.525 0.530 0.510 0.532 0.939 0.446 0.582 0.504 0.700
(0.011) (0.018) (0.020) (0.020) (0.055) (0.019)F-statistic [p-value] from regression of assigned group on all of the above baseline variables. 0.410 0.540
[0.9686] [0.8999]Number of observations 2000 781 603 616 83 698

Table III.1: Analysis of CARES Take‐up OLS, Probit
Specifications: OLS Probit(1) (2)
Female -0.034 -0.024(0.041) (0.028)
Age (/100) 0.894** 0.858**(0.405) (0.398)
Age squared (/100) -.010** -0.010**(0.005) (0.005)
Number of cigarettes per day in the past 7 days (/100) 0.153 0.103(0.321) (0.252)
Number of cigarettes per day squared (/100) -0.002 -0.001
(0.007) (0.005)Having tried to stop smoking in the past 12 months -0.034 -0.025
(0.025) (0.019)Wanting to stop smoking sometime in life 0.085 0.062
(0.085) (0.039)Wanting to stop smoking now 0.034 (0.019)
(0.038) (0.028)

Table III.2: Analysis of CARES Take‐up OLS, Probit (continued).
Specifications: OLS Probit(1) (2)
Wanting to stop smoking in 1 year 0.076 0.080(0.080) (0.127)
Wanting to stop smoking after 1 year -0.002 -0.003(0.037) (0.050)
Will actually quit smoking in 6 months 0.116*** 0.114***(0.036) (0.041)
Respondent smells like cigarettes -0.073*** -0.056***(0.024) (0.019)
There are situations that make him/her want to smoke 0.031 0.037(0.039) (0.033)
Try to avoid areas that make him/her want to smoke 0.043 0.039*(0.027) (0.022)
So addicted that s/he needs help to stop smoking 0.034 0.026(0.027) (0.022)
Observations 781 775Mean of dependent variable 0.106 0.107

Table IV: Impact of CARES on Passing Cotinine Urine Test ITT, OLS
Assumptions:
Everyone That Did Not Take The Test Continues Smoking No Assumption
Everyone That Was Found But Refused To Take The Test
Still Smokes
Six Months One Year Six Months One Year Six Months One YearPanel A: Intent-to-Treat Estimates, OLS
CARES Treatment 0.033* 0.035** 0.058** 0.057** 0.041* 0.054**(0.017) (0.018) (0.026) (0.028) (0.024) (0.027)
Cue cards 0.015 0.009 0.022 0.019 0.021 0.019(0.016) (0.016) (0.024) (0.026) (0.023) (0.025)
# of observations 2000 2000 1226 1161 1287 1218
F-test p-value: CARES= Cues 0.302 0.142 0.162 0.184 0.408 0.194R-squared 0.048 0.057 0.068 0.083 0.056 0.081
Mean of dependent variable 0.083 0.089 0.123 0.147 0.119 0.140Include covariates yes yes yes yes yes yes

Table IV: Impact of CARES on Passing Cotinine Urine Test TOT, IV
Assumptions:
Everyone That Did Not Take The Test Continues Smoking No Assumption
Everyone That Was Found But Refused To Take The Test
Still Smokes
Six Months One Year Six Months One Year Six Months One YearPanel B: Treatment on the Treated Estimates, IV
CARES Treatment 0.296** 0.312** 0.646** 0.533** 0.522* 0.509**(0.151) (0.159) (0.270) (0.266) (0.293) (0.253)
Cue cards 0.014 0.008 0.022 0.017 0.021 0.017(0.016) (0.016) (0.024) (0.026) (0.023) (0.025)
# of observations 2000 2000 1226 1161 1287 1218
F-test p-value: CARES= Cues 0.051 0.053 0.016 0.045 0.077 0.044
Mean of dependent variable 0.083 0.089 0.123 0.147 0.119 0.140
Include covariates yes yes yes yes yes yes

Appendix Table I: Impact of CARES Same as Table IV, except using probit model, ITT
Restrictions on sample frame from baseline
questions:
Everyone That Did Not Take The Test Continues Smoking No Assumption
Everyone That Was Found But Refused To Take The Test
Still Smokes(1) (2) (3) (4) (5) (6)
Panel A: Intent to Treat Estimates, Probit
CARES Treatment 0.033** 0.033* 0.061** 0.059** 0.044* 0.055**(0.016) (0.017) (0.027) (0.029) (0.025) (0.028)
Cue cards 0.015 0.009 0.023 0.020 0.022 0.020(0.016) (0.017) (0.027) (0.029) (0.025) (0.028)
# of observations 1993 1989 1225 1155 1286 1212
F-test p-value: CARES = Cues 0.232 0.140 0.140 0.178 0.355 0.192Mean of dependent variable 0.083 0.089 0.123 0.147 0.119 0.140Include covariates no no yes yes yes yes

Appendix Table I: Impact of CARES Same as Table IV, except using probit model, TOT
Restrictions on sample frame from baseline questions:
Everyone That Did Not Take The Test
Continues Smoking No Assumption
Everyone That Was Found But
Refused To Take The Test Still
Smokes(1) (2) (3) (4) (5) (6)
Panel B: Treatment on the Treated Estimates, IV Probit
CARES Treatment 0.385 0.509 0.736*** 0.702*** 0.690* 0.689***(0.367) (0.340) (0.286) (0.223) (0.380) (0.242)
Cue cards 0.014 0.008 0.0238 0.018 0.023 0.018(0.015) (0.017) (0.026) (0.028) (0.025) (0.027)
# of observations 1993 1989 1225 1155 1286 1212
F-test p-value: CARES = Cues 0.153 0.053 0.074 0.025 0.134 0.028Mean of dependent variable 0.083 0.089 0.123 0.147 0.119 0.140Include covariates no no yes yes yes yes

Appendix Table II: Impact of CARES Same as Table IV, except using no covariates, ITT
Restrictions on sample frame from baseline questions:
Everyone That Did Not Take The Test
Continues Smoking No Assumption
Everyone That Was Found But
Refused To Take The Test Still
Smokes(1) (2) (3) (4) (5) (6)
Panel B: Treatment on the Treated Estimates, OLS
CARES Treatment 0.032* 0.034* 0.055** 0.053* 0.038 0.050*(0.017) (0.018) (0.026) (0.028) (0.024) (0.027)
Cue cards 0.017 0.006 0.026 0.015 0.026 0.015(0.017) (0.017) (0.024) (0.027) (0.023) (0.026)
# of observations 2000 2000 1226 1161 1287 1218
F-test p-value: CARES = Cues 0.367 0.103 0.272 0.191 0.612 0.200R-squared 0.007 0.004 0.010 0.006 0.003 0.006Mean of dependent variable 0.083 0.089 0.123 0.147 0.119 0.140Include covariates no no yes yes yes yes

Appendix Table II: Impact of CARES Same as Table IV, except using no covariates, TOT
Restrictions on sample frame from baseline questions:
Everyone That Did Not Take The Test
Continues Smoking No Assumption
Everyone That Was Found But
Refused To Take The Test Still
Smokes(1) (2) (3) (4) (5) (6)
Panel B: Treatment on the Treated Estimates, IV
CARES Treatment 0.286* 0.303* 0.620** 0.486* 0.469 0.458*(0.148) (0.157) (0.272) (0.264) (0.286) (0.250)
Cue cards 0.016 0.005 0.026 0.014 0.025 0.014(0.016) (0.016) (0.024) (0.026) (0.023) (0.025)
# of observations 2000 2000 1226 1161 1287 1218
F-test p-value: CARES = Cues 0.057 0.047 0.024 0.063 0.109 0.064Mean of dependent variable 0.083 0.089 0.123 0.147 0.119 0.140Include covariates no no yes yes yes yes

Appendix Table III: Impact of CARES, ITT Same as Table IV, Sub‐Sample Restriction from Baseline:
Respondent Reported Wanting to Stop Smoking at Some Point in Life
Restrictions on sample frame from baseline questions:
Everyone That Did Not Take The Test
Continues Smoking No Assumption
Everyone That Was Found But
Refused To Take The Test Still
Smokes(1) (2) (3) (4) (5) (6)
Panel B: Treatment on the Treated Estimates, OLS
CARES Treatment 0.045** 0.034 0.085*** 0.064* 0.062** 0.058*(0.020) (0.021) (0.031) (0.035) (0.028) (0.033)
Cue cards 0.032* -0.001 0.053* 0.006 0.049* 0.004(0.019) (0.020) (0.028) (0.032) (0.027) (0.031)
# of observations 1434 1434 853 824 898 865
F-test p-value: CARES = Cues 0.517 0.094 0.332 0.102 0.679 0.111R-squared 0.063 0.066 0.095 0.100 0.075 0.097Mean of dependent variable 0.074 0.099 0.108 0.161 0.105 0.155Include covariates no no yes yes yes yes

Restrictions on sample frame from baseline questions:
Everyone That Did Not Take The Test
Continues Smoking No Assumption
Everyone That Was Found But
Refused To Take The Test Still
Smokes(1) (2) (3) (4) (5) (6)
Panel B: Treatment on the Treated Estimates, IV
CARES Treatment 0.343** 0.259 0.865*** 0.507* 0.716** 0.457*(0.146) (0.162) (0.298) (0.279) (0.321) (0.265)
Cue cards 0.032* -0.001 0.058** 0.006 0.053* 0.004(0.019) (0.020) (0.029) (0.032) (0.028) (0.031)
# of observations 1434 1434 853 824 898 865
F-test p-value: CARES = Cues 0.026 0.090 0.005 0.061 0.032 0.074Mean of dependent variable 0.074 0.066 0.108 0.161 0.105 0.155Include covariates no no yes yes yes yes
Appendix Table III: Impact of CARES, TOT Same as Table IV, Sub‐Sample Restriction from Baseline:
Respondent Reported Wanting to Stop Smoking at Some Point in Life

Summary Results
• 83 out of 781 (11%) individuals offered CARES signed a contract.
• Few take‐ups among those who were offered CARES without deposit collection services
• Intent‐to‐treat effect of 3.1 percentage points (38.8% increase in the likelihood of passing the urine test)
• Slightly highly impact among those who reported that they wanted to quit smoking.
• Treatment‐on‐the‐treated effect of 28.7 percentage points

Future Studies
• Specific contract features– Savings box– Deposit collection
• Wider implementation questions– How to market effectively and clearly
– Refereeing system– Marketing

Table IIb: Summary Statistics, Outcome Variables Outcome Measures, Full‐Sample, Six Months
Treatment Assignment Groups
All CARES Cues Controlt-test of
(2) vs (4)t-test of
(3) vs (4)
(1) (2) (3) (4) (5) (6)Found by surveyor for follow-up measurement 0.634 0.642 0.629 0.629 0.596 0.982
(0.011) (0.017) (0.020) (0.019)Agreed to take urine test, conditional on being found 0.952 0.932 0.963 0.968 0.015 0.737
(0.006) (0.012) (0.009) (0.009)Passed urine test (omitted missing respondents) 0.153 0.181 0.153 0.124 0.023 0.316
(0.010) (0.019) (0.010) (0.016)Passed urine test (assumes allrespondents who did not take the 0.093 0.108 0.093 0.075 0.033 0.355test are smokers) (0.007) (0.011) (0.006) (0.011)
# of CARES accounts 85 83 2 0Number of observations 2001 781 603 616
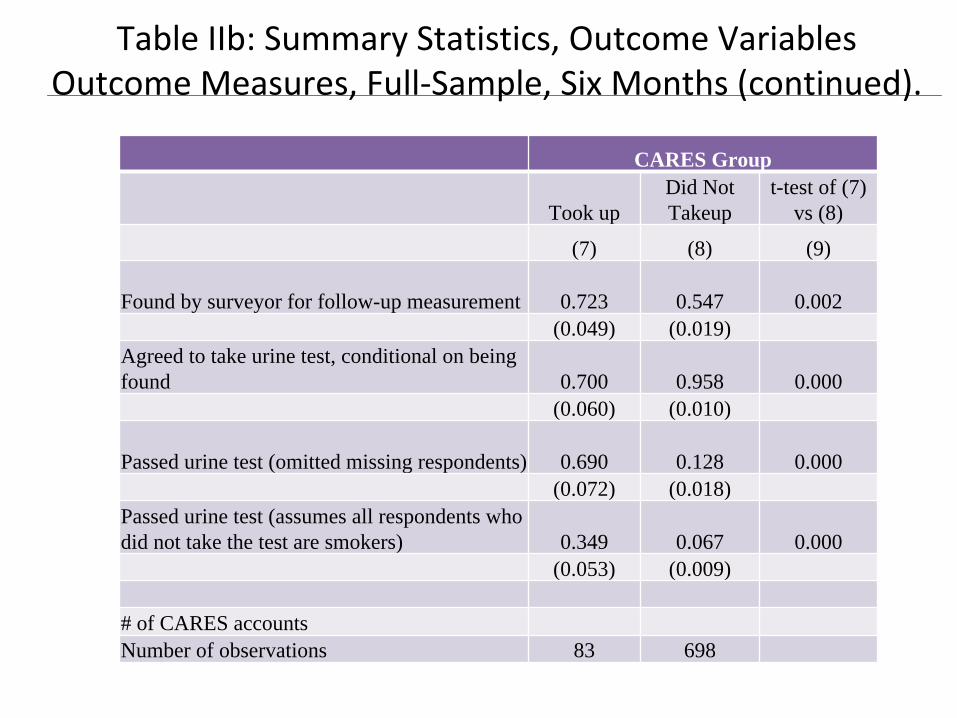
Table IIb: Summary Statistics, Outcome Variables Outcome Measures, Full‐Sample, Six Months (continued).
CARES Group
Took upDid Not Takeup
t-test of (7) vs (8)
(7) (8) (9)
Found by surveyor for follow-up measurement 0.723 0.547 0.002(0.049) (0.019)
Agreed to take urine test, conditional on being found 0.700 0.958 0.000
(0.060) (0.010)
Passed urine test (omitted missing respondents) 0.690 0.128 0.000(0.072) (0.018)
Passed urine test (assumes all respondents who did not take the test are smokers) 0.349 0.067 0.000
(0.053) (0.009)
# of CARES accountsNumber of observations 83 698

Table IIb: Summary Statistics, Outcome Variables Outcome Measures, Full‐Sample, One Year
Treatment Assignment Groups
All CARES Cues Controlt-test of
(2) vs (4)t-test of
(3) vs (4)
(1) (2) (3) (4) (5) (6)Found by surveyor for follow-up measurement 0.596 0.615 0.578 0.590 0.339 0.670
(0.011) (0.017) (0.201) (0.020)Agreed to take urine test, conditional on being found 0.949 0.948 0.941 0.958 0.489 0.280
(0.006) (0.010) (0.012) (0.010)Passed urine test (omitted missing respondents) 0.181 0.203 0.155 0.178 0.372 0.389
(0.011) (0.019) (0.019) (0.020)Passed urine test (assumes allrespondents who did not take the 0.103 0.118 0.084 0.101 0.296 0.313test are smokers) (0.007) (0.012) (0.011) (0.012)
# of CARES accounts 85 83 2 0Number of observations 2001 781 603 616

Table IIb: Summary Statistics, Outcome Variables Outcome Measures, Full‐Sample, One Year (continued).
CARES Group
Took upDid Not Takeup
t-test of (7) vs (8)
(7) (8) (9)
Found by surveyor for follow-up measurement 0.723 0.547 0.001(0.049) (0.019)
Agreed to take urine test, conditional on being found 0.984 0.939 0.157
(0.016) (0.012)
Passed urine test (omitted missing respondents) 0.350 0.175 0.002(0.062) (0.020)
Passed urine test (assumes all respondents who did not take the test are smokers) 0.253 0.093 0.000
(0.048) (0.011)
# of CARES accountsNumber of observations 83 698

Appendix Table 1.1: Impact of CARES Same as Table IV, except using probit model, ITT
Assumptions:
Everyone That Did Not Take The
Test Continues Smoking No Assumption
Everyone That Was Found But Refused To Take The Test
Still Smokes
All CARES Clients Who Did Not Take The Test Continue
Smoking
Six Months One Year
Six Months
One Year
Six Months One Year Six Months
Panel B: Treatment on the Treated Estimates, IV
CARES Treatment 0.296** 0.312** 0.646** 0.533** 0.522* 0.509** 0.560(0.151) (0.159) (0.270) (0.266) (0.293) (0.253) (0.402)
Cue cards 0.014 0.008 0.022 0.017 0.021 0.017 0.021(0.016) (0.016) (0.024) (0.026) (0.023) (0.025) (0.023)
# of observations 2000 2000 1226 1161 1287 1218 1289F-test p-value:
CARES = Cues 0.051 0.053 0.016 0.045 0.077 0.044 0.169Mean of dependent
variable 0.083 0.089 0.123 0.147 0.119 0.140 0.119
Include covariates yes yes yes yes yes yes yes

Appendix Table 2.1: Impact of CARES Dropping non‐CARES clients who did not take the urine test, ITT
Restrictions on sample frame from baseline questions: Full sample
Wants to quit smoking
sometime in their lives
There are situations that make him/her want to smoke
(1) (2) (3) (4) (5) (6)Panel A: Intent-to-treat estimates, OLS
CARES Treatment 0.026 0.031 0.047* 0.052* 0.030 0.034(0.024) (0.024) (0.028) (0.028) (0.024) (0.024)
Cue cards 0.028 0.024 0.058** 0.057** 0.028 0.025(0.024) (0.024) (0.029) (0.028) (0.024) (0.024)
# of observations 1273 1273 894 894 1255 1255F-test p-value: CARES = Cues 0.94 0.77 0.74 0.88 0.96 0.71R-squared 0.00 0.05 0.01 0.07 0.00 0.05Mean of dependent variable 0.12 0.12 0.11 0.11 0.12 0.12
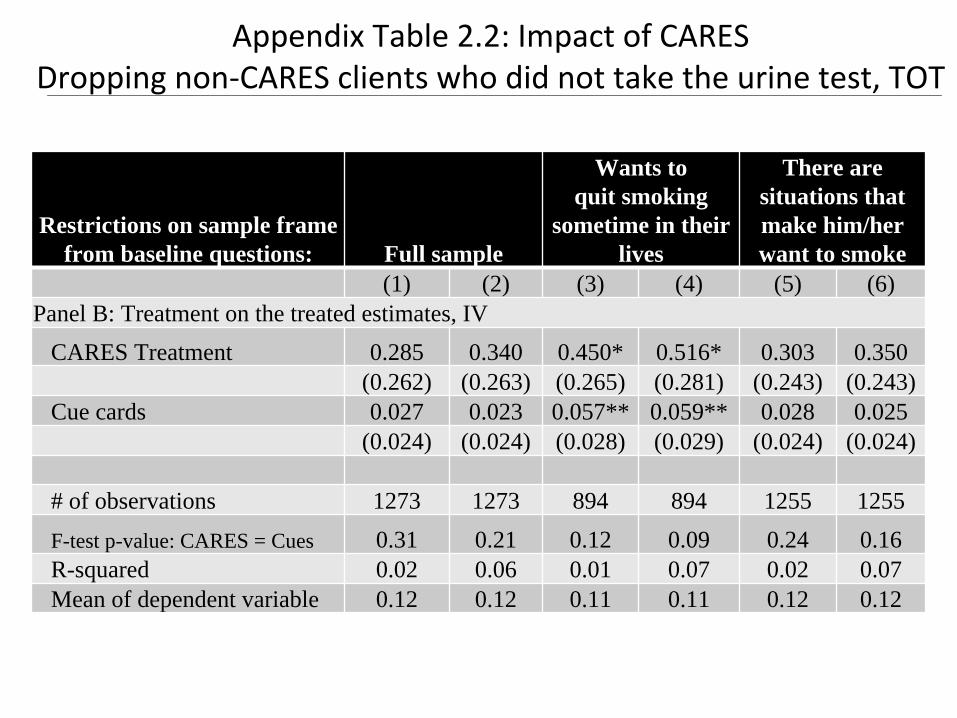
Appendix Table 2.2: Impact of CARES Dropping non‐CARES clients who did not take the urine test, TOT
Restrictions on sample frame from baseline questions: Full sample
Wants to quit smoking
sometime in their lives
There are situations that make him/her want to smoke
(1) (2) (3) (4) (5) (6)Panel B: Treatment on the treated estimates, IV
CARES Treatment 0.285 0.340 0.450* 0.516* 0.303 0.350(0.262) (0.263) (0.265) (0.281) (0.243) (0.243)
Cue cards 0.027 0.023 0.057** 0.059** 0.028 0.025(0.024) (0.024) (0.028) (0.029) (0.024) (0.024)
# of observations 1273 1273 894 894 1255 1255F-test p-value: CARES = Cues 0.31 0.21 0.12 0.09 0.24 0.16R-squared 0.02 0.06 0.01 0.07 0.02 0.07Mean of dependent variable 0.12 0.12 0.11 0.11 0.12 0.12