purpose of report - king county, washington
TRANSCRIPT

King County Lake Monitoring Report
Sect
ion
1
Intro
duct
ion
Purpose of ReportThis report is the ninth in a series that summarizes data collected byvolunteer lake monitors annually. This volume, covering water year2003 (October 2002 through September 2003) and extending intoOctober 2003 for water quality measurements, provides citizens,scientists, lake managers, and other interested individuals withcurrent information on King County lake water quality and physicalconditions for lakes monitored by participating citizens.
For many lakes, these data represent the only reliable source ofinformation for assessing current water quality and addressingquestions regarding the characteristics of a particular lake. Theinformation in this report can help to guide lake protection andstewardship activities in King County and can be used to plan furtherwork to address specific questions about a lake’s conditions.
Report LayoutWhile content has remained substantially the same as in the past, the2003 report has been reorganized to make the information moreaccessible as a Web-based publication. The new format includesthree sections, which will be available for downloading on the LakeStewardship Web site at http://dnr.metrokc.gov/wlr/waterres/smlakes/reports.htm. Section 1 unites the introduction and methods chapterfrom earlier reports, but omits the extensive discussion of processesin lakes and human impacts that was repeated annually. Section 2contains annual and comparative climatic information and theregionally-based reporting, analyses, and comparisons that wereformerly found in Chapter 5. Section 3 combines the individual lakereports from the former Chapter 3 with Appendices A and B. All ofthe data tables, charts, and discussion for each lake will be includedin subsections that are divided by lake, available for downloading onan individual basis. The chapter on freshwater algae has beenomitted, since it also was repeated annually. Appendix C, whichcontained lake bathymetric maps, will now be available on the Website to download as needed. Plans are being made to combine deleted
1

King County Lake Monitoring Report
portions with regionally specific information ongeography, geologic history, and biology into aguidebook for King County Lakes that will notneed annual updating.
Why Monitor?The specific data that is collected on lakes variesfrom one program to another, depending on thechosen objectives of the program. For the KingCounty Lake Stewardship Program, theoverarching objectives of data collection haveincluded: (1) gathering baseline data andassessing long-term trends, particularly for lakesthat do not have other organized assessmentefforts focused on them; (2) defining seasonaland water column variability over time toestablish normal ranges; (3) identifying potentialproblems, proposing possible managementsolutions and alternatives, or pinpointingadditional studies to be made to accomplish suchgoals; (4) educating lake residents, lake users,and policy makers regarding lake water qualityand its protection; and (5) providing a solid,reliable, cost-effective foundation of knowledgethat can be used for long-term stewardship ofKing County lakes.
Every lake is a unique body of water, reflectingthe characteristics and hydrology of thewatershed. Water quality is affected by thesources and relative quantity of water inflows,including the amounts and types of nutrientsoriginating from the watershed, in particularnitrogen and phosphorus. For example, when thesurface area of a lake represents a relatively largepercentage of the total watershed, much of theprecipitation falling in the basin goes directlyinto the lake, not passing first through soils,wetlands or constructed drainage systems. Thus,in this case relatively pure water makes up asignificant proportion of the total input to thelake. In other cases where direct precipitationmakes up a smaller proportion of the water input,land use practices throughout the watershedbecome very important influences on conditionsas well as changes within lakes.
Water chemistry and physical characteristics inlakes vary seasonally as well as by depth at certaintimes of the year. The most dynamic period forlakes is during the “growing season” of mid-springthrough early autumn when lake dwellingorganisms are most active. This coincides withmuch of the primary recreational period for lakesin the Pacific Northwest.
Most of the more than 700 lakes and ponds inKing County have never been monitored, and onlya few have long term monitoring records. In 2003,the Lake Stewardship Program staff worked withvolunteer monitors in the collection of Level I dataon 38 lakes and Level II data on 51 lakes.Volunteers on 36 lakes completed five or moreyears of water quality monitoring, thus building asolid body of information for use in the future.
The Program has focused on the monitoring ofwater chemistry in the upper water layers duringthe growing season in order to characterize laketrophic state. However, during the summer, waterchemistry and temperature vary with depth in mostlakes. As funds have allowed, additional samplinghas been performed to characterize the waterchemistry of the deeper lake layers. This verticalsampling has provided data that is useful inunderstanding the general nutrient cycling andwater column relationships in individual lakes. Ontwo dates in water year 2003, Level II sampleswere collected from the surface, middle, and onemeter above the bottom in the deepest part of thelake to define changes found in the verticalprofiles of the parameters.
Land use analysis of 2002 aerial photographs wasconducted for the catchment basins of the smalllakes monitored in 2003, as part of an internshipwork program. The work as a whole will be postedas a report on the Lake Stewardship Program Website when completed (Nora Kammer, 2004), butpertinent data were included with the discussion ofthe individual lake results for the year and aregional chart comparing land use for all the lakeshas been included in Section 2.
2
King County Lake Monitoring Report
Program Summary and OutlookThe 2003 monitoring program, which ran fromOctober 2002 through October 2003, representedthe ongoing effort by King County to expand theinformation available on the smaller lakes withinits boundaries. The program attempted tomaximize limited resources amid the changingjurisdictions within King County, while the staffremained committed to making the most of thevolunteer monitors’ time and effort. Changes maycontinue to occur for both the methods ofcollection and reporting as adjustments are madein response to volunteer requests and staffobservations. Some parameters may bediscontinued, while others may be added to theprogram if the information gained is consideredto be important in assessing the condition of thelakes.
The Lake Stewardship Program’s Web site,http://dnr.metrokc.gov/wlr/waterres/smlakes,continues to feature lake managementinformation, as well as electronic copies of manyof our publications. In addition, the sitehighlights the efforts of our volunteer monitorsand provides information to people interested injoining the data collection program. Due tobudget cutbacks, paper copies of the annualreport may be discontinued except for regionallibraries, as well as a set of selected portions tobe mailed to volunteer monitors. The entire reportwill continue to be available to download for ourWeb site.
Previous versions of the annual report havefeatured a section in the introduction whichincluded a discussion of many important physicaland biological processes in lakes, including noteson how development of land within watershedsand expanding human activities can impact lakeecosystems. Rather than the repeated publicationof the same material every year, the program hasplanned to publish a regional guidebook thatincludes the information in the future. However,in the interim please refer to past editions of thisreport to find such information. These can befound on the Lake Stewardship Program Web site(referenced in the previous paragraph) under the
publications link or alternatively, paper copies areavailable at King County regional libraries.
The Lake Stewardship Program staff providesvolunteers with technical assistance and answersto questions relating to limnological processes andconditions found at specific lakes. Please give us acall with concerns and feedback. We always enjoyhearing from you.
MethodsVolunteer monitors sampled 53 lakes for the LakeStewardship Program in water year 2003 (Fig 1-1).Aside from Lake Sammamish, lakes sampledranged in surface area from 10 acres to 279 acresand in maximum depth from seven feet to 98 feet.Lake Sammamish has a maximum depth of 105feet and a surface area of 4,893 acres. These lakesspanned all trophic classifications and degrees ofurbanization in their watersheds.
The Lake Stewardship Volunteer MonitoringProgram is split into two levels of data collection:Level I and Level II. Throughout the year, theLevel I participants measure precipitation, lakelevel, surface water temperature, and clarity(Secchi depth). The Level II participants collectwater samples for water quality analysis, whilealso measuring water temperature and clarity, fromthe end of April through October.
Level I Data CollectionLevel I data collection occurs both daily andweekly, and is compiled by water year, whichbegins with October and ends in September. Thewater year differs from the calendar year becauseit is based on annual precipitation and hydrologicpatterns.
In water year 2003, 34 lakes participated in theLevel I program for most or all of the water year.For several lakes, volunteers were not able tocomplete this commitment or were recruited laterin the year, so the data are incomplete.
3

King County Lake Monitoring Report
Figure 1-1: Lake locations for western King County
4

King County Lake Monitoring Report
Figure 1-2: How lake samples are collected and processed
STEP 4:Phytoplankton Sample AnalysisPhytoplankton samples are mailed toWater Environmental Services, Inc., aconsulting group, that then identifiesalgae in each sample, measures cellsizes and estimates numbers. The dataare summarized and sent to the county tobe entered into spreadsheets for analysisand graphing. The consultant cleans thesample bottles and returns them to KingCounty for re-use.
STEP 3: Environmental Lab AnalysisData sheets and water samples forchemistry analysis are delivered andlogged into the King County Environmen-tal Laboratory. Sample dates and timesare checked for consistency. Any unusualconditions are noted.
STEP 2: Pick-UpLake Stewardship Program staff pick upsamples and data sheets from volunteers’homes and leave new bottles for the nextsample date. Phytoplankton samples arepreserved at the time of pick up andsamples are kept cool and protected. Anyunusual conditions are noted.
STEP 7: Data ReviewUsing the King County database, LakeStewardship Program staff review datafor entry errors and internal consistencyon a lake-by-lake basis. Anomalies arediscussed with the Environmental Laband if necessary, samples are re-analyzed.
STEP 6: Data Entry & StorageAfter lab analysis, all sample values areexamined for consistency. Once itsquality is assured, data are entered intoa King County database for furtheranalysis. The time between receivingsamples and database entry is less than30 days. Excess water samples arefrozen and kept for 90 days, for furtheranalysis as needed.
STEP 1: SamplingVolunteer lake monitors collect observa-tional data and water quality samples onan assigned day. They use prelabeled,clean bottles provided by the LakeStewardship Program.
STEP 5: Quality ControlThe lab chemistry staff follow strictprotocol for sample holding times andquality assurance of chemical analysis.Staff include “blanks,” “standards,” and“spikes,” — predetermined samplevalues — in all batches being analyzedto test reliability of the chemical analysesand ensure quality.
STEP 8: Data ReportingAt the end of the season, sample valuesare finalized for the year. Graphs aremade of the data parameters and com-pared with previous years, with theresults published herein. The KingCounty Lake Monitoring Report is distrib-uted to volunteers, libraries, scientists,government and environmental agenciesand other stakeholders interested in thewater quality of King County’s smalllakes.
5

King County Lake Monitoring Report
Lake level and precipitation measurements wererecorded daily by volunteers. Lake level wasrecorded by reading a gauge (a porcelain-glazedaluminum metric ruler) attached permanently to arigid dock or other fixed structure in the lake,usually near the volunteer’s home. Often themeter sticks have not been calibrated toelevation, so the measurements are relative to thestick position rather than sea level. Precipitationwas collected in a plastic rain gauge installed inan area exposed to direct rainfall and away fromoverhanging objects such as trees or buildings.
Water clarity (Secchi depth) and surface watertemperature were measured weekly. Secchi depthgenerally was measured over the lake’s deepestpoint (Wolcott 1961, USGS 1976). The methodinvolves lowering an eight-inch disk painted withalternating black and white quadrants over theshaded side of the boat until the disk disappearsfrom view, then lifting it until it reappears again.The depths at each point are noted and, ifdifferent, are averaged.
Volunteers measured water temperature at thesame location as Secchi depth. The method calledfor submerging a Celsius thermometer in thewater to about one meter below the water surfacefor two minutes, then bringing it to the surfaceand reading the temperature to the nearest 0.5degrees. Further details on Level I volunteermonitoring sampling methods are supplied in theLake Stewardship Program Volunteer LakeMonitor 2003 Sampling Manual (King County2003).
Daily data are transformed either by summation(precipitation) or by averaging (water levels) intoweekly values when all or nearly all daily valueswere measured, while the parameters measuredweekly are reported directly (Section 3). Alloriginal data are available upon request to KingCounty Water and Land Resources Division.
Level II Data CollectionLevel II volunteer monitoring activities wereperformed every two weeks from late Aprilthrough October on a predetermined schedule.
Water samples were collected at one meter depthon every sampling date, and volunteers alsocollected deeper samples twice during the period,usually at mid-depth as well as at one meter fromthe lake bottom.
In water year 2003, 51 lakes had volunteers whoparticipated in the Level II program. For mostlakes, volunteers were able to collect data for theentire period (May through October). Gaps andanomalies are noted by lake in the individual text.A flow chart of the sampling process has beenincluded to show how samples are treated aftercollection (Fig 1-2).
Volunteers anchored at a specified location,generally over the lake’s deepest point. For eachdate, volunteers recorded the time and weather,as well as making observations on unusualconditions or activities on the lake. Secchi depthwas measured using the same methods asdescribed for Level I. Water samples werecollected using a Van Dorn vertical water samplerat one meter depth. Temperature was read from athermometer installed inside the sampler, afterwhich water was saved in special containers forfurther analysis, generally for total phosphorus,total nitrogen, chlorophyll a, and phytoplankton.
On the two dates when vertical profiles weresampled, samples were taken at one meter, mid-depth, and one meter from the lake bottom.Temperature was measured at each depth usingthe thermometer mounted inside the sampler, andwater samples for total phosphorus and totalnitrogen were collected at all three depths.Chlorophyll a and phytoplankton analyses weregenerally collected for the one meter and mid-depth samples only, but there were someexceptions in cases when the bathymetry orhistory of the lake suggested that large deepwater phytoplankton concentrations might occur.
The water samples were analyzed at the KingCounty Environmental Laboratory (approved bythe Environmental Protection Agency) for totalphosphorus, total nitrogen, and chlorophyll a,using standard protocols and quality assuranceand quality control procedures. Phytoplankton(algae) identifications and enumerations were
6
King County Lake Monitoring Report
carried out by a private consultant to the LakeStewardship Program.
Physical and chemical values for each date aredetailed in Section 3. Phytoplankton data forindividual dates are available upon request.Further details on Level II volunteer monitoringsampling methods are described in the LakeStewardship Program Volunteer Lake Monitor2002 Sampling Manual (King County 2003).
Data AnalysisMinimum, maximum, and average values fortemperature and Secchi depth were determinedfor the Level I volunteer monitoring data. Annuallake level range and total precipitation weredetermined for each participating lake withcomplete data sets. The data are illustrated incharts for each individual lake (Section 3).
For Level II water quality measurements, theminimum, maximum, and average values weredetermined for the sampling period. The valuesfound throughout the sample season are chartedfor each lake, with total nitrogen and totalphosphorus on the same chart for comparison(Section 3).
The Trophic State Index or TSI (Carlson 1977)and the nitrogen to phosphorus ratios (N:P) werecalculated for Level II volunteer monitoring data.TSI values are derived from a regression thatcompared values of a parameter such as totalphosphorus, chlorophyll a or Secchi transparencyto the algal bio-volume of a suite of lakes andassigned a number on a scale of 0 to 100, basedon the relationship found. This scale can be usedto compare water quality over time and betweenlakes (see discussion in Section 2C and data forindividual lakes in section 3). If nutrientlimitation of algal growth is likely to occur, thenitrogen to phosphorus ratio may be used toidentify the nutrient that is in shortest supply.Generally lakes with an N:P ratio of less than 20may be experiencing limitations by both nitrogenand phosphorus at times during the growingseason. The results of these analyses for the lakesare presented in both Section 2 and Section 3.
7

King County Lake Monitoring Report8

King County Lake Monitoring Report
Sect
ion
2
Regi
onal
Ass
essm
ent
SECTION 2A: CLIMATE AND HYDROLOGY
IntroductionRegional water quality patterns found in the lakes of the inhabitedareas of King County can be produced by comparing the data fromall the lakes in water year 2003, as well as examining data for eachlake over time. In addition, because of the wide range in localrainfall received through the year, measuring precipitation at eachlake makes it possible to look at particular changes in lake levelrelative to the rainfall received in that watershed. Level Imonitoring data on precipitation, water levels, and Secchitransparency (water clarity) are compared for all the lakesmeasured in 2003, including Lake Sammamish. The discussion ofLevel II monitoring covers the similar comparisons for averagephosphorus and chlorophyll, Trophic State Indices (TSI), andnitrogen to phosphorus ratios.
PrecipitationWhile Level I volunteer monitors collected precipitation data at 38lakes throughout King County in water year 2002, only 22 lakeshad comprehensive rainfall records for the period. If theprecipitation records for a lake had some gaps, but had data for atleast 330 days, estimated values for the missing days were insertedby averaging all available data from the other lake sites in thecounty for that day. Discussion of the data set as a whole is limitedto the 22 lakes with the most complete data.
Water Year 2003 Precipitation DataThe sum of accumulated rainfall at Sea-Tac International Airportfor the 2003 water year totaled 822 millimeters (mm), which isbelow the 50-year average of 972mm. This can be visualized bycomparing it to the last six years and to the mean accumulation
9

King County Lake Monitoring Report
Figure 2-1: Comparative cumulative rainfall for SeaTac weather station, 1996-2003
0
300
600
900
1200
1500
Beav
er 2
Bore
n
Cot
tage
East
er
Fran
cis
Gen
eva
Gra
ss
Hal
ler
Joy
Kath
leen
Mar
cel
Mar
gare
t
McD
onal
d
Mirr
or
Hol
m (N
eils
on)
Pine
Pipe
Shad
y
Sprin
g
Trou
t
Twel
ve
Wild
erne
ss
Tota
l pre
cipi
tatio
n (m
m)
SeaTac 50 year average
Figure 2-2: Total rainfall at individual lakes for WY 2003
SeaTac weather station: water years
0
300
600
900
1200
1500
Oct Nov Dec Jan Feb Mar Apr May Jun Jul Aug Sep
mm
cum
ulat
ive
rain
fall
- - - 50-yr avg
1996
1999
1997
2002
2001
20001998
2003
10

King County Lake Monitoring Report
rate for the last 50 years at the Sea-Tac weatherstation (Fig. 2-1). The accumulation rate overthe 2003 water year remains below the averageconsistently throughout the entire year, verysimilar to 1998, but substantially higher thanwater year 2001, which was one of the lowesttotals on record.
Annual precipitation totals for water year 2003for the 22 lake sites when compared to that forSea-Tac (Fig. 2-2) show that almost all the lakesites received greater precipitation than theinternational airport site (solid line acrosschart). The differences between the varioussites illustrate the influence that location has onboth daily and annual precipitation values. Avariety of factors, including rain gaugeplacement, adherence to protocols, localtopography and storm cell intensity, as well asthe patterns of weather movement between theOlympic and the Cascade Ranges (the“convergence zone”), all influence theprecipitation recorded at each location.
If the monthly totals for each lake during theyear are plotted together with the Sea-Tac dataon a single chart (Fig. 2-3), it becomes clearthat the Sea-Tac station ranks in the lowerrange of the monthly precipitationaccumulations recorded at all the locationscovered by King County volunteers in 2003.
Lake LevelFluctuations of water level in lakes are affectedboth directly and indirectly by areaprecipitation. Other major influences include:(1) watershed size (also called the “catchmentbasin”); (2) land use within the watershedboundaries; (3) vegetation types and coverage;(4) nearby or adjacent wetlands; (5) soilstructures and types, as well as specific geologyof the area; (6) surface and subterraneanhydrology; (7) outlet type or structure, with orwithout management; and (8) the volume ofwater the lake holds relative to the size of thewatershed that receives the rain. These factorscombine to give each lake a pattern of waterlevel change that is unique.
Nonetheless, some common fluctuationpatterns can be found among lakes. In general,lakes in urbanized watersheds commonlyrespond to precipitation events more quicklyand have greater fluctuations in water levelthan lakes in undeveloped watersheds. This islargely due to the increase in impervioussurfaces, as well as the collection andchannelization of surface runoff for quickremoval from developed properties. Lakes withlarge watersheds may have a delayed responseto precipitation because of the distance thatrunoff travels before entering the lake. Lakeswith large surface areas or volumes relative tothe size of the watershed are often lessresponsive than other lakes in general becausethey do not receive very much water from astorm event relative to the volume they alreadycontain.
Sometimes other factors become important inwater level changes. Beavers building dams onoutlet streams can keep lake levels highthrough the summer, while human destructionof such dams can cause sudden drops in waterlevel and unexpected surges of waterdownstream. Adjustable heights of weirs onoutlet streams can also account for unusualpatterns in lake levels.
Lake Level Fluctuations 2003Seasonal fluctuations in lake levels wereobserved at most of the lakes with completedata sets. Water levels were typically at thelowest stand during fall (the end of the wateryear) and steadily increased during late fall/early winter as precipitation increased (seeSection 3 for individual lake results). Duringthe fall and winter, many lakes also showed thegreatest fluctuation in daily lake level readings,as storm runoff from watersheds with saturatedsoils quickly flowed to the lakes instead ofpercolating through soil horizons. This type ofrunoff pattern caused peaks in water levels tomirror large precipitation events closely, whichcan be seen in records for individual lakes.
11

King County Lake Monitoring Report
0
100
200
300
400
500
1
monthly total precipitation
mm
rain
fall
SeaTac weather station
Figure 2-3: Monthly rainfall totals
Figure 2-4: Annual water level range for 1999-2003
0
40
80
120
Am
es
Ang
le
Bea
ver 2
Bor
en
Cot
tage
Des
ire
Fran
cis
Gen
eva
Gra
ss
Hal
ler
Hol
m(N
eils
on)
Lake
Lev
el (c
m)
0
40
80
120
Pin
e
Saw
yer
Sha
dow
Sha
dy
Spr
ing
Ste
el
Trou
t
Twel
ve
Wel
com
e
Wild
erne
ss
Lake
Lev
el (c
m)
1999 2000 2001 2002 2003
0
40
80
120
Joy
Kat
hlee
n
Kill
arne
y
Leot
a
Mar
cel
Mar
gare
t
McD
onal
d
Mer
idia
n
Mirr
or
Mor
ton
Nor
th
Lake
Lev
el (c
m)
12
King County Lake Monitoring Report
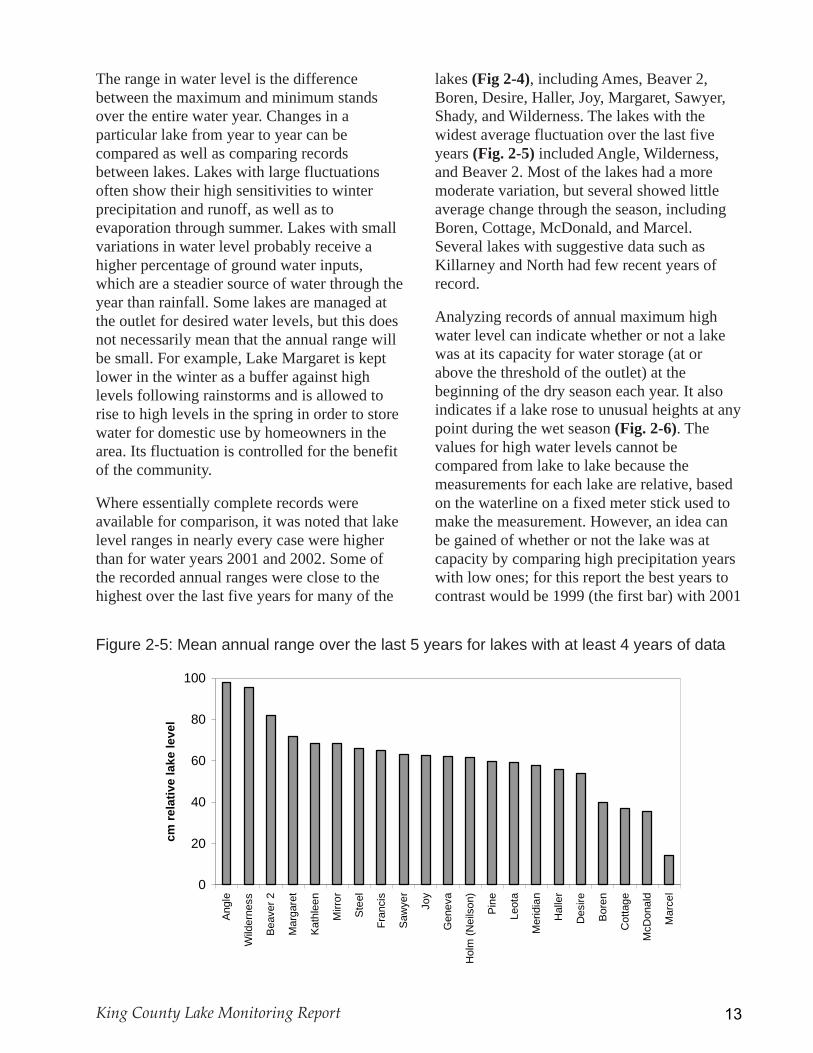
The range in water level is the differencebetween the maximum and minimum standsover the entire water year. Changes in aparticular lake from year to year can becompared as well as comparing recordsbetween lakes. Lakes with large fluctuationsoften show their high sensitivities to winterprecipitation and runoff, as well as toevaporation through summer. Lakes with smallvariations in water level probably receive ahigher percentage of ground water inputs,which are a steadier source of water through theyear than rainfall. Some lakes are managed atthe outlet for desired water levels, but this doesnot necessarily mean that the annual range willbe small. For example, Lake Margaret is keptlower in the winter as a buffer against highlevels following rainstorms and is allowed torise to high levels in the spring in order to storewater for domestic use by homeowners in thearea. Its fluctuation is controlled for the benefitof the community.
Where essentially complete records wereavailable for comparison, it was noted that lakelevel ranges in nearly every case were higherthan for water years 2001 and 2002. Some ofthe recorded annual ranges were close to thehighest over the last five years for many of the
lakes (Fig 2-4), including Ames, Beaver 2,Boren, Desire, Haller, Joy, Margaret, Sawyer,Shady, and Wilderness. The lakes with thewidest average fluctuation over the last fiveyears (Fig. 2-5) included Angle, Wilderness,and Beaver 2. Most of the lakes had a moremoderate variation, but several showed littleaverage change through the season, includingBoren, Cottage, McDonald, and Marcel.Several lakes with suggestive data such asKillarney and North had few recent years ofrecord.
Analyzing records of annual maximum highwater level can indicate whether or not a lakewas at its capacity for water storage (at orabove the threshold of the outlet) at thebeginning of the dry season each year. It alsoindicates if a lake rose to unusual heights at anypoint during the wet season (Fig. 2-6). Thevalues for high water levels cannot becompared from lake to lake because themeasurements for each lake are relative, basedon the waterline on a fixed meter stick used tomake the measurement. However, an idea canbe gained of whether or not the lake was atcapacity by comparing high precipitation yearswith low ones; for this report the best years tocontrast would be 1999 (the first bar) with 2001
0
20
40
60
80
100
Ang
le
Wild
erne
ss
Bea
ver 2
Mar
gare
t
Kat
hlee
n
Mirr
or
Ste
el
Fran
cis
Saw
yer
Joy
Gen
eva
Hol
m (N
eils
on)
Pin
e
Leot
a
Mer
idia
n
Hal
ler
Des
ire
Bor
en
Cot
tage
McD
onal
d
Mar
cel
cm re
lativ
e la
ke le
vel
Figure 2-5: Mean annual range over the last 5 years for lakes with at least 4 years of data
13

King County Lake Monitoring Report
(middle bar). As an example, Haller Lake had arelatively constant maximum level for the lastfive years, suggesting that inputs were balancedby water flowing out rapidly enough tomaintain the winter level at a stable height. Onthe other hand, Lake Geneva had a higher standin 1999 than in the other four years, suggestingthat it may have a rapid response to largerainfall events that can lead to a largerfluctuation over the season and from year toyear.
ConclusionMany volunteers recorded higher ranges of lakelevel fluctuations in 2003 than in the previous 5
0
40
80
120
Nor
th
Pin
e
Saw
yer
Sha
dow
Spr
ing
Ste
el
Trou
t
Twel
ve
Wel
com
e
Wild
erne
ss
Lake
Lev
el (c
m)
1999 2000 2001 2002 2003
0
40
80
120
Am
es
Ang
le
Bea
ver 2
Bor
en
Cot
tage
Des
ire
Eas
ter
Fran
cis
Gen
eva
Gra
ss
Hal
ler
Lake
Lev
el (c
m)
0
40
80
120
Hol
m(N
eils
on)
Joy
Kat
hlee
n
Kill
arne
y
Leot
a
Mar
cel
Mar
gare
t
McD
onal
d
Mer
idia
n
Mirr
or
Mor
ton
Lake
Lev
el (c
m)
Figure 2-6: Maximum water levels over the last 5 years
years, but this was not matched by highermaximum stands. This suggests that the higherranges were due to summer low stands, dueeither to increased evaporation or to lowerground water inputs. Continued volunteerobservation will be important for determininghow changes in natural conditions,management activities, or watersheddevelopment all affect individual lake levels.Ongoing monitoring will help lakesideresidents, citizens in nearby communities, andcity and county officials to understand morethoroughly the trends and relationships of waterlevel fluctuations with precipitation, thusleading to more effective drainagemanagement.
14
King County Lake Monitoring Report
SECTION 2B: NUTRIENTS
Secchi TransparencyThe Secchi depth measures the relativetransparency of water to an observer above thelake surface. Transparency can be affected bywater color (which is affected byconcentrations of large organic moleculescalled “humic acids”), phytoplanktonabundance and the particular species present,and turbidity caused by suspended particlesfrom other origins. Secchi transparencyreadings can also be affected by wind andwaves, as well as by light glare off the watersurface. The sample protocol calls formeasurements to be made in the same fashioneach time, with records of wind and sunconditions, in order to compare values.
Transparency changes often mirror changes inalgal abundance, due either to changes ingrowth rates from nutrient availability or in
grazing rates by zooplankton. It can alsoindicate major inputs of silt and detritus, suchas soils dislodged by large storms or movedinto water as a result of human activities.Transparency measurements compared acrossyears may indicate correlations with specificevents known to have occurred.
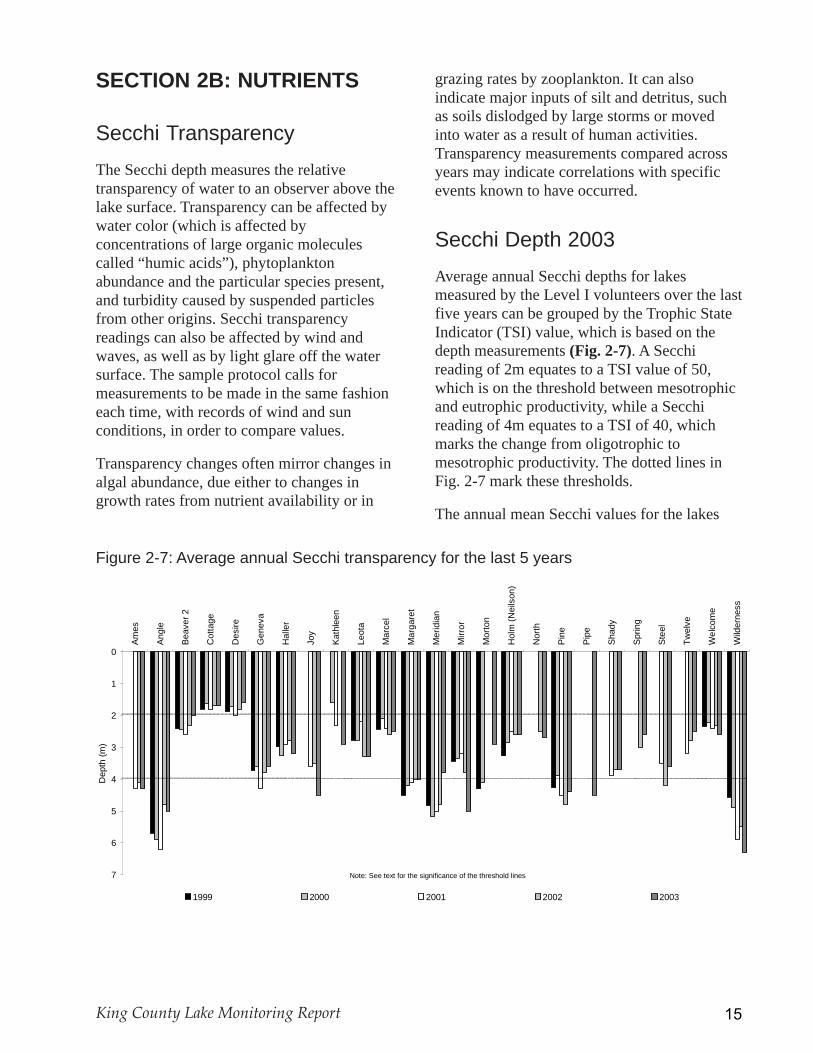
Secchi Depth 2003Average annual Secchi depths for lakesmeasured by the Level I volunteers over the lastfive years can be grouped by the Trophic StateIndicator (TSI) value, which is based on thedepth measurements (Fig. 2-7). A Secchireading of 2m equates to a TSI value of 50,which is on the threshold between mesotrophicand eutrophic productivity, while a Secchireading of 4m equates to a TSI of 40, whichmarks the change from oligotrophic tomesotrophic productivity. The dotted lines inFig. 2-7 mark these thresholds.
The annual mean Secchi values for the lakes
0
1
2
3
4
5
6
7
Ames
Angl
e
Beav
er 2
Cot
tage
Des
ire
Gen
eva
Hal
ler
Joy
Kath
leen
Leot
a
Mar
cel
Mar
gare
t
Mer
idia
n
Mirr
or
Mor
ton
Hol
m (N
eils
on)
Nor
th
Pine
Pipe
Shad
y
Sprin
g
Stee
l
Twel
ve
Wel
com
e
Wild
erne
ss
Dep
th (m
)
1999 2000 2001 2002 2003
Note: See text for the significance of the threshold lines
Figure 2-7: Average annual Secchi transparency for the last 5 years
15

King County Lake Monitoring Report
0.0
1.0
2.0
3.0
4.0
5.0
6.0
7.0
Ames
Angl
e
Beav
er2
Cot
tage
Des
ire
Gen
eva
Gra
ss
Hal
ler
Joy
Kath
leen
Tok
ita
Leot
a
Mar
cel
Mar
gare
t
Mirr
or
Mor
ton
Nei
lson
Nor
th
Pine
Shad
y
Sprin
g
Stee
l
Twel
ve
Wel
com
e
Wild
erne
ss
Dep
th (m
)
Nov-Feb Jul-Aug
with complete records over the past five yearsshow a range of values over time. Lakes withclarity usually deeper than 4m include Ames,Angle, Margaret, Meridian, Pine, andWilderness. However, Margaret appears to bedecreasing in clarity over the last five years andin both 2002 and 2003 was right on thethreshold between oligotrophy and mesotrophy.Conversely, transparencies in Joy and MirrorLakes have been generally below the 4mthreshold, but in 2003 had deeper averagevalues above 4m. Most lakes were between 2 to4m in average clarity, and there were few largefluctuations from year to year among them.Other possible trends towards decreasingclarity can be observed in Beaver 2, Holm(Neilson), and Twelve. Two lakes, Cottage andDesire, remained below the 2m threshold for allthe years depicted.
In some cases, lower Secchi depths may becaused by particle inputs from storm waterrunoff. To evaluate this possibility, Level ISecchi depths for 2003 were divided into two
Figure 2-8: Wet/dry season Secchi comparisons
time periods (Fig.2-8) to see if the influence ofstorm water runoff (November-February) couldbe separated from influences associated withsummer algal blooms (July-August). Springand autumn data were not included becauseboth major storm events and largephytoplankton blooms can occur during thoseseasons, thus confusing the interpretation.
During the wet months, significantly lowertransparencies were observed for 12 of the 24lakes in the program with comprehensiveannual data for Secchi depth, indicating thatstorm water runoff may influence water clarityin these lakes to a greater degree than summeralgal populations. In addition to storm waterinputs, wave action (due to strong winds) andlow light levels during the winter months maybe an important factor influencing loweraverage Secchi depth measurements. Five ofthe lakes had significantly lower transparenciesin the summer, indicating algal blooms could beimpacting water clarity. These included Ames,Grass, Haller, Marcel, and Mirror. Most of the
16
King County Lake Monitoring Report
lakes with large differences between winter andsummer were lower in transparency in thewinter, including North, Shady, Spring, andTwelve.
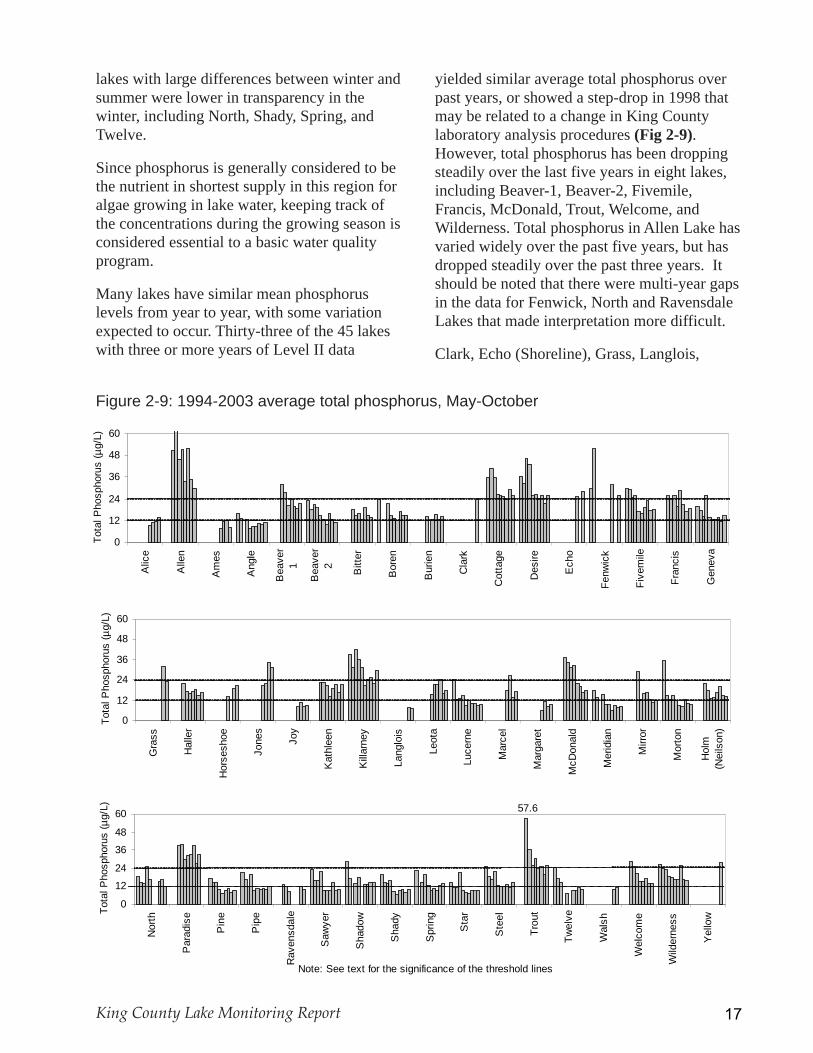
Since phosphorus is generally considered to bethe nutrient in shortest supply in this region foralgae growing in lake water, keeping track ofthe concentrations during the growing season isconsidered essential to a basic water qualityprogram.
Many lakes have similar mean phosphoruslevels from year to year, with some variationexpected to occur. Thirty-three of the 45 lakeswith three or more years of Level II data
0
12
24
36
48
60
Alic
e
Alle
n
Am
es
Ang
le
Bea
ver
1
Bea
ver
2 Bitt
er
Bor
en
Bur
ien
Cla
rk
Cot
tage
Des
ire
Ech
o
Fenw
ick
Five
mile
Fran
cis
Gen
eva
Tota
l Pho
spho
rus
(µg/
L)
0
12
24
36
48
60
Gra
ss
Hal
ler
Hor
sesh
oe
Jone
s
Joy
Kat
hlee
n
Kill
arne
y
Lang
lois
Leot
a
Luce
rne
Mar
cel
Mar
gare
t
McD
onal
d
Mer
idia
n
Mirr
or
Mor
ton
Hol
m(N
eils
on)
Tota
l Pho
spho
rus
(µg/
L)
0
12
24
36
48
60
Nor
th
Par
adis
e
Pin
e
Pip
e
Rav
ensd
ale
Saw
yer
Sha
dow
Sha
dy
Spr
ing
Sta
r
Ste
el
Trou
t
Twel
ve
Wal
sh
Wel
com
e
Wild
erne
ss
Yel
lowTo
tal P
hosp
horu
s (µ
g/L) 57.6
Note: See text for the significance of the threshold lines
Figure 2-9: 1994-2003 average total phosphorus, May-October
yielded similar average total phosphorus overpast years, or showed a step-drop in 1998 thatmay be related to a change in King Countylaboratory analysis procedures (Fig 2-9).However, total phosphorus has been droppingsteadily over the last five years in eight lakes,including Beaver-1, Beaver-2, Fivemile,Francis, McDonald, Trout, Welcome, andWilderness. Total phosphorus in Allen Lake hasvaried widely over the past five years, but hasdropped steadily over the past three years. Itshould be noted that there were multi-year gapsin the data for Fenwick, North and RavensdaleLakes that made interpretation more difficult.
Clark, Echo (Shoreline), Grass, Langlois,
17

King County Lake Monitoring Report
Walsh, and Yellow Lakes reported Level II datafor the first or second time, and these lakes willneed more years of data collection beforepatterns begin to emerge.
Several lakes showed a steady increase ofphosphorus over time, including Alice,Horseshoe, and Jones. Holm (Neilson)increased four years in a row, but decreased in2002 and 2003. Margaret may also beincreasing over time, but the rate is too low tobe sure that the data is not merely reflectinginter-annual variability. No lakes haveincreased in total phosphorus over a longenough period of time for trends to beconsidered statistically significant. However,the increases do point to lakes that should havecareful attention paid to them over the next fewyears.
Nitrogen: Phosphorus RatiosMany water quality problems in lakes can berelated to high concentrations of nutrients thatstimulate the growth of algae and aquaticplants. In temperate freshwater systems, thenutrient that limits algae growth is most oftenphosphorus, although phytoplankton can beoccasionally limited by nitrogen concentrationsor even by silica or iron. Before trying tomanage a water quality problem, it is importantto know which nutrient is limiting plant growthmost frequently in the lake.
To make a quick nutrient assessment, nitrogento phosphorus ratios (N:P) are calculated forindividual lakes. Generally, nitrogen tophosphorus ratios of 17:1 or greater suggestthat phosphorus limits algal growth (Carrolland Pelletier 1991). Within each lake, the ratiovaries throughout the growing season. Somelakes are primarily phosphorus limited, butoccasionally may be nitrogen limited. Othersare solely governed by one nutrient which is inthe shortest supply through the season. Lowernitrogen to phosphorus ratios can favorbluegreens over other algal species, becausesome bluegreen species are able to use nitrogen
from the air, unlike other algae. A ratio of 20:1or below is generally indicative of potentiallyadvantageous conditions for bluegreen growth.
A biological wrinkle in using N:P ratios toassess the potential for algal growth is thatsome algae can take up phosphorus and store itfor use later in the season when phosphorusconcentrations have become very low in theepilimnion (so-called “luxury uptake”). Thus,the population growth rates of such algae maybe reflecting earlier conditions of phosphorusavailability rather than the period during whichthey are being measured.
2003 RatiosNo Level II lakes had an average N:P ratio lessthan 20 for the period of May-October 2003(Fig. 2-10), although individual values below20 have been common in certain lakes over thepast ten years. Many of the lakes have hadlower average ratios than they have now,suggesting that algae in these lakes could haveexperienced nitrogen limitation at some timeduring the growing seasons in past years.Upward trends through time in N:P ratios canbe seen for 17 of the 51 lakes, which couldsignal a change in direction away fromdomination by bluegreen populations in thefuture. The average ratio in other lakes haschanged greatly from year to year or has shownno particular trend or directionality.
Lakes that ranked as oligotrophic by their TSIindicators generally also had higher N:P ratios,while eutrophic lakes had lower N:P ratios. Onelake which was contrary in this regard isFivemile, which had generally high N:P ratiosalthough ranked as mid- to high-rangemesotrophic, with a eutrophic TSI-Secchi likelydue to water color.
Several lakes had N:P ratios that hovered nearthe threshold of 20 throughout the season.These included Haller, Jones, Killarney, andParadise. Some lakes had averages well above20, but experienced periods during the sample
18

King County Lake Monitoring Report
0102030405060
Alic
e
Alle
n
Am
es
Ang
le
Bea
ver
1
Bea
ver
2 Bitt
er
Bor
en
Bur
ien
Cla
rk
Cot
tage
Des
ire
Ech
o
Fenw
ick
Five
mile
Fran
cis
Gen
eva
N :
P b
y w
eigh
t
0102030405060
Gra
ss
Hal
ler
Hor
sesh
oe
Jone
s
Joy
Kat
hlee
n
Kill
arne
y
Lang
lois
Leot
a
Luce
rne
Mar
cel
Mar
gare
t
McD
onal
d
Mer
idia
n
Mirr
or
Mor
ton
Hol
m(N
eils
on)
N :
P b
y w
eigh
t
0102030405060
Nor
th
Par
adis
e
Pin
e
Pip
e
Rav
ensd
ale
Ret
reat
Saw
yer
Sha
dow
Sha
dy
Spr
ing
Sta
r
Ste
el
Trou
t
Twel
ve
Wal
sh
Wel
com
e
Wild
erne
ss
N :
P b
y w
eigh
t
season with values at or below the threshold.Several lakes had higher N:P ratios in spring,which either dropped steadily through thesummer or declined more abruptly in latesummer to levels at or below 20. Lakes in thisgroup included Boren, Cottage, Desire, Sawyer,Steel, Walsh, and Wilderness. Lake McDonaldhad the opposite pattern of starting low andthen rising to a higher level the rest of theseason. Two lakes, Echo (Shoreline) andFenwick, started low, rose in mid summer, andthen dropped again. Lake Marcel had theopposite pattern of high values with a lowperiod in mid summer. Any of these periods oflow N:P ratio could have encouraged a growthincrease by bluegreen species.
ConclusionFor the majority of lakes in King County,average May-October phosphorusconcentrations have either remained steady orhave declined in recent years, including 2003.Only three lakes in the monitoring programhave shown steady gains recently, and theseshould be watched to see if there are otherindicators of deterioration in water quality. N:Pratios for the lakes suggest that conditions forbluegreen algae are becoming less favorableoverall, thus reducing the possibility of toxicbluegreen blooms on a region-wide basis,although several lakes are still at risk,particularly at specific times of year.
Figure 2-10: 1994-2003 N:P ratio
19

King County Lake Monitoring Report
Lake Stratification andChemistry ProfilesSeasonal changes in the water chemistry ofeach lake relate in part to physical differencesthat occur with changes in water temperature.These chemical changes are much morepronounced in thermally stratified lakes.During spring and early summer, thecombination of heat from sunlight andmovement of the near surface water in the lakecauses more warming in the upper portions ofthe water column than in the lower depths. Thisresults in thermal “stratification” of a lake intostable layers of water with differingtemperatures and densities. Deeper lakesgenerally remain stratified throughout thesummer, while shallow lakes exposed to windeither never fully stratify thermally or elsedevelop transient thermal stratification thatbreaks down often.
Effects of StratificationTemperature patterns and thermal stratificationinfluence fundamental processes in lakes, suchas changes in dissolved oxygen concentrations,nutrient release, and algal growth. Oxygenenters the water (dissolves) through contactwith the atmosphere at the surface. Once a lakestratifies, deep water (the hypolimnion) is nolonger mixing with shallow water and thereforethe atmosphere is only in contact with upperwater. This means that the dissolved oxygen indeeper water may be exhausted by the demandsof bottom dwelling animals and bacteria sometime after stratification has occurred. Suchanoxic (no oxygen) waters can greatly stressfish like trout and salmon that require cool,oxygenated waters in order to survive.
In addition, chemical reactions related toanoxia cause the sediments to releasephosphorus back into the deep water. When thiswater mixes with the surface waters in autumnas cooling occurs, an algal bloom can resultfrom the sudden influx of nutrients into surfacewaters from the bottom. Monitoring water
chemistry differences between the epilimnionand hypolimnion during summer provides away to assess the role that internal nutrientcycling plays in lake water chemistry.
Chlorophyll measurements can act as analoguesfor algae distribution in the water column.Since algae need sunlight to photosynthesize,as well as nutrients to build the organicmolecules necessary for growth andreproduction, the largest populations should befound at the point where the best compromisebetween these two needs is found. Whensunlight is very intense, it can actually causephoto-damage to algal cells, cause growthinhibition at shallow depths. However, in lakeswith highly colored water or such denselyblooming algae that shading by other algae canoccur, inhibition may not be found. Greatconcentrations of algae can sometimes be foundmuch deeper in the water column, whereenough light can penetrate to the thermoclineand below, to the nutrient rich hypolimnion. Inshallow lakes, large amounts of algae can befound above the bottom for the similar reasons.
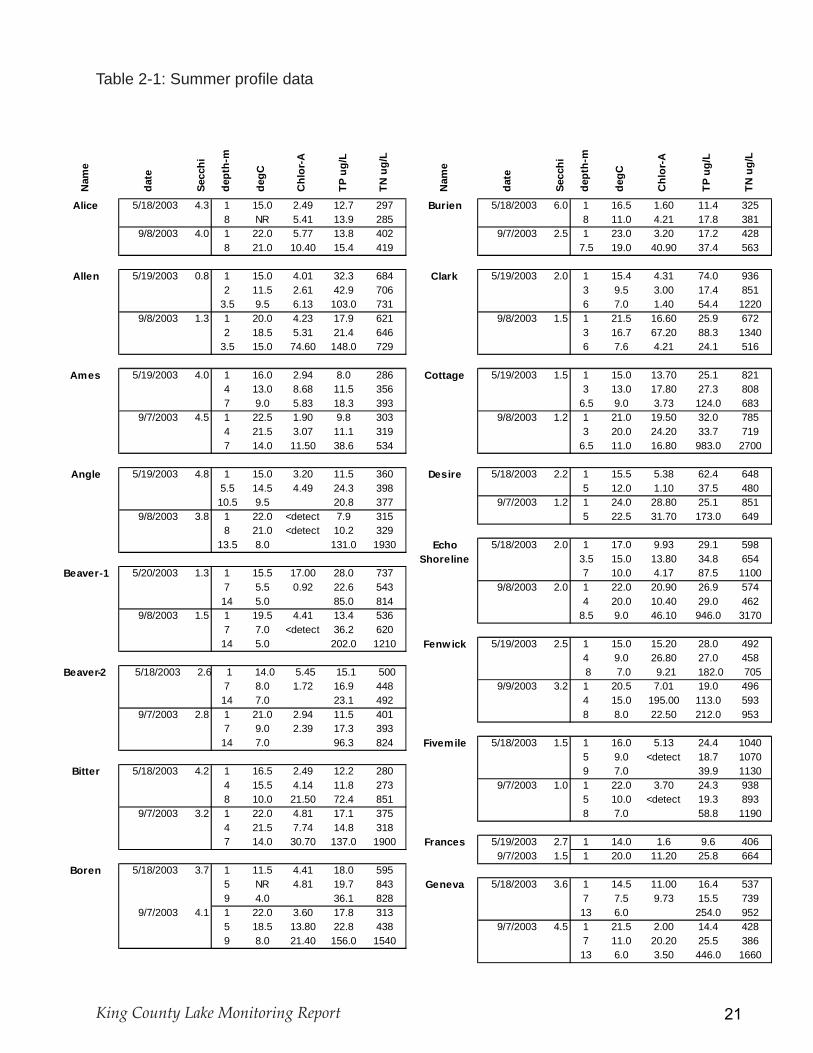
2003 ProfilesDepending on the maximum depth of each lake,samples were taken by Level II volunteermonitors at two or three depths for measuringtemperature, chlorophyll a, total phosphorus,and total nitrogen (Table 2-1). The precisesampling depths were based on the actual depthmeasured at the sampling site, with samplestaken from 1m from the surface, the middle ofthe water column, and 1m above the measuredbottom. These samples were collected in midMay and again in early September in order tocharacterize changes in the water column overthe summer during the most probable period ofstratification. Lakes with stable thermalstratification usually show the most dramaticdifferences in water chemistry between the topand bottom samples in late summer.
In the Pacific Northwest, most lakes thatstratify have already done so by May and retain
20
King County Lake Monitoring Report
Table 2-1: Summer profile dataN
ame
date
Secc
hi
dept
h-m
degC
Chl
or-A
TP u
g/L
TN u
g/L
Nam
e
date
Secc
hi
dept
h-m
degC
Chl
or-A
TP u
g/L
TN u
g/L
Alice 5/18/2003 4.3 1 15.0 2.49 12.7 297 Burien 5/18/2003 6.0 1 16.5 1.60 11.4 3258 NR 5.41 13.9 285 8 11.0 4.21 17.8 381
9/8/2003 4.0 1 22.0 5.77 13.8 402 9/7/2003 2.5 1 23.0 3.20 17.2 4288 21.0 10.40 15.4 419 7.5 19.0 40.90 37.4 563
Allen 5/19/2003 0.8 1 15.0 4.01 32.3 684 Clark 5/19/2003 2.0 1 15.4 4.31 74.0 9362 11.5 2.61 42.9 706 3 9.5 3.00 17.4 851
3.5 9.5 6.13 103.0 731 6 7.0 1.40 54.4 12209/8/2003 1.3 1 20.0 4.23 17.9 621 9/8/2003 1.5 1 21.5 16.60 25.9 672
2 18.5 5.31 21.4 646 3 16.7 67.20 88.3 13403.5 15.0 74.60 148.0 729 6 7.6 4.21 24.1 516
Ames 5/19/2003 4.0 1 16.0 2.94 8.0 286 Cottage 5/19/2003 1.5 1 15.0 13.70 25.1 8214 13.0 8.68 11.5 356 3 13.0 17.80 27.3 8087 9.0 5.83 18.3 393 6.5 9.0 3.73 124.0 683
9/7/2003 4.5 1 22.5 1.90 9.8 303 9/8/2003 1.2 1 21.0 19.50 32.0 7854 21.5 3.07 11.1 319 3 20.0 24.20 33.7 7197 14.0 11.50 38.6 534 6.5 11.0 16.80 983.0 2700
Angle 5/19/2003 4.8 1 15.0 3.20 11.5 360 Desire 5/18/2003 2.2 1 15.5 5.38 62.4 6485.5 14.5 4.49 24.3 398 5 12.0 1.10 37.5 48010.5 9.5 20.8 377 9/7/2003 1.2 1 24.0 28.80 25.1 851
9/8/2003 3.8 1 22.0 <detect 7.9 315 5 22.5 31.70 173.0 6498 21.0 <detect 10.2 329
13.5 8.0 131.0 1930 Echo 5/18/2003 2.0 1 17.0 9.93 29.1 598Shoreline 3.5 15.0 13.80 34.8 654
Beaver-1 5/20/2003 1.3 1 15.5 17.00 28.0 737 7 10.0 4.17 87.5 11007 5.5 0.92 22.6 543 9/8/2003 2.0 1 22.0 20.90 26.9 57414 5.0 85.0 814 4 20.0 10.40 29.0 462
9/8/2003 1.5 1 19.5 4.41 13.4 536 8.5 9.0 46.10 946.0 31707 7.0 <detect 36.2 62014 5.0 202.0 1210 Fenw ick 5/19/2003 2.5 1 15.0 15.20 28.0 492
4 9.0 26.80 27.0 458Beaver-2 5/18/2003 2.6 1 14.0 5.45 15.1 500 8 7.0 9.21 182.0 705
7 8.0 1.72 16.9 448 9/9/2003 3.2 1 20.5 7.01 19.0 49614 7.0 23.1 492 4 15.0 195.00 113.0 593
9/7/2003 2.8 1 21.0 2.94 11.5 401 8 8.0 22.50 212.0 9537 9.0 2.39 17.3 39314 7.0 96.3 824 Fivemile 5/18/2003 1.5 1 16.0 5.13 24.4 1040
5 9.0 <detect 18.7 1070Bitter 5/18/2003 4.2 1 16.5 2.49 12.2 280 9 7.0 39.9 1130
4 15.5 4.14 11.8 273 9/7/2003 1.0 1 22.0 3.70 24.3 9388 10.0 21.50 72.4 851 5 10.0 <detect 19.3 893
9/7/2003 3.2 1 22.0 4.81 17.1 375 8 7.0 58.8 11904 21.5 7.74 14.8 3187 14.0 30.70 137.0 1900 Frances 5/19/2003 2.7 1 14.0 1.6 9.6 406
9/7/2003 1.5 1 20.0 11.20 25.8 664Boren 5/18/2003 3.7 1 11.5 4.41 18.0 595
5 NR 4.81 19.7 843 Geneva 5/18/2003 3.6 1 14.5 11.00 16.4 5379 4.0 36.1 828 7 7.5 9.73 15.5 739
9/7/2003 4.1 1 22.0 3.60 17.8 313 13 6.0 254.0 9525 18.5 13.80 22.8 438 9/7/2003 4.5 1 21.5 2.00 14.4 4289 8.0 21.40 156.0 1540 7 11.0 20.20 25.5 386
13 6.0 3.50 446.0 1660
21

King County Lake Monitoring Report
Table 2-1: Continued.N
ame
date
Secc
hi
dept
h-m
degC
Chl
or-A
TP u
g/L
TN u
g/L
Nam
e
date
Secc
hi
dept
h-m
degC
Chl
or-A
TP u
g/L
TN u
g/L
Grass 5/18/2003 1.3 1 11.0 4.49 14.9 619 Margaret 5/18/2003 3.5 1 14.5 13.80 12.2 4956 9.5 3.20 11.5 435
Haller 5/18/2003 4.0 1 16.0 5.93 26.4 378 11.5 7.0 13.6 5126 6.0 16.00 66.4 931 9/7/2003 3.5 1 21.5 2.00 7.7 2409 4.5 220.0 1550 5.5 13.0 4.65 10.5 245
9/7/2003 3.0 1 21.5 3.60 19.4 332 11 7.0 5.9 6126 10.0 7.48 60.0 4919 5.0 765.0 3280 McDonald 5/18/2003 1.0 1 13.5 10.50 25.1 496
7 6.5 7.32 26.0 626Horseshoe 5/18/2003 3.0 1 14.0 9.61 21.8 566 13 5.0 218.0 721
9/8/2003 NR 1 20.0 6.23 32.7 1010 9/8/2003 NR 1 NR 9.21 16.9 5767
Jones 5/18/2003 NR 1 14.0 33.4 45.8 958 13 NR 194.0 9159/7/2003 2.0 1 22.5 3.87 23.0 531
Meridian 5/20/2003 5.0 1 15.0 2.52 9.0 281Joy 5/18/2003 5.0 1 15.0 1.40 13.0 603 13 7.0 2.80 10.5 414
7 7.0 1.10 10.7 648 25 6.0 35.0 51311 6.0 37.6 768 9/8/2003 5.5 1 23.0 <detect 9.7 374
9/7/2003 4.5 1 24.0 3.00 9.6 352 13 7.0 <detect 86.1 20005.5 15.0 2.60 13.0 460 25 6.0 200.0 90111 6.0 78.6 1170
Mirror 5/19/2003 5.5 1 18.0 1.30 10.0 317Kathleen 5/18/2003 2.1 1 15.0 3.52 15.6 495 5 16.5 3.20 14.0 357
5 11.0 5.93 29.6 681 9/8/2003 3.6 1 23.5 10.70 12.5 4129/7/2003 3.1 1 21.5 6.54 17.8 599 5 23.0 10.40 15.8 422
3 20.5 3.87 22.8 585Morton 5/18/2003 4.5 1 15.0 6.18 12.2 493
Killarney 5/18/2003 1.8 1 16.5 64.90 61.3 922 4 14.0 9.50 11.6 5232.5 15.0 28.80 55.0 929 9/7/2003 4.4 1 23.5 1.60 10.1 386
9/7/2003 2.4 1 22.0 3.74 28.2 611 4 23.0 1.20 11.5 4622.5 21.8 4.41 25.1 584
Neilson 5/18/2003 3.1 1 14.5 8.01 18.3 547Langlois 5/19/2003 6.5 1 13.0 2.86 8.8 309 4 7.8 2.00 15.3 597
14 4.5 3.43 8.8 474 8 5.6 31.6 67128 4.0 5350.0 57100 9/7/2003 2.4 1 22.0 3.30 11.8 542
9/8/2003 7.2 1 20.5 <detect 5.9 264 4 13.0 20.80 21.3 5037 15.0 <detect 5.9 250 8 7.0 79.3 103020 4.5 243.0 4570
North 5/18/2003 1.7 1 17.0 11.40 15.8 542Leota 5/18/2003 4.0 1 11.0 1.10 18.9 556 5 12.0 25.70 17.5 481
3 4.5 1.60 25.8 553 8 9.0 7.57 24.5 6656 2.5 141.0 1290 9/9/2003 3.8 1 24.0 2.80 8.1 504
9/7/2003 4.0 1 17.0 3.60 15.0 385 5 18.0 48.10 13.5 4063 12.5 14.80 21.0 344 8 10.0 73.20 21.8 12606 1.5 307.0 3110
Paradise 5/19/2003 1.5 1 13.0 86.80 47.7 715Lucerne 5/18/2003 2.3 1 15.0 6.14 18.1 481 4.5 9.0 1.95 17.6 703
6 8.0 4.11 11.2 643 7.5 5.5 217.0 72210 6.5 22.8 562 9/7/2003 3.3 1 18.5 27.40 29.2 369
9/8/2003 4.0 1 22.5 <detect 5.9 341 4 12.0 27.50 32.7 3546 17.0 <detect 8.5 362 7.5 14.0 801.0 26809 9.0 42.7 1410
Marcel 5/18/2003 2.5 1 14.0 6.64 20.5 11003.5 11.2 37.80 35.0 940
9/7/2003 2.0 1 21.2 20.20 19.3 4734 19.2 8.81 24.1 670
22

King County Lake Monitoring Report
Table 2-1: Continued.
Nam
e
date
Secc
hi
dept
h-m
degC
Chl
or-A
TP u
g/L
TN u
g/L
Nam
e
date
Secc
hi
dept
h-m
degC
Chl
or-A
TP u
g/L
TN u
g/L
Pine 5/18/2003 5.5 1 15.0 2.67 8.0 303 Steel 5/19/2003 5.0 1 16.0 2.00 10.4 2986 10.0 13.00 13.6 392 6 14.0 6.89 18.5 32810 8.0 45.1 641 9/8/2003 2.5 1 22.0 5.61 15.4 430
9/7/2003 3.8 1 22.0 2.40 8.7 320 6 21.0 40.40 12.5 19706 19.5 12.20 11.8 35810 9.5 32.3 659 Trout 5/19/2003 1.8 1 15.0 4.14 28.7 1090
4 6.5 1.10 29.9 1120Pipe 5/19/2003 3.6 1 16.5 6.52 10.2 466 7 5.0 93.3 1300
8 7.5 2.05 8.6 560 9/8/2003 2.2 1 19.0 7.61 19.9 76617 5.5 15.9 680 4 10.0 14.00 62.7 821
9/8/2003 6.1 1 22.5 <detect 8.8 371 7 5.0 264.0 173010 18.0 <detect 8.7 35718 8.5 12.5 391 Twelve 5/19/2003 3.5 1 15.0 3.09 10.5 507
6 6.5 63.30 16.1 690Ravensdale 5/18/2003 5.3 1 8.0 2.52 11.5 731 9/8/2003 2.0 1 21.5 10.20 11.8 434
2.3 8.0 4.14 12.9 745 6.5 NR 103.00 16.1 7214
9/7/2003 4.4 1 12.5 1.68 10.0 607 Walsh 5/18/2003 3.8 1 13.0 5.95 11.2 5182 10.0 5 8.0 6.87 13.4 5494 8.0 2.72 10.3 616 10 5.5 19.5 467
9/7/2003 5.7 1 23.0 2.27 11.3 173Sawyer 5/18/2003 2.5 1 13.0 9.84 12.6 470 5 20.0 3.87 12.8 206
8 6.0 4.12 15.7 608 10 7.0 18.7 36016.5 5.5 38.4 659
9/7/2003 4.1 1 21.0 1.70 8.9 211 Welcome 5/18/2003 2.2 1 14.5 5.26 15.7 6448 7.0 7.21 23.7 359 3.5 11.0 1.49 15.3 650
14.5 8.0 74.4 548 9/7/2003 3.0 1 22.0 2.94 17.3 4703.5 19.4 12.20 15.2 417
Shadow 5/19/2003 2.1 1 15.0 10.10 20.1 5946.5 7.0 8.15 17.0 872 Wilderness 5/18/2003 6.3 1 NR 2.52 18.8 49312 6.0 17.7 905 6 9.0 108.00 63.1 772
9/8/2003 3.7 1 22.0 <detect 18.6 518 8.5 6.5 110.0 4756 11.0 41.90 27.5 490 9/7/2003 7.5 1 22.5 4.33 14.5 236
11.5 6.5 40.8 736 6 18.0 2.00 23.8 1867.8 12.0 9.21 89.0 452
Shady 5/19/2003 2.5 1 15.5 17.40 15.8 5296 7.5 6.64 10.9 572 Yellow 9/7/2003 1.1 1 22.5 7.21 33.5 98312 5.4 40.0 1160 1.9 22.0 6.61 34.0 1030
9/8/2003 4.6 1 21.1 3.60 7.2 3886 13.5 3.80 11.0 34411 6.0 18.8 1710
Spring 5/18/2003 1.3 1 15.0 17.50 16.1 5194 10.5 5.45 14.7 5958 8.0 43.7 665
9/7/2003 3.4 1 23.0 1.90 10.9 4334 15.0 8.21 41.0 4128 8.0 195.0 1690
Star 5/19/2003 5.8 1 18.0 4.46 8.5 3307 10.0 6.41 12.3 44814 8.0 322.0 2270
9/8/2003 5.9 1 24.0 2.14 8.1 2957 19.0 7.01 12.0 35313 8.5 201.0 1810
23

King County Lake Monitoring Report
the stratification until some time in October.Water temperatures will reflect this ifcomparisons are made between the top andbottom values. Shallow lakes such as Alice,Allen, Burien, Desire, Frances, Kathleen,Killarney, Marcel, Mirror, Morton, Steel andWelcome show very little difference betweenthe temperatures at the top and bottom, orsometimes a difference on only one of the twodates, suggesting that stratification, ifoccurring, is probably of short duration.
Lake Langlois represents an unusual casebecause it is extraordinarily deep relative to itssurface area, which can lead to semi-permanentisolation of the deepest water, a conditioncalled meromixis. In lakes like this, the wind,sun and air temperature influences on thesurface water do not provide enough energy tomix the water all the way to the bottom of thebasin. The very different characteristics of theLanglois deep water indicate that it does notmix to the bottom annually, unlike all the othermonitored lakes in the county. This leads topermanent anoxia and a build-up of sulfidesand nutrients that do not mix up into theshallow water, but remain in place andgenerally increase in concentration over timewith influx of settling material. The profilesample taken at 28m in mid May supports thiswith the extremely high values of phosphorusand nitrogen. The September profile samplewas taken at a shallower depth, above the zoneof meromixis, in order to look at the deepestwater nutrient concentrations that were likely tomix up in the fall.
For many lakes, total phosphorus levels weretypically larger in bottom water samples byAugust compared to 1m and mid-depthconcentrations, suggesting that release ofphosphorus from the sediments was occurringover the summer months. The measurement ofthe total amount of phosphorus is not a directmeasure of the phosphorus that is available foralgal uptake, since the phosphorus contained inparticles both organic and inorganic will beincluded in the assay. However, majordifferences in bottom sample phosphorus
concentrations between May and September dosuggest that some release from the sediments isoccurring.
There are several possible sources of errors inphosphorus measurements of the bottomsamples. If any bottom sediments weredisturbed during sampling, they could beincorporated in the sample, and measuredlevels could be very high, but would not reflectwhat was actually present and available forphytoplankton growth. Volunteers wereinstructed to discard the water if it appeared toinclude any bottom sediments and to collectanother sample. Another check on thispossibility was instituted in 2003 by filteringparticles from a subsample of collected waterand retaining the filter in case of questionsabout the samples.
Another potential source for error in shallowlakes might be incorporation of materialoriginating from rooted aquatic plants in thedeep sample. By August, several of theshallower lakes can have aquatic plantsgrowing up from the bottom all across the lake,including at the sample site. Material sinkingfrom the shallow water can get caught in theseplants and then disturbed when the sampler isdropped through the water, thus incorporatingextra particulate matter into the sample water.This would then give a high reading similar tothe bottom sediments that would not be at allrelated to chemical release of sedimentaryphosphorus.
Very high concentrations of total phosphorus (>200 µg/L) on one or both profile dates werefound in the bottom samples of lakes Beaver-1,Cottage, Echo (Shoreline), Fenwick, Geneva,Haller, Langlois, Leota, McDonald, Meridian,Paradise, Star, and Trout, or 13 out of the 51lakes that were monitored. For these lakes,phosphorus release from the sediments likelyincreased the potential for algal growth in thefall or into the next spring, and could also beincreasing the values of the Trophic StateIndicators as well. For most of the other lakes,the process of internal phosphorus recycling
24

King County Lake Monitoring Report
due to anoxia in the hypolimnion probably didnot contribute significantly to the phosphorusbudget in 2003.
Total nitrogen showed very similar patterns, butnot precisely the same relationships from laketo lake. Nitrogen chemistry is more complexthan phosphorus, and it is usually of lessconcern for management strategies in thePacific Northwest because it is not generallythe nutrient in least supply for algae in the lakesof King County. However, it does affect thenitrogen to phosphorus ratio present in eachlake, which gives some algae an advantage overother species. Nitrogen is often about an orderof magnitude higher in concentration thanphosphorus in freshwater. Lakes which hadvery high concentrations of total nitrogen(>1500 µg/L) on one or more dates includedAngle, Beaver-1, Bitter, Boren, Cottage, Echo(Shoreline), Geneva, Haller, Langlois, Leota,McDonald, Meridian, Paradise, Shady, Spring,Star, Steel, and Trout. This added up to 18 ofthe 51 lakes.
Chlorophyll a was measured at the same depthsas phytoplankton samples were taken, usuallyat the surface and mid-depth. However, forsome lakes chlorophyll was also measured inthe deep sample. There were some lakes inwhich chlorophyll was much greater at thesurface than at mid-depth on one or both dates,including Beaver-1, Cottage, Jones, Killarney,Margaret, Paradise, Shady and Spring. Morelakes showed the reverse pattern of greaterchlorophyll a in deep water than at 1m, and forsome of them the difference was quite large.Lakes with this pattern on one or both datesincluded Alice, Allen, Ames, Bitter, Boren,Burien, Clark, Fenwick, Geneva, Haller, Holm(Neilson), North, Pine, Steel, Trout, Twelve,Welcome, and Wilderness.
ConclusionsMany lakes in King County exhibit somedegree of thermal stratification by thebeginning of summer. Some of the shallow
lakes remain unstratified or stratify only forbrief periods due to the diffusion of heatthrough the water column and mixing actionsby wind. In most lakes with stablethermoclines, nutrient concentrations werehigher in the bottom samples during one orboth profile sampling dates. While some lakeshad higher chlorophyll a content at the surface,more lakes had higher chlorophyllconcentrations in the deeper samples than in the1m sample.
SECTION 2C: TROPHICSTATE INDEX AND LAND USE
Trophic State IndexThe productivity of lakes can be classifiedusing numbers that predict biological activityby calculating the Trophic State Index (TSI)based on conditions in the lake. TSI valuesprovide a standard measure to rate lakes on ascale of 0 to 100. Each major division (10, 20,30, etc.) correlates the doubling of algalbiovolume to various measurable parameters bylinear regression and re-scaling (Carlson,1977). The indices are based on the summermean values (May through October) of threecommonly measured lake parameters: Secchidepth, total phosphorus, and chlorophyll a.
The relationships are not alwaysstraightforward. Carlson points out that highlycolored lakes containing large amounts ofdissolved organic matter may produceerroneously high TSI ratings for Secchitransparency. The shape and size ofphytoplankton species can also influence theSecchi reading, as well as the chlorophyllratings, since small, diffuse algae cloud thewater more than large, dense algal colonies andspecies of algae vary in the amount ofchlorophyll they contain. Additionally, it isimportant to note that the total phosphorusmeasure is most reliable for lakes that arestrictly phosphorus limited in algal nutrition,and the relationship often falls apart when
25

King County Lake Monitoring Report
nitrogen is the limiting nutrient. Although nolakes in King County have been identified aslimitation, there are several lakes in whichnitrogen appears to be limiting at times throughthe season or in which phosphorus and nitrogenlimitations are occasionally combined.
2003 TSI RatingsTSI values were calculated for the threeparameters measured on each sampling date forthe 51 lakes monitored by Level II volunteers,and the average for each was produced for theseason (Fig 2-11). The lakes were arranged bythe average of all three TSI values indescending order to show the range of valuesfound for monitored lakes in the county. TSIvalues over the past nine years for each lake areincluded in the individual lake descriptions(Section 3).
Carlson (1977) points out that if all theassumptions are correct, the TSI valuesproduced from the three different parametersshould be very close to each other. Many KingCounty lakes follow this prediction, but severalhave values that are not very close, suggestingthat some different conditions or processes areactive at those lakes. When lakes have twoclose TSI values and one very different one, theoutlying value could be excluded fromconsideration if a reasonable hypothesis is putforward to explain the differing value. Forexample, there are four King County lakes in2003 whose trophic assignment could bereassessed, based on the difference between theTSI-Secchi and the other values: Allen,Fivemile, Grass, and Wilderness. Grass andFivemile are easy to evaluate because the TSI-TP and TSI-chlor are closer together, while theTSI-Secchi is much higher. The color of thewater in both lakes is yellow (King County,2002), which is likely to cause the TSI-Secchivalues to predict higher lake productivities thanactually exist. Both Grass and Fivemile shouldthen be evaluated on the basis of the other twoindicators. Without the TSI-Secchi valueincluded, Fivemile productivities is assessed asmesotrophic rather than eutrophic. However,
for Grass Lake all three indicators are more orless equidistant and make excluding any ofthem difficult.
In contrast, Lake Wilderness has two TSIvalues that range in the middle of mesotrophic,but the TSI-Secchi places well below theoligotrophic threshold. If the phytoplanktondata are compared to the Secchi data, it isapparent that the bluegreens Aphanizomenonand Gloeotrichia dominated the phytoplanktonduring the time of higher transparency in thespring and fall. Aphanizomenon makes dense,long and narrow colonies resembling blades ofgrass, while Gloeotrichia makes dense balls offilaments. Neither shape interferes with clarityto the same extent as more diffuse colonies ofalgae or myriads of individual cells. Thus, theSecchi readings might not reflect the higherproductivity during those times when thebluegreens were abundant, and productivitywould likely be better represented by thechlorophyll a and total phosphorus TSI values.This puts Lake Wilderness in the middle rangeof mesotrophy.
Oligotrophic lakes with TSI values less than 40are considered to have low biological activity,with high clarity and low concentrations ofchlorophyll a and total phosphorus. Nine lakesmet this criterion for all three calculations ofTSI at or below the threshold: Langlois, Joy,Meridian, Star, Ames, Ravensdale, Pipe, Angle,and Margaret. Four other lakes had two out ofthree TSI values below 40: Pine, Lucerne,Mirror, and Morton.
Mesotrophic lakes have TSI ratings between 40and 50. They are considered to be transitionalbetween being relatively nonproductive andvery productive biologically. In 2003, with twoout of three indicators above the threshold or allthree very near the threshold, the transitionallakes included Alice, Walsh, Sawyer, Shady,Boren and Geneva. Lakes slightly moreproductive, but considered in the lower range ofmesotrophy included Beaver-2, Bitter, Burien,Steel, Welcome, Twelve, Shadow, North, Leota,and Haller. The middle to high range
26

King County Lake Monitoring Report
30
40
50
60
70TSI-Secchi TSI-Chlor TSI-TP
Gra
ss
Alle
n
Par
adis
e
Beav
er 1
Cot
tage
Ech
o
Five
mile
Kill
arne
y
Trou
t
Yel
low
Jone
s
Cla
rk
Mar
cel
Fenw
ick
Des
ire
Fran
cis
Hor
sesh
oe
McD
onal
d
Nei
lson
Spr
ing
Kat
hlee
n
Hal
ler
Leot
a
Nor
th
Sha
dow
Twel
ve30
40
50
60
70
Wel
com
e
Ste
el
Bea
ver 2
Burie
n
Bitt
er
Mirr
o r
Gen
eva
Bor
en
Alic
e
Wal
sh
Saw
yer
Sha
dy
Wild
erne
ss
Mor
ton
Mar
gare
t
Luce
rne
Angl
e
Pip
e
Rav
ensd
ale
Am
es
Pin
e
Star
Mer
idia
n
Joy
Lang
lois
Figure 2-11: Trophic state charts
27

King County Lake Monitoring Report
mesotrophic lakes, with all three indicators inor very close to the 40-50 range includedKathleen, Spring, Holm (Neilson), McDonald,Horseshoe, Francis, and Marcel. Fivemile is aspecial case and should be considered as part ofthis group also.
Lakes that have TSI values greater than 50 areconsidered eutrophic, characterized by highbiological productivity. Seven lakes were onthe threshold between mesotrophy andeutrophy, including Clark, Jones, Paradise,Beaver-1, Yellow, Trout, and Killarney. Fourlakes were rated clearly eutrophic in 2003:Allen, Cottage, Echo (Shoreline), and Grass.
Chlorophyll aVariability is often much greater from year toyear in chlorophyll a concentrations than it isfor total phosphorus or the N:P ratio. This is notsurprising, since the phytoplankton populationsin a lake can be concentrated by wind andwater movements and so may not be evenlydistributed at the time of sampling. In addition,algal species present in a lake can change fromyear to year, and algae differ in the amount ofchlorophyll per cell by species. The amount ofchlorophyll a per cell can vary with the healthand age of the population as well. For example,large blooms of cyanobacteria (bluegreens)may yield less chlorophyll than equivalentvolumes of chlorophytes (green algae) becausemany bluegreens have accessory pigments inaddition to the chlorophyll that are used tocapture light for photosynthesis. Lack of windcan cause bluegreens to float up to the surface,concentrating them at the top of the watercolumn, while other species, such aschrysophytes and diatoms, may sink downtowards the thermocline, out of the surfacewater.
Even with all the variables that come into playon each sampling date, the annual May-Octoberaverages of chlorophyll (Fig 2-12) demonstratethat most of the lakes in the program havegenerally similar average concentrations from
year to year or else vary within a certain range.This is particularly true of lakes with loweraverage concentrations, of which there aremany: Alice, Ames, Angle, Bitter, Boren,Burien, Geneva, Haller, Horseshoe, Joy,Langlois, Lucerne, Margaret, Meridian,Morton, Pine, Pipe, Ravensdale, Sawyer,Shadow, Shady, Star, Walsh, and Wilderness.
Average chlorophyll concentrations in AllenLake vary a great deal from year to year, but inthe past have always been much higher than inthe other lakes participating in the program,with the exceptions of Grass, Marcel, andParadise. Several other lakes which are alsoconsistently higher than others include Cottage,Desire, Francis, Kathleen, Killarney, Paradise,Trout, and Welcome. Marcel has decreasedsharply over the three years of monitoring.McDonald decreased steadily from 1998 to2001, but have remained stable since then.Mirror had a peak in 1999 and has decreasedsince then. Welcome may also be decreasing,with a sharp decline in 2002. Leota appeared tobe increasing, but dropped in 2002 andremained low in 2003.
A few lakes have one or two significantlyhigher years, such as Beaver-1 and Beaver-2(oddly enough, these are in different years),North in 1997, or Lake Killarney in 1998.Alternatively, there may be one or two loweryears, such as 2001 for Lake Desire. Suchvalues can be anomalous and not repeated inthe future, or could also be indications ofregular, but ephemeral blooms that coincidedwith a sampling date in a particular year, butwas missed in others because of the two-weekgap between sample collections.
ConclusionAverage concentrations of chlorophyll a mayvary a great deal from year to year, particularlyin lakes with large amounts of algae.Concentration of algae by wind and watermovements can lead to samples that are notrepresentative of the lake as a whole, being
28

King County Lake Monitoring Report
0
5
10
15
20
25
Alic
e
Alle
n
Am
es
Ang
le
Bea
ver
1
Bea
ver
2 Bitt
er
Bor
en
Bur
ien
Cla
rk
Cot
tage
Des
ire
Ech
o
Fenw
ick
Five
mile
Fran
cis
Gen
eva
Chl
orop
hyll
a (µ
g/L)
05
10152025
Gra
ss
Hal
ler
Hor
sesh
oe
Jone
s
Joy
Kat
hlee
n
Kill
arne
y
Lang
lois
Leot
a
Luce
rne
Mar
cel
Mar
gare
t
McD
onal
d
Mer
idia
n
Mirr
or
Mor
ton
Hol
m(N
eils
on)C
hlor
ophy
ll a
(µg/
L) 31.334.4
05
10152025
Nor
th
Par
adis
e
Pin
e
Pip
e
Rav
ensd
ale
Saw
yer
Sha
dow
Sha
dy
Spr
ing
Sta
r
Ste
el
Trou
t
Twel
ve
Wal
sh
Wel
com
e
Wild
erne
ss
Yel
low
Chl
orop
hyll
a (µ
g/L)
29.9
Note: See text for the signif icance of the threshold lines
Figure 2-12: 1994-2003 average chlorophyll, May-October
either too high or too low, but these tend toaverage out over a season. In practice,chlorophyll concentrations are rarely high atlakes with low overall productivity, and theyearly averages generally appear to be within aconstant range. Chlorophyll tends to vary moreat lakes with high phytoplankton abundances,such as at Allen. As a measure of productivity,chlorophyll may be subject to more variationthan either Secchi or TP.
Land Use AnalysisA project to look at land use within thewatersheds of monitored lakes was undertakenby Nora Kammer, a King County summer
intern, who was enrolled in graduate school atthe University of Washington in the civilengineering program. Kammer used a suite ofaerial photographs taken in 2002 that hadwestern King County coverage and overlaid thenatural boundary watershed lines for the lakesin the program. Although some of theboundaries have undoubtedly been changed bydevelopments and drainage projects, the projectbecame impossible to complete within the timeframe if all changes were tracked down andincorporated, while likely yielding littledifference in the results.
Four different categories were chosen, withspecified criteria, and all land was classifiedusing ArcView 3.1 software. The categories
29

King County Lake Monitoring Report
Land
use
in la
ke w
ater
shed
s in
2002
Land use in lake watersheds in 2002
0%
20%
40%
60%
80%
100%Echo-Shoreline
BurienHaller
StarSteel
GenevaLeotaAngleMirror
KillarneyPine
MeridianLucerneFenwick
DolloffBitter
MortonMcDonaldKathleenShadow
PipeAllenTroutAlice
FivemileAmes
CottageParadise
NorthHolm (Neilson)
WildernessWelcome
BorenBeaver 2
MarcelSpringGrass
JoyShadyYellowDesire
HorseshoeFrancisTwelveSawyer
Beaver 1Jones
MargaretRavensdale
Langlois
percent of watershed
forested or clearedsingle fam
ily or greater
Figure 2-13: Land use in watersheds, based on 2002 aerial photographs
fore
sted
or c
lear
edsi
ngle
fam
ily o
r gre
ater
30

King County Lake Monitoring Report
were collapsed into two for charting purposes:(1) forested or cleared land; and (2)development at or above the scale of suburbansingle family residences. For more informationon the process or the results, please contactSally Abella at 206-296-8382.
The percentage within each watershed of eachof these two summary categories can becalculated and ordered by descendingpercentages of development (Fig 2-13). Thisdata can then be compared to the trophic statusof the lakes to see if there is a generalcorrelation with development and productivity.
While there are some easy agreements, such asoligotrophic lakes Langlois, Ravensdale, andMargaret located in relatively undevelopedwatersheds and eutrophic Echo Lake in the cityof Shoreline. There are many that do not fit thissimple paradigm, which illustrates the complexnature of the relationship between land use,land configurations and lakes. There are clearlya range of other factors at work, such asadjacent highly productive wetland systems, thenumber of nearby septic systems, agriculturalpractices, degradation of associated wetlands,sewer system installations, even loss of wetlandterritory inside highly developed cityboundaries. However, this set of data willcertainly aid in future research on these effectsand will be available to help answer somequestions about changes noted in particularlakes in the future.
31

King County Lake Monitoring Report32