published in lwt-food science and technology 68, 549-555
TRANSCRIPT
TITLE Effect of frying process on furan content in foods and assessment of furan
exposure of Spanish population
1
2
3
4
5
6
7
AUTHORS Isabel Juaacuteniz Concetta Zocco Vanessa Mouro Concepcioacuten Cid and
M Paz De Pentildea
Published in LWT-Food Science and Technology 68 549-555 (2016)
DOI httpdxdoiorg101016jlwt2015120618
Free Access until March 2 2016 httpauthorselseviercoma1SMdn5O41Dblx9
10
11
12
13
14
15
16
Department of Nutrition Food Science and Physiology School of Pharmacy University
of Navarra IdiSNa Navarra Institute for Health Research E-31080-Pamplona Spain
Corresponding author Mariacutea-Paz de Pentildea Tel +34 948 425600 (806580) Fax +34
948 425740 E-mail address mpdepenaunaves17
18
19
20
21 22
23
24
25
26
27
28
29
30
31
32
33
34
35
36
37
38
39
40
41
42
ABSTRACT
Furan content in eight bread-coated frozen foods (ham croquettes squid rings tuna
pasties churros nuggets fish fingers onion rings and san jacobos) deep-fried in fresh
and reheated olive oil and in five cooked vegetables was evaluated Deep fried foods
showed the highest levels of furan between 12 microg kg-1 (tuna pasties) and 172 microg kg-1
(onion rings) with a furan increase tendency when reheated oil was used In vegetables
furan was only found at low level in griddled onion (35 microg kg-1) The lower
temperature applied (lt 150ordmC) in comparison to that of the deep-fried foods (190 ordmC)
the furan volatilization during longer time cooking (15 min vs 6 min) together with the
food composition differences might explain the low furan content in vegetables As a
preliminary approach for risk assessment the margin of exposure (MOE) was
calculated The total daily intake of furan by Spanish population (239-4372 ngkg
bwday) with MOEs below 10000 indicates a human public health concern However
MOEs for fried foods showed that furan could suppose a possible health risk only in
people with a high consumption of these products Nevertheless further studies should
be developed to provide furan exposure data of other fried foods
KEYWORDS Furan Deep-Frying Cooking Processing contaminants Risk
assessment
1 Introduction 43
44
45
46
47
48
49
50
51
52
53
54
55
56
57
58
59
60
61
62
63
64
65
66
67
Frying is a culinary process applied to a great variety of foods Innovation in the food
industry with the development of new food products associated to social changes in
Western countries have increased the consumption of a great variety of time-saving
ldquoready-to-heatrdquo frozen foods In Spain the consumption of pre-cooked frozen foods
most of them bread-coated increased by 78 in the period 2001-2006 (MAGRAMA
2006) When considering both household and catering and institutions consumption
recent data (2014) indicate that around 123 kg per capita per year of ready-to-serve
foods (including pre-cooked frozen foods) were consumed in Spain increasing every
year (04 higher than in 2013) (MAGRAMA 2014) Croquettes and pasties account
for around 20 of precooked foods with high amount of cereals Churros are also a
typical Spanish fried food product with a high consumption among cereal products
(132 gcapitaday) (AECOSAN 2011) Other commonly consumed foods in the
Mediterranean diet and particularly in the Spanish cuisine are vegetables such as
onions or peppers which are often subjected to a frying process for further uses as base
ingredients or garnish
Fried food palatability is related to unique sensory characteristics including brown
colour crunchy texture and other desired flavour and taste mainly due to Maillard
reactions (Rossell 2001) Frying process induces significant changes in food such as
water loss melanoidins formation increase of fat amount and changes in the fatty acid
profile due to the mass exchange between frying media and the fat of food (Sanchez-
Muniz Viejo amp Medina 1992 Romero Cuesta amp Saacutenchez-Muniz 2000 Miranda et
al 2010) Maillard reaction also induces the formation of volatile compounds that
provide the characteristic aroma and flavour of roasted and fried foods Among them
furan and furanic compounds can significantly contribute to the sensory properties of
heat treated foods (Maga 1979 Anese amp Suman 2013) However furan is a highly
volatile compound which has been classified as a possibly carcinogenic to humans
(group 2B) by the International Agency for Research on Cancer (IARC 1995) The
Joint FAOWHO Expert Committee on Food Additives estimates that furan exposure
through diet is confirmed as a public health problem (JECFA 2010) Therefore Food
Safety Agencies promote furan data collection in foods (EFSA 2010 US FDA 2008)
68
69
70
71
72
73
74
75
76
77
78
79
80
81
82
83
84
85
86
87
Coffee (for adults) and commercial baby foods (for infants) have been proposed as the
major contributors to furan exposure (Fromberg Fagt amp Granby 2009) Some authors
have studied the risk assessment of furan in these products (Waizenegger et al 2012
Lachenmeier Reusch amp Kuballa 2009) however other cooked foods could also
contribute in a high extent to furan exposure due to the fact that furan formation can be
influenced by the heat treatment conditions (Fromberg et al 2009) Carbohydrate
degradation pyrolysis of sugars decomposition of ascorbic acid and oxidation of
polyunsaturated fatty acids during heat treatment can promote furan generation (Perez
Locas amp Yaylayan 2004 Becalski amp Seaman 2005 Maumlrk Pollien Lindinger Blank amp
Mark 2006 Limacher Kerler Conde-Petit amp Blank 2007 Limacher Kerler Davidek
Schmalzried amp Blank 2008 Owczarek-Fendor et al 2011) Some authors suggest that
carbohydrate foods are more prone to the formation of furan probably due to the
Maillard reaction and that the retention of furan in foods is mainly caused by the lipid
fraction especially polyunsaturated fatty acids (Fromberg et al 2009 Arisseto
Vicente Ueno Tfouni amp Toledo 2011) So that it may be expected that the content of
furan in foods subjected to a frying process especially those rich in carbohydrates
could be high Nevertheless an EFSA report highlights that only 8 of the furan data
were reported after food preparation and it claims that future testing of furan should
preferably analysed both as purchased and as consumed indicating the exact cooking
88
89
90
91
92
preparation conditions (time temperature and handling label information) (EFSA
2010) Therefore the main aim of this work was to evaluate the furan content in some
of the most common Spanish fried foods (AECOSAN 2011) both bread-coated frozen
foods cooked by deep-frying and selected vegetables slowly fried in oil and commonly
used as base ingredients for cooking some typical dishes in Spanish cuisine The use of
reheated oil for frying is also a common culinary practice Thus furan occurrence in
foods fried with fresh or reheated oils was also tested With the obtained results a
preliminary approach for risk assessment of furan in fried foods for Spanish population
has been conducted
93
94
95
96
97
98
99
100
101
102
103
104
105
106
107
108
109
110
111
112
113
114
115
116
117
2 Material and methods
21 Food samples and reagents
Three packages of different lots of frozen precooked foods (ham croquettes squid rings
tuna pasties churros nuggets fish fingers onion rings and san jacobos) were obtained
from a local supermarket According to food labels of frozen precooked products
carbohydrates were the most abundant nutrient (194-300 g100g) followed by fat (07-
163 g100g) and proteins (lt10 g100g) Three different batches of vegetables (yellow
onion green pepper cardoon cabbage and chicory) as well as sunflower oil and olive
oil (refined and virgin olive oil blend) were obtained from local stores Furan and d4-
furan as well as sodium chloride were purchased from Sigma-Aldrich Chemical
(Steinheim Germany) The methanol (HPLC grade) was purchased from Panreac
(Barcelona Spain)
22 Standard solutions
Stock solution of d4-furan was prepared by adding 25 microL of d4-furan to 10 mL of
methanol in a vial A 25 microg mL-1 water working solution was prepared daily Stock and
working solutions of furan were prepared using the same procedure for d4-furan Then
six calibration standard solutions at concentration ranging from 0001 to 002 microg mL
118
119
120
121
122
123
124
125
126
127
128
129
130
131
132
133
134
135
136
137
138
139
140
141
142
-1
were prepared by adding the appropriate amount of furan water working solution (25
microg mL-1) into a 20 mL vial containing 3 g of NaCl and 5 mL of deionized water In
addition 40 microL of the d4-furan water working solution (25 microg mL-1) was added to each
calibration solution as internal standard
23 Food samples preparation
Eight frozen precooked foods (ham croquettes squid rings tuna pasties churros
nuggets fish fingers onion rings and san jacobos (ham and cheese in breadcrumbs))
were deep fried in olive oil using a domestic deep fryer Princess 180710 (DOSEFES
SA Barcelona Spain) at 190 ordmC during 6 minutes Temperature was checked with a
digital thermometer type JK Fluke 51 (Fluke USA) In order to study the effect of the
reuse of oil in the formation of furan 20 times reheated olive oil was also employed Oil
polar compounds were measured with a quality-meter frying oil FOM-320 (Ebro
Electronic Ingolstadt Germany)
Chopped vegetables (yellow onion green pepper cardoon cabbage and chicory) (300
g) were fried with olive or sunflower oils (30 mL) at 115 ordmC for 10 minutes in a frying
pan Then temperature was decreased to 108 ordmC for 5 minutes Chopped vegetables
were also submitted to heating at 150 ordmC for 10 minutes and then at 110 ordmC for 5
minutes in a griddle without oil addition
24 Furan analysis
Furan content was analysed following the method described by Perez-Palacios Petisca
Melo amp Ferreira (2012) with modifications Samples were grinded with a fork until
homogenization in an ice bath to avoid furan losses Immediately after 2 g of each
sample were transferred to a 20 mL vial containing 3 g of NaCl and 5 mL of deionized
water For the oil samples 2 mL of oil were transferred to the vial containing 3 g of
NaCl A volume of 40 microL of working solution of d4-furan (25 microg mL
143
144
145
146
147
148
149
150
151
152
153
154
155
156
157
158
159
160
161
162
163
164
165
166
167
-1) was added as
internal standard to each vial which was immediately closed Afterwards the vial was
sonicated for 15 min and stored at 4 degC until further analysis (lt 24h) Each sample was
prepared in triplicate
A SPME fiber (Supelco Co Canada) coated with carboxenpolydimethylxilosane
(CARPDMS) 75 microm was used The fiber was exposed to the headspace of the sample
during 40 min at 37 degC The SPME fiber was desorbed at 280 degC for 10 min in a
HP6890 GC System gas chromatograph (Agilent Technologies Palo Alto CA) coupled
to a mass selective detector (MS) (model 5973 Agilent Technologies) Volatiles were
separated using a column HP PLOTQ (30 m length x 032 mm internal diameter x 020
microm thickness) The carrier gas was helium at a flow of 1 mL min-1 The temperature
program was 40 degC for 5 min then raised at 3 degC min-1 to 120 degC and finally raised at
10ordmC min-1 up to 220ordmC and held for 5 min The GC-MS transfer line temperature was
270 degC The MS operated in the electron impact mode with an electron impact energy of
70 eV and a multiplier voltage of 1247 V and collected data at a rate of 1 scan s-1 over a
range of mz 35-350 Ion source temperature was set at 230 degC Furan and d4-furan
were identified by comparing their retention time and their mass spectra with those of
standard compounds and NIST 05L library Selected ion monitoring (SIM) was used for
the detection of furan and d4-furan using mz 68 and mz 72 respectively Furan was
quantified using d4-furan as an internal standard by calibrate curve method
The method was validated by obtaining a linear relationship between the concentrations
of furan and the respective area ratio between mz 68 and mz 72 (r = 0999) Results for
repeatability showed a good precision of the method with coefficient of variation values
below 5 Taking into account that furan is a highly volatile compound a narrow
dispersion of values was also observed for intermediate precision with coefficients of
variation between 328 and 1619 The limit of detection (LOD) and limit of
quantification (LOQ) were also calculated obtaining 07 and 23 microg furan kg
168
169
170
171
172
173
174
175
176
177
178
179
180
181
182
183
184
185
186
187
188
189
190
191
-1 sample
respectively
25 Estimation of daily furan intake and Margin of Exposure (MOE)
The daily furan exposure in Spanish population due to the analysed fried foods was
calculated based on the obtained furan results in the present work and the Spanish
Dietary Intake Survey (AECOSAN 2011) following the next equation
E = sum (F x C)
Where E is the amount of furan to which a person is exposed (ngkg bwday) due to the
selected foods F is the food intake per day (gkg bwday or mLkg bwday) according
to the Spanish dietary consumption survey (AECOSAN 2011) and C is furan content
(microg kg-1) of each food from the present data or those reported by EFSA (2011)
Moreover in order to provide different exposure scenarios and to consider highly
exposed individuals the following calculations were carried out (1) for food intake the
mean and 99th percentile (P99) both according to the Spanish dietary consumption
survey (AECOSAN 2011) were considered for calculations and (2) for furan content
the mean and 95th percentile (P95) from our samples or those reported by EFSA (2011)
were considered for calculations In analysed food samples where the value is below the
LOD or LOQ of the method and to get a range values were set as 0 for the lower
value and LOD or LOQ for the upper bound respectively
Finally as a first approach for risk assessment the margin of exposure (MOE) was
calculated according to the harmonised approach of the European Food Safety
Authority (EFSA) for the risk assessment of substances which are genotoxic and
carcinogenic (EFSA 2005) The MOE is obtained by dividing the value of the selected
reference point on the dose-response curve for the adverse effect of the substance such
as Benchmark Dose Lower Confidence Limit of 10 (BMDL10) by the estimated
human intake of the substance The BMDL10 used for our calculations was 096 mgkg
bwday for induction of hepatocellular adenomas and carcinomas in female mice which
is the one used in the last WHO Expert Committee on Food Additives for Furan (WHO
2011) For the MOE calculation the estimated intake was calculated taking into account
all the fried samples (both with fresh and reheated olive oil) for each frozen precooked
food assuming that population is normally exposed to both kinds of frying processes
192
193
194
195
196
197
198
199
200
201
202
203
204
205
206
207
208
209
210
211
212
213
214
215
26 Statistical Analysis
Results are shown as means plusmn standard deviations One-way analysis of variance
(ANOVA) was applied for each parameter A Tukey test was applied as a posteriori test
with a level of significance of 95 All statistical analyses were performed using the
STATA v120 software package
3 Results and discussion
31 Furan in cooked foods
Frying process is a common culinary technique applied to foods as different as bread-
coated frozen foods and vegetables to develop their typical sensorial properties or to be
used as base ingredients in Spanish cuisine In this work the occurrence of furan was
tested (1) in eight bread-coated frozen foods selected among the most common
consumed in Spain (AECOSAN 2011) before and after deep frying with fresh or
reheated olive oil and (2) in five vegetables used as base ingredients or garnish in
typical dishes in Spanish cuisine after frying with olive or sunflower oil or after
griddling
216
217
218
219
220
221
222
223
224
225
226
227
228
229
230
231
232
233
234
235
236
237
238
239
240
Figure 1 shows the presence of furan in the bread-coated frozen foods (ham croquettes
squid rings tuna pasties churros nuggets fish fingers onion rings and san jacobos)
analysed before and after deep frying In raw foods furan was only found in tuna
pasties (16 microg kg-1) probably due to their filling (tuna in tomato sauce) previously
cooked Recently a study on furan occurrence in canned fish found the maximum furan
content in those samples containing tomato sauce including tuna (27 microg kg-1) (Pye amp
Crews 2014) In the present samples the pastry that involves the filling of tuna in
tomato sauce together with the chilling temperature might prevent furan volatilization
during food preservation The low furan values found in fresh olive oil (25 microg kg-1)
(Table 1) suggest that oil will negligibly contribute to furan content in fried foods
Similarly Fromberg et al (2009) and EFSA (EFSA 2010 EFSA 2011) showed that
vegetable fats hardly ever contribute to furan content except in the case of olive oil (51
microg kg-1) used as frying agent of homemade meat and fish balls (Fromberg et al 2009)
The low furan content in olive oil used in the present study might be related with its
freshness (3 polar compounds) which is unknown for olive oil previously reported
After frying furan levels increased in all samples In the case of samples fried in fresh
oil furan levels were ranged between 16 microg kg-1 (fish fingers) and 115 microg kg-1 (onion
rings) When reheated oil was used furan levels tended to be higher in many cases
ranging from 12 microg kg-1 (tuna pasties) and 172 microg kg-1 (onion rings) However no
significant differences were found in ham croquettes tuna pasties nuggets and fish
fingers that were fried using either fresh or reheated oil Therefore the use of reheated
oil seemed to have lower influence in furan formation than frying process itself The
highest furan levels were observed in fried onion rings followed by nuggets and
churros while the lowest levels were obtained in some foods containing fish (fish
fingers and tuna pasties) Because in the present study the same time (6 min) and
temperature (190 ordmC) were applied for frying all samples the different food composition
might explain the different levels of furan The longer time in comparison to that
applied for French fries and homemade crisps (3-35min at 190 ordmC) (Fromberg et al
2009) might explain the higher values of furan in the present study Moreover the
Maillard browing reactions induced by frying at high temperatures a dough (churros and
tuna pasties) or food samples with a carbohydrate-rich external coat such as bread (ham
croquettes fish fingers nuggets and san jacobos) or a dough (squid rings and onion
rings) might explain the formation of higher furan content in our samples than in
toasted bread slices or also in coffee brew (Fromberg et al 2009 EFSA 2011)
241
242
243
244
245
246
247
248
249
250
251
252
253
254
255
256
257
258
259
260
261
262
263
264
265
Furan occurrence was also measured in olive oil used as frying agent which was
selected because it is the most common vegetable oil used for frying by Spanish
population (Sayon-Orea et al 2014) The results are shown in Table 1 Unheated olive
oil contained low amount of furan (25 microg kg-1) in agreement with that found in other
vegetable oils (EFSA 2010 EFSA 2011) but lower than that reported for olive oil by
Fromberg et al (2009) However olive oil after used as frying agent contained between
14 and 17 microg kg-1 This may be due to the formation of furan from unsaturated fatty
acids at high temperatures (Becalski amp Seaman 2005) and the retention of furan
formed in fried foods or in their residues by oil (Van Lancker Adams Owczarek De
Meulenaer amp De Kimpe 2009) Table 1 also shows the amount of polar compounds
before and after frying Polar compounds significantly increased when the oil was used
as frying agent being higher than the legal limit (25) (BOE 1989) in the case of
reheated oil after 20 cycles This indicates thermal oxidation and polymerisation
processes that could also promote the formation of furan not only in the oil but also in
the fried foods as it was noted above when reheated oil was used
266
267
268
269
270
271
272
273
274
275
276
277
278
279
280
281
282
283
284
285
286
287
288
289
290
Table 2 shows the occurrence of furan in five vegetables (yellow onion green pepper
cardoon cabbage and chicory) used as base ingredients or garnish in typical dishes in
Spanish cuisine after frying with olive or sunflower oils or after griddling (heat
treatment without oil addition) Furan was only found in griddled onion at low level (35
microg kg-1) and in the other griddled vegetables below the limit of quantification of 23 microg
kg-1 or the limit of detection of 07 microg kg-1 Furan was not detected in any of the raw or
fried vegetable samples The lower temperature applied (lt 115ordmC) in comparison to that
of the deep-fried foods (190 ordmC) the furan volatilization during longer time cooking (15
min vs 6 min) together with the food composition (lower carbohydrates and fat) might
explain the low furan content
32 Furan exposure in Spanish population
The estimation of furan potential intake by Spanish population due to some of the most
commonly consumed fried foods was made based on the furan results obtained in the
present work (mean and P95) and the mean and P99 consumption of the analysed foods
reported by the Spanish Dietary Intake Survey (AECOSAN 2011) When consumption
data were not available in the dietary survey such as in squid rings onion rings and san
jacobos the mean consumption value for fried foods analysed in the present work was
used for furan estimation
Table 3 and 4 shows the average consumption of the different foods analysed in the
present study by the Spanish population (AECOSAN 2011) and the furan exposure due
to these foods Olive oil is one of the main foods which might contribute to furan intake
(up to 1463 ng kg bwday for the worst scenario) due to its high consumption in Spain
However it has to be considered that most of the olive oil is consumed unheated
mainly in salads which present very low furan content (25 microg kg
291
292
293
294
295
296
297
298
299
300
301
302
303
304
305
306
307
308
309
310
311
312
313
314
315
-1) providing a furan
intake of 57 and 192 ngkg bwday for those consumers with a mean and P99 food
consumption respectively Similarly the high consumption of onion might contribute
up to 368 ngkg bwday of furan intake for the worst scenario However onion is
mainly consumed raw in salads or fried in which samples furan content was not found
Therefore only in the case of the consumption of onion treated by griddling which is
less common than the other culinary techniques it contributes to furan dietary exposure
Among fried frozen precooked foods the highest furan intake is due to onion rings (14-
54 ngkg bwday) and churros (13-42 ngkg bwday) A total dietary exposure ranged
from 47 to 178 ngkg bwday of furan was estimated for Spanish population due to the
consumption of the fried frozen precooked foods analysed in the present study
The total exposure of furan in Spanish population (Table 5) was also estimated based on
data of the furan content (mean and P95) per main food category reported by EFSA
(2011) and the mean and P99 consumption of these foods by Spanish population
(AECOSAN 2011) Coffee brew with a range of furan levels between 42-45 microg kg-1
(mean) and 228 microg kg-1 (P95) (EFSA 2011) has proposed as the major contributor to
furan intake in European adult population (Fromberg 2009 EFSA 2011 Sijia Enting
amp Yuan 2014) As EFSA suggested these values might be overestimated due to the
high consumption of coffee brew in Northern European countries (more than 10 mlkg
bwday of coffee) that usually has been taken to estimate furan content (Fromberg et al
2009) In Spain coffee brew consumption is much lower (up to 54 mlkg bwday)
(AECOSAN 2011) however coffee is also shown as the main contributor to furan
exposure except for those coffee drinkers with the mean consumption of coffee brews
with a mean furan content After coffee the highest furan exposure in the Spanish
population is due to cereal products This could be due to the fact that the category
ldquocereal productsrdquo in Spanish survey covers a wide range of products and consequently
its consumption might be overestimated EFSA report only collected furan data from 4
cereal products samples from Spain but it is difficult to know what are the specific
foods included Taking into account that typical Spanish fried foods such as churros
croquettes and pasties are included in the category ldquocereal productsrdquo (AECOSAN
2011) and that as far as we know this is the first study who reports furan content in
these products EFSA data should be revised to include them Regarding vegetables
results furan values reported by EFSA (2011) were higher than those resulting on the
present study where furan was scarcely detected Since canned and jarred products
present high levels of furan (US FDA 2004) it is probably that EFSA data mainly
include this kind of vegetables
316
317
318
319
320
321
322
323
324
325
326
327
328
329
330
331
332
333
334
335
336
337
338
339
340
A total mean dietary exposure of furan of 239 ngkg bwday was estimated for Spanish
population This result is in the range reported by EFSA (2011) for European adults (30
and 580 ngkg bwday) However taking into account the worst scenario that is the
high consumption (P99) of different foods with the highest content of furan (P95) total
dietary exposure of furan could reach up to 4372 ngkg bwday
Additionally to have a preliminary approach for risk assessment MOEs of furan for
fried frozen precooked food samples and for the main food categories established by
EFSA are shown in Tables 4 and 5 According to the EFSA (2005) a MOE of 10000
or higher would be considered as a low public health concern and reasonably as a low
priority for risk management actions WHO (2011) obtained MOEs of furan of 960 and
480 for average and high dietary exposures respectively Therefore the Committee
considered that these MOEs indicate a human health concern for furan In the case of
the total furan exposure in Spanish population (Table 5) MOEs were also below 10000
in all scenarios When MOEs were calculated for fried frozen precooked food samples
for Spanish population (Table 4) results showed that furan could suppose a possible
public health risk only in the case of people with the highest consumption of these food
products
341
342
343
344
345
346
347
348
349
350
351
352
353
354
355
356
357
358
359
360
361
362
363
364
365
In summary deep-frying process at high temperatures induces the formation of
considerable amounts of furan in bread-coated foods with a furan increase tendency
when reheated oil is used suggesting a health risk in populations groups with a high
consumption of these frozen precooked products Nevertheless taking into account the
limitation of the low number of samples in the present study as well as the increment of
the consumption of these fried products by Spanish population further studies should be
developed to provide exposure data for a final risk assessment of fried foods Therefore
a higher number of samples from different commercial brands homemade products and
other ethnic foods should be analysed Moreover further studies about the occurrence of
furan in fried bread-coated foods should be developed considering other aspects such as
the volatilization of furan during the time between cooking and consumption due to the
fact that some authors found a decrease in furan levels (Zoller Sager amp Reinhard 2007
EFSA 2011) while others reported a furan increase during cooling in toasted bread
(Fromberg et al 2009) Taking into account that 936 of the collected furan results in
EFSA report (2011) were derived from samples without cooking processes data should
be continuously revised including higher numbers of foods cooked at different
conditions Furthermore risk assessment of foods should be conducted to consider
vulnerable groups like adolescents and infants and professionals in restaurants
caterings etc
366
367
368
369
370
371
372
373
374
375
376
377
378
379
380
381
382
383
384
385
386
387
Acknowledgments
We thank the Spanish Ministry of Economy and Competitiveness (AGL2014-52636-P)
and PIUNA (Plan de Investigacioacuten de la Universidad de Navarra) for their contribution
to the financial support of this work We also thank Dr Vettorazzi for her kind assistant
and advices in toxicological aspects and Ms Gwenaelle Ceniceros for her kind help IJ
wishes to express her gratitude to the Association of Friends of the University of
Navarra for the grant received
The authors declare no conflicts of interest
References
AECOSAN (Agencia Espantildeola de Consumo Seguridad Alimentaria y Nutricioacuten)
(2011) ENIDE Encuesta nacional de ingesta dieteacutetica (2009-2010) Resultados
sobre datos de consumo URL
httpwwwaesanmspsigobesAESANdocsdocsevaluacion_riesgosdatos_consu
moENIDEpdf Accessed 280915
Anese M amp Suman M (2013) Mitigation strategies of furan and 5-
hydroxymethylfurfural in food Food Research International 51(1) 257-264
Arisseto AP Vicente E Ueno MS Tfouni SA amp Toledo MC (2011) Furan
levels in coffee as influenced by species roast degree and brewing procedures
Journal of Agricultural and Food Chemistry 59 3118ndash3124
Becalski A amp Seaman S (2005) Furan precursors in food A model study and
development of a simple headspace method for determination of furan Journal of
AOAC International 88(1) 102-106
388
389
390
391
392
393
394
395
396
397
BOE (Boletiacuten Oficial del Estado) (1989) Orden de 26 de enero de 1989 por la que se
aprueba la norma de calidad para los aceites y grasas calentados
URLhttpwwwboeesdiario_boetxtphpid=BOE-A-1989-2265 Accessed
280915
EFSA (European Food Safety Authority) (2005) Opinion of the Scientific Committee
on a request from EFSA related to a harmonised approach for risk assessment of
substances which are both genotoxic and carcinogenic EFSA Journal (282) 1-31
URLhttpwwwefsaeuropaeusitesdefaultfilesscientific_outputfilesmain_doc398
uments282pdf Accessed 151215 399
400
401
EFSA (European Food Safety Authority) (2010) Update of results on the monitoring
of furan levels in food EFSA Journal 8(7) 1702 URL
httpwwwefsaeuropaeuitsearchdoc1702pdf Accessed 280915 402
403
404
EFSA (European Food Safety Authority) (2011) Update on furan levels in food from
monitoring years 2004-2010 and exposure assessment EFSA Journal 9 (9)2347
URL httpwwwefsaeuropaeuenefsajournaldoc2347pdf Accessed 280915 405
406
407
Fromberg A Fagt S amp Granby K (2009) Furan in heat processed food products
including home cooked food products and ready-to-eat products EFSA External
Scientific Report URL httpwwwefsaeuropaeuensupportingdoc1epdf
Accessed 280915
408
409
IARC (International Agency for Research on Cancer) (1995) Furan IARC
Monographs on the evaluation of carcinogenic risks to humans 63 393-407
410
411
412
413
414
415
416
417
418
419
420
421
422
423
424
425
426
427
428
429
430
JECFA (Joint FAOWHO Expert Committee on Food Additives) (2010) Summary and
conclusions of the 72nd JECFA meeting URL
httpwwwwhointfoodsafetychemsummary72_revpdf Accessed 280915
Lachenmeier DW Reusch H amp Kuballa T (2009) Risk assessment of furan in
commercially jarred baby foods including insights into its occurrence and
formation in freshly home-cooked foods for infants and young children Food
Additives amp Contaminants Part A 266 776-785
Limacher A Kerler J Conde-Petit B amp Blank I (2007) Formation of furan and
methylfuran from ascorbic acid in model systems and food Food Additives amp
Contaminants 24 122-135
Limacher A Kerler J Davidek T Schmalzried F amp Blank I (2008) Formation of
furan and methylfuran by maillard-type reactions in model systems and food
Journal of Agricultural and Food Chemistry 56(10) 3639-3647
Maga J A (1979) Furans in foods Critical Reviews in Food Science and Nutrition
11(4) 355
MAGRAMA (Ministry of Agriculture Food and Environment) (2006) La
alimentacioacuten en Espantildea- 2006 Capiacutetulo III La alimentacioacuten espantildeola en 2006
URL httpwwwmagramagobesenalimentacionpublicacioneslibro2010-11-
04_1856257562aspx Accessed 280915
MAGRAMA (Ministry of Agriculture Food and Environment) (2014) La
alimentacioacuten mes a mes en Espantildea Agosto 2014 URL
httppublicacionesoficialesboeesdetailphpid=630928014-0008 Accessed
280915
431
432
433
434
435
436
437
438
439
440
441
442
443
444
445
446
447
448
449
450
451
452
Maumlrk J Pollien P Lindinger C Blank I amp Mark T (2006) Quantitation of furan
and methylfuran formed in different precursor systems by proton transfer reaction
mass spectrometry Journal of Agricultural and Food Chemistry 54(7) 2786-2793
Miranda J M Martiacutenez B Peacuterez B Antoacuten X Vaacutezquez B I Fente C A et al
(2010) The effects of industrial pre-frying and domestic cooking methods on the
nutritional compositions and fatty acid profiles of two different frozen breaded
foods LWT - Food Science and Technology 43(8) 1271-1276
Owczarek-Fendor A De Meulenaer B Scholl G Adams A Van Lancker F
Eppe G et al (2011) Furan formation from lipids in starch-based model systems
as influenced by interactions with antioxidants and proteins Journal of
Agricultural and Food Chemistry 59(6) 2368-2376
Perez Locas C amp Yaylayan V A (2004) Origin and mechanistic pathways of
formation of the parent Furan A food toxicant Journal of Agricultural and Food
Chemistry 52(22) 6830-6836
Perez-Palacios T Petisca C Melo A amp Ferreira IMPLVO (2012)
Quantification of furanic compounds in coated deep-fried products simulating
normal preparation and consumption Optimisation of HS-SPME analytical
conditions by response surface methodology Food Chemistry 135(3) 1337-1343
Pye C amp Crews C (2014) Furan in canned sardines and other fish Food Additives amp
Contaminants Part B 7(1) 43-45
453
454
455
456
457
458
459
460
461
462
463
464
465
466
467
468
469
470
471
472
473
Romero A Cuesta C amp Sanchez-Muniz F (2000) Cyclic fatty acid monomers and
thermoxidative alteration compounds formed during frying of frozen foods in extra
virgin olive oil Journal of the American Oil Chemists Society 77(11) 1169-1175
Rossell JB 2001 Frying Improving Quality Woodhead Publishing Limited
Cambridge 1ndash355
Sanchez-Muniz F Viejo J M amp Medina R (1992) Deep-frying of sardines in
different culinary fats changes in the fatty acid composition of sardines and frying
fats Journal of Agricultural and Food Chemistry 40(11) 2252-2256
Sayon-Orea C Martinez-Gonzalez M A Gea A Flores-Gomez E Basterra-
Gortari F J amp Bes-Rastrollo M (2014) Consumption of fried foods and risk of
metabolic syndrome The SUN cohort study Clinical Nutrition 33(3) 545-549
Sijia W Enting W Yuan Y (2014) Detection of furan levels in selected Chinese
foods by solid phase microextraction-gas chromatographymass spectrometry
method and dietary exposure estimation of furan in the Chinese population Food
and Chemical Toxicology 64 34-40
US FDA (United States Food and Drug Administration) (2004) Exploratory Data on
Furan in Food URL httpwwwfdagovohrmsdocketsac04briefing4045b2_09
_furan20datapdf Accessed 070116
US FDA (United States Food and Drug Administration) (2008) Exploratory data on
furan in foodmdashindividual food products URL
httpwwwfdagovfoodfoodborneillnesscontaminantschemicalcontaminantsucm
078439htm Accessed 280915
474
475
476
477
478
479
480
481
482
483
484
485
Van Lancker F Adams A Owczarek A De Meulenaer B amp De Kimpe N (2009)
Impact of various food ingredients on the retention of furan in foods Molecular
Nutrition amp Food Research 53(12) 1505-1511
Waizenegger J Winkler G Kuballa T Ruge W Kersting M Alexy U amp
Lachenmeier DW (2012) Analysis and risk assessment of furan in coffee products
targeted to adolescents Food Additives amp Contaminants Part A 29(1) 19-28
WHO (World health organization)(2011) Safety evaluation if certain contaminants in
food WHO Food Additive series (63) 487-605 URL
httpappswhointirisbitstream106654452019789241660631_engpdf Access
151215
486
487
488
489
Zoller O Sager F amp Reinhard H (2007) Furan in food Headspace method and
product survey Food Additives and Contaminants 24(sup1) 91
Figure caption
Figure 1 Furan (microg kg-1) in frozen precooked bread-coated foods before and after
deep frying treatment with fresh and reheated olive oil
Table 1 Furan levels and polar compounds in olive oil before frying (unheated) and
after one (heated) or 20 frying cycles (reheated)
Unheated olive oil
Heated olive oil (1 frying cycle)
Reheated olive oil (20 frying cycles)
Furan (microg kg-1) 25 plusmn 02 b 17 plusmn 3 a 14 plusmn 3 a
Polar compounds () 30 plusmn 00 c 203 plusmn 10 b 345 plusmn 18 a
Values are shown as means plusmn standard deviations (n=3) Different letters for row indicate significant differences
Table 2 Furan (microg kg-1) in vegetables before and after heat treatment
Vegetable Heat treatment Furan (microg kg-1)
Onion Raw nd Fried in olive oil nd Fried in sunflower oil nd Griddled 35 plusmn 03
Green pepper Raw nd Fried in olive oil nd Fried in sunflower oil nd Griddled nd
Cardoon Raw nd Fried in olive oil nd Fried in sunflower oil nd Griddled lt23
Cabbage Raw nd Fried in olive oil nd Fried in sunflower oil nd Griddled lt23
Chicory Raw nd Fried in olive oil nd Fried in sunflower oil nd Griddled lt07
Values are shown as means plusmn standard deviations (n=3) nd not detected
Table 3 Food consumption and furan levels (ngkg bwday) per selected foods in the
Spanish population
Food
Food consumptiona
(gkg bwday or mLkg bwday)
Furan contentb
(microgkg)
Mean P99 Range Mean P95
Ham croquettes 0012 047 12 ndash 32 23 32 Squid rings c 0010 030 30 ndash 90 59 88 Tuna pasties 0009 038 12 ndash 28 19 28 Churros 0021 053 47 ndash 81 63 80 Nuggets 0005 0077 54 ndash 86 71 85 Fish fingers 0002 0048 76 ndash 23 17 22 Onion rings c 0010 030 106 ndash 181 143 179 San Jacobos c 0010 030 31 ndash 74 51 73 Olive oil 23 77 24 ndash 20 97 19 Onion 23 105 0 ndash 35 -- -- Green pepper 14 115 0 ndash 070 -- -- Cardoon 016 31 0 ndash 23 -- -- Cabbage 23 667 0 ndash 23 -- -- Chicory 0010 032 0 ndash 070 -- --
a Mean and P99 food consumption by Spanish population as recorded by AECOSAN( 2011) b Results obtained from samples fried with fresh and reheated olive oil (n=6)c Mean values of fried foods consumption are taken because data are not available
Table 4 Furan exposure (ngkg bwday) and Margin of Exposure (MOE) per selected
foods in the Spanish population
Food
Furan exposure
(ngkg bwday)
MOE a
Intake Mean
Furan concentration Mean P95
Intake P99
Furan concentration Mean P95
Intake Mean
Furan concentration Mean P95
Intake P99
Furan concentration Mean P95
Ham croquettes 027 038 11 15 3468459 2524854 88181 64191 Squid rings 059 088 18 27 1629696 1086956 54142 36111 Tuna pasties 017 025 72 10 5561831 3828667 132775 91400 Churros 13 17 33 42 722793 570750 28802 22743 Nuggets 035 042 54 65 2713717 2267024 176215 147209 Fish fingers 0030 0040 083 11 27655080 21323856 1152295 888494 Onion rings 14 18 43 54 670071 536770 22261 17832 San Jacobos 050 073 15 22 1898483 1312685 63072 43610
TOTAL 47 62 134 178 204540 155228 7174 5402 a Margin of exposure (MOE) to furan for different exposure scenarios Calculated with The BMDL10 used in the last WHO Expert Committee on Food Additives for Furan (WHO 2011) (096 mgkg bw)
Table 5 Food consumption furan content furan exposure (ngkg bwday) and Margin of exposure (MOE) per main food category in the
Spanish population
Food
Food consumption a(gkg bwday or mLkg bwday)
Furan content b
(microgkg)
Furan exposure
(ngkg bwday)
MOE c
Mean P99 Mean P95
Intake Mean Furan concentration
Mean P95
Intake P99 Furan concentration
Mean P95
Intake Mean Furan concentration
Mean P95
Intake P99 Furan concentration
Mean P95
Coffee brew 095 54 42 ndash 45 228 41 217 231 1227 23500 4432 4149 782 Baked beans 0004 009 22 ndash 24 57 0090 023 21 51 10666666 4173913 463768 187134 Beer 14 15 33 ndash 52 13 61 19 65 199 156862 51282 14734 4817 Cereal products 32 92 15 ndash 18 60 53 194 152 551 17957 4938 6330 1741 Fish 15 54 17 86 15 128 81 467 64042 7491 6979 2055 Fruit juices 11 12 22 ndash 46 8-10 39 10 41 110 245524 92753 23162 8750 Fruits 36 14 2 ndash 64 11 15 39 59 155 64386 24583 16164 6172 Meat products 27 81 13 ndash 17 67 41 183 121 542 23443 5248 7911 1771 Milk products 51 13 5 ndash 56 20 27 102 69 260 35661 9448 13933 3692 Sauces 017 14 83 ndash 11 30 16 51 13 42 585365 188235 71569 23021 Soups 0039 14 23 ndash 24 72 092 28 33 100 1043478 341637 29389 3592 Soy sauce 0017 030 27 67 046 11 81 20 2086956 842105 6971678 47761 Vegetables juices na Na 29 ndash 9 18 na na na na Vegetables 29 97 69 ndash 96 41 25 122 80 399 39056 7857 11959 2406 Cocoa 0050 078 9 ndash 10 40 047 20 74 31 2042553 888888 129554 30769 Snacks and crisps 0040 072 96 ndash 10 27 039 11 71 19 461538 102564 136054 49382 Soft drinks 21 17 08 ndash 12 45 21 94 17 79 461538 102564 54794 12176 Soya products na na 67 28 na na na na Sweets 024 13 5 ndash 6 18 13 43 72 24 727272 222222 133240 40712 Tea 051 67 1 ndash 17 33 069 17 89 22 1391304 571428 106773 43680 Vegetables fat 053 14 15 ndash 17 10 085 53 22 14 1129411 181132 431654 69064 Wine and liquors 24 19 13 56 32 14 24 105 302839 70278 16081 9108
Total 239 1061 1032 4372 4021 905 930 220 a Mean and P99 food consumption by Spanish population as recorded by AECOSAN (2011) b Mean furan content in food per main food category by EFSA (2011) c Margin of exposure (MOE) to furan for different exposure scenarios Calculated with The BMDL10 used in the last WHO Expert Committee on Food Additives for Furan (WHO 2011) (096 mgkg bw) na Not data available
Figure 1 Furan (microg kg-1) in frozen precooked bread-coated foods before and after
deep frying treatment with fresh and reheated olive oil
Different letters indicate significant differences (p le 005) Results are shown as means plusmn standard deviations (n=3)
Esta obra estaacute bajo una licencia de Creative Commons Reconocimiento-NoComercial-SinObraDerivada 40 Internacional
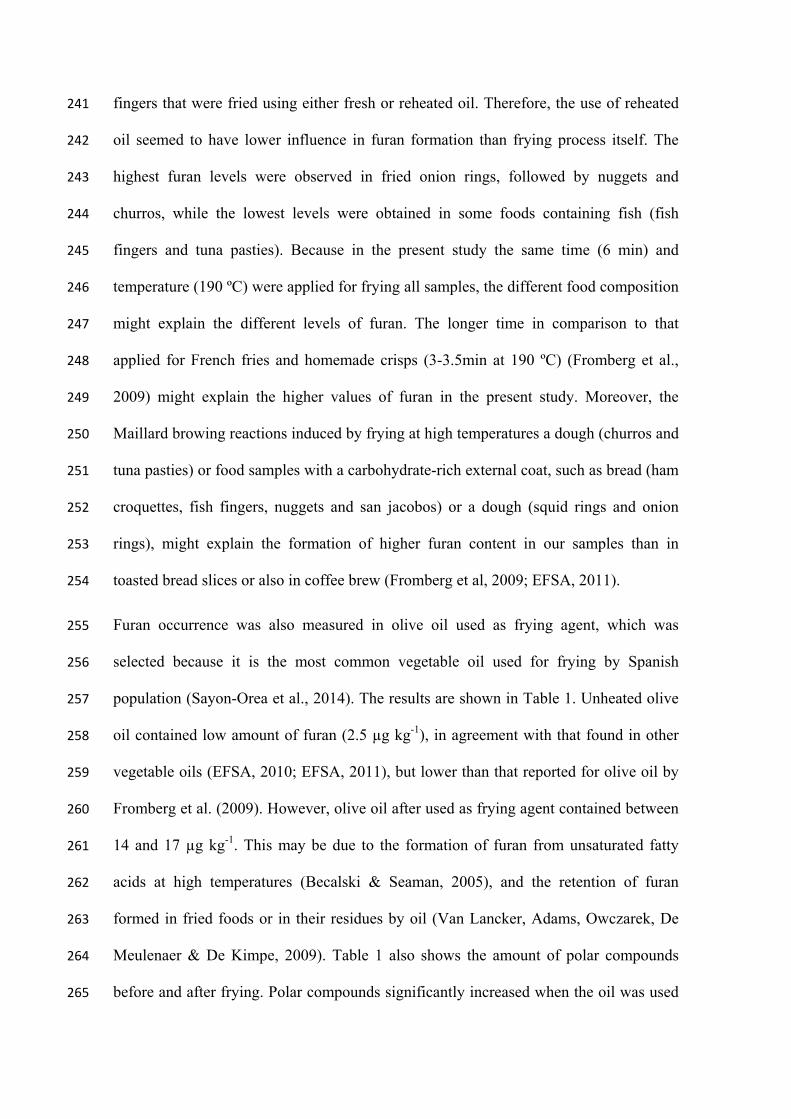
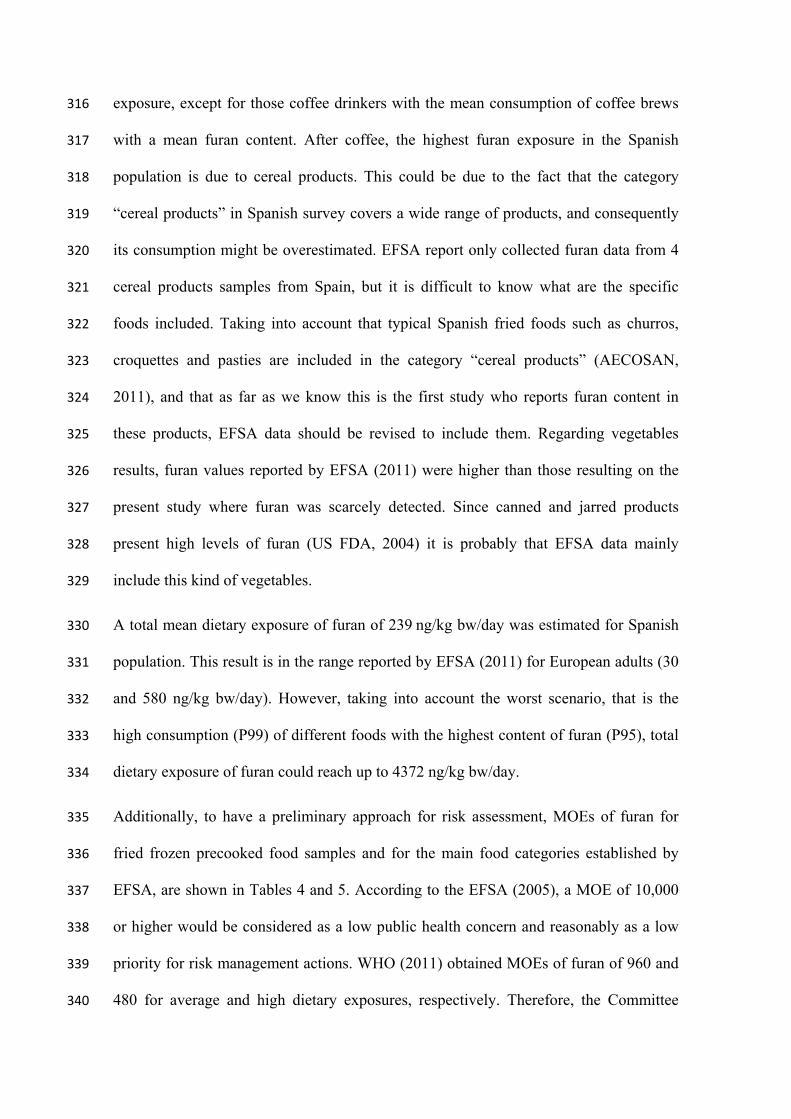
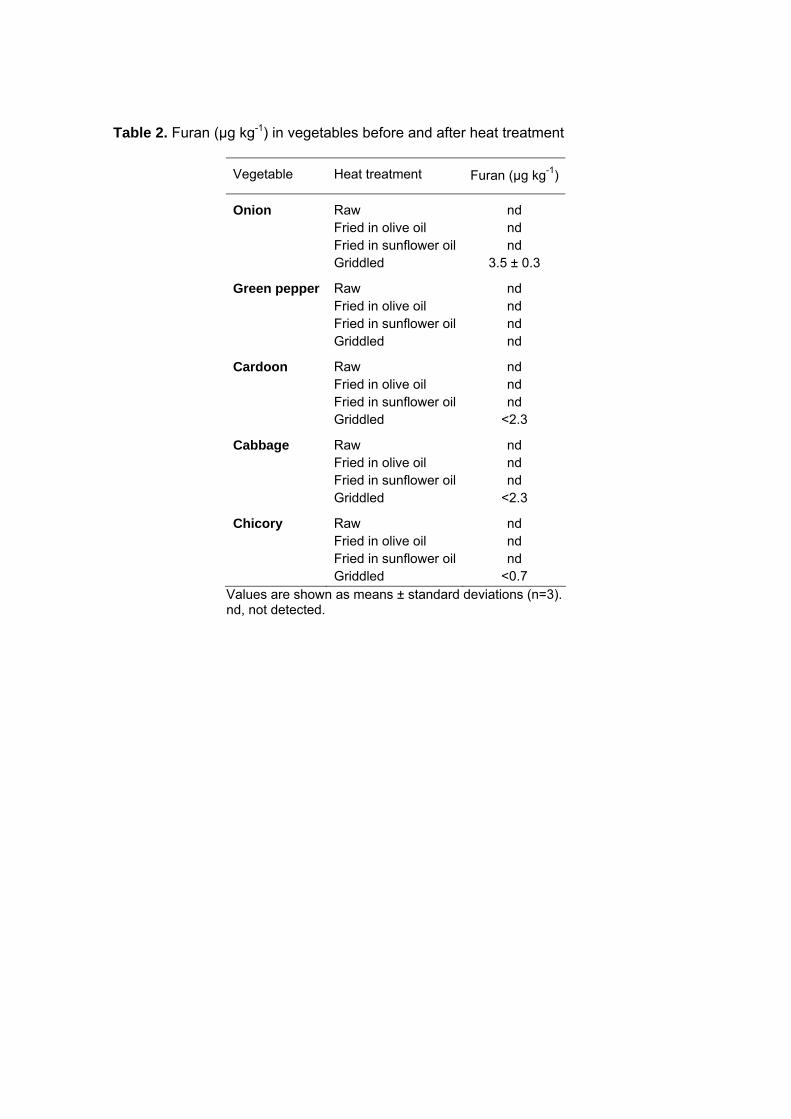
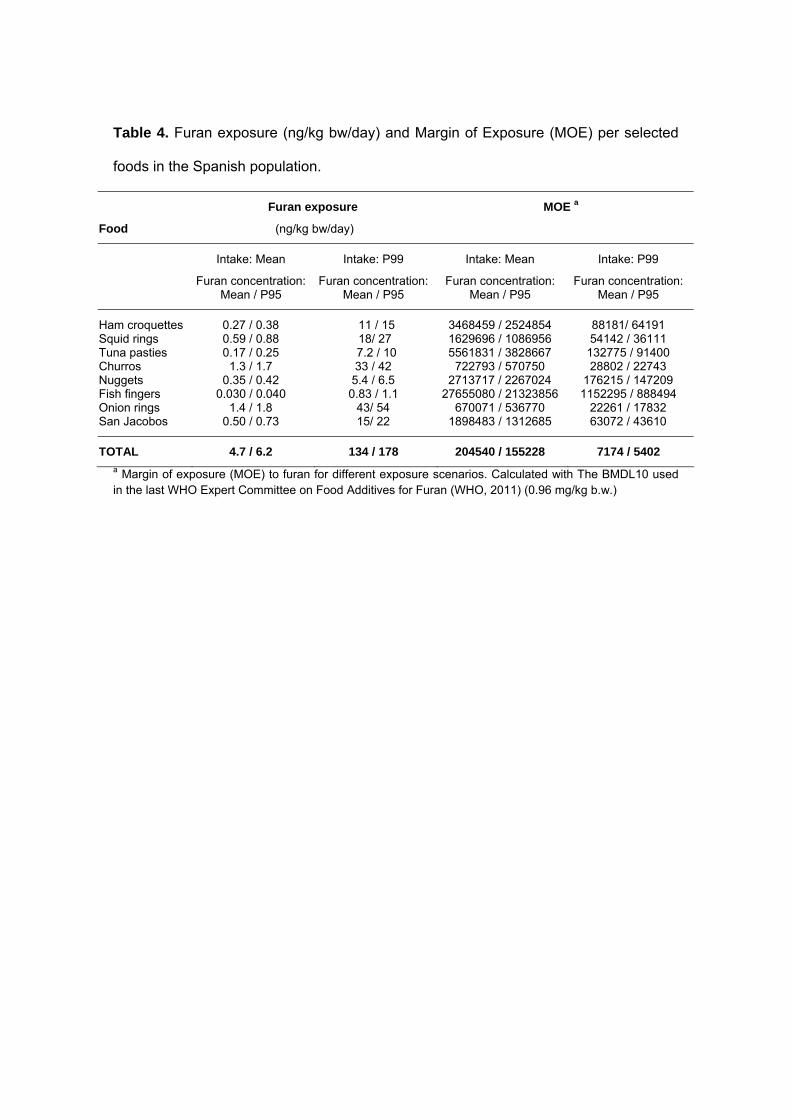
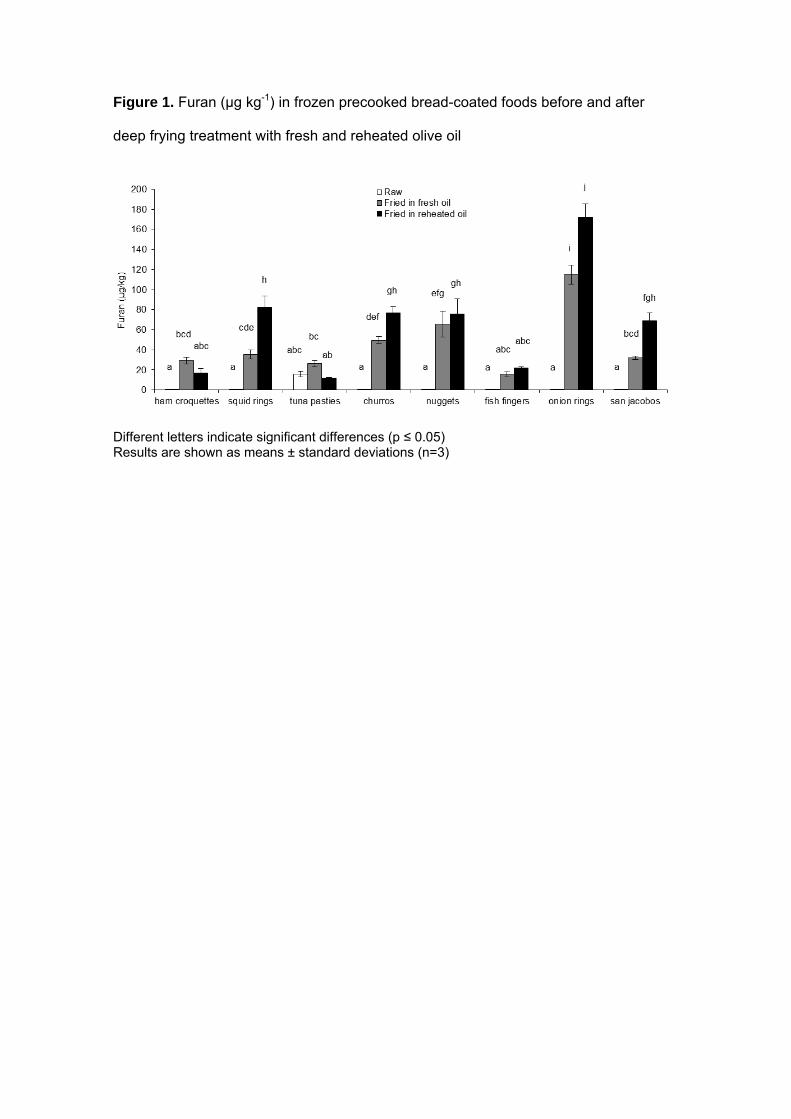
Esta obra estaacute bajo una licencia de Creative Commons Reconocimiento-NoComercial-SinObraDerivada 40 Internacional