development of the loaded wheel tracking test (lwt) for
TRANSCRIPT

Development of the Loaded Wheel Tracking Test (LWT) for Evaluating Bleeding In Chip
Seals and Relationship to Emulsion Residue Rheology
By
Preeda Chaturabong
A thesis submitted in partial fulfillment of
the requirements for the degree of
MASTER OF SCIENCE
CIVIL & ENVIRONMENTAL ENGINEERING
at the
UNIVERSITY OF WISCONSIN – MADISON
2014
i
Executive Summary
State highway agencies (SHAs) lack sufficient to maintain the nation’s highway
infrastructure. Most pavements have structural capacity, but lack serviceability functions as their
surface characteristics have been lost with time. Pavement preservation surface treatments present
SHAs with a cost-effective means of restoring surface characteristics and extending the service
lives of structurally adequate pavement. Chip seals are one of the most commonly used cost-
effective surface treatments in preventative and preservations maintenance programs. Compared
to Hot Mix Asphalt (HMA) overlays, chip seals allow many kilometers of highways to be
resurfaced with the same budget, and have many environmental and sustainability benefits in
addition. Chip seals can extend pavement life up to 5 years depending on the quality of the
materials, design and construction practice, climate, traffic and conditions of the existing
pavements.
One commonly distress leading to premature failure of chip seals is bleeding. Bleeding
reduces the surface texture of the pavement, and hence compromises the safety of the traveling
public especially during wet seasons, and intersections. However, although factors leading to
premature bleeding are known, there are currently no laboratory test methods for evaluating
bleedings in chip seals. The first objective of this thesis was to develop a laboratory testing
procedure and analysis method for evaluating bleeding in chip seal using testing device of the
loaded wheel test (LWT) specified in the American Society for Testing and Materials (ASMT D
6372). The second objective was to investigate the relationship between emulsion residue
performance as measured by the ASTM D7405 “Multiple Stress Creep and Recovery (MSCR)”
test and chip seal bleeding resistance as measured by the LWT to evaluate the influence factors
that related to bleeding performance to prevent bleeding in the field. The third objective was to
quantify the benefits of emulsion modification to address bleeding resistance through comparison

ii
of emulsion residue and chip seal mixture samples prepared with conventional emulsions, and
emulsions modified with SBS polymer and SBR Latex.
A new sample preparation, testing and analysis procedure that allow for the
effects of existing pavement substrate, traffic load, traffic volume, and temperature on
bleeding to be evaluated using the LWT device was developed in this study. Specifically
by introducing a system to control test temperature and application of image analysis to quantify
changes in surface Results indicate that the modified LWT test method is capable of quantifying
bleeding potential and bleeding development with loading cycles of laboratory prepared chip seal
sample. Two response parameters of surface texture and image analysis were used as response
parameters. Results showed emulsion application rate, aggregate gradation, and emulsion type to
significant factors affecting bleeding of LWT evaluated samples. Also, there is moderate
relationship between texture loss and % bleeding. The MSCR test was found to be a promising
evaluation tool for emulsion residue performance properties as it proved capable of differentiating
between emulsion chemistries and modification in terms of sensitivity to both temperature and
stress. The result showed that modification could give the same creep compliance at higher
temperature. The creep compliance, Jnr at 3.2kPa, %Recovery at 0.1kPa and %Recovery at 3.2
kPa obtained from the MSCR test results were found to be the significant factors affecting
bleeding.
In all, the LWT is shown to be the versatile equipment for testing the bleeding for chip
seal and slurry seal. It recommended that a combinations different aggregate gradations,
aggregate type, and emulsions type be evaluated, and the results be used to develop a
standardized laboratory test for evaluating bleeding. Field results are also needed to help establish
specification limits for the test.

iii
Acknowledgments
I would like to thank the people who supported me throughout the project. I would like to
thank to my advisor, Professor Hussain U.Bahia. The completion of this thesis could not have
been possible without the direction and encouragement from him. I would also like to give a
special gratitude to my committee members, Professor William J. Likos and Professor Gustavo
Parra-Montesinos. I would like to thank to Dr. Andrew Hanz for being my mentor throughout my
master program. I also would like to thank materials suppliers for supporting this project.
The support of FHWA and WRI is greatly appreciated.
A big thank to my friends in Modified Asphalt Research Center who support and help
me throughout my thesis and my life in and out the group.
Lastly, I would like to give the expression to the endless and unconditional love; my
parents, my sister and my girlfriend who stand by me all the time both in happiness and in sadness.
Without you, I could not come to this point.
iv
List of Contents
Executive Summary ....................................................................................................................... i
Acknowledgments ......................................................................................................................... iii
List of Contents ............................................................................................................................. iv
List of Figures .............................................................................................................................. vii
List of Tables ................................................................................................................................. ix
List of Equations ........................................................................................................................... xi
I. CHAPTER 1: INTRODUCTION ..................................................................................... 1
1. Background ......................................................................................................................... 1
2. Problem Statement............................................................................................................... 2
3. Hypothesis ........................................................................................................................... 4
4. Research Objective .............................................................................................................. 4
5. Thesis Organization ............................................................................................................. 5
II. CHAPTER 2: LITERATURE REVIEW ......................................................................... 6
2.1 Chip Seal ......................................................................................................................... 6
2.2 Materials for Chip Seals .................................................................................................. 9
2.2.1 Asphalt Emulsion ......................................................................................................... 10
2.2.2 Aggregate .............................................................................................................. 14
2.3 Current Asphalt Emulsion Specifications ...................................................................... 14
2.4 Chip Seal Design Methods ............................................................................................ 14
2.4.1 McLeod’s Seal Coat Design Method ..................................................................... 15
2.4.2 McLeod’s Method Procedure ................................................................................ 16
2.4.3 Concept of Void Filled .......................................................................................... 18
2.5 Chip Seal Distresses ...................................................................................................... 19
2.5.1 Raveling and Stripping .......................................................................................... 19
2.5.2 Bleeding and Flushing ........................................................................................... 21
2.6 Factors Affecting Bleeding ............................................................................................ 22
2.6.1 Aggregate Properties ............................................................................................. 22
2.6.2 Asphalt Binder Properties ...................................................................................... 23
2.6.3 Emulsion Application Rate .................................................................................... 23
2.6.4 Climatic Conditions ............................................................................................... 23
2.6.5 Existing Pavement Surface .................................................................................... 23

v
2.6.6 Traffic Type and Volume ...................................................................................... 24
2.7 Laboratory Tests Methods for Evaluating Bleeding ...................................................... 25
2.8 Potential Test for Asphalt Emulsions Residues Properties Related to Bleeding ........... 25
2.9 Potential Laboratory Bleeding Test for Chip Seal Samples .......................................... 26
2.10 Analysis Methods for Quantifying Bleeding ................................................................. 28
2.11 Image Processing and Analysis System (IPAS) ............................................................ 28
2.12 Sand Patch Method ........................................................................................................ 30
III. CHAPTER 3: MATERIALS AND EXPEREMENTAL PLAN .................................. 31
3.1 Materials ........................................................................................................................ 31
3.2 Aggregate Gradation ..................................................................................................... 32
3.3 Materials Application Rates .......................................................................................... 33
3.4 Experimental Design and Methods ............................................................................... 33
3.5 Emulsion Residue Performance .................................................................................... 35
3.6 Modified Loaded Wheel Test to Assess Chip Seal Bleeding ........................................ 36
3.7 Sample Preparation and Testing Procedure ................................................................... 41
3.8 Analysis Methods for Quantifying Bleeding ................................................................. 42
3.9 Image Analysis by IPAS2 .............................................................................................. 43
3.10 Modified Sand Patch Test to Quantify Texture for Chip Seal....................................... 44
IV. CHAPTER 4: Experimental Results .............................................................................. 46
4.1 Application of Modified LWT Test to Assess Bleeding Potential ................................ 46
4.1.1. Effect of Temperature on Bleeding Resistance ..................................................... 48
4.1.2. Effect of Contact Stress on Bleeding Resistance ................................................... 50
4.1 Effect of Loading Cycle on Bleeding Resistance .......................................................... 51
4.1.3. Effect of Curing Time on Bleeding Resistance ..................................................... 53
4.1.4. Statistical Analysis for Effect of Factors in Phase I on Bleeding Resistance ........ 54
4.1.5. Relationship between Loss of Texture and Bleeding Resistance .......................... 56
4.1.6. Summary of Finding .............................................................................................. 57
4.2 Relationship between Emulsion Residue Properties and Bleeding Resistance in Chip
Seal Samples .............................................................................................................................. 58
4.3 Relationship between Emulsion Residue Performance and Bleeding Resistance ......... 59
4.4 Effect of Factors Relating to Bleeding on Bleeding Resistance .................................... 68
4.4.1 Factor Influence Bleeding Results ......................................................................... 68
4.4.2 Best Subsets Regression ........................................................................................ 69
4.5 Field Validation ............................................................................................................. 73
4.6 Other Rheological Properties ........................................................................................ 75

vi
V. CHAPTER 5: CONCLUSIONS AND RECOMMENDATIONS ................................ 79
VI REFERENCES ................................................................................................................. 81
APPENDIX A .............................................................................................................................. 86
vii
List of Figures
Figure II-1: Single Chip Seal Construction Process (22) ................................................................ 7
Figure II-2: The Chip Seal Service Life in Each Country (21) ....................................................... 8
Figure II-3: Asphalt Emulsion (25) ............................................................................................... 10
Figure II-4: Batch Emulsion Plant. (24) ........................................................................................ 11
Figure II-5: Stages in Breakdown of Emulsions (24) .................................................................... 11
Figure II-6: Raveling for Chip Seal (Washington DOT) ............................................................... 20
Figure II-7: Chip Seal, in which Excess Binder Rises over the Chip and Reduces Macrotexture
(30) ................................................................................................................................................ 21
Figure II-8: Bleeding for Chip Seal (33) ....................................................................................... 22
Figure II-9: Sample and MMLS3 for Running the Bleeding Test (34) ......................................... 26
Figure II-10: Digital Image Processing Procedure of Chip Seal Sample (a) and Surface Texture
Change of Chip Seal Sample (b) (7) .............................................................................................. 27
Figure II-11: Image Processing and analysis System (iPas) interface (15) ................................... 29
Figure II-12: Image Filtering Step in iPas (15) ............................................................................. 30
Figure III-1: Additional Material for Determining Chip Seal Bleeding Using Loaded Wheel
Tester ............................................................................................................................................. 38
Figure III-2: Samples with the same condition after bleeding test (a) steel support (b) neoprene
foam support .................................................................................................................................. 39
Figure III-3: Procedure to Modify the Loaded Wheel Test ........................................................... 40
Figure III-4: Diagram of Modified Wheel Test before (45) (a) and after (b) Wheel Load Applied
....................................................................................................................................................... 41
Figure III-5: Prepared Sample and Resulting B/W Image Prior To Bleeding Test (a) and After
Bleeding Test (b) ........................................................................................................................... 43
Figure III-6: Sand Patch Methodology .......................................................................................... 44
Figure IV-1: Surface Texture after Bleeding Test of Chip Seal with Different Contact Stress and
Temperature Test ........................................................................................................................... 48
Figure IV-2: Effect of Test Temperature on Bleeding Resistance for 50 cycles (a), 200 cycles . 49
Figure IV-3: Effect of loading cycle on Bleeding Resistance for contact stress of 140 kPa (20.31
psi) (a) 299 kPa (43.4 psi) (b) and 457 kPa (66.4 psi) (c) ............................................................. 53
Figure IV-4: Relationship between Surface Texture and Bleeding Resistance ............................. 57
Figure IV-5: Relationship between Jnr and % Chip Seal Bleeding for Fine Gradation with Low
EAR ............................................................................................................................................... 60
Figure IV-6: Relationship between Jnr and % Chip Seal Bleeding for Coarse Gradation with High
EAR ............................................................................................................................................... 61
Figure IV-7: Relationship between Jnr and % Chip Seal Bleeding for the High EAR with the Fine
gradation. ....................................................................................................................................... 62
Figure IV-8: Relationship between Jnr and % Chip Seal Bleeding for the High EAR with the
Coarse Aggregate .......................................................................................................................... 62
Figure IV-9: Effect of Emulsion Application Rate on Bleeding Resistance ................................. 64
Figure IV-10: Surface Texture Before and After Bleeding Test of Chip Seal for CRS-2 with Jnr =
2 kPa-1 at High Emulsion Application Rate for (a) 6.3 mm. (b) 9 mm. maximum aggregate size
gradation ........................................................................................................................................ 65

viii
Figure IV-11: Surface Texture Before and After Bleeding Test of Chip Seal CRS-2L with Jnr = 2
kPa-1 at High Emulsion Application Rate for (a) 6.3 mm. (b) 9 mm. maximum aggregate size
gradation ........................................................................................................................................ 66
Figure IV-12: Surface Texture Before and After Bleeding Test of Chip Seal CRS-2P with Jnr = 2
kPa-1 at High Emulsion Application Rate for (a) 6.3 mm. (b) 9 mm. maximum aggregate size
gradation ........................................................................................................................................ 67
Figure IV-13: Specified Point to Run the Sand Patch ................................................................... 73
Figure IV-14: Localized Severe Distresses: (a) Bleeding at Waushara County (b) Intersection
Bleeding at Rock County............................................................................................................... 74
Figure IV-15: The relationship between Creep Compliance (Jnr) at 3.2kPa at 46˚C and Mean
Texture Depth ................................................................................................................................ 75
Figure IV-16: Summary Results for the Strain Sweep Test: Strain at Maximum for un-aged and
PAV-aged emulsions residue. ....................................................................................................... 76
Figure IV-17: Estimated m (60)- value at estimated BBR temperatures of -6°C, -12°C and -18°C
....................................................................................................................................................... 78
Figure IV-18: Estimated stiffness (60) at estimated for BBR temperature at -6°C, -12°C and -
18°C ............................................................................................................................................... 78

ix
List of Tables
Table II-1: Chip Seal Type ............................................................................................................. 9
Table II-2: Asphalt emulsion binder used in chip seals in the United State ................................. 13
Table II-3: Typical Gradations for Chip Seal Aggregate (% passing) ......................................... 14
Table II-4: Chip Seal Design Method in North America ............................................................. 15
Table II-5: Material Parameters Required for the McLeod’s Design Procedure ........................... 16
Table II-6: Correction Factors for Existing Pavement Surface Conditions .................................. 24
Table III-1: Asphalt Emulsions Used ............................................................................................ 31
Table III-2 Aggregate Types and Properties Used ........................................................................ 32
Table III-3: Summary of Gradation Selection (% passing) ........................................................... 32
Table III-4: Emulsion and Aggregate Application Rate ................................................................ 33
Table III-5: Experimental Design for Selecting Experimental Conditions for Bleeding Evaluation
with the LWT (Phase I) ................................................................................................................. 34
Table III-6: Experimental Design for Assessing Effects of Design Factors on Bleeding
Resistance and Relationship between Jnr and Bleeding Resistance with LWT (Partial - Phase II)
....................................................................................................................................................... 34
Table III-7: Null Experiment Design for Verifying the Best Subsets for Bleeding Resistance with
LWT .............................................................................................................................................. 35
Table III-8: Experimental Design for Emulsion Residue Characterization .................................. 36
Table IV-1: Definition of Experimental Variables ........................................................................ 47
Table IV-2 Stress Sensitivity for Bleeding Resistance .................................................................. 50
Table IV-3: Effect of Curing Time on Bleeding Resistance ......................................................... 54
Table IV-4: ANOVA Table of Bleeding Test for 50 cycles .......................................................... 55
Table IV-5: ANOVA Table of Bleeding Test for 200 cycles ........................................................ 55
Table IV-6: Tukey’s Test Results for Two Significant Factors for 200 cycles ............................. 56
Table IV-7: Experimental Design for Assessing Effects of Design Factors on Bleeding
Resistance and Relationship between Jnr and Bleeding Resistance (Phase II) ............................. 58
Table IV-8: Test Temperatures at which Different Emulsions Meet the Specified Jnr Values for a
Stress Level of 3.2kPa. .................................................................................................................. 59
Table IV-9: Definition of Variables .............................................................................................. 68
Table IV-10: ANOVA Table for Bleeding Test ............................................................................ 69
Table IV-11: Definition of Independent Variables ........................................................................ 70
Table IV-12: Factors Selection by Best Subset Regression .......................................................... 70
Table IV-13: Null Experiments for Verifying the Best Subsets for Bleeding Resistance ............. 72
Table IV-14: Comparison % Bleeding between Imaging Analysis and Regression Analysis ...... 72

x
Table IV-15: Mean Texture Depth at points after placed 2 months .............................................. 74

xi
List of Equations
Equation II-1…………………………………………………………………………………….. 17
Equation II-2…………………………………………………………………………………….. 17
Equation II-3…………………………………………………………………………………….. 18
Equation II-4…………………………………………………………………………………….. 19
Equation III-1…………………………………………………………………………………….. 33
Equation III-2…………………………………………………………………………………….. 43
Equation III-3…………………………………………………………………………………….. 45
Equation IV-1……………………………………………………………………………………..71

1
I. CHAPTER 1: INTRODUCTION
1. Background
Chip seals are the most prominent pavement preservation surface treatment applied to
prolong the service life of asphalt pavements. In this treatment a thin emulsion film is sprayed on
the existing pavement surface followed by application of aggregate chips (1). In the United
States, chip seals are most commonly applied to low volume roads however, due to the increased
use of modified products and the need to extend the service life of existing pavements, agencies
have begun applying chip seals with traffic volumes that exceed 1,500 average daily traffic
(ADT) (2). Given application to more highly trafficked roadways there is a need to modernize the
tests used in evaluation and selection of materials to prevent premature failure. A survey of state
agencies and users identifies bleeding and raveling as the two most common distresses observed
for chip seals. Specifically, these distress modes were identified by 33 and 22 states for aggregate
loss and bleeding respectively (2). Furthermore, bleeding was recognized as the most common
chip seal distress by 81% of the survey respondents, followed by raveling (67%), and both
raveling and bleeding occurring at the same frequency (49%) (3).
Use of a performance-related basis for selection of materials is the most direct way to
decrease the probability of premature failure. For chip seals, emulsion properties are specified by
AASHTO M316 and AASHTO M140 standards. However, these standards use penetration as a
basis for approving materials, and thus are unrelated to performance, because the effects of both
temperature and stress are not considered. Although research is underway to develop a
performance based specification for emulsions, State agencies rely on a combination of
empirical tests that are not specific to climate and traffic conditions. In current practice the most
commonly used emulsion grades for chip seals are CRS-2, CRS-2H, and CRS-2P/L (3). Of the 27
2
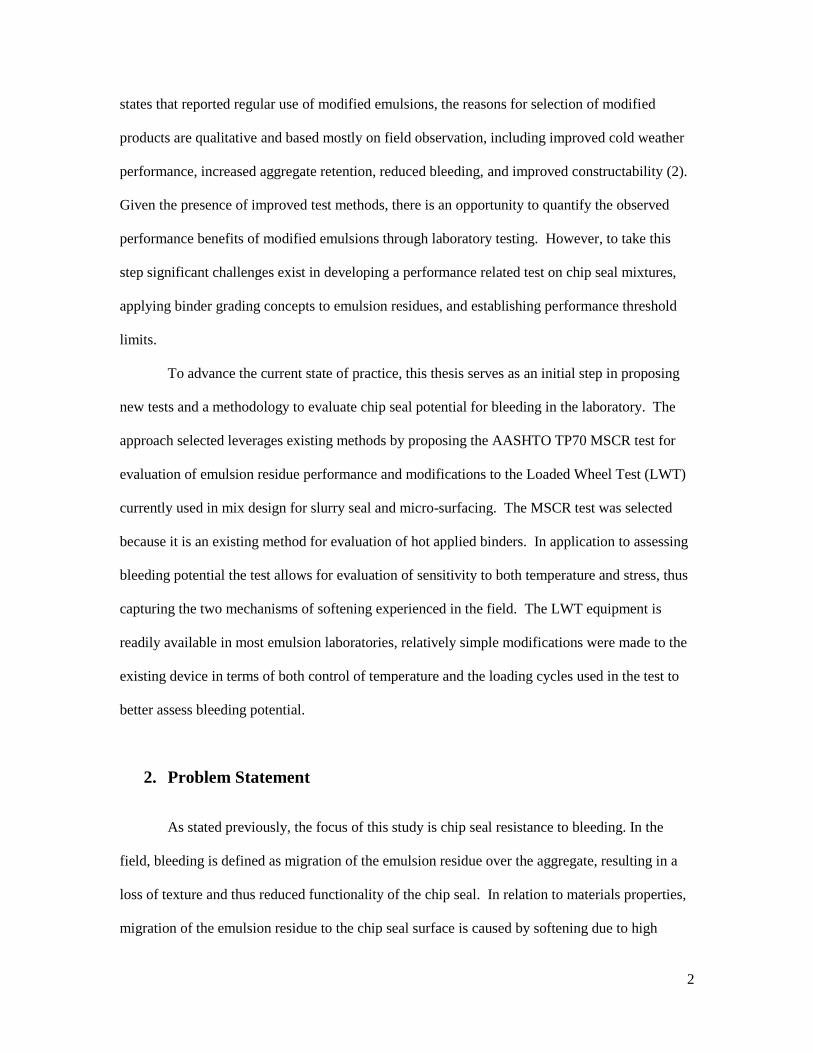
states that reported regular use of modified emulsions, the reasons for selection of modified
products are qualitative and based mostly on field observation, including improved cold weather
performance, increased aggregate retention, reduced bleeding, and improved constructability (2).
Given the presence of improved test methods, there is an opportunity to quantify the observed
performance benefits of modified emulsions through laboratory testing. However, to take this
step significant challenges exist in developing a performance related test on chip seal mixtures,
applying binder grading concepts to emulsion residues, and establishing performance threshold
limits.
To advance the current state of practice, this thesis serves as an initial step in proposing
new tests and a methodology to evaluate chip seal potential for bleeding in the laboratory. The
approach selected leverages existing methods by proposing the AASHTO TP70 MSCR test for
evaluation of emulsion residue performance and modifications to the Loaded Wheel Test (LWT)
currently used in mix design for slurry seal and micro-surfacing. The MSCR test was selected
because it is an existing method for evaluation of hot applied binders. In application to assessing
bleeding potential the test allows for evaluation of sensitivity to both temperature and stress, thus
capturing the two mechanisms of softening experienced in the field. The LWT equipment is
readily available in most emulsion laboratories, relatively simple modifications were made to the
existing device in terms of both control of temperature and the loading cycles used in the test to
better assess bleeding potential.
2. Problem Statement
As stated previously, the focus of this study is chip seal resistance to bleeding. In the
field, bleeding is defined as migration of the emulsion residue over the aggregate, resulting in a
loss of texture and thus reduced functionality of the chip seal. In relation to materials properties,
migration of the emulsion residue to the chip seal surface is caused by softening due to high

3
temperatures or high levels of stress. Based on this behavior, the MSCR test as specified in
AASHTO TP70 was selected as it allows for varying both test temperature and stress level(6).
Conceptually, evaluation of emulsion residue properties using the MSCR test allows for selection
of materials that maintain their integrity (low Jnr) for the traffic conditions and service
temperatures experienced in the field. As an example, modified emulsions may be selected in
areas of high temperature or slow moving traffic to reduce bleeding and flushing in warm weather
by controlling binder stiffness and limiting sensitivity to temperature and stress (14).
Previous research evaluated bleeding resistance on chip seal mixtures through simulated loading
in the third scale Model Mobile Loading Simulator (MMLS3) and digital image processing of the
surface. In the study, bleeding was reported as %area of bleeding as defined as by analysis of the
surface after loading. Results found that polymer modified emulsions significantly improved
resistance to bleeding for light weight aggregate, but it did not impact performance relative to
unmodified emulsion when granite aggregate was used (7). While results are promising in that it
established a procedure to evaluate bleeding resistance in the laboratory, development of
emulsion residue performance criteria using the given data set was not possible as tests were only
conducted at a single temperature (50°C) and were not compared with the binder testing results.
Another shortcoming of this research is that the MMLS3 device is not available in many
laboratories, thus it is difficult for other researchers to replicate results.
The main concept derived from previous work is that laboratory bleeding evaluation is
possible through loaded wheel testing. The Loaded Wheel Test (LWT) as specified in ASTM
D6372 was investigated as an alternative to the MMLS3 in this study. In current practice, the
loaded wheel test is intended to test the bleeding resistance of fine aggregate mixed with
emulsions such as slurry seal or micro-surfacing. During the test a repeated load is applied by a
rubber tire reciprocating wheel. The main motivation for applying this test to evaluation of
bleeding in chip seals, is practicality as the LWT device is already available in many emulsion

4
formulation labs. However, modifications to the standard as delivered equipment were required
to allow for control of test temperature.
3. Hypothesis
The following hypotheses were tested in this thesis.
- The procedure LWT specified in ASTM D6372 is not sufficient to address the bleeding
of chip seal. Using modified LWT is possible to quantify chip seal bleeding based on
observed sensitivity to materials and environmental conditions.
- The bleeding tested by LWT gaining from imaging analysis can be evaluated through
creep compliance.
4. Research Objective
The overall objective of this research is to leverage existing test methods for evaluation
of both emulsion residues and chip seal mixtures to identify opportunities to improve
selection of materials for bleeding resistance in chip seals. Specifically, the AASHTO TP-70
Multiple Stress Creep and Recovery (MSCR) and the Loaded Wheel Test (ASTM D6372) for
chip seal bleeding, these tests were selected due to their prominent use in the asphalt and
slurry surfacing industries. The objectives of this thesis are as follows:
Develop a test method for evaluating the bleeding using loaded wheel test (LWT)
specified in ASTM D6372
Investigation of the relationship between emulsion residue performance as measured
by the MSCR test and chip seal bleeding resistance as measured by the LWT to
evaluate the influence factors that related to bleeding performance to prevent
bleeding in the field.
5
Quantify the benefits of emulsion modification to address bleeding resistance through
comparison of emulsion residue and chip seal mixture samples prepared with
conventional emulsions, and emulsions modified with SBS polymer and SBR Latex.
5. Thesis Organization
This thesis comprises of five chapters in total.
Chapter 1 is the introduction (current chapter), in which overview of the problems to be
addressed is given.
Chapter 2 presents the review of the literature on chip seal, chip seal design and bleeding test.
Chapter 3: the experimental plan, materials and testing producers used are given.
Chapter 4 presents the effect of factors (temperature, loading cycle, contact stress and curing
time) on bleeding resistance to select for conducting in experiment 2.
Chapter 5 presents the experimental results, analysis and discussion of the results are given.
Chapter 6 is conclusions and recommendation of thesis.

6
II. CHAPTER 2: LITERATURE REVIEW
2.1 Chip Seal
Today asphalt emulsions are commonly used for pavement preservation surface treatment
applications. Asphalt emulsions present an environmentally friendly alternative to conventional
asphalt binders due to eliminating the need for heating of asphalt during production, storage, and
transportation. Examples of applications of emulsions for pavement preservation surface
treatments include chip seal, micro surfacing, slurry seal, spray seal (fog seal). The driving
concept of pavement preservation is to extend pavement service life through application of
regular maintenance activities at relatively short time intervals to maintain the structure integrity
of underlying layers. Chip seals are the most commonly used pavement preservation treatment
due to ease of construction, cost, and reliability. Failure of chip seals due to bleeding will be the
focus of this thesis.
A chip seal is described as a single layer of asphalt emulsion sprayed on the existing
pavement surface and covered with a single layer of coarse aggregate. To make aggregate
embedment into asphalt emulsion and orient the chips so that the maximum bonding can occur,
the compaction using pneumatic roller is used. The pneumatic rollers can allow the weight of
machine from 4 to 6 tons (17) or not less than 8 tons (18) to be able to succeed the contact
pressure by typically 80 psi (17, 19). In addition static steel wheel rollers machine is also used to
compact the chip seal. However this type of roller is necessary to be careful to compact the chip
because they can crush and degrade the aggregate. The single chip seal construction process is
shown in Figure II-1. Chip seals serve two functional requirements 1) Protect underlying layers
from intrusion of moisture and age hardening by sealing the existing surface. 2) Improve skid
resistance. This surface treatment was originally used in 1920s (20) mostly on low traffic volume

7
as wearing courses. Over time application of chip seals evolved to use in maintenance treatments
which on low-, medium- and high-volume roads. As previously stated, chip seals are a functional
treatment and provide no structure benefits to the pavement. Therefore, they are most appropriate
for pavement in good existing condition. In this instance it was established that the initial cost of
construction for chip seals was significantly less than that of thin asphalt overlays. This is
advantageous to state agencies and local municipalities to provide another tool to make best use
of limited budgets. (21)
Figure II-1: Single Chip Seal Construction Process (22)
As mentioned, chip seals have been successful for surface treatment on low-, medium-,
and high-volume roads with countries of Australia, New Zealand, South Africa and the United
Kingdom. Results are shown in Figure II-2. Differences in expected service lives between these
countries varies by approximately a factor of two.

8
Figure II-2: The Chip Seal Service Life in Each Country (21)
Benefits of chip seals are based in the larger context of pavement management and
pavement preservation, FHWA defines pavement preservation as” a program employing a
network level, long-term strategy that enhances function pavement performance by using an
integrated, cost-effective set of practices that extend pavement life, improve safety, and meet
motorist expectations”(23). In addition to FHWA statement, AASHTO defines pavement
management as a “planned strategy of cost-effective treatments that preserves and maintains or
improves a roadway system and its appurtenances and retards deterioration, but without
substantially increasing structural capacity” (23).
There are different types of chip seals used in different countries such as Australia, New
Zealand, South Africa, United States and United Kingdoms. Table II-1 shows different types of
chip seal. Differences exist in the aggregate nominal size used, number of surface treatment
layers, and emulsion application rate. However, the basic principle remains that these treatments
consist of spraying of emulsion followed by application of aggregate. The focus of this thesis is
the single chip seal.

9
Table II-1: Chip Seal Type (21)
Chip Seal Type Format Chip Seal Type Name
Single Chip Seal
Double Chip Seal
Racked-In Seal
Cape Seal
Inverted Seal
Sandwich Seal (Dry
matting)
Geotextile-reinforced
seal
2.2 Materials for Chip Seals
Chip seal are made up of two basic components: asphalt binder/emulsion, cover
aggregate. The components and described in subsequent sections.

10
2.2.1 Asphalt Emulsion
Most the chip seals construct in the USA use an asphalt emulsion as the glue for holding
the aggregate on the pavement and sealing the existing underlying layers from moisture and air
intrusion. An asphalt emulsion is a mixture of tiny asphalt binder particles suspended in water in
the presence of an emulsifier. The emulsifier imparts an electrical charge on the surface of the
asphalt particles. Because like charges repel, this inhibit the asphalt particle from fusing together,
allowing for the asphalt emulsion to be store for a certain period of time without
separation/storage problems. The asphalt emulsion can be represented in Figure II-3.
Figure II-3: Asphalt Emulsion (25)
In general emulsions have asphalt contents that range from 50% - 66% by weight of the emulsion,
the remainder is water. The asphalt content of the emulsion is decided in the formulation phase
and is selected based on the setting time required for the application (i.e. slow, medium, and
rapid)
In the most common process, the emulsifier is dissolved in the water phase of the
emulsion, and this water solution or “soap” is mixed with the hot liquid asphalt in a colloid mill
(Figure II-4). Those emulsifier agents can make water and asphalt homogeneously mix with
changing asphalt properties.

11
Figure II-4: Batch Emulsion Plant. (24)
In the field, asphalt emulsion must to turn back to its asphalt form and forma thin film to
act as cement on roadway. This is accomplished through the process of breaking and curing that
the emulsion undergoes once it is brought in contact with the mineral aggregate. These processes
are not yet well understood. However, it is believed that the breaking process occurs when the
electrical charges on the particles of the asphalt droplets are neutralized by ions coming from the
cover aggregate or existing surfaces. The breaking process involves the flocculation and
coalescence of the droplet as shown in Figure II-5. Curing involves the evaporation of water with
time.
Figure II-5: Stages in Breakdown of Emulsions (24)

12
The breaking rate and curing processes depends on the chemistry of the asphalt emulsion,
emulsions properties, chemistry of the cover aggregate, aggregate properties, conditions of the
existing surface and climatic conditions. The color of fresh emulsion is brown when mixing
asphalt with water. However, it will turn into black when it is cured, this product is referred to as
emulsion residue. For the case of chip seal may take a few hours because rapid setting emulsions
are, but for case of cold mixes which uses slow setting asphalt emulsions, it might take several
weeks for full strength of the road. (24).
Therefore, in the construction process, the timing of adding the aggregate is critical as the
emulsion is required to be in a stable state to allow for a quality bond between asphalt and
aggregate to develop. Proper selection of the emulsifying agent or surfactant and content is
critical to achieve performance. These factors control the stability of the emulsion, defined as the
time the asphalt droplets are able to be suspended in the aqueous phase and the interaction
between the asphalt and aggregate. The emulsifier imparts a surface charge on the asphalt
droplets, the correct emulsifier must be compatible with the project aggregate.
In general two emulsifier chemistries are available cationic (positively charged) and
anionic (negatively charged), these are used with igneous and calcareous aggregates respectively.
The asphalt emulsion use for chip seal was surveyed in United State as listed in Table II-2 (21).

13
Table II-2: Asphalt emulsion binder used in chip seals in the United State (21)
Mostly asphalt emulsions used in United State are cationic rapid setting (CRS) which is positively
charged with both unmodified and modified binders. Several states in US offer modified asphalt
emulsion to construct chip seal. The most common type of modified asphalt emulsion is the use
of polymer. Polymer is beneficial for reducing the temperature susceptibility, enhancing retention
of aggregate, enhancing durability of chip seal. Additionally, they work well with high traffic
volume roads and late season work (26, 27). Another common type of modified asphalt polymer
is the use of latex. Latex can also be used to increase adhesion and improve resistance asphalt
emulsion to oxidation. Another thing that can be noticed in Table II-2 is the use of HF emulsions
- which stands for High Float. These are emulsions which pass the standard float test specified in
AASHTO T50, ASTM D139. To prevent the runoff emulsion from roads, high float emulsions
play important role in yielding thicker emulsion residue on aggregate. This type of emulsion is
suitable for excessively dirty or dusty aggregate.
14
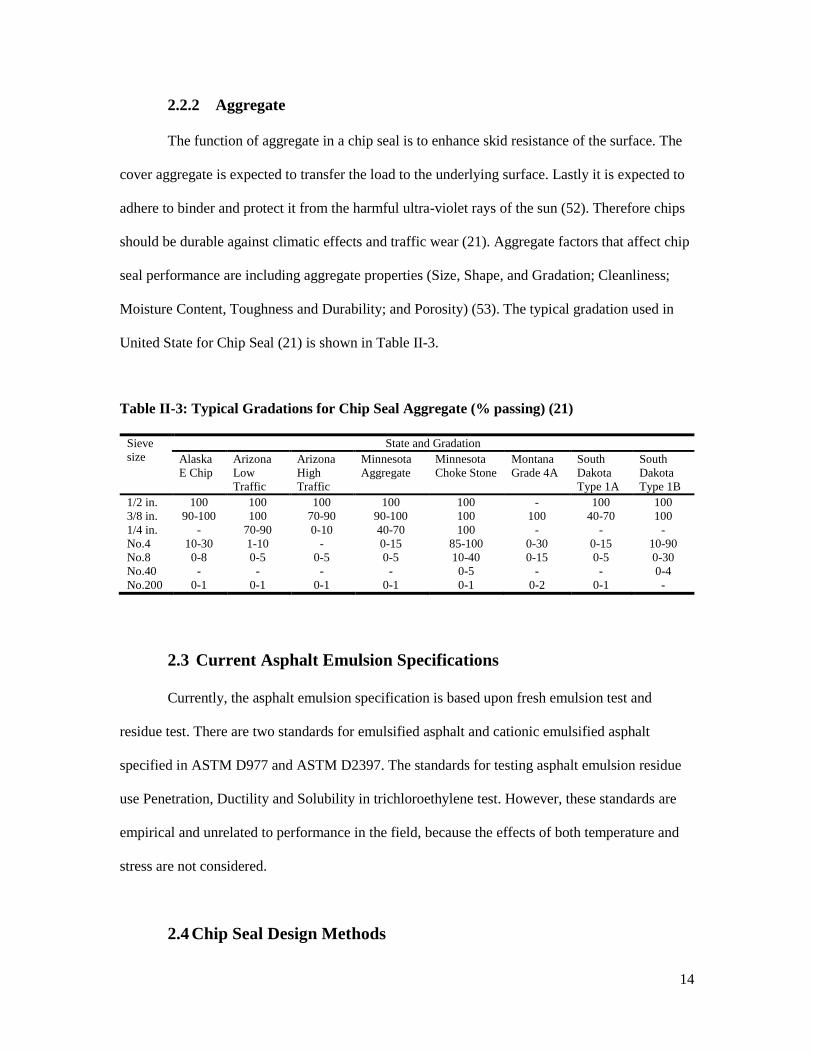
2.2.2 Aggregate
The function of aggregate in a chip seal is to enhance skid resistance of the surface. The
cover aggregate is expected to transfer the load to the underlying surface. Lastly it is expected to
adhere to binder and protect it from the harmful ultra-violet rays of the sun (52). Therefore chips
should be durable against climatic effects and traffic wear (21). Aggregate factors that affect chip
seal performance are including aggregate properties (Size, Shape, and Gradation; Cleanliness;
Moisture Content, Toughness and Durability; and Porosity) (53). The typical gradation used in
United State for Chip Seal (21) is shown in Table II-3.
Table II-3: Typical Gradations for Chip Seal Aggregate (% passing) (21)
Sieve
size
State and Gradation
Alaska
E Chip
Arizona
Low
Traffic
Arizona
High
Traffic
Minnesota
Aggregate
Minnesota
Choke Stone
Montana
Grade 4A
South
Dakota
Type 1A
South
Dakota
Type 1B
1/2 in. 100 100 100 100 100 - 100 100
3/8 in. 90-100 100 70-90 90-100 100 100 40-70 100
1/4 in. - 70-90 0-10 40-70 100 - - -
No.4 10-30 1-10 - 0-15 85-100 0-30 0-15 10-90
No.8 0-8 0-5 0-5 0-5 10-40 0-15 0-5 0-30
No.40 - - - - 0-5 - - 0-4
No.200 0-1 0-1 0-1 0-1 0-1 0-2 0-1 -
2.3 Current Asphalt Emulsion Specifications
Currently, the asphalt emulsion specification is based upon fresh emulsion test and
residue test. There are two standards for emulsified asphalt and cationic emulsified asphalt
specified in ASTM D977 and ASTM D2397. The standards for testing asphalt emulsion residue
use Penetration, Ductility and Solubility in trichloroethylene test. However, these standards are
empirical and unrelated to performance in the field, because the effects of both temperature and
stress are not considered.
2.4 Chip Seal Design Methods

15
The output of chip seal design methods is generally the application rates for the cover
aggregate and asphalt emulsion necessary to ensure performance. In North America, there are
two formal design methods namely the Modified Kearby and McLeod methods (21, 7).
However, there is no standardized design procedure, as a result use of these methods varies by
user and some agencies use methods designed in-house. The methods used in North America are
listed in Table II-4.
Table II-4: Chip Seal Design Method in North America (21)
Chip Seal Design Method United State % Canada %
Kearby/Modified Kearby 7 0
McLeod/Asphalt Institute 11 45
Empirical/ past experience 37 33
Own formal method 19 0
No formal Method 26 22
As indicated in Table II-4, Empirical/past experience and McLeod/Asphalt Institute are
the most prevalent method used in North America. One is the formal method which is basically
step calculation for designing the chip and emulsion used while another method uses the past
experience to select the appropriate emulsion and aggregate. Due to material selection on a
scientific basis, the MacLeod’s design method will be reviewed in this thesis.
2.4.1 McLeod’s Seal Coat Design Method
McLeod’s design method was developed by Norm McLeod in 1969-70s (21), is the first
formal chip seal method applied in North America. Originally, this method was adapted from the
concept of Hanson (1935) which is filling 2/3 partially of emulsion up to the height of the chip.

16
In the Mcleod’s method, both application rates for the aggregate and emulsion are determined.
The aggregate application rate is determined as a function of specific gravity, shape, and
aggregate gradation, while the emulsion application rate is dependent on traffic volume,
aggregate gradation, absorption and shape, existing pavement condition and the percent of
emulsion residue content of the binder. Specific calculations will be provided in subsequent
sections of this study.
McLeod also discovered that if the existing pavement surface is dry or porous or the
aggregate used for chips has high absorption, the emulsion application rate must be adjusted to
account for loss to absorptive surfaces. Mcleod also proposed the measurement of actual voids in
loose aggregate which is calculable from emulsion and aggregate application rate.
The Asphalt Emulsion Manufacturers Association and the Asphalt Institute adapted
McLeod’s method by the recommendations for binder types and grades for various aggregate
gradations, and correction factors to emulsion application rate based on existing surface condition
(21). Also, the Strategic Highway Research Program (SHRP) has applied McLeod’s method for
designing Special Pavement Study chip seal sections constructed across the United States (38).
2.4.2 McLeod’s Method Procedure
As stated above, the outputs of this design procedure are emulsion and aggregate
application rates. These are based upon the factors of specific gravity, shape, aggregate gradation,
traffic volume, absorption, existing pavement condition and the percent of emulsion residue
content of the binder. In order to determine all these factors, parameters involving these factors
are require for the McLeod’s design Procedure. All parameter needed are shown in Table II-5.
Table II-5: Material Parameters Required for the McLeod’s Design Procedure
Parameter Aggregate Application
Rate
Emulsion Application
Rate

17
Average Least Dimension (H) X X
Voids in the Loose Aggregate (V) X X
Bulk Specific Gravity (G) X
Pick a Traffic Whip-Off (E) X
Bulk Unit of Water (ˠw) X
Aggregate Absorption Factor(A) X
Traffic Volume (T) X
Surface Condition Factor (S) X
Residual Asphalt Content of Binder (R) X
The calculations to obtain the emulsion application rate and aggregate application rate are
shown in Equation II-1 and Equation II-2 respectively.
C = (1-0.2
0.5V) HG ˠw E
C = (1-0.4V) HG ˠw E II-1
Where:
C = Cover Aggregate Application Rate, kg/m2
V = Voids in the Loose Aggregate, in percent expressed as a decimal
H = Average Least Dimension, mm
G = Bulk Specific Gravity of the Aggregate
E = Wastage Factor for Traffic Whip-Off
ˠw = bulk unit weight of water, kg/m
B =
0.2
0.5(𝑇)(𝑉)+𝑆+𝐴
𝑅
B = 0.4(𝐻)(𝑇)(𝑉)+𝑆+𝐴
𝑅 II-2
Where:
B = Binder Application Rate, liters/m2
H = Average Least Dimension, mm
T = Traffic Factor
18
V = Voids in Loose Aggregate, in decimal percent
S = Surface Condition Factor, liters/m2
A = Aggregate Absorption Factor, liters/m2
R = Residual Asphalt Content of Binder, in percent expressed as a decimal
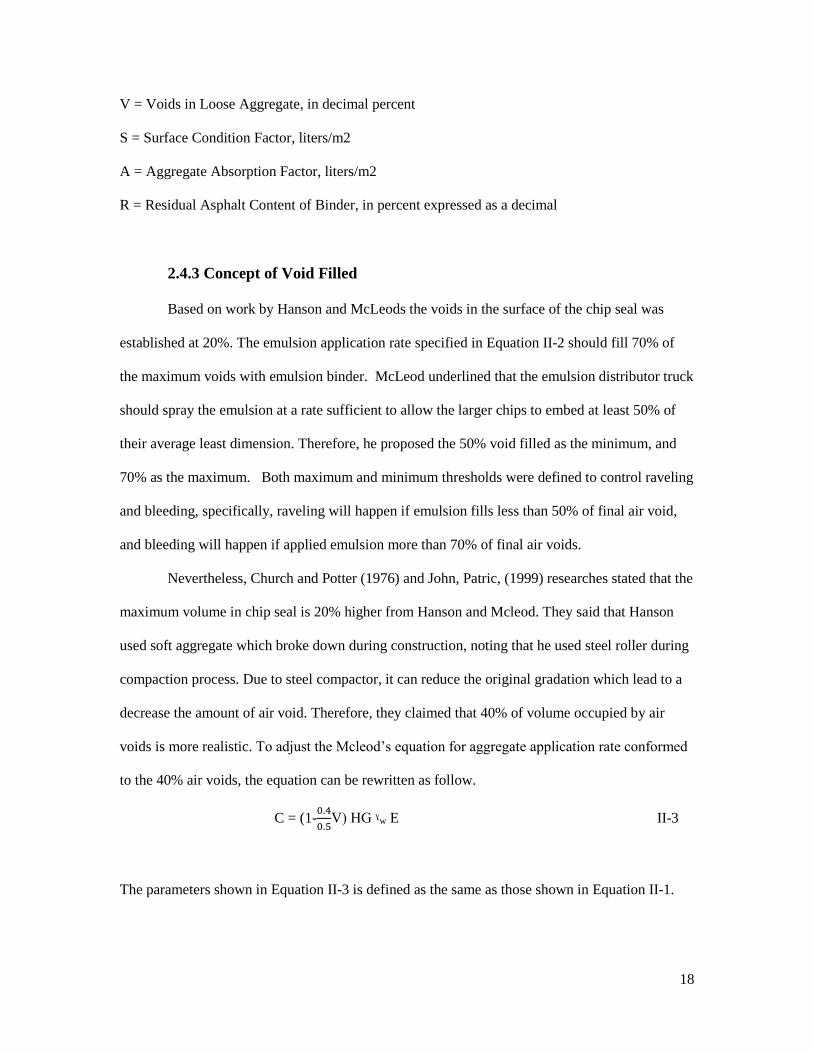
2.4.3 Concept of Void Filled
Based on work by Hanson and McLeods the voids in the surface of the chip seal was
established at 20%. The emulsion application rate specified in Equation II-2 should fill 70% of
the maximum voids with emulsion binder. McLeod underlined that the emulsion distributor truck
should spray the emulsion at a rate sufficient to allow the larger chips to embed at least 50% of
their average least dimension. Therefore, he proposed the 50% void filled as the minimum, and
70% as the maximum. Both maximum and minimum thresholds were defined to control raveling
and bleeding, specifically, raveling will happen if emulsion fills less than 50% of final air void,
and bleeding will happen if applied emulsion more than 70% of final air voids.
Nevertheless, Church and Potter (1976) and John, Patric, (1999) researches stated that the
maximum volume in chip seal is 20% higher from Hanson and Mcleod. They said that Hanson
used soft aggregate which broke down during construction, noting that he used steel roller during
compaction process. Due to steel compactor, it can reduce the original gradation which lead to a
decrease the amount of air void. Therefore, they claimed that 40% of volume occupied by air
voids is more realistic. To adjust the Mcleod’s equation for aggregate application rate conformed
to the 40% air voids, the equation can be rewritten as follow.
C = (1-0.4
0.5V) HG ˠw E II-3
The parameters shown in Equation II-3 is defined as the same as those shown in Equation II-1.
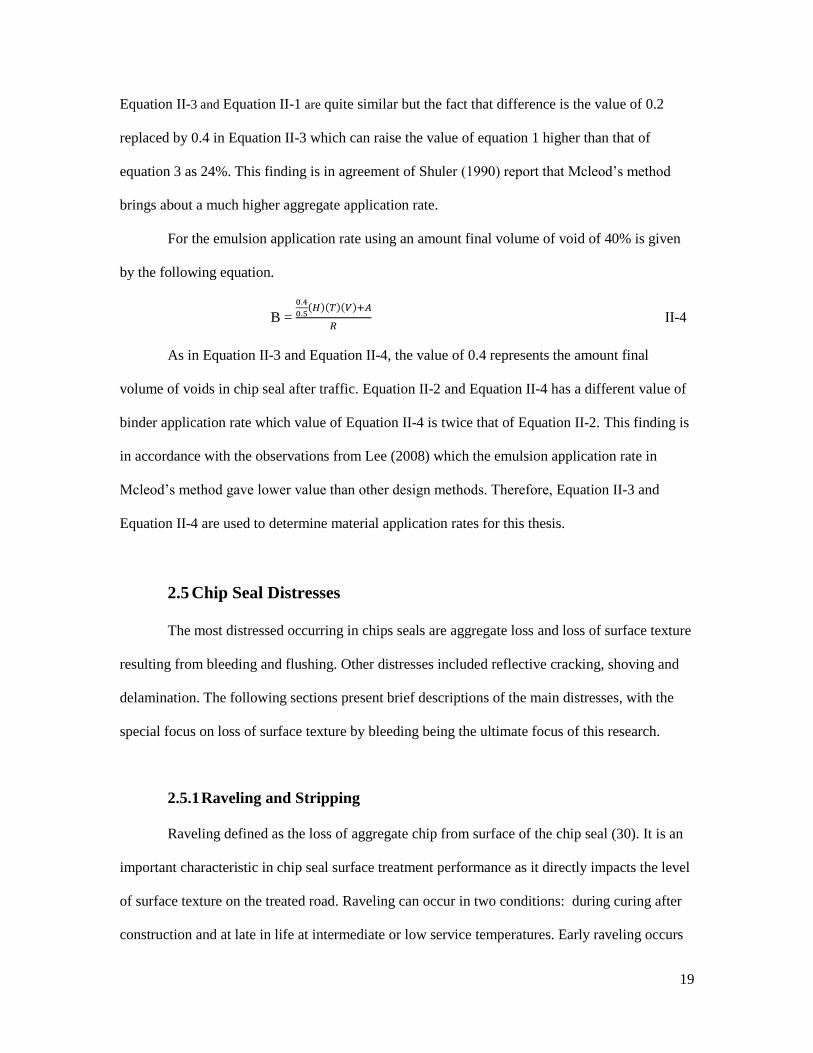
19
Equation II-3 and Equation II-1 are quite similar but the fact that difference is the value of 0.2
replaced by 0.4 in Equation II-3 which can raise the value of equation 1 higher than that of
equation 3 as 24%. This finding is in agreement of Shuler (1990) report that Mcleod’s method
brings about a much higher aggregate application rate.
For the emulsion application rate using an amount final volume of void of 40% is given
by the following equation.
B =
0.4
0.5(𝐻)(𝑇)(𝑉)+𝐴
𝑅 II-4
As in Equation II-3 and Equation II-4, the value of 0.4 represents the amount final
volume of voids in chip seal after traffic. Equation II-2 and Equation II-4 has a different value of
binder application rate which value of Equation II-4 is twice that of Equation II-2. This finding is
in accordance with the observations from Lee (2008) which the emulsion application rate in
Mcleod’s method gave lower value than other design methods. Therefore, Equation II-3 and
Equation II-4 are used to determine material application rates for this thesis.
2.5 Chip Seal Distresses
The most distressed occurring in chips seals are aggregate loss and loss of surface texture
resulting from bleeding and flushing. Other distresses included reflective cracking, shoving and
delamination. The following sections present brief descriptions of the main distresses, with the
special focus on loss of surface texture by bleeding being the ultimate focus of this research.
2.5.1 Raveling and Stripping
Raveling defined as the loss of aggregate chip from surface of the chip seal (30). It is an
important characteristic in chip seal surface treatment performance as it directly impacts the level
of surface texture on the treated road. Raveling can occur in two conditions: during curing after
construction and at late in life at intermediate or low service temperatures. Early raveling occurs

20
when vehicles travel on a newly constructed chip seal surface, before proper curing has taken
place. There are many factors related to the early raveling which are emulsion type, aggregate
gradation, emulsion rate, aggregate type.
Late raveling occurs as result of traffic stress, insufficient asphalt binder application rate,
material incompatibility, binder aging, and or due to cold climate. Figure II-6 shows an example
of a chip seal experiencing raveling.
Figure II-6: Raveling for Chip Seal (Washington DOT)
Raveling in chip seal can also results as a results of moisture exposure, which result in
the loss of adhesive between aggregate and binder. Moisture trapped within the chip seal air
voids, and within the porous aggregate, separates the bond between the asphalt binder and the
aggregate particles (11). This phenomenon is called stripping. In sum up, stripping is raveling
which is the combined effect of moisture and traffic referred to as wet raveling. Raveling is
undesirable because it can results in bleeding (see next section), which reduces the skid resistance
of the pavement surface hence contribute to safety issues. In addition to the safety issues related
to loss of texture another possible user impact associated with chip seal raveling is windshield
damage, which it becomes more viscous, this can easily cause bleeding (32).

21
2.5.2 Bleeding and Flushing
Flushing is loss of surface texture due to the asphalt binder rising to the chip seal surface,
and can be distinguished by a solid, smooth, black, slick binder on the surface of the seal (51). It
occurs when chips seals are forced into a soft existing surface by traffic, high binder application
rate, or wrong binder for the climate. It can be aggravated during hot weather when the
underlying surface (if it is HMA) and the binder in the chip seal become soft (50). Flushing may
also occur as the natural end-of-life condition of a well-designed chip seal, or as a seal design or
construction fault. Figure II-7 illustrates excess binder rises over the chip.
Figure II-7: Chip Seal, in which Excess Binder Rises over the Chip and Reduces
Macrotexture (30)
Bleeding on the other hand, occurs when binder on the surface of a flushed surface
becomes soft in hot weather (51). At certain viscosity, a softer binder can adhere to the vehicle
tire and get tracked or spread over the surrounding road area (51). The binder coats the
microscopic surfaces of the aggregate, creating a slick surface with a lower skid resistance, and
causes safety concerns. Figure II-8 shows an example of a chip seal experiencing bleeding.

22
Figure II-8: Bleeding for Chip Seal (33)
Bleeding and flushing or simply bleeding, is usually observed in the wheel path and areas
of frequent loading such as intersections where slow traffic and turning movements cause a
higher stress condition at the chip seal surface. The main focus of this thesis is on bleeding/
flushing, and hence the remaining section focuses main on this distress.
2.6 Factors Affecting Bleeding
Bleeding performance of chip seal relies on many factors, including climatic condition,
traffic volume and type, aggregate properties, asphalt emulsion properties, emulsion application
rate and existing pavement surface. The following discussion describes these factors.
2.6.1 Aggregate Properties
Aggregate properties including size, shape and gradation, toughness influence bleeding
performance. Nonuniform aggregate gradations are one cause of bleeding on chip seal (58).
Larger aggregates require higher emulsion application rates so as to provide an equivalent
embedment percentage to smaller aggregates (53).
23
2.6.2 Asphalt Binder Properties
The performance of chip seal is largely dependent on asphalt emulsion. Soft asphalt
emulsion is easily able to bring about the bleeding in hot weather. Therefore, the modification of
the binder influence the bleeding performance of the binder. As stated earlier, modified binder
would rather resist the surface of chip seal to bleeding than unmodified binder. However, the cost
of modified asphalt is higher than that of unmodified asphalt. Selecting suitable asphalt emulsion
for each location is necessary taken into account.
2.6.3 Emulsion Application Rate
The emulsion application rate is the important factor to prevent bleeding occurred. This must
be correct during construction to achieve optimum performance of the chip seal; otherwise the
distress might be occurred. Too little emulsion will not retain chips in place under traffic and
cause raveling, and too much emulsion will result in flushing in cold weather, bleeding in hot
weather and loss of friction. Generally, high traffic volumes reduce emulsion application rates
(54). This is because the heavy traffic will continue to embed that aggregate into the underlying
surface after the road is opened to traffic.
2.6.4 Climatic Conditions
Climate is one necessary factor needed to be concern for the bleeding. In the hot weather,
bleeding is tendency to occur due to softening of asphalt binder. This phenomenon ease chips
penetrate into the underlying binder, leaving excess asphalt binder on the surface (55). Therefore,
asphalt emulsion type need to delicate selecting the suitable asphalt emulsion for each region.
2.6.5 Existing Pavement Surface
The existing pavement surface is necessarily considered prior to constructing chip seal.
Chip seals are most prevalently used as surface treatments on flexible pavements. The condition
of existing pavement is also taken into account for designing the emulsion application rate. Prior
to applying the emulsion application rate, emulsion application rate correction factors for existing
24
pavement surface conditions is necessary. Table II-6 shows correction factors for existing
pavement surface conditions.
Table II-6: Correction Factors for Existing Pavement Surface Conditions (56)
Surface Texture Asphalt Application Rate Correction
[gal/yd2 (L/m2)]
Black, flushed asphalt – 0.01 to –0.06 (–0.04 to –0.27)
Smooth, nonporous 0.00 (0.00)
Absorbent—slightly porous, oxidized +0.03 (+0.14)
Absorbent—slightly pocked, porous, oxidized +0.06 (+0.27)
Absorbent—badly pocked, porous, oxidized +0.09 (+0.40)
2.6.6 Traffic Type and Volume
Chip Seal is placed on a variety of roadways from those with low and high traffic
volume, where low volume is defined as average daily traffic (ADT) ranging from 2000 to 5000
and higher than 20,000 for high traffic volume. Typically, all chip seal types can construct for
low traffic volume. However, some binders and chip seal types can construct for high
volume. Polymer asphalt emulsion was recommended for high traffic roads (26, 27). Also,
inverted seal has successfully used on high traffic volume (30,000 ADT) for Australia pavement
(21).
A majority of traffic is composed of passenger cars and small trucks. In order to select
the appropriate range in stress levels for laboratory evaluation of bleeding it is necessary to
determine the stress applied by traffic in the field. Typically, contact pressure of vehicle depends
on the size of the tire. Lee 2006 used MMLS3 for testing the chip seal sample. The contact stress
that he measure was approximately 700 kPa (101.52psi). This value indicates that the wheel
contact the chip seal sample was assumed as medium truck 8,164 kg (18,000 lb.). Huang 2000
stated that stress is dependent on pressure inflation, radius of wheel and the height for calculating
25
local stress this thesis stress which is used should be in the range of light traffic, because it
focuses only on single chip seal which is basically constructed in low traffic volume.
2.7 Laboratory Tests Methods for Evaluating Bleeding
In laboratory evaluation of bleeding it is necessary to ensure the test method selected or
developed coincides with the common mechanisms for distress observed in the field.
2.8 Potential Test for Asphalt Emulsions Residues Properties Related to
Bleeding
The penetration grade described in AASHTO T49 and softening point test specified in
ASTM D36 are used to select asphalt binders for use in chip seal. To prevent bleeding, usually
asphalt binder with low penetration grade and high softening points are preferred. However, it has
been reported (57) that these test methods are insufficient, in addition to being empirical. Also,
testing is carried out at temperature not similar to those experienced by the chip seals in the field,
and more importantly, the properties measured are not related to bleeding and flushing occurring
in the field.
Recognizing these shortfall, Kardmas (2008), and King et al (2010) proposed that the
resistance to bleeding can be carried out by the MSCR test specified by AASHTO TP70. As the
cause of the bleeding, high temperature and high stress condition can lead to bleeding when the
asphalt emulsion is sufficiently viscous to flow to the chip seal surface. This method showed the
reasonable result of creep compliance (Jnr) for both unmodified and modified asphalt to high
temperature. Andrew et al (2012) stated that this method can consider both sensitivity to
temperature and stress in the lab by varying test conditions.
26
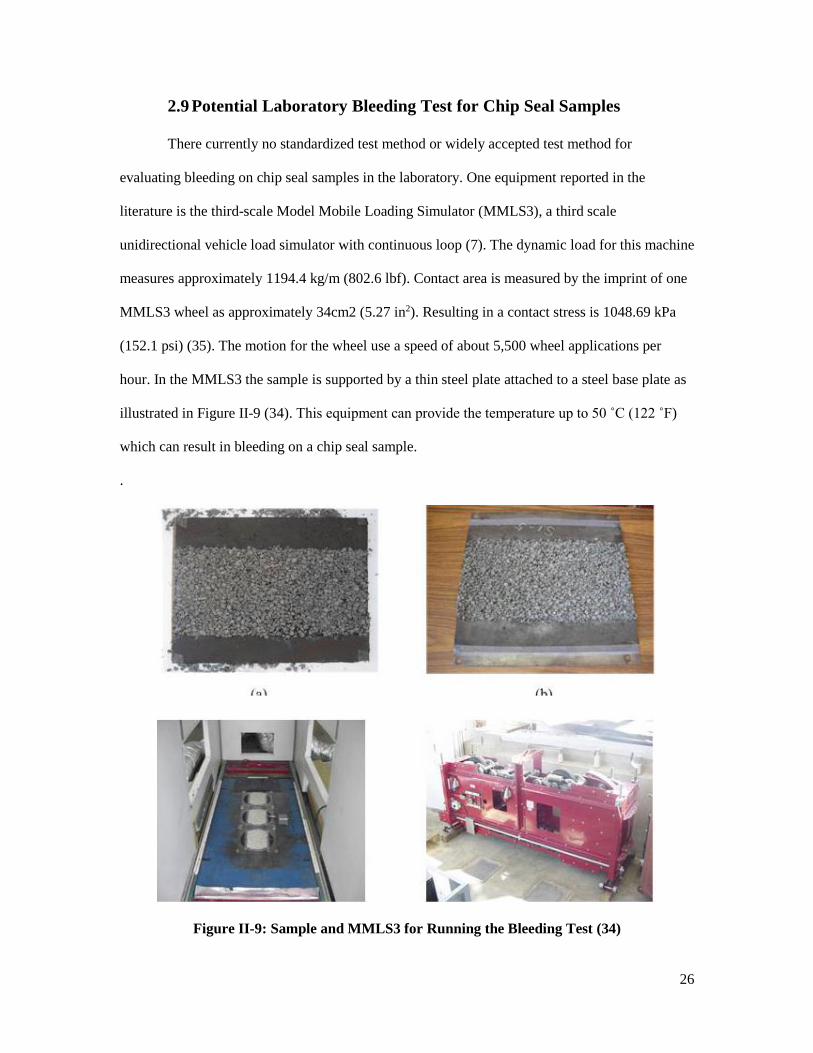
2.9 Potential Laboratory Bleeding Test for Chip Seal Samples
There currently no standardized test method or widely accepted test method for
evaluating bleeding on chip seal samples in the laboratory. One equipment reported in the
literature is the third-scale Model Mobile Loading Simulator (MMLS3), a third scale
unidirectional vehicle load simulator with continuous loop (7). The dynamic load for this machine
measures approximately 1194.4 kg/m (802.6 lbf). Contact area is measured by the imprint of one
MMLS3 wheel as approximately 34cm2 (5.27 in2). Resulting in a contact stress is 1048.69 kPa
(152.1 psi) (35). The motion for the wheel use a speed of about 5,500 wheel applications per
hour. In the MMLS3 the sample is supported by a thin steel plate attached to a steel base plate as
illustrated in Figure II-9 (34). This equipment can provide the temperature up to 50 ˚C (122 ˚F)
which can result in bleeding on a chip seal sample.
.
Figure II-9: Sample and MMLS3 for Running the Bleeding Test (34)

27
The tool for evaluating the bleeding performance is digital image processing (DIC). The
image processing is based on selection of the critical grayscale intensity values (GIVs) by the
user. The range of grayscale intensity for DIC is from 0 to 225, which according to Kim (2007)
the average critical GIVs was around 50. To determine the bleeding on a sample, the principle for
this method was based on the area of bleeding on chip seal sample (sum of pixels that are smaller
than the critical bleeding GIV) and the area of area of chip seal sample (total number of pixels).
The procedure for image processing and samples of before and after bleeding is shown in Figure
II-10
(a)
(b)
Figure II-10: Digital Image Processing Procedure of Chip Seal Sample (a) and Surface
Texture Change of Chip Seal Sample (b) (7)

28
Another promising test found in the literature which will be evaluated in this thesis the
Loaded Wheel Test Specified in the ASTM D 6372. This test is described more in details in the
materials and method section.
2.10 Analysis Methods for Quantifying Bleeding
Two analysis approaches for quantifying bleeding on laboratory samples tested with the
test methods described in the previous sections were identified in the literature. These are the
image analysis method, and surface texture by volumetric method. The two methods are
described in subsequent sections.
2.11 Image Processing and Analysis System (IPAS)
The result from the sample is the migration of the emulsion residue to the surface of the
chip seal. By visual image, the color for the emulsion and aggregate are black and white. In order
to quantify these without the visual judgment, digital image processing need to be applied. Image
Processing and Analysis System is the tool for quantifying 2D image of internal compacted
asphalt mixture developed by Cohen (2011) and Nima (2011). In the first version of software, it
was called iPas developed by Cohen (2011). Later, Nima (2011) developed a new version called
iPas2. This version contains two main functions as image processing and micro structure analysis.

29
Figure II-11: Image Processing and analysis System (iPas) interface (15)
To conduct image processing, scanned asphalt mixture is basis for getting the color
picture. The algorithm of image processing is converting color image (i.e. red, green, blue) to
binary image (i.e. black, white). There are three phases (i.e. air void, mastic and aggregate) need
to be determine the color. For mastic and aggregate phase, these are separated on the step of gray
scale image because gray scale image can significantly differentiate between aggregate and
mastic in terms of color intensity. After finishing the gray scale image, step of converting to
binary image need to filter the image for enhancing the image quality and separating the different
phase. The most important step is adjusting the threshold filtering to separate the phase of
material to characterize microstructure. In the interface appearance, after step no.4 is adjusting the
value of each filter namely Median Filtering, Hmax and Threshold as shown in Figure II-11.
To address 2-D actual value of asphalt mixture, two parameters are verified by evaluating
actual value relative to image value. Two parameters used to compare are aggregate volume
fraction and gradation. An example of a processed asphalt image in iPas is illustrated in Figure
II-12.

30
Figure II-12: Image Filtering Step in iPas (15)
2.12 Sand Patch Method
Loss of texture through bleeding is likely to represent the amount of bleeding. Due to
macrotexture in the surface of chip seal, the effective measurement for determining texture depth
is sand patch specified in ASTM E965. The diameter of the circular area is recorded and taken to
calculate using the equation specified in ASTM E965 to obtain the texture depth of each sample.
31
III. CHAPTER 3: MATERIALS AND EXPEREMENTAL PLAN
3.1 Materials
Materials were selected in this study to represent the emulsions and aggregates
commonly used for chip seals. Five emulsions and two aggregate types were used in this study.
The emulsions selected included both cationic and anionic emulsions allow for the effects of
emulsion chemistry to be studied, and polymer and latex modified emulsions to allows for the
effect of modification on resistance to bleeding to be quantified. The list of the asphalt emulsions
evaluated is given in Table III-1. The asphalt emulsions were procured from emulsion suppliers
in Wisconsin.
Table III-1: Asphalt Emulsions Used
Emulsions Specifications
CRS-2 60% asphalt weight
CRS-2L 67% asphalt weight
CRS-2P 66.25% asphalt weight
HFRS-2 62% asphalt weight
HFRS-2P 60% asphalt weight
The two aggregate evaluate were granite and limestone to allow for the effects of
aggregate mineralogy to be studies. The aggregate were selected to represent materials readily
available in Wisconsin. The properties of the aggregate used are given in Table III-2. These
properties meet the specification of AASHTO T96 and ASTM D 5821 for % LA abrasion and %
fracture faces accordingly.

32
Table III-2 Aggregate Types and Properties Used
Aggregate Properties Specification Granite Limestone
% LA abrasion Limit 35% 18.1% 23%
% Fracture Faces 90-100 95% 90%
3.2 Aggregate Gradation
Chip seals are generally constructed with uniform graded gradations. The effects of
gradation were evaluated by considering two gradations, namely coarse and fine, based on the
maximum aggregate size. The coarse gradation is made up of 50% passing 9.5 mm and 0%
passing the 6.5mmm size sieve. The fine gradation had 50 % passing 6.5 mm size sieve and 0%
passing 4.75 mm size sieve. The aggregate were washed very well to remove all the dust coating
the larger particles. Summary of gradation selection for this thesis is shown in
.
Table III-3: Summary of Gradation Selection (% passing)
Sieve size Gradation
Fine Coarse
1/2 in. 100 100
3/8 in. 100 50
1/4 in. 50 0
No.4 0 0
No.8 0 0
No.40 0 0
No.200 0 0
The Weibull distribution was fitting the gradation curves in order to calculate the gradation shape
parameters. The parameters calculated were κ and λ which denote the shape (fineness or
coarseness) and the scale (dense or open/gap-graded) of aggregate type respectively. These
33
parameters can be determine by the Equation III-1. These parameters were used in the statistical
analysis to evaluate the effects of gradation.
( )
( ) 1kx
P x e
III-1
where, P(x) = Percent finer than sieve x
x = Sieve size in millimeters to the 0.45 power,
λ, κ = Curve fit parameters shape and scale, respectively.
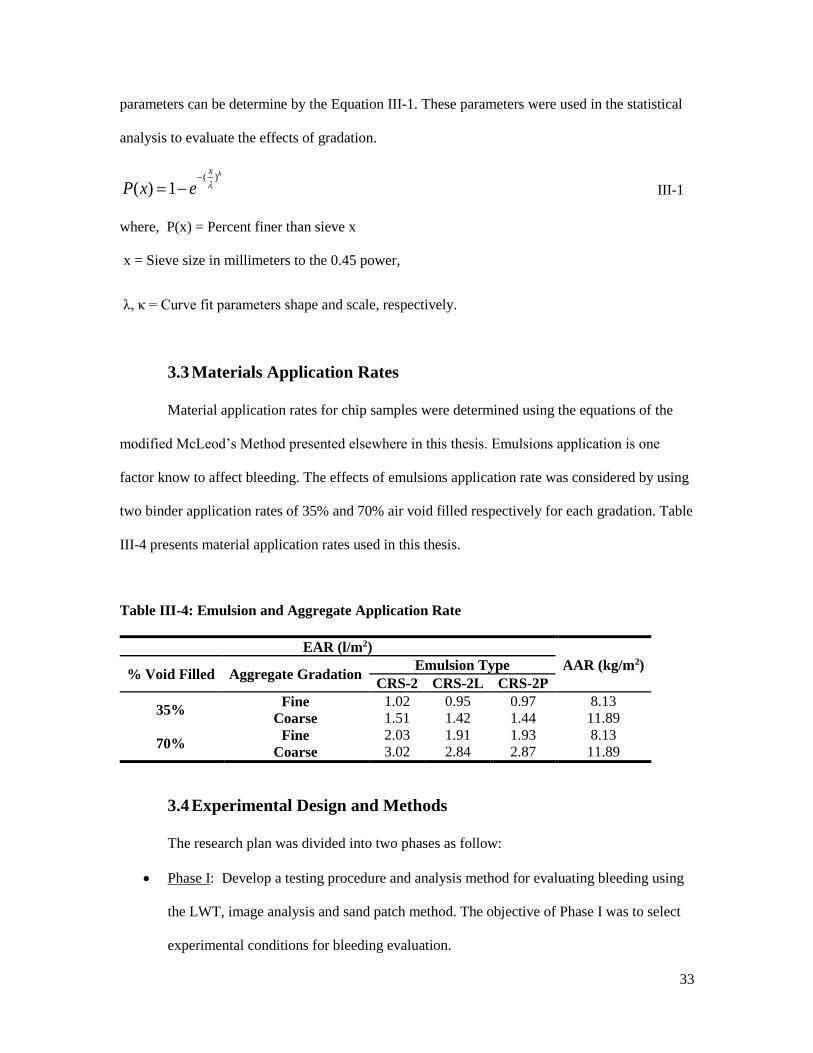
3.3 Materials Application Rates
Material application rates for chip samples were determined using the equations of the
modified McLeod’s Method presented elsewhere in this thesis. Emulsions application is one
factor know to affect bleeding. The effects of emulsions application rate was considered by using
two binder application rates of 35% and 70% air void filled respectively for each gradation. Table
III-4 presents material application rates used in this thesis.
Table III-4: Emulsion and Aggregate Application Rate
EAR (l/m2)
AAR (kg/m2) % Void Filled Aggregate Gradation
Emulsion Type
CRS-2 CRS-2L CRS-2P
35% Fine 1.02 0.95 0.97 8.13
Coarse 1.51 1.42 1.44 11.89
70% Fine 2.03 1.91 1.93 8.13
Coarse 3.02 2.84 2.87 11.89
3.4 Experimental Design and Methods
The research plan was divided into two phases as follow:
Phase I: Develop a testing procedure and analysis method for evaluating bleeding using
the LWT, image analysis and sand patch method. The objective of Phase I was to select
experimental conditions for bleeding evaluation.

34
Phase II: Assessment of the effects of design factors on bleeding resistance and
relationship between Jnr and Bleeding Resistance
The experimental designs for Phase I in Table III-5. Samples for Phase I were prepared
with a CRS-2 emulsion, granite aggregate, fine gradation and one application rate of 70% air void
filled. The testing procedure and analysis methods used are presented in subsequent sections.
Table III-5: Experimental Design for Selecting Experimental Conditions for Bleeding
Evaluation with the LWT (Phase I)
Factors Levels Description Parameter Measured
Temperature (ºC) 3 46, 52, 58
% Area with
Bleeding
Traffic Stress (kPa) 3 140, 299, 457
Curing Time @ 60C (hrs.) 2 24 & 48
Loading Cycles (cycles) 2 50 & 200
Replicate 2 2
Total Tests 72 72
*Denotes that standard procedure was modified for research.
The experimental plan for Phase II is given in Table III-6. This experiment was carried out with
granite aggregate and at a constant stress level, curing time and loading cycle which were based
on experiment in Phase I. Phase II also required the results of the LWT to be collated to asphalt
emulsions residues properties known to affect bleeding. The test procedure used to evaluate
residue properties is described in subsequent sections.
Table III-6: Experimental Design for Assessing Effects of Design Factors on Bleeding
Resistance and Relationship between Jnr and Bleeding Resistance with LWT (Partial -
Phase II)
Factors Levels Description Parameter Measured
Emulsion Type 3 CRS-2, CRS-2P & CRS-2L
Aggregate
Gradation
2 Fine & Coarse

35
Emulsion
Application Rate
2 30 & 70% voids filled % Area with
Bleeding
Temperature 3 Jnr@ 3.2 kPa- 0.5, 2.0, 5.0
(adjust temperature to keep Jnr
constant)
Replicate 2 2
Total Tests 72 72
*Denotes that standard procedure was modified for research.
To verify the equation for the bleeding resistance, null tests were necessary to be carried
out in the LWT test. For the null experiments, the emulsions and aggregate were selected
different from the experiment 1 and 2. The experiment was conducted by a constant of limestone,
coarse gradation, stress of 299 kPa (43.4 psi), one day curing time and loading cycle at 200
cycles. The null experiments matrix is shown in Table III-7.
Table III-7: Null Experiment Design for Verifying the Best Subsets for Bleeding Resistance
with LWT
Factors Levels Description Parameter Measured
Emulsions 2 HFRS-2, HFRS-2P
% Area with
Bleeding
Emulsion
application rate
2 %void filled= 70%
Temperature 2 [email protected] kPa - 2.0 ,5.0
Replicate 2 2
Total Tests 16 16
*Denotes that standard procedure was modified for research.
3.5 Emulsion Residue Performance
The overall objective of the plan was to finalize development of the bleeding test and to test the
hypothesis that the emulsion residue Jnr value is the factor that most contributes to bleeding
performance. The MSCR test as specified in AASHTO TP-70 was selected to evaluate emulsion
residue bleeding resistance at high temperature. Experimental plan for testing residue properties
is given in Table III-8.

36
Table III-8: Experimental Design for Emulsion Residue Characterization
Property Test Selected Test Conditions Evaluation
Parameters
Binder HT
Performance
MSCR – AASHTO
TP 70
46°C, 58°C, 64°C
0.1 kPa, 3.2 kPa, 10 kPa
10 cycles @ each stress
Jnr (kPa-1)
% Recovery
Stress Difference
Test conditions were varied to assess both sensitivity to temperature and stress, as
softening related to these factors were identified previously as the materials parameters related to
bleeding. To further assess stress sensitivity, a third stress level of 10 kPa was included in the test
procedure. AASHTO MP-19 provides specification criteria based on the Jnr value for different
traffic loading conditions. In the specification the maximum value for standard traffic (S) is equal
to 4.0 kPa-1, for subsequent traffic conditions associated with heavy (H), very heavy (V), and
extremely heavy (E) the Jnr threshold is reduced by a factor of two. In this study the range of test
temperatures was selected to both represent possible service temperatures experienced in
Wisconsin and to obtain Jnr values both above and below the S-grade threshold. All emulsion
residues were recovered using the low temperature evaporative recovery procedure specified in
ASTM D7497 Method B, this recovery method involves drawing the emulsion down to a film
thickness of 381 µm on a silicone mat and curing for 6 hours at 60°C in a forced draft oven.
3.6 Modified Loaded Wheel Test to Assess Chip Seal Bleeding
Previous research has established that the MSCR test is capable of discriminating
between emulsion type and effect of emulsion modification; however these efforts did not include
comparisons to chip seal performance. As a result, a significant research needed to validate that
the differences observed in emulsion residue testing are present in mixture performance and
applying this relationship to propose performance limits. To address this research need the loaded

37
wheel test as specified in ASTM D6372 was modified to serve as a chip seal bleeding test. In its
original state the LWT is intended for assessing bleeding potential in slurry seal and micro-
surfacing applications. The test applies a rubber tired wheel of 7.62 cm diameter with a load of
approximately 57 kg to a micro-surfacing for 1000 cycles at a frequency of 44 cycles/minute. The
weight of the dry sample is recorded, and hot sand heated to 85ºC is added to the sample. The
sample is further subjected to 100 cycles with the sand on top of it. The sand of dusted off the
sample at the end of 100 cycles and the weight of the sample recorded again. Bleeding is
determined indirectly by limiting the amount of sand adhering to the samples.
To apply the LWT test to evaluation of bleeding in chip seals modifications were made
both to the equipment and output of the test. Specific modifications to the testing equipment are
summarized below and presented in Figure III-1.
1. Temperature control device
2. Modifying the dimensions of the base plate used to secure the sample.
3. Rubber mat used to protect tire wear
4. Neoprene Foam used to represent existing flexible pavement
5. Clamps used to hold the sample during testing

38
Figure III-1: Additional Material for Determining Chip Seal Bleeding Using Loaded Wheel
Tester
The most important part developing the testing equipment is the material supporting the
tested sample. The reason of using neoprene foam as substrate is that the stiffness of steel support
which was the first trial test for bleeding can easily cause raveling on the sample. Due to the
bleeding mechanism, the embedment of chips is the crucial point to take into account, if the
existing substrate is stiff, chips will easily dislodge instead of embedment into existing substrate.
To eliminate the raveling in bleeding test, using material properties which are consistent to
existing asphalt pavement were considered. Figure III-2 shows the samples with the same
condition with different support after bleeding test, Figure III-2 (a) and (b) are sample test with
steel support and with neoprene support, respectively. After weighting the mass loss for those two
samples, sample (a) obtained the mass loss around 10g, in other words, sample (b) obtained the
mass loss less than 1.5 g. This result could indicate that stiffness of support is the important part
to develop LWT quantifying bleeding.

39
(a) (b)
Figure III-2: Samples with the same condition after bleeding test (a) steel support (b)
neoprene foam support
In current application, the LWT test is intended to be conducted at ambient temperatures,
however this research proposes that bleeding distress in chip seals is caused by softening of the
emulsion at high service temperatures. To allow for testing at elevated temperatures, the area
around the sample was insulated and instrumented with a temperature control unit and heating
tape. Prior to application temperature inside the chamber was monitored. Results found that the
chamber was capable of maintaining temperature at a tolerance of ±1°C up to chamber
temperatures of 67°C.
The wheel used to apply the loading was a rubber tire with rubber mat at top of sample as
excessive wear was observed when the rubber tire was directly applied to chip seals due to the
abrasive nature of the cover aggregate. To reduce the stress intensity of the wheel load a 25 mm
foam pad was inserted between the specimen and surface of the wheel. The final modification
made was expanding the dimensions of the base plate under the sample to a size of 40 cm x 28
cm to accommodate the dimensions of the sample size used for the ASTM D7000 sweep test.
The larger sample was secured by appropriately sized clamps. The ASTM D7000 sweep test
sample size was selected because it is the only geometry that exists in current standards for
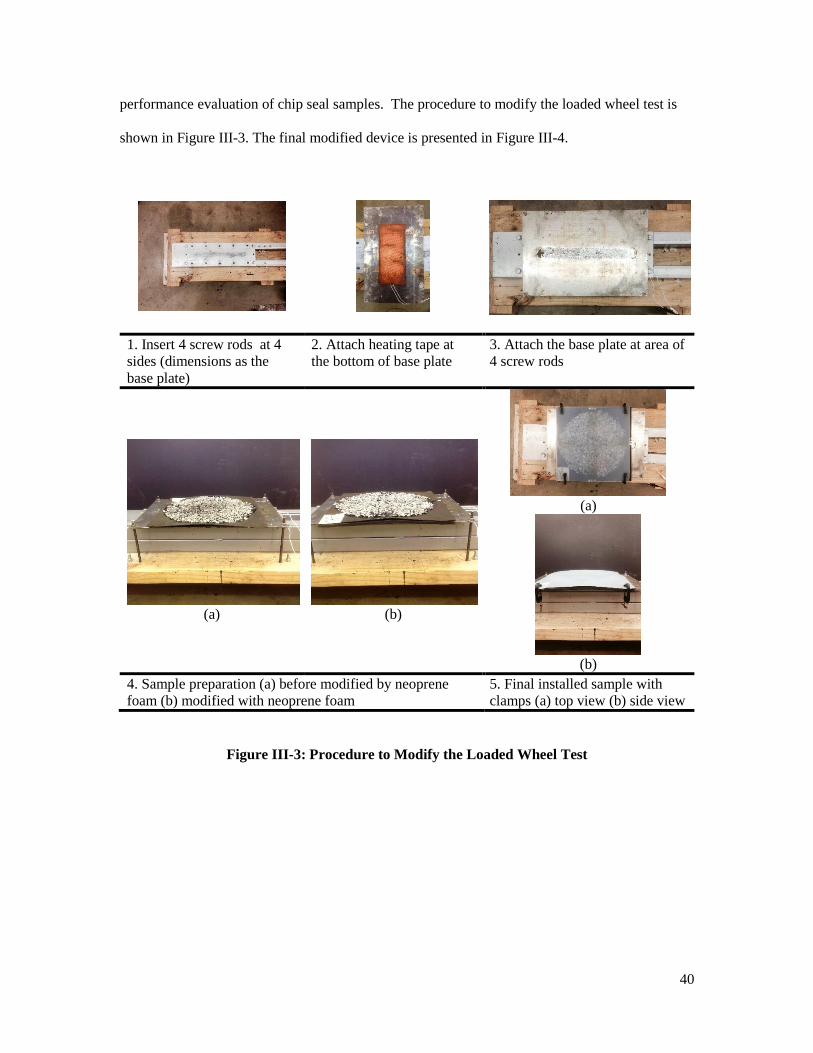
40
performance evaluation of chip seal samples. The procedure to modify the loaded wheel test is
shown in Figure III-3. The final modified device is presented in Figure III-4.
1. Insert 4 screw rods at 4
sides (dimensions as the
base plate)
2. Attach heating tape at
the bottom of base plate
3. Attach the base plate at area of
4 screw rods
(a)
(b)
(a)
(b)
4. Sample preparation (a) before modified by neoprene
foam (b) modified with neoprene foam
5. Final installed sample with
clamps (a) top view (b) side view
Figure III-3: Procedure to Modify the Loaded Wheel Test

41
(a)
(b)
Figure III-4: Diagram of Modified Wheel Test before (43) (a) and after (b) Wheel Load
Applied
3.7 Sample Preparation and Testing Procedure
Samples consisting of the emulsion/aggregate combinations were prepared according to
guidance provided in ASTM D7000. Specifically, emulsion and aggregate application rates were
calculated with the modified McLeod’s Equations presented elsewhere in this thesis. The
42
emulsion application rates are based on the literature regarding the design of emulsion application
rates containing low and high %void filled which are 35% and 70%, respectively. Samples were
then cured in an oven at 60°C in the laboratory for 1 day and 2 days according to the
experimental plan. After curing samples were placed in the LWT chamber and allowed to
acclimate to the specified testing temperature for 45 minutes. The wheel load was applied 50 and
200 cycles for experiment 1 in Phase I, and the cycle results based on experiment 1 was used for
experiment 2. Two replicates were determined for each sample which was carried out by rotating
the sample 90˚ shown in Figure III-5. Once the test was stopped, sample was scanned with a
flatbed scanner to obtain a digital image of the chip seal surface. After each scan, the sample was
reheated for a thermo-equilibration of 45 minutes prior to resuming the test. At the end of the
test, the sample was scanned and also weighed to determine aggregate loss. Each sample was
rotated 90° and re-tested to provide one replicate for each combination of materials.
3.8 Analysis Methods for Quantifying Bleeding
Bleeding is defined as a functional distress that results in a loss in texture at the chip seal
surface. Given this definition two mechanisms for loss of texture were identified 1) aggregate
loss, 2) excessive of the emulsion residue to the chip seal surface. As previously mentioned
aggregate loss was determined by comparison of the weight of the sample before and after testing
similar to the calculation provided in ASTM D7000. Migration of the emulsion residue to the
surface of the chip seal was quantified through use of digital image processing techniques to
compare the initial area of emulsion residue at the surface to the area after various cycles of
loading. Two approaches were used to quantify bleeding: Image analysis and surface texture as
described briefly below.

43
3.9 Image Analysis by IPAS2
To conduct this analysis the IPAS2 software developed by UW-Madison was used to the
convert the captured image to a binary (black/white) image using well established image
threshold techniques (15). In the binary image the aggregate and emulsion residue are
represented as white and black colors, respectively. The analysis is calibrated to the aggregate
type by scanning the bare aggregate prior to testing to obtain the threshold pixel intensity (color)
associated with the aggregate. The filter then converts all areas at and below the threshold value
to white and the remaining area to black. The relative areas of each component are then
calculated automatically by the software. An example of the application of image analysis to
quantify bleeding is provided in Figure III-5.
(a)
(b)
Figure III-5: Prepared Sample and Resulting B/W Image Prior To Bleeding Test (a) and
After Bleeding Test (b)
The extent of bleeding is then calculated using Equation III-2:
Bleeding (%) = 𝐴𝐴𝑖𝑛𝑖𝑡𝑖𝑎𝑙−𝐴𝐴𝑥
𝐴𝐴𝑖𝑛𝑖𝑡𝑖𝑎𝑙× 100 III-2
Where:
AAx = Area fraction of Aggregate after x cycles.
AAinitial = Area fraction of Aggregate prior to testing.
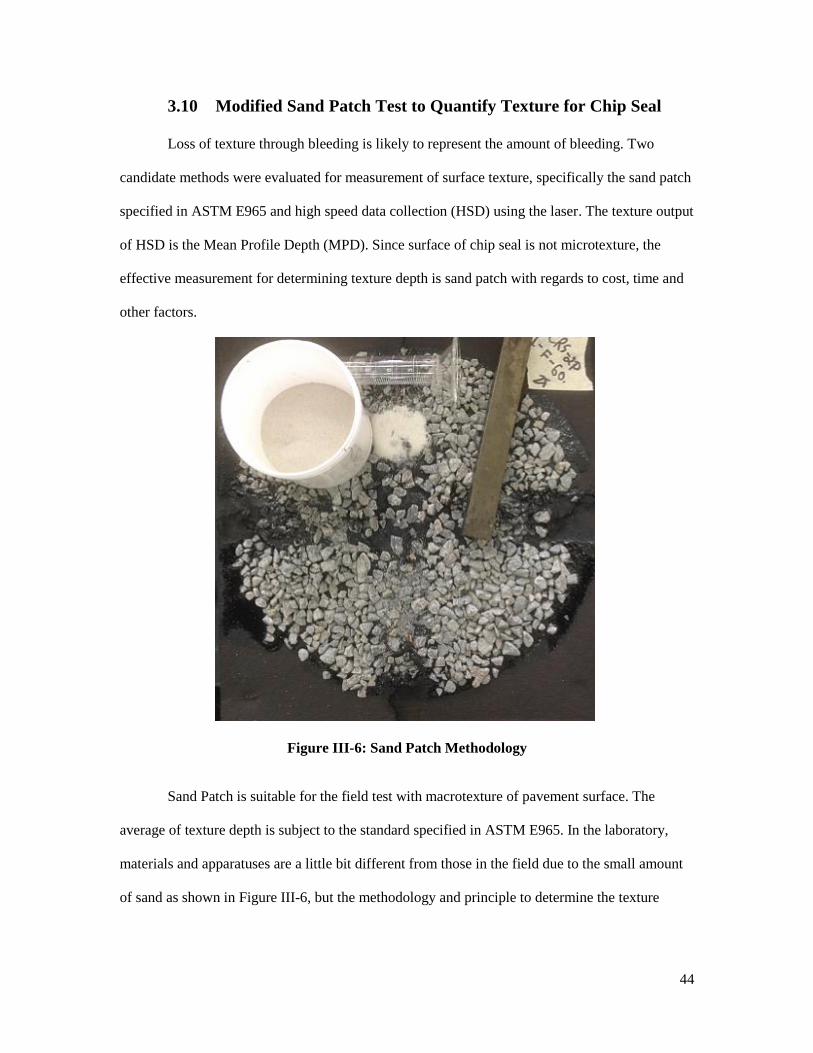
44
3.10 Modified Sand Patch Test to Quantify Texture for Chip Seal
Loss of texture through bleeding is likely to represent the amount of bleeding. Two
candidate methods were evaluated for measurement of surface texture, specifically the sand patch
specified in ASTM E965 and high speed data collection (HSD) using the laser. The texture output
of HSD is the Mean Profile Depth (MPD). Since surface of chip seal is not microtexture, the
effective measurement for determining texture depth is sand patch with regards to cost, time and
other factors.
Figure III-6: Sand Patch Methodology
Sand Patch is suitable for the field test with macrotexture of pavement surface. The
average of texture depth is subject to the standard specified in ASTM E965. In the laboratory,
materials and apparatuses are a little bit different from those in the field due to the small amount
of sand as shown in Figure III-6, but the methodology and principle to determine the texture

45
depth are still the same. The calculation of average mean texture depth is dependent on volume of
cylinder and average diameter of the area covered by sand as shown in Equation III-3.
𝑀𝑇𝐷 =4𝑉
𝜋𝐷2 III-3
where:
MTD = mean texture depth of pavement macrotexture, in.(mm),
V = sample volume, in.3 (mm3), and
D = average diameter of the area covered by the material, in. (mm).

46
IV. CHAPTER 4: Experimental Results
This chapter presents the testing results obtained from the test methods described in
previous chapter to determine the effect of each factor on bleeding resistance including effect of
temperature, contact stress, loading cycle, and curing time on bleeding resistance and the
relationship between bleeding resistance and loss of texture.
4.1 Application of Modified LWT Test to Assess Bleeding Potential
Mechanisms of bleeding in chip seals are both construction and materials related. In
regards to construction, bleeding is caused by use of an excessive application rate, or embedment
of the aggregate into the existing pavement surface caused by over-compaction or selecting an
inappropriate site for application of chip seal as a maintenance treatment. Given that these factors
are properly controlled bleeding can occur while in-service due to softening of the emulsion
residue caused either by increased temperature or stress.
Phase I one of this thesis focused on establishing the testing parameters for evaluating
bleeding of chip samples with a modified LWT device. The experimental design for Experiment
1 (Phase 1) is presented in Table III-5. Samples were prepared in accordance with the ASTM
D7000 using a fine gradation (6.3 mm. maximum aggregate size), and cured at 60ºC for 24 and
48 hrs. Testing was carried out following the procedure described in Section 3.4 at various
temperatures, loading cycles and contact stresses. To evaluate bleeding, the surface of the
samples was scanned for image analysis before and after testing. Evaluation of bleeding
resistance was conducted by IPAS which can give ratio of aggregate fraction of each image to
assess the percent bleeding described in Chapter 3. Images of the chip seal texture after the
bleeding test are presented in Figure IV-1 for 3 temperatures cured at 60°C for 24 hr. at medium
contact stress and 50, 200 cycles for 2 replicates. The various factors evaluated in Phase I are

47
presented in Table IV-1, and also l the abbreviations used to describe different factors in
subsequent sections.
Table IV-1: Definition of Experimental Variables
Variables Definition
Temperature 46, 52 and 58 if the test temperature of 47˚C, 52 ˚C and 58˚C,
respectively
Contact Stress L, M and H if the contact stress of 140 kPa (20.31 psi), 299
kPa (43.4 psi) and 457 kPa (66.4 psi), respectively
Loading Cycle
Curing Time
50 and 200 if the loading cycle of 50 cycle and 200 cycle,
respectively
1 and 2 if the curing time of 1 and 2 day, respectively
The example for addressing the label in each bar need to clarify. In Figure IV-2, for
example, the label of 1-L-50 shown in the bar chart represent the sample test cured for 1 day,
applied contact stress of 140 kPa (20.31 psi), and run at 50 cycle. These are applied every bar
chart figure throughout this chapter.
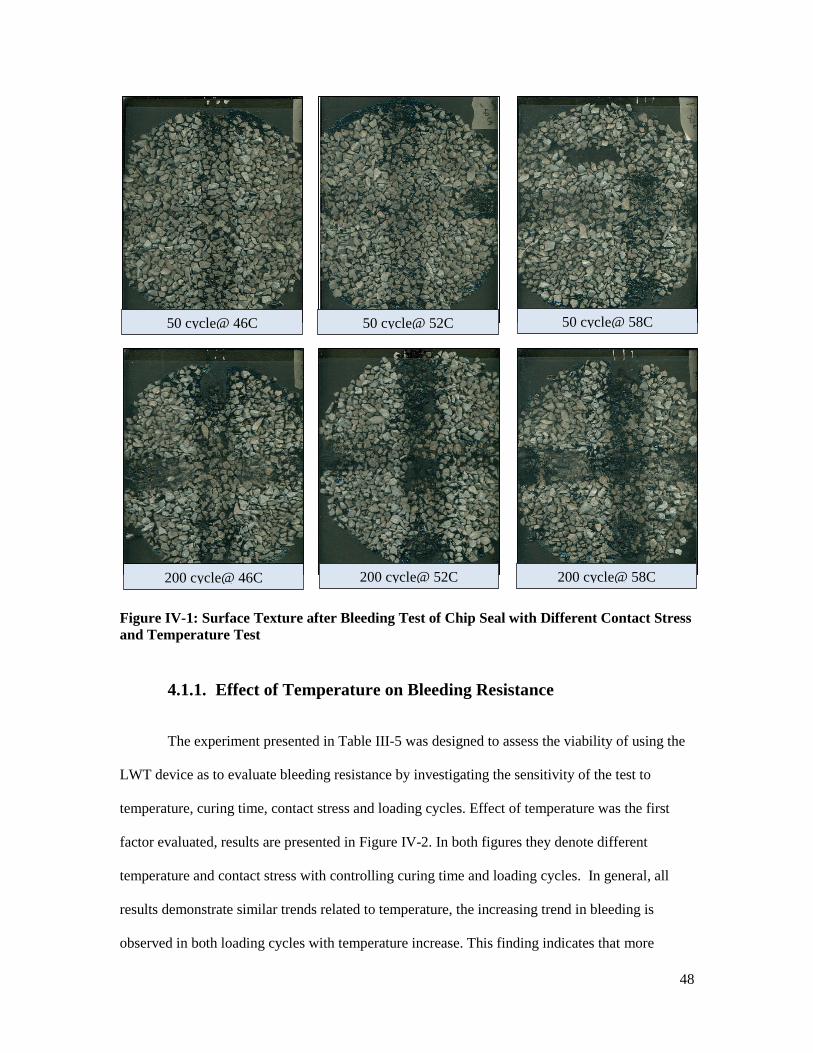
48
Figure IV-1: Surface Texture after Bleeding Test of Chip Seal with Different Contact Stress
and Temperature Test
4.1.1. Effect of Temperature on Bleeding Resistance
The experiment presented in Table III-5 was designed to assess the viability of using the
LWT device as to evaluate bleeding resistance by investigating the sensitivity of the test to
temperature, curing time, contact stress and loading cycles. Effect of temperature was the first
factor evaluated, results are presented in Figure IV-2. In both figures they denote different
temperature and contact stress with controlling curing time and loading cycles. In general, all
results demonstrate similar trends related to temperature, the increasing trend in bleeding is
observed in both loading cycles with temperature increase. This finding indicates that more
50 cycle@ 46C 50 cycle@ 52C 50 cycle@ 58C
200 cycle@ 46C 200 cycle@ 52C 200 cycle@ 58C

49
bleeding is observed at higher test temperature (higher Jnr). Therefore, Jnr will be controlled in
experiments 2. For experiment 2 this will isolate the effects of design factors without having the
confounding effect of different Jnr values of different emulsion.
(a)
(b)
Figure IV-2: Effect of Test Temperature on Bleeding Resistance for 50 cycles (a), 200 cycles
0%
5%
10%
15%
20%
25%
30%
46C 52C 58C
Ble
ed
ing
Testing Temperature
1-L-50 1-M-50 1-H-50
0%
10%
20%
30%
40%
50%
60%
70%
46C 52C 58C
Ble
ed
ing
Test Temperature
1-L-200 1-M-200 1-H-200

50
This observation appears to support what is generally reported in the literature, that
bleeding increases with temperature, contact stress (traffic load) and number of loading cycles
(traffic volume). This information was used later in Phase I to control the effect residue high
temperature properties on the design factors.
4.1.2. Effect of Contact Stress on Bleeding Resistance
Chip seals constructed in areas with high traffic stress (truck traffic) have been reported
to be prone to bleeding because aggregate particles are either forced into the existing substrate or
may break down into smaller particles. For the LWT to be an effective bleeding evaluation tool
for chip seals, is it was important to determine that the test is sensitive to change in contact stress.
Results are presented in
Table IV-2, and demonstrate that the loading cycles and contact stress strongly influences the
overall extent of bleeding and sensitivity to test temperature.
Table IV-2 Stress Sensitivity for Bleeding Resistance
Contact Stress
Stress Sensitivity
46 C 52 C 58 C
50 200 50 200 50 200
140 kPa-299 kPa 6% 20% 0% 16% 2% 21%
140 kPa-457 kPa 5% 24% 3% 38% 14% 38%
For 50 cycles, a stress sensitivity effect is observed as an increase in % bleeding for low
(140 kPa) to medium (299 kPa) of ranging 0%-6%. Also, for low (140 kPa) to high (457 kPa) a
stress sensitivity range for all test temperatures is 3%-14%. For 200 cycles, a stress sensitivity is
shown as in range of 16%-21% for 140 kPa to 299 kPa and obviously wide range on stress
sensitivity of 140 kPa to 457 kPa with approximately 24%-38% different. This finding
51
indicates that the test is relatively insensitive to stress in low and mid-temperature at low
loading cycles. Then at 58C is sensitive. This is the preliminary data, but it supports that
the PG at high range would represent a condition related to performance of the seal.
Besides, increasing in contact stress gives more bleeding at all temperatures in high
loading cycles. It does not matter to test all contact stresses in Phase 2. Therefore, to meet the
contact stress of general traffic load, 299 kPa (43.4 psi) were chosen for testing in Phase 2.
4.1 Effect of Loading Cycle on Bleeding Resistance
The LWT was evaluated to determine if it was sensitive to the number of loading cycles,
because chip seals with high traffic volume have been reported to fail prematurely as a result of
bleeding. Results presented in Figure IV-3 show that testing with low cycle (50 cycles) at 46°C
and 52°C can give the % bleeding up to 10 %. However, at 58°C, the highest % bleeding can
reach to 26 % at the highest contact stress. With relative to loading cycle at 200 cycles, the results
obviously present the high % bleeding at all conditions. The wide range of % bleeding was
observed with 17%, 18%, and 31% with regards to temperature increasing (46°C -58°C) for low,
medium, and high contact stress, respectively. This results manifest that contact stress and
loading cycle influence the appearance of bleeding. A wide range of bleeding in 200 cycles can
better account for the difference in terms of % bleeding and effect of each factor than a narrow
range of bleeding in 50 cycles. As a result, medium contact stress was selected as results showed
an enough wide range in bleeding performance as the bleeding for 200 cycles shows 16% and
22% different between low and medium contact stress, and medium and high contact stress.
Therefore, to fill up the Phase 2 in loading cycle and contact stress, 200 cycles and medium
contact stress were selected to conduct the tests, respectively.
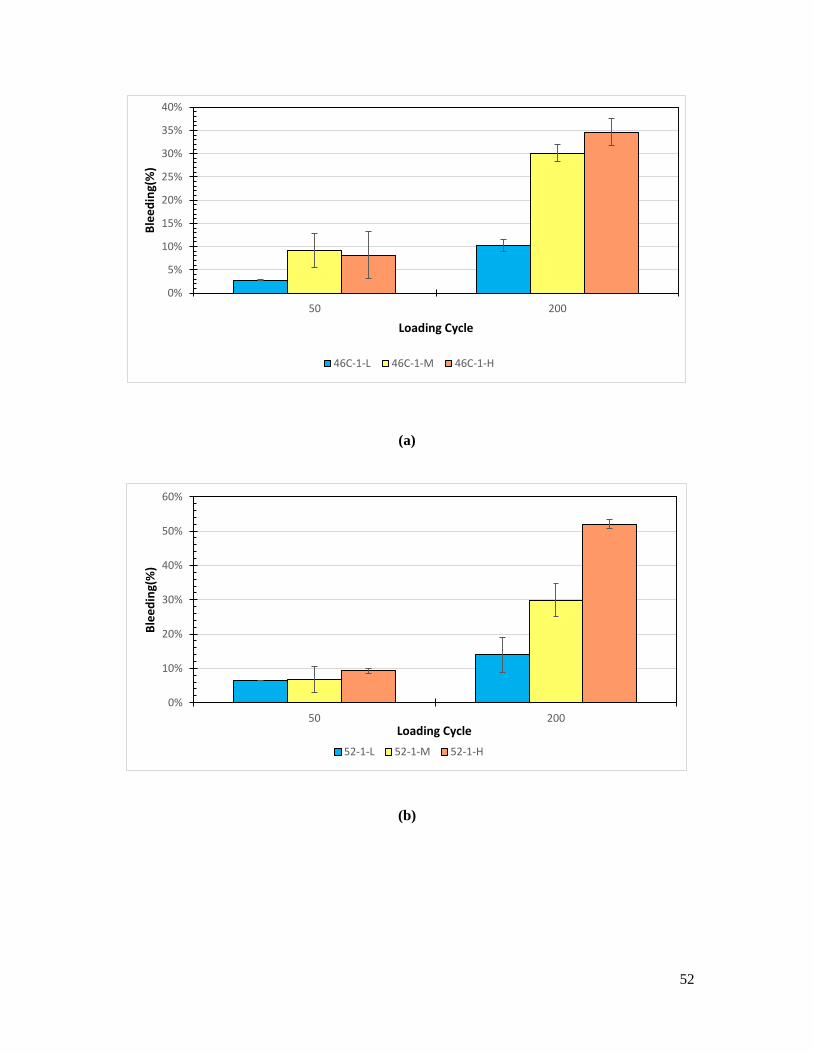
52
(a)
(b)
0%
5%
10%
15%
20%
25%
30%
35%
40%
50 200
Ble
ed
ing(
%)
Loading Cycle
46C-1-L 46C-1-M 46C-1-H
0%
10%
20%
30%
40%
50%
60%
50 200
Ble
ed
ing(
%)
Loading Cycle
52-1-L 52-1-M 52-1-H

53
(c)
Figure IV-3: Effect of loading cycle on Bleeding Resistance for contact stress of 140 kPa
(20.31 psi) (a) 299 kPa (43.4 psi) (b) and 457 kPa (66.4 psi) (c)
This could lead to the different % bleeding in various modifications of emulsion binder in
Phase 2. Moreover, 200 cycles could be appropriate loading cycles to see the effect of emulsion
application rate in Phase 2 due to the discrimination between other conditions.
4.1.3. Effect of Curing Time on Bleeding Resistance
Curing time has been shown as one the critical causing raveling, which also leads to
bleeding. It was therefore important to establish a curing time for chip samples on which bleeding
is evaluated, and prevent confounding effects. This was accomplished by performing testing on
samples cured for 1 and 2 days curing intervals. Comparison among groups of various
temperature, contact stress and loading cycle for 1 and 2 day curing time is shown in Table IV-3.
Table IV-3 shows the different % bleeding of 1 day curing time and 2 day curing time. The result
displays that all conditions give significantly the same value of % bleeding which an absolute
0%
10%
20%
30%
40%
50%
60%
70%
50 200
Ble
ed
ing(
%)
Loading Cycle
58C-1-L 58C-1-M 58C-1-H
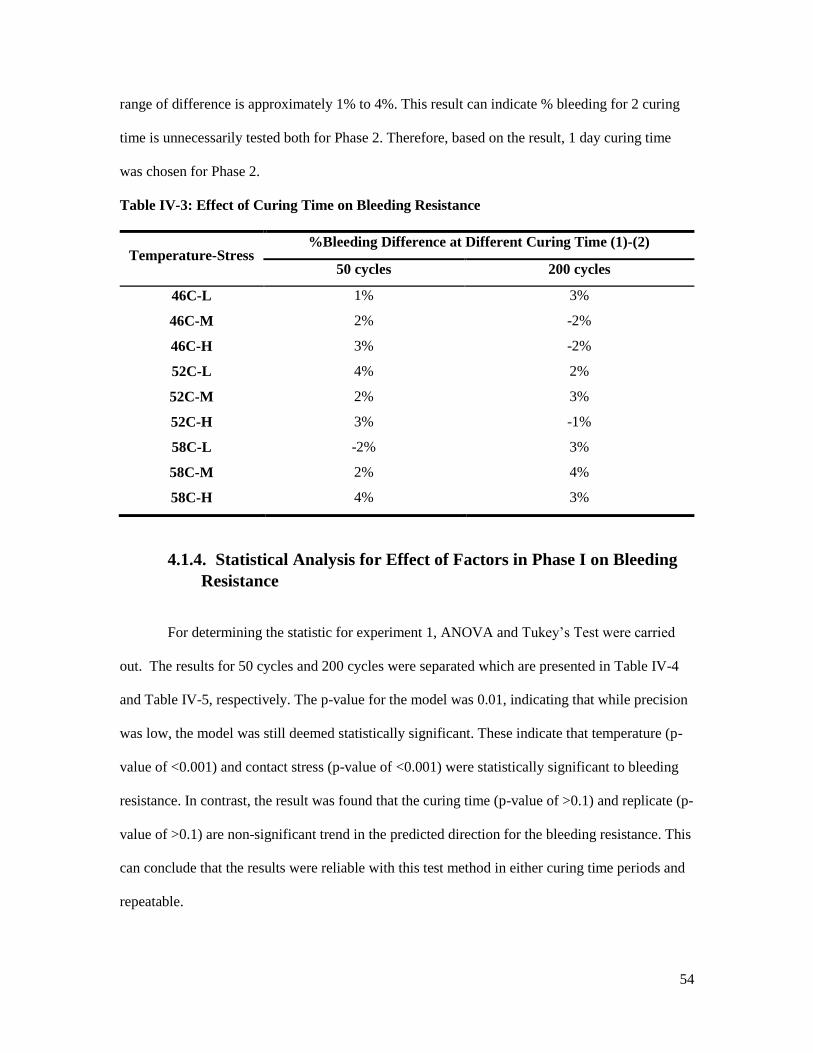
54
range of difference is approximately 1% to 4%. This result can indicate % bleeding for 2 curing
time is unnecessarily tested both for Phase 2. Therefore, based on the result, 1 day curing time
was chosen for Phase 2.
Table IV-3: Effect of Curing Time on Bleeding Resistance
Temperature-Stress %Bleeding Difference at Different Curing Time (1)-(2)
50 cycles 200 cycles
46C-L 1% 3%
46C-M 2% -2%
46C-H 3% -2%
52C-L 4% 2%
52C-M 2% 3%
52C-H 3% -1%
58C-L -2% 3%
58C-M 2% 4%
58C-H 4% 3%
4.1.4. Statistical Analysis for Effect of Factors in Phase I on Bleeding
Resistance
For determining the statistic for experiment 1, ANOVA and Tukey’s Test were carried
out. The results for 50 cycles and 200 cycles were separated which are presented in Table IV-4
and Table IV-5, respectively. The p-value for the model was 0.01, indicating that while precision
was low, the model was still deemed statistically significant. These indicate that temperature (p-
value of <0.001) and contact stress (p-value of <0.001) were statistically significant to bleeding
resistance. In contrast, the result was found that the curing time (p-value of >0.1) and replicate (p-
value of >0.1) are non-significant trend in the predicted direction for the bleeding resistance. This
can conclude that the results were reliable with this test method in either curing time periods and
repeatable.
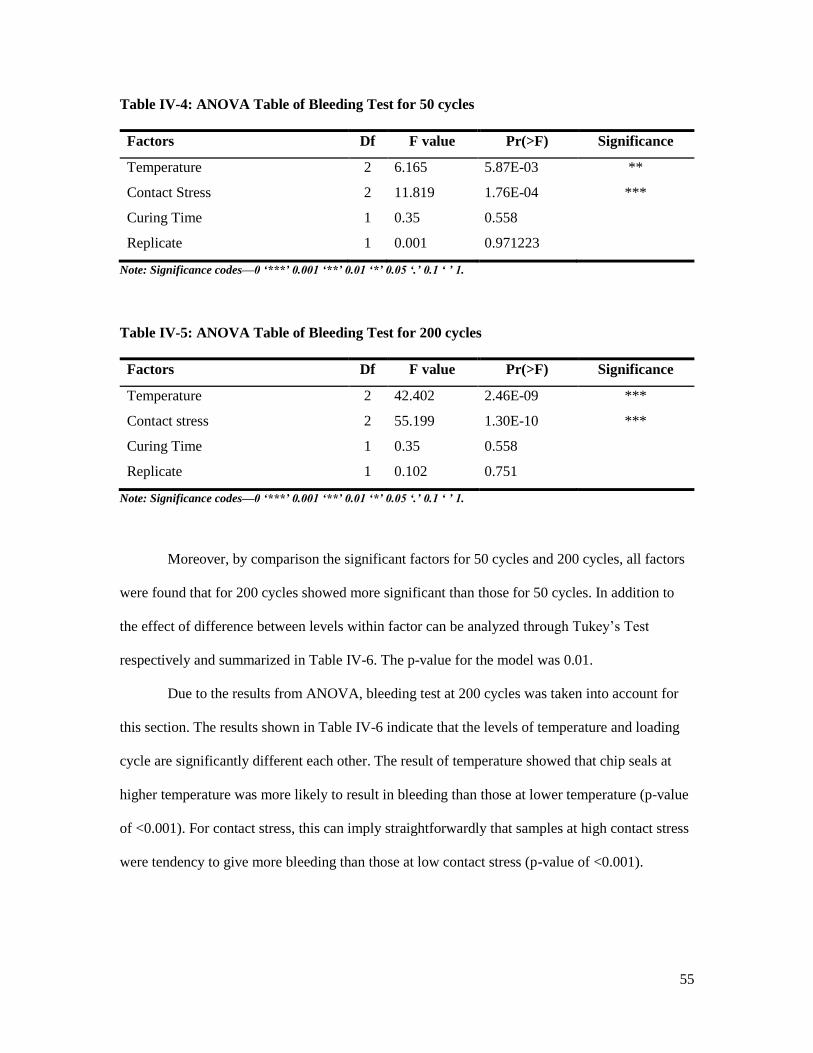
55
Table IV-4: ANOVA Table of Bleeding Test for 50 cycles
Factors Df F value Pr(>F) Significance
Temperature 2 6.165 5.87E-03 **
Contact Stress 2 11.819 1.76E-04 ***
Curing Time 1 0.35 0.558
Replicate 1 0.001 0.971223
Note: Significance codes—0 ‘***’ 0.001 ‘**’ 0.01 ‘*’ 0.05 ‘.’ 0.1 ‘ ’ 1.
Table IV-5: ANOVA Table of Bleeding Test for 200 cycles
Factors Df F value Pr(>F) Significance
Temperature 2 42.402 2.46E-09 ***
Contact stress 2 55.199 1.30E-10 ***
Curing Time 1 0.35 0.558
Replicate 1 0.102 0.751
Note: Significance codes—0 ‘***’ 0.001 ‘**’ 0.01 ‘*’ 0.05 ‘.’ 0.1 ‘ ’ 1.
Moreover, by comparison the significant factors for 50 cycles and 200 cycles, all factors
were found that for 200 cycles showed more significant than those for 50 cycles. In addition to
the effect of difference between levels within factor can be analyzed through Tukey’s Test
respectively and summarized in Table IV-6. The p-value for the model was 0.01.
Due to the results from ANOVA, bleeding test at 200 cycles was taken into account for
this section. The results shown in Table IV-6 indicate that the levels of temperature and loading
cycle are significantly different each other. The result of temperature showed that chip seals at
higher temperature was more likely to result in bleeding than those at lower temperature (p-value
of <0.001). For contact stress, this can imply straightforwardly that samples at high contact stress
were tendency to give more bleeding than those at low contact stress (p-value of <0.001).
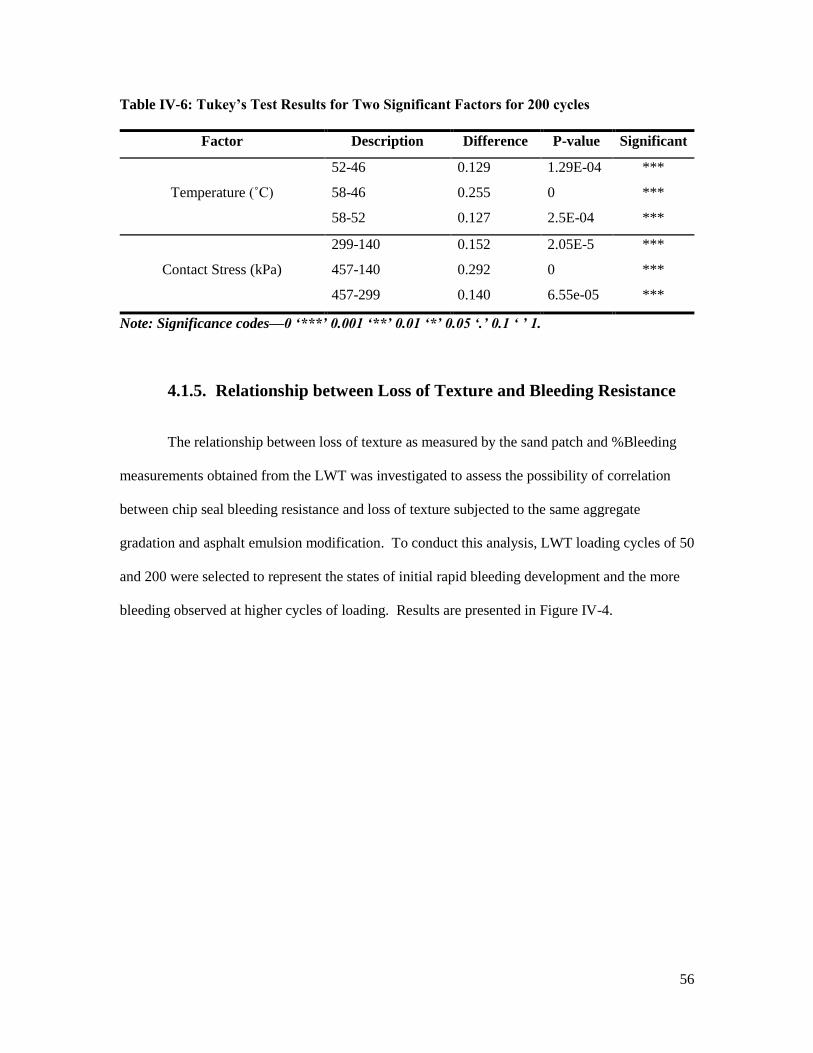
56
Table IV-6: Tukey’s Test Results for Two Significant Factors for 200 cycles
Factor Description Difference P-value Significant
Temperature (˚C)
52-46 0.129 1.29E-04 ***
58-46 0.255 0 ***
58-52 0.127 2.5E-04 ***
Contact Stress (kPa)
299-140 0.152 2.05E-5 ***
457-140 0.292 0 ***
457-299 0.140 6.55e-05 ***
Note: Significance codes—0 ‘***’ 0.001 ‘**’ 0.01 ‘*’ 0.05 ‘.’ 0.1 ‘ ’ 1.
4.1.5. Relationship between Loss of Texture and Bleeding Resistance
The relationship between loss of texture as measured by the sand patch and %Bleeding
measurements obtained from the LWT was investigated to assess the possibility of correlation
between chip seal bleeding resistance and loss of texture subjected to the same aggregate
gradation and asphalt emulsion modification. To conduct this analysis, LWT loading cycles of 50
and 200 were selected to represent the states of initial rapid bleeding development and the more
bleeding observed at higher cycles of loading. Results are presented in Figure IV-4.

57
Figure IV-4: Relationship between Surface Texture and Bleeding Resistance
Results indicate that a moderate linear relationship exists between loss of texture and
%bleeding for combination of loading cycles and curing time as coefficients of correlation range
approximately 70%. This findings can identify that with the same gradation and emulsion
application rate, texture loss is moderately linear correlation with % bleeding which is correlated
to the cause of flushing stating in Chipsealing in New Zealand.
4.1.6. Summary of Finding
By considering all effects on experiment 1 (Phase 1), temperature was significantly
different in % bleeding meaning that more temperature shows more bleeding, so temperature for
experiment 2 (Phase 2) was varied by controlled Jnr. Contact stress was obviously different in
medium level (299 kPa; 43.4 psi); therefore, medium level is the representative for contact stress.
The result of loading cycle presented that a 200 cycles was conducted by varied emulsion
application rate in experiment 2 (Phase 2). Curing time gave relatively similar result meaning that
y = 0.817x - 0.2128R² = 0.7001
0%
10%
20%
30%
40%
50%
60%
70%
80%
90%
100%
0% 10% 20% 30% 40% 50% 60% 70% 80% 90% 100%
%Te
xtu
re L
oss
%Bleeding

58
either 1 day or 2 days curing could be chosen for testing; therefore, 1 day curing was selected for
conducting the test. Completed experiment for Phase 2 is shown in Table IV-7.
Table IV-7: Experimental Design for Assessing Effects of Design Factors on Bleeding
Resistance and Relationship between Jnr and Bleeding Resistance (Phase II)
Factors Levels Description Parameter Measured
Emulsion Type 3 CRS-2, CRS-2P & CRS-2L
Aggregate
Gradation
2 Fine & Coarse
Emulsion
Application Rate
2 30 & 70% voids filled % Area with
Bleeding
Temperature 3 Jnr@ 3.2 kPa- 0.5, 2.0, 5.0
(adjust temperature to keep Jnr
constant)
Replicate 2 2
Total Tests 72 72
*Denotes that standard procedure was modified for research.
4.2 Relationship between Emulsion Residue Properties and Bleeding
Resistance in Chip Seal Samples
In phase II, testing was carried out on both emulsions residues and chip seals to
determine if the LWT can identify emulsions susceptible to bleeding. Emulsion properties were
evaluated through use of the MSCR test specified in AASHTO M19 at various temperatures. The
creep compliance, Jnr at one stress level of 3.2kPa was selected as the high temperature
performance criteria for asphalt emulsions. Three levels of Jnr 0.5, 2 and 5 kPa-1 were selected to
represent low, medium and high levels of bleeding respectively. Testing was carried out on
different emulsion residues to establish the test temperature at which the Jnr at the stress level of
3.2kPa was equal to 0.5, 2.0, and 5 kPa-1. The Jnr and %recovery results for all emulsions are
shown in Appendix A. The temperatures determined for different emulsion are presented in Table
IV-8.
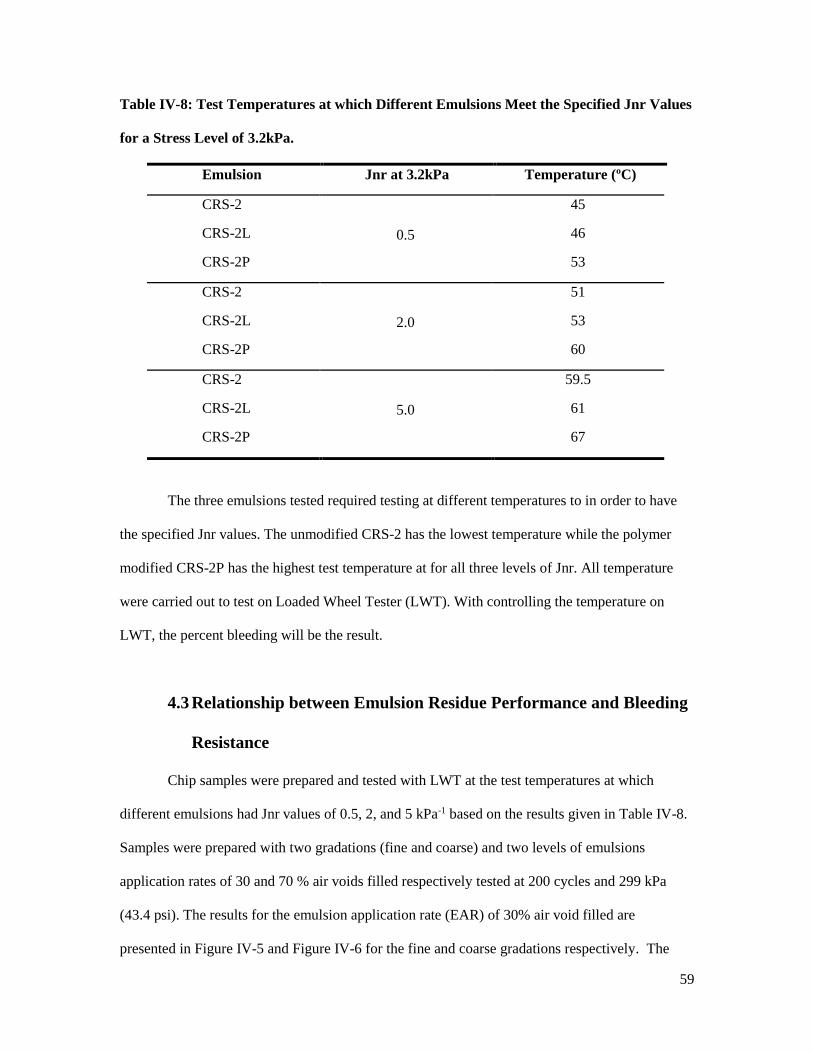
59
Table IV-8: Test Temperatures at which Different Emulsions Meet the Specified Jnr Values
for a Stress Level of 3.2kPa.
Emulsion Jnr at 3.2kPa Temperature (ºC)
CRS-2
0.5
45
CRS-2L 46
CRS-2P 53
CRS-2
2.0
51
CRS-2L 53
CRS-2P 60
CRS-2
5.0
59.5
CRS-2L 61
CRS-2P 67
The three emulsions tested required testing at different temperatures to in order to have
the specified Jnr values. The unmodified CRS-2 has the lowest temperature while the polymer
modified CRS-2P has the highest test temperature at for all three levels of Jnr. All temperature
were carried out to test on Loaded Wheel Tester (LWT). With controlling the temperature on
LWT, the percent bleeding will be the result.
4.3 Relationship between Emulsion Residue Performance and Bleeding
Resistance
Chip samples were prepared and tested with LWT at the test temperatures at which
different emulsions had Jnr values of 0.5, 2, and 5 kPa-1 based on the results given in Table IV-8.
Samples were prepared with two gradations (fine and coarse) and two levels of emulsions
application rates of 30 and 70 % air voids filled respectively tested at 200 cycles and 299 kPa
(43.4 psi). The results for the emulsion application rate (EAR) of 30% air void filled are
presented in Figure IV-5 and Figure IV-6 for the fine and coarse gradations respectively. The

60
results for both gradations show a positive relationship between Jnr and % bleeding on chip seals.
As the Jnr increases, the amount of bleeding observed increased as well for all the three
emulsions and both aggregate gradation.
Figure IV-5: Relationship between Jnr and % Chip Seal Bleeding for Fine Gradation with
Low EAR
0%
10%
20%
30%
40%
50%
60%
0.5 2 5
% B
leed
ing
Jnr(kPa-1)
Fine Gradation with 30% Air Void Filled
CRS-2
CRS-2L
CRS-2P
0%
10%
20%
30%
40%
50%
60%
70%
80%
0.5 2 5
% B
leed
ing
Jnr(kPa-1)
Coarse Gradation with 30% Air Void Filled
CRS-2
CRS-2L
CRS-2P
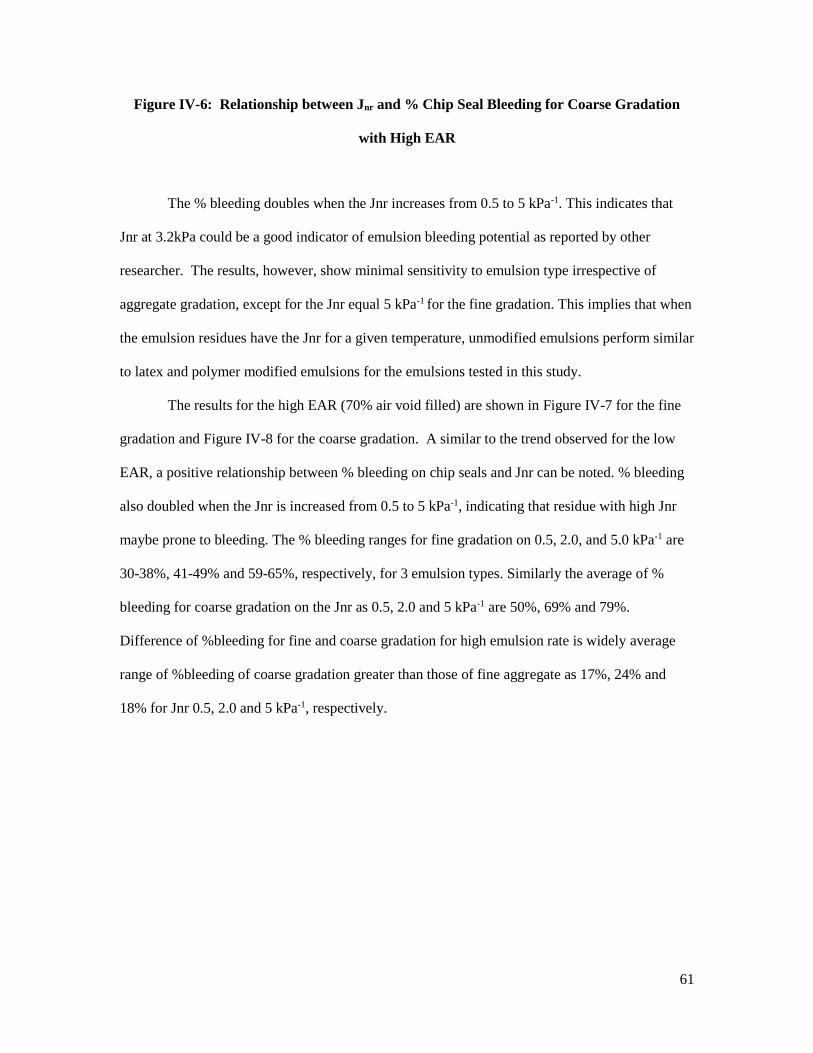
61
Figure IV-6: Relationship between Jnr and % Chip Seal Bleeding for Coarse Gradation
with High EAR
The % bleeding doubles when the Jnr increases from 0.5 to 5 kPa-1. This indicates that
Jnr at 3.2kPa could be a good indicator of emulsion bleeding potential as reported by other
researcher. The results, however, show minimal sensitivity to emulsion type irrespective of
aggregate gradation, except for the Jnr equal 5 kPa-1 for the fine gradation. This implies that when
the emulsion residues have the Jnr for a given temperature, unmodified emulsions perform similar
to latex and polymer modified emulsions for the emulsions tested in this study.
The results for the high EAR (70% air void filled) are shown in Figure IV-7 for the fine
gradation and Figure IV-8 for the coarse gradation. A similar to the trend observed for the low
EAR, a positive relationship between % bleeding on chip seals and Jnr can be noted. % bleeding
also doubled when the Jnr is increased from 0.5 to 5 kPa-1, indicating that residue with high Jnr
maybe prone to bleeding. The % bleeding ranges for fine gradation on 0.5, 2.0, and 5.0 kPa-1 are
30-38%, 41-49% and 59-65%, respectively, for 3 emulsion types. Similarly the average of %
bleeding for coarse gradation on the Jnr as 0.5, 2.0 and 5 kPa-1 are 50%, 69% and 79%.
Difference of %bleeding for fine and coarse gradation for high emulsion rate is widely average
range of %bleeding of coarse gradation greater than those of fine aggregate as 17%, 24% and
18% for Jnr 0.5, 2.0 and 5 kPa-1, respectively.

62
Figure IV-7: Relationship between Jnr and % Chip Seal Bleeding for the High EAR with
the Fine gradation.
Figure IV-8: Relationship between Jnr and % Chip Seal Bleeding for the High EAR with
the Coarse Aggregate
0%
10%
20%
30%
40%
50%
60%
70%
80%
0.5 2 5
% B
leed
ing
Jnr (kPa-1)
Fine Gradation and High EAR (70% void filled)
CRS-2
CRS-2L
CRS-2P
0%
10%
20%
30%
40%
50%
60%
70%
80%
90%
0.5 2 5
% B
leed
ing
Jnr (kPa-1)
Coarse Gradation and High EAR (70% void filled)
CRS-2
CRS-2L
CRS-2P

63
The results for the high EAR also show less sensitivity to emulsion types, showing no
difference between modified and unmodified emulsions. These results indicate that Jnr can control
% bleeding for all emulsion even modified asphalt emulsion. Therefore, the modification for
emulsion does not influence to change % bleeding in the same Jnr. However, the experiment was
controlled by Jnr which make different temperature in the same Jnr in each emulsion type. The
modified asphalt emulsion gives higher temperature than unmodified asphalt emulsion for each
Jnr. Manifestly, if chip seals with different emulsions are tested in the same temperature, %
bleeding for modified asphalt emulsion should have been less than that for unmodified asphalt
emulsion. Furthermore one obviously shown in results is that coarse gradation gives more %
bleeding than fine aggregate in all conditions. Due to the aggregate used, coarse aggregate
fundamentally has more angular than fine aggregate which cause less uniformity of chip spread.
This can lead to more stress concentration on contact area. This assumption can respond by the
results shown above.
As summary of all the results at all factors evaluated are presented in Figure IV-9. All
high emulsion application rate shows higher % bleeding than low emulsion application rate which
chip seals with low emulsion application rate has the % bleeding in range of 21%-70% while chip
seals with high emulsion rate has the % bleeding in range of 30%-81%. Also, the different value
of % bleeding for chip seals with high emulsion application rate is higher than those with low
emulsion application rate in range of 1%-29%.
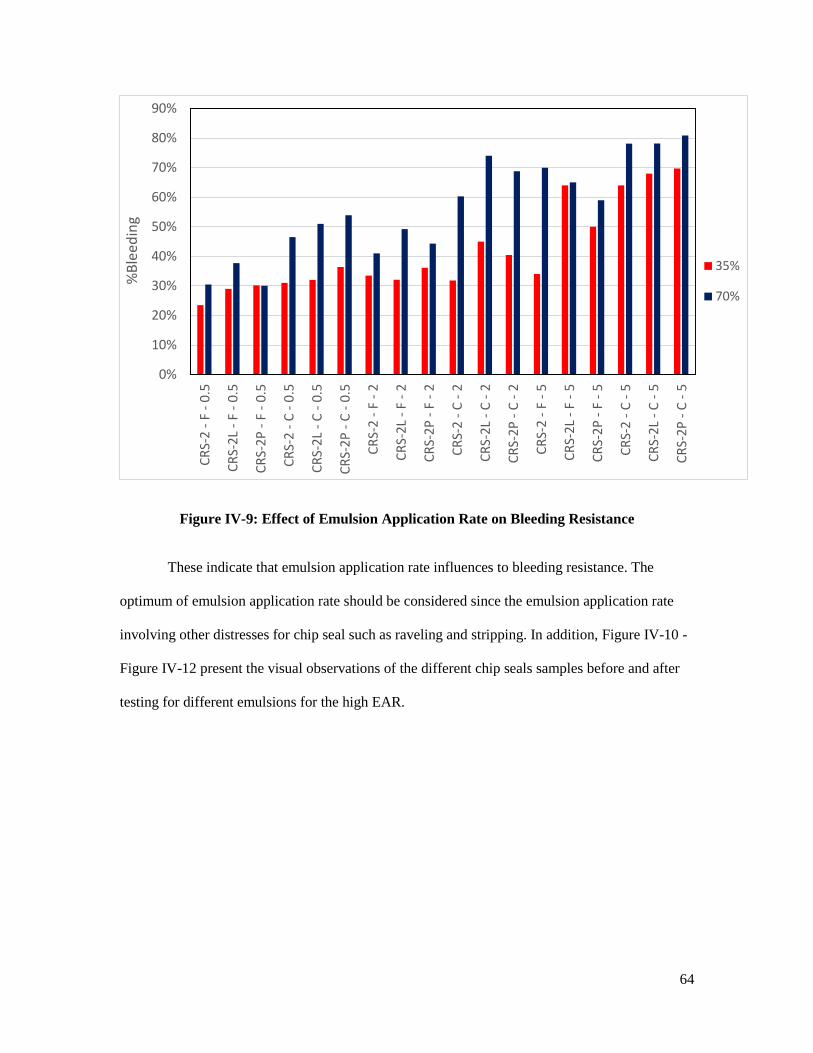
64
Figure IV-9: Effect of Emulsion Application Rate on Bleeding Resistance
These indicate that emulsion application rate influences to bleeding resistance. The
optimum of emulsion application rate should be considered since the emulsion application rate
involving other distresses for chip seal such as raveling and stripping. In addition, Figure IV-10 -
Figure IV-12 present the visual observations of the different chip seals samples before and after
testing for different emulsions for the high EAR.
0%
10%
20%
30%
40%
50%
60%
70%
80%
90%
CR
S-2
- F
- 0
.5
CR
S-2
L -
F -
0.5
CR
S-2
P -
F -
0.5
CR
S-2
- C
- 0
.5
CR
S-2
L -
C -
0.5
CR
S-2
P -
C -
0.5
CR
S-2
- F
- 2
CR
S-2
L -
F -
2
CR
S-2
P -
F -
2
CR
S-2
- C
- 2
CR
S-2
L -
C -
2
CR
S-2
P -
C -
2
CR
S-2
- F
- 5
CR
S-2
L -
F -
5
CR
S-2
P -
F -
5
CR
S-2
- C
- 5
CR
S-2
L -
C -
5
CR
S-2
P -
C -
5
%B
lee
din
g
35%
70%
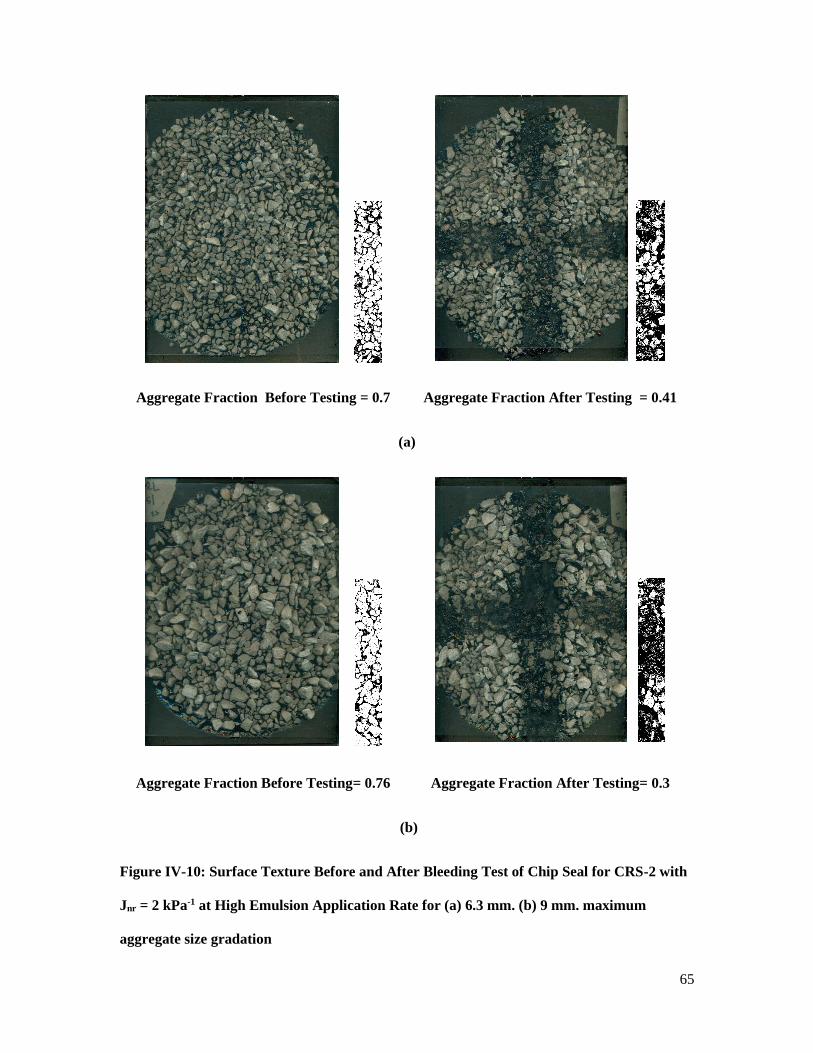
65
Aggregate Fraction Before Testing = 0.7 Aggregate Fraction After Testing = 0.41
(a)
Aggregate Fraction Before Testing= 0.76 Aggregate Fraction After Testing= 0.3
(b)
Figure IV-10: Surface Texture Before and After Bleeding Test of Chip Seal for CRS-2 with
Jnr = 2 kPa-1 at High Emulsion Application Rate for (a) 6.3 mm. (b) 9 mm. maximum
aggregate size gradation

66
Aggregate Fraction= 0.81 Aggregate Fraction = 0.41
(a)
Aggregate Fraction= 0.82 Aggregate Fraction = 0.21
(b)
Figure IV-11: Surface Texture Before and After Bleeding Test of Chip Seal CRS-2L with
Jnr = 2 kPa-1 at High Emulsion Application Rate for (a) 6.3 mm. (b) 9 mm. maximum
aggregate size gradation

67
Aggregate Fraction= 0.78 Aggregate Fraction = 0.44
(a)
Aggregate Fraction= 0.81 Aggregate Fraction = 0.29
(b)
Figure IV-12: Surface Texture Before and After Bleeding Test of Chip Seal CRS-2P with Jnr
= 2 kPa-1 at High Emulsion Application Rate for (a) 6.3 mm. (b) 9 mm. maximum aggregate
size gradation
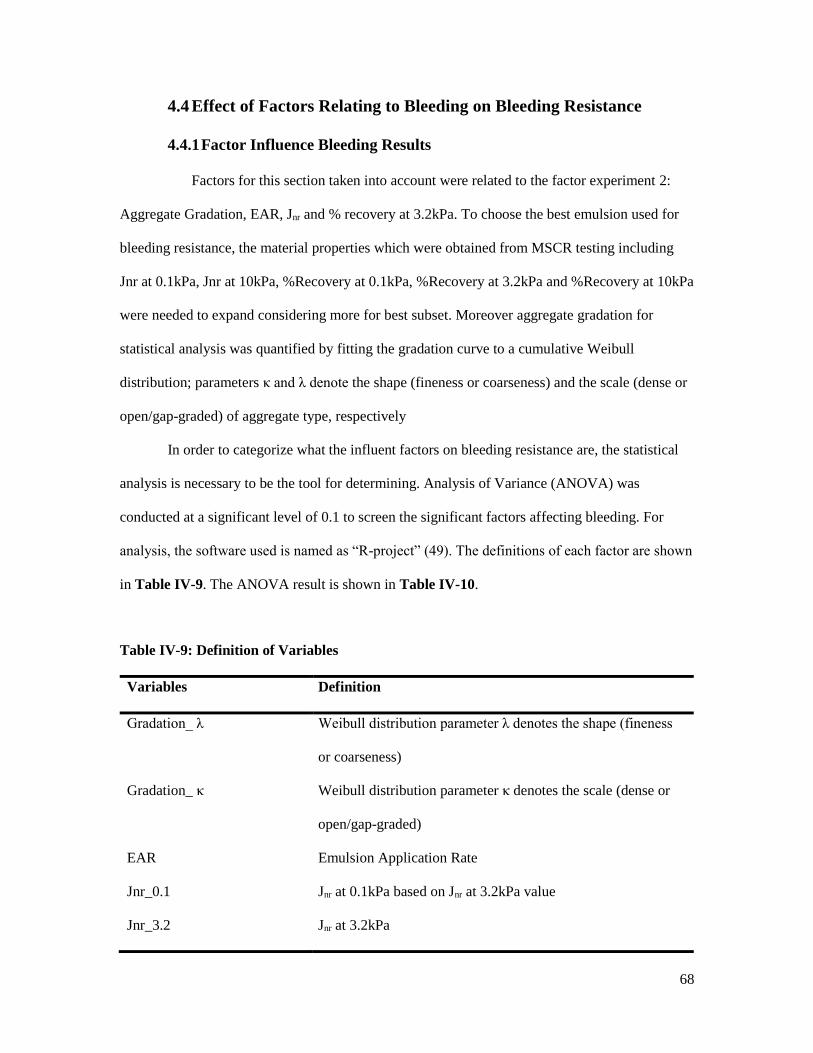
68
4.4 Effect of Factors Relating to Bleeding on Bleeding Resistance
4.4.1 Factor Influence Bleeding Results
Factors for this section taken into account were related to the factor experiment 2:
Aggregate Gradation, EAR, Jnr and % recovery at 3.2kPa. To choose the best emulsion used for
bleeding resistance, the material properties which were obtained from MSCR testing including
Jnr at 0.1kPa, Jnr at 10kPa, %Recovery at 0.1kPa, %Recovery at 3.2kPa and %Recovery at 10kPa
were needed to expand considering more for best subset. Moreover aggregate gradation for
statistical analysis was quantified by fitting the gradation curve to a cumulative Weibull
distribution; parameters κ and λ denote the shape (fineness or coarseness) and the scale (dense or
open/gap-graded) of aggregate type, respectively
In order to categorize what the influent factors on bleeding resistance are, the statistical
analysis is necessary to be the tool for determining. Analysis of Variance (ANOVA) was
conducted at a significant level of 0.1 to screen the significant factors affecting bleeding. For
analysis, the software used is named as “R-project” (49). The definitions of each factor are shown
in Table IV-9. The ANOVA result is shown in Table IV-10.
Table IV-9: Definition of Variables
Variables Definition
Gradation_ λ Weibull distribution parameter λ denotes the shape (fineness
or coarseness)
Gradation_ κ Weibull distribution parameter κ denotes the scale (dense or
open/gap-graded)
EAR Emulsion Application Rate
Jnr_0.1
Jnr_3.2
Jnr at 0.1kPa based on Jnr at 3.2kPa value
Jnr at 3.2kPa

69
Jnr_10
R_0.1
R_3.2
R_10
Jnr at 10kPa based on Jnr at 3.2kPa value
%Recovery at 0.1kPa
%Recovery at 3.2kPa
%Recovery at 10kPa
Table IV-10: ANOVA Table for Bleeding Test
Variables F value Pr(>F) Significance
Gradation_ λ 134.175 <0.001 ***
EAR 128.696 <0.001 ***
Jnr_0.1 272.66 <0.001 ***
Jnr_3.2 82.744 <0.001 ***
Jnr_10 0.493 0.485
R_0.1 4.974 0.029 *
R_3.2 2.97 0.090 .
R_10 1.668 0.201
rep 0.629 0.431
Note: Significance codes—0 ‘***’ 0.001 ‘**’ 0.01 ‘*’ 0.05 ‘.’ 0.1 ‘ ’ 1.
The results presented in Table IV-10 indicate that Gradation_ λ, EAR, Jnr_0.1, Jnr_3.2,
R_0.1 and R_3.2 are statistically significant to bleeding resistance. The significant factors can be
ordered by perceiving F-value, which the F-value of Jnr_0.1, Gradation_ λ, Jnr_3.2, R_0.1 and
R_3.2 are the ordered significant factors on bleeding resistance. Moreover, the result was found
that the replicate was non-significant to the bleeding resistance. This can indicate that the results
are reliable with this test method and repeatable.
4.4.2 Best Subsets Regression
The occurred bleeding is dependent on 6 factors as stated above. However, to design
model for the bleeding resistance, regression analysis should be conducted with 6 factors
dependent. A best-subsets regression was used to identify factors to include in a prediction model
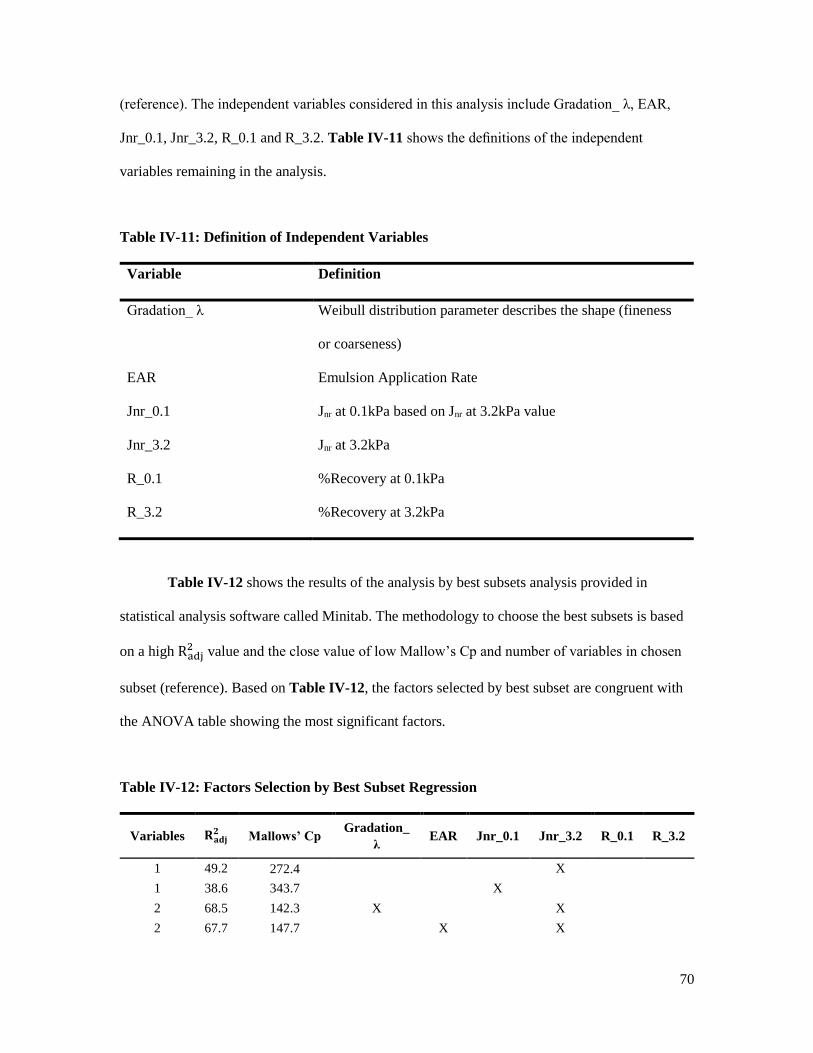
70
(reference). The independent variables considered in this analysis include Gradation_ λ, EAR,
Jnr_0.1, Jnr_3.2, R_0.1 and R_3.2. Table IV-11 shows the definitions of the independent
variables remaining in the analysis.
Table IV-11: Definition of Independent Variables
Variable Definition
Gradation_ λ Weibull distribution parameter describes the shape (fineness
or coarseness)
EAR Emulsion Application Rate
Jnr_0.1
Jnr_3.2
R_0.1
R_3.2
Jnr at 0.1kPa based on Jnr at 3.2kPa value
Jnr at 3.2kPa
%Recovery at 0.1kPa
%Recovery at 3.2kPa
Table IV-12 shows the results of the analysis by best subsets analysis provided in
statistical analysis software called Minitab. The methodology to choose the best subsets is based
on a high Radj2 value and the close value of low Mallow’s Cp and number of variables in chosen
subset (reference). Based on Table IV-12, the factors selected by best subset are congruent with
the ANOVA table showing the most significant factors.
Table IV-12: Factors Selection by Best Subset Regression
Variables 𝐑𝐚𝐝𝐣𝟐 Mallows’ Cp
Gradation_
λ EAR Jnr_0.1 Jnr_3.2 R_0.1 R_3.2
1 49.2 272.4 X
1 38.6 343.7 X
2 68.5 142.3 X X
2 67.7 147.7 X X

71
3 87.5 17.7 X X X
3 76.5 89 X X X
4 89.5 5.1 X X X X
4 88.8 9.6 X X X X
5 89.7 5.3 X X X X X
5 89.5 6.3 X X X X X
6 89.6 7 X X X X X X
Using the subset outlined in Table IV-12, a quantitative prediction model is defined as
shown in equation below.
%Bleeding = - 0.124 + 0.0316 Gradation_ λ + 0.410 EAR + 0.0628 Jnr_3.2
, 𝑅𝑎𝑑𝑗2 = 87.5% IV-1
where, Bleeding = Estimated percent coated aggregates by total area
Gradation_ λ = Weibull distribution parameter describes the shape (fineness or
coarseness)
EAR = Emulsion Application Rate
Jnr_3.2 = Jnr at 3.2kPa
In the best subset the parameters which are involved in the regression equation are
Gradation_ λ, EAR and Jnr_3.2. The fact that selected this subset because the good correlation of
Jnr and %recovery was observed (see in Appendix). Also, it is very hard to control Jnr and
%recovery at the same time. This result shows that bleeding is high when Gradation_ λ, EAR and
Jnr_3.2 is low. The coefficient for each factors show that the most significant factor to occur
bleeding is EAR as it is 0.410. Jnr_3.2 and Gradation_ λ are the second and third priority concern
for selecting to bleeding resistance. Therefore in order to select the appropriate factors for
preventing bleeding on chip seal, in terms of EAR selection should be low but need to consistent
to the limit of the guideline. Aggregate gradation should be fine gradation. For the binder, the
equation shows lower Jnr_3.2 are recommended for selection. Because lower temperature for

72
MSCR test would obtain lower Jnr at 3.2 kPa; therefore, to select the binder, practitioner should
test MSCR at lower temperature to see the values of Jnr at 3.2 kPa.
As stated in Chapter 3, to verify the equation for the bleeding resistance, null tests were
necessary to be carried out in the LWT test. For the null experiments, the emulsions and
aggregate were selected different from the experiment 1 and 2. The aggregate for this experiment
was limestone with 23% LA abrasion and 90% fractured face. The null experiments matrix is
shown in Table IV-13.
Table IV-13: Null Experiments for Verifying the Best Subsets for Bleeding Resistance
Factors Levels Description Parameter Measured
Emulsions 2 HFRS-2, HFRS-2P
% Area with
Bleeding
Emulsion
application rate
2 %void filled= 70%
Temperature 2 [email protected] kPa - 2.0 ,5.0
Replicate 2 2
Total Tests 16 16
*Denotes that standard procedure was modified for research.
The results show the values from the equation are consistent to the value from the
imaging analysis as shown in Table IV-14. This indicates that all factors in regression analysis
significantly affect bleeding resistance.
Table IV-14: Comparison % Bleeding between Imaging Analysis and Regression Analysis
Jnr at 3.2
kPa (kPa-1)
Emulsion
Application Rate
HFRS-2 HFRS-2P
Imaging
analysis
Regression
Analysis
Imaging
analysis
Regression
Analysis
2 35% 49% 47% 55% 54%
70% 69% 61% 75% 68%
5 35% 67% 67% 76% 78%
70% 85% 81% 87% 92%
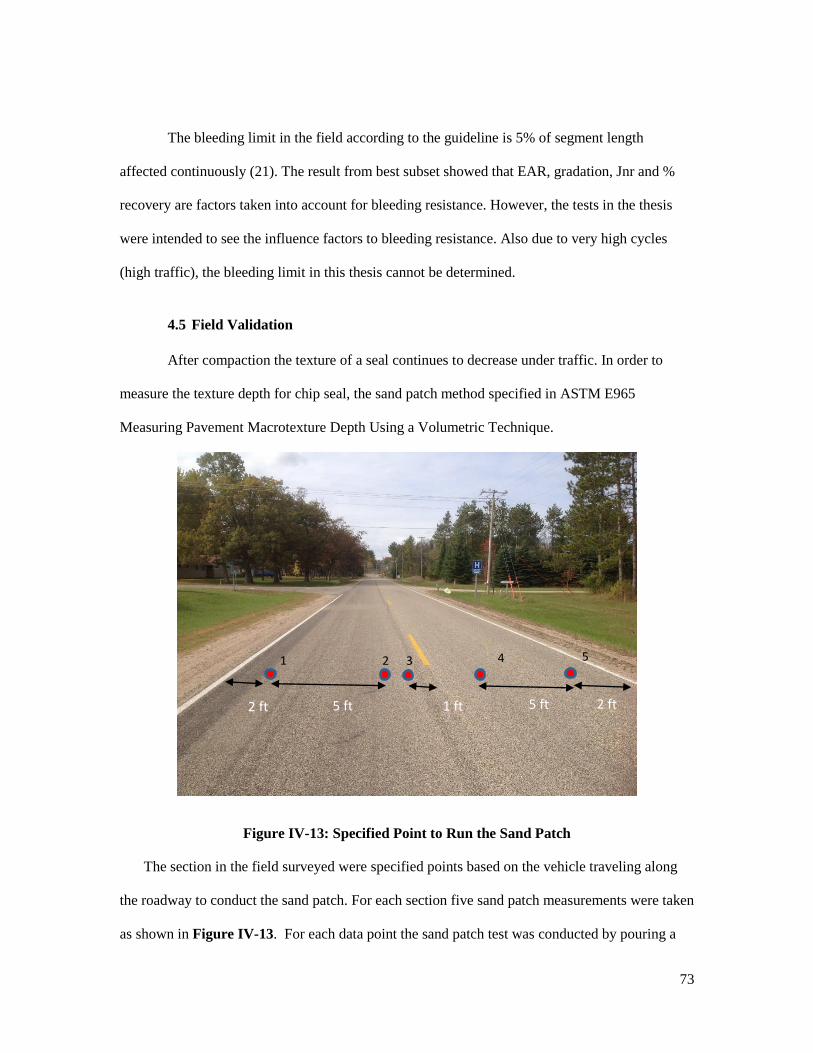
73
The bleeding limit in the field according to the guideline is 5% of segment length
affected continuously (21). The result from best subset showed that EAR, gradation, Jnr and %
recovery are factors taken into account for bleeding resistance. However, the tests in the thesis
were intended to see the influence factors to bleeding resistance. Also due to very high cycles
(high traffic), the bleeding limit in this thesis cannot be determined.
4.5 Field Validation
After compaction the texture of a seal continues to decrease under traffic. In order to
measure the texture depth for chip seal, the sand patch method specified in ASTM E965
Measuring Pavement Macrotexture Depth Using a Volumetric Technique.
Figure IV-13: Specified Point to Run the Sand Patch
The section in the field surveyed were specified points based on the vehicle traveling along
the roadway to conduct the sand patch. For each section five sand patch measurements were taken
as shown in Figure IV-13. For each data point the sand patch test was conducted by pouring a
1
5 ft 2 ft 1 ft
1 2 3 4 5
2 ft 5 ft

74
volume of 100 mL of Ottawa Sand on the chip seal surface and spreading it radially by use of a
rubber disk such that the sand filled the voids in the chip seal surface. The diameter of the circle
was measured and used to calculate the mean texture depth based on the equation provided
previously. Results are presented in Table IV-15.
Table IV-15: Mean Texture Depth at points after placed 2 months
Locations EAR
(gal/yd)
46C
Mean Texture Depth (mm)
Point 1 and
5
Point 2 and
4
Point
3
Waushara County 0.38 0.57 2.24 2.26 2.56
Rock County 0.38 1.15 1.96 1.94 2.20
Juneau County 0.32 0.11 2.92 2.75 2.69
Theoretically, a surface with higher mean texture depth has higher surface texture more
roughness than that with lower texture depth. The results indicate that the different mean texture
depth at similar locations is relatively close across all sites with differences in mean texture depth
ranging from 0.02-0.4 mm.
(a) (b)
Figure IV-14: Localized Severe Distresses: (a) Bleeding at Waushara County (b)
Intersection Bleeding at Rock County
These values were consistent to the distresses observed in the field as shown in Figure
IV-14. The bleeding were occurred in the place of low texture. Also, bleeding can be observed by

75
the amount of emulsion application rate (EAR) applied for each site. The EAR in Rock and
Waukesha were applied higher than that in Juneau County. These results were consistency to the
result in the lab, which the bleeding would be high at the higher EAR.
Figure IV-15: The relationship between Creep Compliance (Jnr) at 3.2kPa at 46˚C and
Mean Texture Depth
Another point is that Jnr at 3.2kPa at 46˚C are consistent to the mean texture depth which
more texture depth is observed at lower Jnr. Since the texture depth and bleeding performance are
good correlated. Therefore the results from the field and the results from the lab are consistent
related to the bleeding performance.
4.6 Other Rheological Properties
The indirect way to occur the bleeding is the dislodgement of chip seal, when there are no
chips cover the surface the vehicle can easily expose the asphalt emulsion. To select the proper
binder for preventing the distress in chip seal, other rheological properties need to perform. The
test method to evaluate raveling potential: the LAS test specified in AASHTO 101-12 to evaluate
the strain sensitivity of the binder at intermediate temperatures.
0
0.5
1
1.5
2
2.5
3
0 0.2 0.4 0.6 0.8 1 1.2 1.4
Mea
n T
extu
re D
epth
(m
m)
[email protected] at 46C (kPa-1)
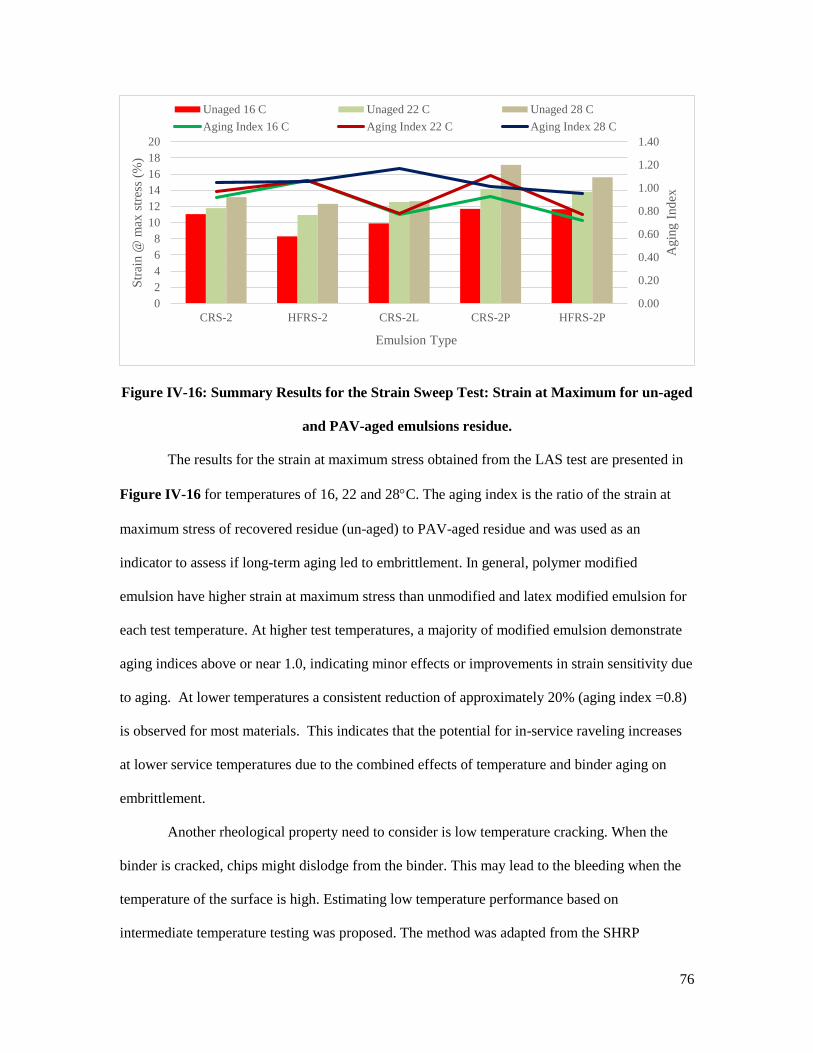
76
Figure IV-16: Summary Results for the Strain Sweep Test: Strain at Maximum for un-aged
and PAV-aged emulsions residue.
The results for the strain at maximum stress obtained from the LAS test are presented in
Figure IV-16 for temperatures of 16, 22 and 28C. The aging index is the ratio of the strain at
maximum stress of recovered residue (un-aged) to PAV-aged residue and was used as an
indicator to assess if long-term aging led to embrittlement. In general, polymer modified
emulsion have higher strain at maximum stress than unmodified and latex modified emulsion for
each test temperature. At higher test temperatures, a majority of modified emulsion demonstrate
aging indices above or near 1.0, indicating minor effects or improvements in strain sensitivity due
to aging. At lower temperatures a consistent reduction of approximately 20% (aging index =0.8)
is observed for most materials. This indicates that the potential for in-service raveling increases
at lower service temperatures due to the combined effects of temperature and binder aging on
embrittlement.
Another rheological property need to consider is low temperature cracking. When the
binder is cracked, chips might dislodge from the binder. This may lead to the bleeding when the
temperature of the surface is high. Estimating low temperature performance based on
intermediate temperature testing was proposed. The method was adapted from the SHRP
0.00
0.20
0.40
0.60
0.80
1.00
1.20
1.40
0
2
4
6
8
10
12
14
16
18
20
CRS-2 HFRS-2 CRS-2L CRS-2P HFRS-2P
Agin
g I
nd
ex
Str
ain @
max
str
ess
(%)
Emulsion Type
Unaged 16 C Unaged 22 C Unaged 28 C
Aging Index 16 C Aging Index 22 C Aging Index 28 C

77
program, in which it was stated that shear parameters (|G*| and δ) measured at intermediate
temperatures can be used to estimate flexural creep (S and m) at low temperatures. The
estimation requires conversion from shear to flexural creep properties and development of shift
factors to account for the differences in testing temperature. The test involves a frequency sweep
conducted at 5°C, 10°C, and 15°C at a frequency range of 1 – 100 rad/s and a strain of 1%.
Current hot applied binder specifications use the bending beam rheometer at a loading
time of 60 seconds and a test temperature of 10°C above the service. Specification limits for
S(60) and m(60) are a maximum of 300 MPa and minimum m-value of 0.30. The results from
the low temperature frequency sweep were used to calculate estimated S (60) and m (60) at
estimated BBR temperature of -6, -12 and -18C. The results for chip seal emulsion are
presented in Figure IV-17 and Figure IV-18 for estimated m (60) and S (60) respectively.
The results show that m-value for all emulsions meet the specification at -12°C which the
order of highest to lowest m-value are CRS-2, HFRS-2, CRS-2P, CRS-2L and HFRS-2P,
respectively. Also, the stiffness results presented show all emulsions except HFRS-2P meeting
specification at -18 °C. This indicate that the modified polymer and latex are less tolerance to the
low temperature cracking.
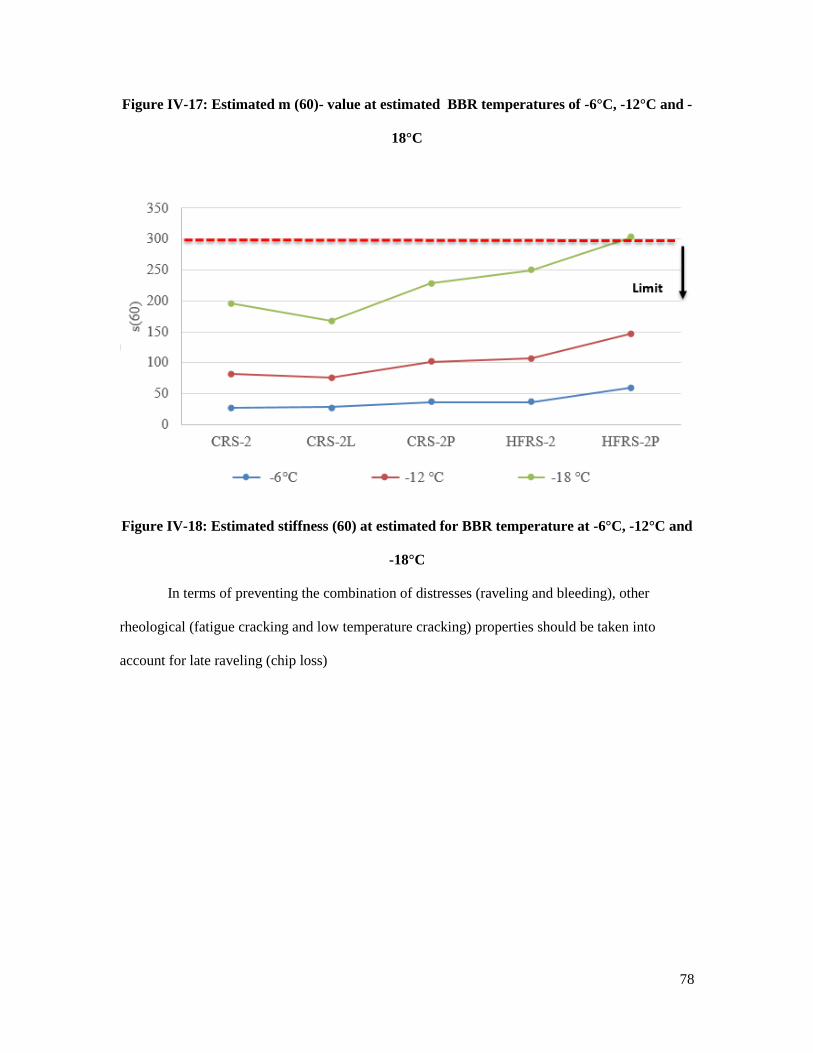
78
Figure IV-17: Estimated m (60)- value at estimated BBR temperatures of -6°C, -12°C and -
18°C
Figure IV-18: Estimated stiffness (60) at estimated for BBR temperature at -6°C, -12°C and
-18°C
In terms of preventing the combination of distresses (raveling and bleeding), other
rheological (fatigue cracking and low temperature cracking) properties should be taken into
account for late raveling (chip loss)
79
V. CHAPTER 5: CONCLUSIONS AND RECOMMENDATIONS
This study summarizes the development of a modified Loaded Wheel Tracking Test to
assess bleeding in chip seals and investigates correlation between bleeding and emulsion residue
performance properties. Based on results of this work the following conclusions and
recommendations are stated:
1. The MSCR test is a promising evaluation tool for emulsion residue bleeding performance
as it proved capable of differentiating between emulsion chemistries and modification in
terms of sensitivity to both temperature and stress. As a result it has potential to identify
materials more prone to bleeding due to softening related to temperature or stress.
2. The modified LWT test method is capable of quantifying bleeding potential and bleeding
development with loading cycles. This study presents modifications to the current test
device and a new analysis method to measure bleeding. Specifically by introducing a
system to control test temperature and application of image analysis to quantify changes
in surface composition.
3. A good relationship exists between texture loss and % bleeding. However, this cannot
account for all of the conditions for chip seal since the test in experiment 1 was set
emulsion application rate and aggregate gradation constant.
4. Preliminary results shown indicate the temperature, loading cycle, and contact stress are
significant to % bleeding.
5. Results presented indicate the emulsion application rate, aggregate gradation, Jnr at
3.2kPa are the significant factors to the exposure of bleeding which the priorities for
concerning are emulsion application rate, aggregate gradation and Jnr at 3.2kPa,
respectively.
80
6. Other rheological properties (fatigue cracking and low temperature cracking) should be
considered for the late raveling (chip loss).
7. Further research is needed related to development of proper sample preparation
guidelines for evaluation of chip seal bleeding.
8. The type of chip seal determined in this thesis is single chip seal which works with the
methodology for quantifying the bleeding. However, other types of chip seal need to be
quantified in order to confirm this methodology.
9. Opportunities exist to further develop the LWT test to better assess the effects of traffic
loading and stress on bleeding by further modifying the equipment to include a variable
speed motor and varying the load applied to the tire.
81
VI REFERENCES
1. A Basic Asphalt Emulsion Manual. Manual Series No. 19. Asphalt Institute, Lexington,
Ky., 2008.
2. Ksaibati, K., M. Cole, and M. Farrar. Evaluation of Surface Treatment Practices in
United States. In Transportation Research Record 1545, TRB, National Research
Council, Washington, D.C., 1996, pp. 26–34.
3. Gransburg, D. D. Chip Seal Program Excellence in the United States. In Transportation
Research Record: Journal of the Transportation Research Board, No. 1933,
Transportation Research Board of the National Academies, Washington, D.C., 2005, pp.
72–82.
4. Standard Test Method for Sweep Test of Bituminous Emulsion Surface Treatment
Samples. ASTM Standard D7000. ASTM International, West Conshohocken, Pa. 2008.
www.astm.org. Accessed Aug. 6, 2009.
5. AASHTO. Standard Method of Test for Multiple Stress Creep Recovery (MSCR) Test of
Asphalt Binder Using a Dynamic Shear Rheometer (DSR). AASHTO TP-70: Standard
Specifications for Transportation Materials and Methods of Sampling and Testing,
Washington, DC, 2009.
6. Hanz, A., Johannes, P. and H. U. Bahia. Development of Emulsion Residue Testing
Framework for Improved Chip Seal Performance. In Transportation Research Record:
Journal of the Transportation Research Board, No. 2293, Transportation Research Board
of the National Academies, Washington, D.C., 2012, pp. 106-113.
7. Kim, Y. R., S. Lee, 2007. Performance-Based Analysis of Polymer-Modified Emulsions
in Asphalt Surface Treatments. Final Report to NCDOT, FHWA/NC/2007-06.
8. Standard Test Method for Standard Practice for Design, Testing, and Construction of
Micro-Surfacing. ASTM Standard D6372. ASTM International, West Conshohocken, Pa.
2008. www.astm.org. Accessed Aug. 27, 2013.
9. Johannes, P., Mahmoud, E., and H. U. Bahia. Sensitivity of ASTM D7000 Sweep Test to
Emulsion Application Rate and Aggregate Gradation. In Transportation Research
Record: Journal of the Transportation Research Board, No. 2235, Transportation
Research Board of the National Academies, Washington, D.C., 2011, pp. 95–102.
10. Miller, T. D., Z. A. Arega, and H. U. Bahia. Correlating Rheological and Bond Properties
of Emulsion to Aggregate Retention of Chip Seals. In Transportation Research Record:
Journal of the Transportation Research Board, No. 2179, Transportation Research Board
of the National Academies, Washington, D.C., 2010, pp. 66–74.
11. Colas Solutions, Inc. Surface Defects.
http://www.colassolutions.com/solutions/defects.html. Accessed November 17, 2011.

82
12. Shuler, S., P. S. Khandal, and M. Stroup-Gardiner. Flexible Pavement Rehabilitation and
Maintenance: Design and Construction of Chip Seals for High Traffic Volumes. 1998, p.
98.
13. Moraes, R., R. Velasquez, and H. U. Bahia. Measuring the Effect of Moisture on
Asphalt–Aggregate Bond with the Bitumen Bond Strength Test. In Transportation
Research Record: Journal of the Transportation Research Board, No. 2209,
Transportation Research Board of the National Academies, Washington, D.C., 2011, pp.
70–81.
14. AEMA. 2004. Recommended Performance Guidelines. (Third ed.)
15. N. Roohi, L. Tashman and H. U. Bahia, "Internal Structure Characterization of Asphalt
Mixtures for Rutting Performance Using Imaging Analysis," Road Materials and
Pavement Design, vol. 13, pp. 21-37, 2012.
16. Vavrik, W., G. Huber, W. Pine, S. Carpenter, and R. Bailey. Bailey Method for
Gradation Selection in HMA Mix Design. Transportation Research Number E-C044,
Transportation Research Board, National Research Council, Washington, D.C., 2004.
17. Maintenance Technical Advisory Guide, Office of Pavement Preservation, Division of
Maintenance, California Department of Transportation, Sacramento, 2003.
18. 2003 Standard Specifications for Construction, Section 508, Chip Seals, Michigan
Department of Transportation, Lansing, 2003, 268 pp.
19. Minnesota Seal Coat Handbook, MD/RD-98, Minnesota Department of Transportation,
Maplewood, 1998.
20. Hinkle, A.H., “Maintenance of Gravel and Stone Roads, Especially Surface Treatments,”
Highway Research Board Proceedings, Vol. 7, Part II, 1928, pp. 270–273.
21. Gransberg, D. and James, D.M.B., NCHRP synthesis 342: Chip Seal Best Practices,
Transportation Research Board, National Research Council, Washington, D.C., 2005.
22. Peshkin, D.G., K.D. Smith, K.A. Zimmerman, and D.N. Geoffroy, Pavement Preventive
Maintenance, Draft Reference Manual, Federal Highway Administration/National
Highway Institute, Washington, D.C., 1999.
23. Pavement Preservation: A Strategic Plan for the Future, Report FHWA-SA-99-015,
Federal Highway Administration, Washington, D.C., 1999.
24. Salomon, D.R. Asphalt Emulsion Technology. Transportation Research Circular Number
E-C102, Transportation Research Board, National Research Council, Washington, D.C.,
2006, p.4-7.
25. McHattie, R.L., Asphalt Surface Treatment Guide. FHWA-AK-RD-01-03, Transportation
and Public Facilities State of Alaska, 2001.
83
26. Shuler, S., “Chip Seals for High Traffic Pavements,” Transportation Research Record
1259, Transportation Research Board, National Research Council, Washington, D.C.,
1990, pp. 24–34.
27. Wegman, S., Design and Construction of Seal Coats, Final Report, Minnesota
Department of Transportation, Mendota Heights, 1991, 34 pp.
28. AASHTO Standard Method of Test for Float Test for Bituminous Materials, AASHTO
T50-09, American Association of State and Highway Transportation Officials, 2009.
29. Standard Method of Test for Float Test for Bituminous Materials, ASTM D139-12.
ASTM International, West Conshohocken, Pa. 2008. www.astm.org. Accessed Dec. 1,
2012.
30. The NZ Transport Agency, Chipsealing in New Zealand, Transit New Zealand, Road
Controlling Authorities & Roading New Zealand, 2005.
31. Roque, R., M. Thompson, and D. Anderson. Bituminous Seal Coats: Design,
Performance Measurements and Performance Prediction. Transportation Research
Record 1300, Transportation Research Board, National Research Council, Washington,
D.C., 1991, pp. 90-97.
32. Jackson, D., N. Jackson, and J. Mahoney. Washington State Chip Seal Study.
Transportation Research Record, No. 1259, Transportation Research Board, National
Research Council, Washington, D.C., 1990, pp. 1-10.
33. Lawson, W. D., M. Leaverton, and S. Senadheera. Maintenance Solutions for Bleeding
and Flushed Pavements Surfaced with a Seal Coat or Surface Treatment. Texas
Department of Transportation Research and Technology Implementation Office, Report
0-5230-1, 2007.
34. Kim, Y. R. and J. Lee. 2005. Optimizing Gradations for Surface Treatments. Final Report
to North Carolina Department of Transportation (NCDOT).
35. Lee, S. 2004. Long-Term Performance Assessment of Asphalt Concrete Pavements Using
the Third Scale Model Mobile Loading Simulator and Fiber Reinforced Asphalt
Concrete. Ph.D. dissertation, North Carolina State University.
36. McLeod, N.W., “A General Method of Design for Seal Coats and Surface Treatments,”
Proceedings of the Association of Asphalt Paving Technologists, Vol. 38, St. Paul, Minn.,
1969, 128 pp.
37. Hanson, F.M., “Bituminous Surface Treatment of Rural Highways,” Proceedings, New
Zealand Society of Civil Engineers, Vol. 21, 1934/35, 89 pp.
38. Janisch, D.W. and F.S. Gaillard, Minnesota Seal Coat Handbook, MN/RC-1999-07,
Minnesota Department of Transportation, Office of Minnesota Road Research,
Maplewood, 1998, 112 pp.

84
39. Lee, J. and Y. R. Kim. 2008. Understanding the Effects of Aggregate and Emulsion
Application Rates on the Performance of Asphalt Surface Treatments. Transportation
Research Record: Journal of the Transportation Research Board 1, No. 2044.
Transportation Research Board of the National Academies, Washington, D.C., pp. 71–78.
40. Standard Test Method for Determining the Percentage of Fractured Particles in Coarse
Aggregate, ASTM D 5821. ASTM International, West Conshohocken, Pa. 2008.
www.astm.org. Accessed Dec. 1, 2013.
41. AASHTO Standard Specification for Performance-Graded Asphalt Binder Using
Multiple Stress Creep Recovery (MSCR) Test - Revision 1, AASHTO TP19, American
Association of State and Highway Transportation Officials, 2010.
42. Standard Practice for Recovering Residue from Emulsified Asphalt Using Low
Temperature Evaporative Technique, ASTM D7497. ASTM International, West
Conshohocken, Pa. 2008. www.astm.org. Accessed Jan. 1, 2009.
43. http://www.mastrad.com/lwt.htm
44. Standard Test Method for Measuring Pavement Macrotexture Depth Using a Volumetric
Technique, ASTM E965. ASTM International, West Conshohocken, Pa. 2008.
www.astm.org. Accessed Nov. 10, 1996.
45. Transportation Research Board Characteristics of Bituminous Materials Committee.
Asphalt Emulsion Technology Review of Asphalt Residue Procedures. Transportation
Research Circular Number E-C122, Transportation Research Board, National Research
Council, Washington, D.C., 2007.
46. Hanz, A., Z. Arega, and H. U. Bahia. Rheological Behavior of Emulsion Residues
Produced by Evaporative Recovery Method. Transportation Research Record: Journal of
the Transportation Research Board, No. 2179, Transportation Research Board of the
National Academies, Washington, D.C., 2010, pp. 102–108.
47. Novak, M., Birgisson, B., and Roque, R. Three-Dimensional Finite Element Analysis of
Measured Tire Contact Stresses and Their Effects on Instability Rutting of Asphalt
Mixture Pavement. Transportation Research Record: Journal of the Transportation
Research Board, No. 1893, Transportation Research Board of the National Academies,
Washington, D.C., 2003, pp. 150–156.
48. AASHTO Standard Method of Test for Estimating Fatigue Resistance of Asphalt Binders
Using the Linear Amplitude Sweep, AASHTO 101-12, American Association of State
and Highway Transportation Officials, 2012.
49. Venables, W. N., D. M. Smith, and the R Development Core Team. An Introduction to R.
Version 2.9.2, 2009.
50. Bal, G., J. Patric, R. Stevenson, and P. Herringtong. (1999). “Assesment of Temperature-
Sensitive Bitumen for Chipsealing on New Zealand roads”. Research Report No. 154.
Transfund New Zealand Roads, Wellington, New Zealand.

85
51. Transit New Zealand (2005), Chip sealing in New Zealand, Transit New Zealand
Wellington, New Zealand, 2005.
52. SANRAL (TRH3 National Roads Agency Limited) (2007), Design and Construction of
Surfacing Seal, Technical Recommendations for Highways, TRH3. Pretoria, 2007.
53. Shuler, S., Lord, A., Epps-Martin, A.,NCHRP report 680, Manual for Emulsion-Based
Chip Seals for Pavement Preservation, Transportation Research Board, National
Research Council, Washington, D.C., 2005.
54. Seal Coat and Surface Treatment Manual, Texas Department of Transportation, Austin,
2003.
55. Senadheera, S.P. and J.R. Khan, “Standardized Seal Coat Terminology Pamphlet”
TxDOT Research Implementation Study Number 5-1787, Center For Multidisciplinary
Research in Transportation, Texas Tech University, Lubbock, 2001, p. 4.
56. Asphalt Surface Treatments—Construction Techniques, Educational Series No. 12 (ES-
12), Asphalt Institute, Lexington, Ky., 1988, 28 pp.
57. Barcena, R., A. E. Martin, and D. Hazlett. Performance-Graded Binder Specification for
Surface Treatments. In Transportation Research Record: Journal of the Transportation
Research Board, No. 1810, Transportation Research Board of the National Academies,
Washington, D.C., 2002, pp. 63–71.
58. Gransberg, D.D., S. Senadheera, and I. Karaca, Analysis of Statewide Seal Coat
Constructability Review, Texas Department of Transportation, Research Report TX-98/0-
1787-1R, Texas Tech University, Lubbock, 1998.

86
APPENDIX A
Jnr and % Recovery
Emulsions Test Temperature (˚C) Stress Level (kPa) Jnr (kPa-1) % Recovery
Average Average
CRS-2
46 0.1 0.515 9.93
3.2 0.565 4.92
10 0.654 1.12
58 0.1 3.31 0.15
3.2 3.82 3.77
10 4.32 4.85
64 0.1 7.50 1.91
3.2 8.75 5.75
10 9.96 7.08
CRS-2L
46 0.1 0.35 29.04
3.2 0.41 20.43
10 0.52 10.22
58 0.1 2.05 26.21
3.2 3.09 5.45
10 3.94 1.58
64 0.1 3.87 26.18
3.2 6.62 0.52
10 8.53 5.22
CRS-2P
46 0.1 0.22 47.92
3.2 0.25 42.67
10 0.33 29.77
58 0.1 1.35 34.88
3.2 2.02 15.02
10 2.73 2.59
64 0.1 3.31 24.36
3.2 5.16 2.54
10 6.77 3.92
HFRS-2
46 0.1 1.07 16.04
3.2 1.45 0.42
10 1.71 3.53
58 0.1 4.28 22.47
3.2 8.46 5.65
10 10.19 6.52

87
Emulsions Test Temperature (˚C) Stress Level (kPa) Jnr (kPa-1) % Recovery
Average Average
HFRS-2P
46 0.1 0.09 45.79
3.2 0.11 34.45
10 0.17 17.94
58 0.1 0.68 44.03
3.2 1.60 4.52
10 2.22 2.13
70 0.1 1.09 65.09
3.2 6.34 2.33
10 8.61 5.20
Correlation among Factors
lamdag~n kgrada~n erate jnr_01 jnr_32 jnr_10 r_01 r_32 r_10
lamdagrada~n 1
kgradation 1 1
erate 0 0 1
jnr_01 0 0 0 1
jnr_32 0 0 0 0.9451 1
jnr_10 0 0 0 0.9135 0.9951 1
r_01 0 0 0 -0.5059 -0.321 -0.2508 1
r_32 0 0 0 -0.6054 -0.6228 -0.6051 0.7592 1
r_10 0 0 0 -0.3624 -0.3928 -0.3903 0.6253 0.9185 1