published by the international institute for sustainable ... by the international institute for...
TRANSCRIPT

© 2008 International Institute for Sustainable Development (IISD) Published by the International Institute for Sustainable Development The International Institute for Sustainable Development contributes to sustainable development by advancing policy recommendations on international trade and investment, economic policy, climate change, measurement and assessment, and natural resources management. Through the Internet, we report on international negotiations and share knowledge gained through collaborative projects with global partners, resulting in more rigorous research, capacity building in developing countries and better dialogue between North and South. IISD’s vision is better living for all—sustainably; its mission is to champion innovation, enabling societies to live sustainably. IISD is registered as a charitable organization in Canada and has 501(c)(3) status in the United States. IISD receives core operating support from the Government of Canada, provided through the Canadian International Development Agency (CIDA), the International Development Research Centre (IDRC) and Environment Canada; and from the Province of Manitoba. The institute receives project funding from numerous governments inside and outside Canada, United Nations agencies, foundations and the priate sector. International Institute for Sustainable Development 161 Portage Avenue East, 6th Floor Winnipeg, Manitoba Canada R3B 0Y4 Tel: +1 (204) 958–7700 Fax: +1 (204) 958–7710
Measuring Knowledge, Attitudes and
Behaviours towards Sustainable
Development: Two Exploratory
Studies
January 2009
Dr. Alex C. Michalos
Institute for Social Research and Evaluation
University of Northern British Columbia
Heather Creech
International Institute for Sustainable Development
Dr. Christina McDonald
Manitoba Education, Citizenship and Youth
P. Maurine Hatch Kahlke
Institute for Social Research and Evaluation
University of Manitoba

i Measuring Knowledge, Attitudes and Behaviours towards Sustainable Development: Two Exploratory Studies
© 2009 International Institute for Sustainable Development (IISD) Published by the International Institute for Sustainable Development The International Institute for Sustainable Development contributes to sustainable development by advancing policy recommendations on international trade and investment, economic policy, climate change, measurement and assessment, and natural resources management. Through the Internet, we report on international negotiations and share knowledge gained through collaborative projects with global partners, resulting in more rigorous research, capacity building in developing countries and better dialogue between North and South. IISD’s vision is better living for all—sustainably; its mission is to champion innovation, enabling societies to live sustainably. IISD is registered as a charitable organization in Canada and has 501(c)(3) status in the United States. IISD receives core operating support from the Government of Canada, provided through the Canadian International Development Agency (CIDA), the International Development Research Centre (IDRC) and Environment Canada; and from the Province of Manitoba. The institute receives project funding from numerous governments inside and outside Canada, United Nations agencies, foundations and the private sector. International Institute for Sustainable Development 161 Portage Avenue East, 6th Floor Winnipeg, Manitoba Canada R3B 0Y4 Tel: +1 (204) 958–7700 Fax: +1 (204) 958–7710 E-mail: [email protected] Web site: http://www.iisd.org/
Dr. Alex C. Michalos Institute for Social Research and Evaluation University of Northern British Columbia Heather Creech International Institute for Sustainable Development Dr. Christina McDonald Manitoba Education, Citizenship and Youth P. Maurine Hatch Kahlke Institute for Social Research January 2009
IISD recognizes the generous support of the Province of Manitoba, through a framework agreement with the Institute, as well as through the province’s Sustainable Development Innovations Fund.
Measuring
Knowledge,
Attitudes and
Behaviours towards
Sustainable
Development: Two
Exploratory Studies

ii Measuring Knowledge, Attitudes and Behaviours towards Sustainable Development: Two Exploratory Studies
Executive Summary
Overview of the project
The overall goal of the Decade for Education for Sustainable Development is to integrate
the values inherent in sustainable development into all aspects of learning to encourage
changes in behaviour that allow for a more sustainable and just society for all.1
Nations have committed to work together from 2005 to 2014 to achieve the goals of the United Nations Decade for Education for Sustainable Development (DESD). Many activities are underway, related to educational policy and programming for formal, non-formal and informal learning. However, a key challenge will be to assess whether in fact changes in behaviour are taking place as an outcome of the integration of sustainable development concepts and values into the learning process. Such changes can best be measured at the local and national levels; but in order to do so, baselines of current knowledge, attitudes and choices need to be established. IISD, Manitoba Education for Citizenship and Youth (MECY), the University of Manitoba and the Institute for Social Research and Evaluation at the University of Northern British Columbia (ISRE) initiated work in 2007 to better understand the current levels of awareness and understanding of sustainable development among Manitoban adults and youth. Our intention was to design, execute and analyze results from two surveys: one, of the general population of Manitoba; and the second, of a cohort of Manitoba students across Grades 6 to 12. Using the baseline data gathered, we then hoped to establish a monitoring framework to assess changes in levels of understanding and behaviours over the next few years among the youth cohort and the general population. Our intention was, with this information, to be better able to assess the effectiveness of province-wide efforts underway during the Decade. With a proven methodology, we then hoped to replicate the process—setting the baseline and establishing a monitoring system—across other jurisdictions, within Canada and possibly internationally.
Methodology
Our starting point was to develop a standardized test of people’s knowledge, attitudes and behaviours concerning the basics of sustainable development. Our first task became that of finding a definitive list of themes or perspectives to be addressed by education for sustainable development, and this task was completed in broad outlines by the authors of the Framework for the UNDESD International
1 UNESCO. Highlights on DESD progress to date. January 2007. www.desd.org/Highlights%20on%20ESD%20progress-%20Jan%202007.pdf, p. 2.

iii Measuring Knowledge, Attitudes and Behaviours towards Sustainable Development: Two Exploratory Studies
Implementation Scheme. The framework lists the following “fifteen strategic perspectives, and the connections between them, [that] must inform education and learning for sustainable development.” These are “socio-cultural perspectives,” including human rights, peace and human security, gender equality, cultural diversity and intercultural understanding, health, HIV/AIDS, governance; “environmental perspectives,” including natural resources (water, energy, agriculture, biodiversity), climate change, rural development, sustainable urbanization, disaster prevention and mitigation; and “economic perspectives” including poverty reduction, corporate responsibility and accountability and market economy.2 Tests of people’s knowledge, attitudes and behaviours concerning sustainable development should reflect the topics included in this list
On the basis of our literature research into a broad range of other survey instruments and public opinion polls in the sustainable development field, we assembled 90 candidate items for the two surveys covering knowledge, attitudes and behaviours more or less indicative of the “fifteen strategic perspectives.” In the first week of November 2007 approximately 160 experts from knowledgeable groups were emailed the list and asked to rank the level of importance of each item for inclusion (or not) on the surveys. The groups included members of the UN Monitoring and Evaluation Expert Group for the DESD, UN Reference Group for the DESD, Canadian National Education for Sustainable Development Expert Council, a network of Education for Sustainable Development contacts of the Council of Ministers of Education, Canada, a network of contacts through the International Institute for Sustainable Development, former participants in the Halifax Higher Education for Sustainability Conference, and participants in the Asia-Pacific DESD Monitoring Project. On the basis of the importance ratings from respondents we made a first cut at reducing the total item pool. Somewhat arbitrarily, but with an eye to parsimony, we decided to aim for scales containing about 15 items. Selecting the top-rated items from the three sets of items, we ended up with 17 items measuring knowledge, and 15 each measuring attitudes and behaviours. In January 2008 the questionnaires were mailed out to a random sample of 5,000 households in the province of Manitoba, and 506 completed questionnaires were returned by the end of February. These formed our working dataset, and we suppose that the ten per cent who responded to our survey had some interest in and perhaps a bias toward sustainable development. Because it was immediately obvious that our sample of respondents was not representative of the total population of the province, we decided to apply weights to the sample to get a better fit. We used education as a weighting variable because we assumed that of all the demographic variables available from the census, it would have the largest impact on the kind of information we were attempting to obtain. At roughly the same time, using a somewhat modified instrument to address reading and comprehension levels of the younger demographic, we collected a “convenience” sample of Manitoba students in Grades
2 UNESCO Education Sector, 2006, Sections 3.1-3.3 (pp.18–20) http://unesdoc.unesco.org/images/0014/001486/148650E.pdf

iv Measuring Knowledge, Attitudes and Behaviours towards Sustainable Development: Two Exploratory Studies
6, 8 and 9 through 12 (inclusive) in three school districts (urban; rural and northern Manitoba). Initially we had hoped to be able to take a random sample of students, but immediately faced the requirements for obtaining permissions from school districts, principals, teachers, parents and students before the surveys could be administered—making it virtually impossible to collect the sample randomly. Four schools in three districts were selected based on the willingness of the superintendents and principals to participate in the exercise. From those students who were surveyed, 294 useable questionnaires were returned, distributed as follows: 40 per cent at the Grade 6 level (correlates approximately to ages 10–12), 43 per cent at Grade 8 (ages 13–14), with the remaining 17 per cent distributed across Grades 9 through 12, with a rough correlation to ages 15–18.
Sample candidate items on both surveys3
On Knowledge:
TRUE/FALSE: Economic development, social development and environmental protection are all
necessary for sustainable development.
On Attitudes:
AGREE/DISAGREE: There is no point in getting involved in environmental issues, since
governments and industries have all the power and can do what they like
On Behaviours:
AGREE/DISAGREE: I have changed my personal lifestyle to reduce waste.
Findings from the Manitoba households survey
Most respondents did very well on our knowledge questions most of the time, suggesting that most Manitobans do have a basic familiarity with and understanding of the term “sustainable development.” Assuming that students who score about 80 per cent or higher on an exam are entitled to an “A” in many schools and universities in Canada, about 50 per cent of our “class” would get an “A” for their overall knowledge of sustainable development. However, while this would be wonderful news for most students, it is a sure sign that for the respondents in our sample, the test was relatively ineffective for discriminating those who know a lot from those who know a little. And yet, an acceptable standardized test should have precisely such discriminating power. So, the survey items testing levels of knowledge do not seem to be very useful for present purposes, in that we would be unable to measure changes in levels of understanding. Thus, the first important lesson learned from our households survey is that we need a set of true/false questions that is more sensitive than our current set in order to distinguish the variety of levels of knowledge of sustainable development (SD) that people have.
3 See Tables at the end of this report for the full surveys.

v Measuring Knowledge, Attitudes and Behaviours towards Sustainable Development: Two Exploratory Studies
Percentages of respondents with favourable attitudes revealed good levels of support towards sustainable development. The highest ranking response related to the importance of education for sustainable development itself, with 98 per cent believing that every girl or boy should receive education that teaches the knowledge, perspectives, values, issues and skills for sustainable living in a community. Surprisingly, though, less than half believed that gender equality had anything to do with sustainable development. We also observed a lower positive response on understanding the role of gender in sustainable development in the knowledge group of questions. This leads us to question, tangentially, why it is difficult for people to see that development that delivers unequal advantages and disadvantages to men and women is not sustainable. Finally, the percentages of respondents reporting behaviours favourable to sustainable development revealed a drop of support. While recycling behaviours measured at over 90 per cent of the response group, other types of actions measured (consumer purchases based on company track records, investment choices, volunteerism, and so forth) returned significantly lower positive responses. Nevertheless, for most questions, over 50 per cent of the respondents were indicating positive choices.
Findings from the Manitoba students survey
The knowledge base of the student response group was not as advanced as that of the household survey group, with only 20 per cent who would get an “A” (demonstrating 80 per cent or higher correct answers across the “exam”). Nevertheless, we were able to see a good progression through the grades—the higher the grade, the more the respondents knew about sustainability. High numbers of correct responses were received in general for questions on water and poverty; fewer correct responses were received on concepts of social justice and cultural diversity, and the role of business in sustainable development. Importantly, we determined that high percentages of our student respondents believed that education for sustainable development involves more than environmental education. A progression in positive attitudes was also observed throughout the grades surveyed. For example, students were asked whether they agreed with the following statement: “It is OK for companies to make products that are designed to be thrown away after one use.”
48 per cent of Grade 6 students thought this was OK
46 per cent of Grade 8 students
Only 22 per cent of Grade 9–12 students agreed with the statement. Across the student groups, the highest positive responses were received for these statements:
Everyone should be taught the knowledge, values, issues and skills for sustainable development
People should get involved in environmental issues.
vi Measuring Knowledge, Attitudes and Behaviours towards Sustainable Development: Two Exploratory Studies
However, while knowledge and attitudes strengthen throughout the grades, nevertheless there is a significant drop in positive behaviours, with some positive behaviours actually regressing through the grade groups. For example, on the question “At home I try to recycle as much as I can”:
57–58 per cent of Grade 6 and Grade 8 students do so
Only 35 per cent of Grade 9–12 student do so.
Conversely, the older the student, the more likely that young person is to pick up litter in a park or natural area:
Only 37–38 per cent of Grade 6 and 8 students stated that they would pick up litter
55 per cent of Grade 9–12 students would do so. Of some concern for educators in Manitoba is the finding that for the whole group of students, at the bottom of the list of behaviours is the statement “I have taken a course in which sustainable development was discussed,” with an average of only 14 per cent reporting such experiences.
Observations
Using our two datasets and our somewhat crude standardized tests measuring levels of knowledge, attitudes and behaviours, we showed that for students and adults, having attitudes favourable to sustainable development is relatively more influential than age, levels of education and knowledge for engaging in behaviours favourable to sustainable development. The differences were that: (1) gender was most influential for the student samples—for example, girls were somewhat more disposed towards sustainable lifestyles—while favourable attitudes were most influential for the adult samples; and (2) while attitudes were practically equally influential to knowledge for the student sample, attitudes were vastly more influential than education for the adult samples. Some important caveats remain. As noted earlier, generally speaking, we do not seem to have assembled sets of statements with sufficient discriminating power to form the basis of good standardized measures. More particularly, we must note:
1. nearly four-fifths of the variation in our dependent variable scores (the index of behaviours) remained unexplained;
2. our dependent variable had a relatively low level of internal coherence (which would generally reduce its measurable relationships with other variables);
3. our results may be fairly sample-specific and not generalizable.
It was encouraging to discover that the items in the knowledge index had promising levels of discriminating power for student groups and the attitudes index had acceptable levels of internal coherence for the adult group. There is surely something to build on here. All things considered, then, as
vii Measuring Knowledge, Attitudes and Behaviours towards Sustainable Development: Two Exploratory Studies
an exploratory exercise, perhaps we should be satisfied with the progress made. There is obviously plenty of hard work ahead of us before we will have standardized measures that anyone might consider using to measure progress toward achieving the aims of the DESD. In case anyone reading this is inclined to become discouraged with our results, it is worthwhile to put our project into a global context. One member of our team (Michalos) is a member of the UN Monitoring and Evaluation Expert Group (MEEG) that is responsible for monitoring and evaluating the implementation of the UN Decade of Education for Sustainable Development. The first of three surveys to be made by MEEG went out in the spring of 2008 to all members of UNESCO (about 190), and by August approximately 65 (34 per cent) responses were obtained. The main lesson learned from the rough survey is that, at the half way point in the decade, there is an enormous variety of views and a great deal of confusion about the nature and importance of Education for Sustainable Development. Not only are most countries lacking structures (e.g., targeted commissions or committees) and policies relevant to implementing tasks needed to achieve the goals of the decade, in most countries there is confusion between education for sustainable development and environmental education. It is likely that most of the work for the rest of the decade will have to be devoted to clarifying the concepts and goals of the decade, and helping countries put structures and policies in place to make implementation of the aims possible. In short, worldwide, progress toward implementing the aims of the DESD is proceeding much more slowly than anyone hoped. So, what we need most now is patience and persistence. Concerning the sort of work we are doing in Manitoba, we need to continue to build standardized measures so that we, and with our help, the world community can make rigorous tests of progress toward all DESD goals. We have circulated drafts of our studies among key players in the field, for example, scholars, UN workers, government officials at all levels and members of NGOs. Findings were presented at the Choose the Future: Education for Sustainability national conference, held in Winnipeg, November 26–28, 2008. At the end of the year, we presented our work to a group of scholars at the international conference on Human Development and the Environment: Advances in Quality of Life Studies, at the Chinese University of Hong Kong, December 12–13, 2008. After standard peer reviewing, our paper will be published in a special issue of the international journal, Social Indicators Research.
ii Measuring Knowledge, Attitudes and Behaviours towards Sustainable Development: Two Exploratory Studies
Table of Contents
Executive Summary ..................................................................................................................................................... ii
Overview of the project ............................................................................................................................................................................. ii
Methodology................................................................................................................................................................................................ ii
Findings from the Manitoba households survey ................................................................................................................................... iv
Findings from the Manitoba students survey ......................................................................................................................................... v
Observations .............................................................................................................................................................................................. vi
1.0 Introduction .................................................................................................................................................... 1
1.1 Adult Survey ................................................................................................................................................................................. 2
1.1.1 DESD Themes, Item Pool and Item Selection ......................................................................................................................... 2
1.1.2 Questionnaire, Methods and Sample Statistics ......................................................................................................................... 4
1.1.3 Descriptive Statistics ............................................................................................................................................................... 4
1.1.4 Steps Toward Indexes of Knowledge, Attitudes and Behaviours toward Sustainable Development .............................................. 6
1.1.5 Bi-variate and Multi-variate Relations .................................................................................................................................... 8
1.1.6 Summary of Adult Survey Results ........................................................................................................................................ 10
1.2 Student Surveys .......................................................................................................................................................................... 11
1.2.1 Item Selection, Questionnaire, Methods and Student Sample Statistics .................................................................................... 11
1.2.2 Student Descriptive Statistics ................................................................................................................................................. 11
1.2.3 Student Indexes of Knowledge, Attitudes and Behaviours Concerning Sustainable Development ............................................... 13
1.2.3 Student Sample Bi-variate and Multi-variate Relations .......................................................................................................... 14
1.3 Summary of Student and Adult Survey Results ..................................................................................................................... 15
2.0 Reference List ................................................................................................................................................ 16
3.0 Tables .............................................................................................................................................................. 19
3.1 Table 1. Adult sample demographics, unweighted and weighted numbers and percentages .......................................... 19
3.2 Table 2. Knowledge of sustainable development, unweighted and weighted numbers of adult respondents and percentage of correct answers ................................................................................................................................................................. 21
3.3 Table 3. Attitudes concerning sustainable development, unweighted and weighted numbers of adult respondents and per cent agreeing or strongly agreeing with statements favourable to sustainable development. .................................................. 23
3.4 Table 4. Behaviours concerning sustainable development, unweighted and weighted numbers of adult respondents and percentage of answers favourable to sustainable development................................................................................................... 25
3.5 Table 5. Indexes of Knowledge of, Favourable Attitudes and Behaviours toward Sustainable Development, with numbers of adult respondents, Cronbach Alphas, scale means and item-total correlations. ......................................................... 26
3.6 Table 6. Correlations among indexes for Knowledge of, Favourable Attitudes and Behaviours toward Sustainable Development, and four demographic variables, adult sample, P <.05, N=386. .............................................................................. 28

iii Measuring Knowledge, Attitudes and Behaviours towards Sustainable Development: Two Exploratory Studies
3.7 Table 7. Regressions of Favourable Behaviours Index on Knowledge and Favourable Attitudes Indexes and four demographic variables, adult sample. ..................................................................................................................................................... 29
3.8 Table 8. Student Sample Demographics ................................................................................................................................. 30
3.9 Table 9. Knowledge of sustainable development, numbers of student respondents and percentage of correct answers ..................................................................................................................................................................................................... 31
3.10 Table 10. Attitudes concerning sustainable development, numbers of student respondents and percentage agreeing or strongly agreeing with statements favourable to sustainable development. ................................................................................. 33
3.11 Table 11. Behaviours concerning sustainable development, numbers of student respondents and percentage of answers favourable to sustainable development. .................................................................................................................................. 34
3.12 Table 12. Indexes of Knowledge of, Favourable Attitudes and Behaviours toward Dustainable Development, with numbers of student respondents, Cronbach Alphas, scale means and item-total correlations. ..................................................... 36
3.13 Table 13. Correlations among indexes for Knowledge of, Favourable Attitudes and Behaviours toward Sustainable Development, and three demographic variables, for student sample, P <.05, N=294. .................................................................. 37
3.14 Table 14. Regressions of Favourable Behaviours Index on Knowledge and Favourable Attitudes Indexes and three demographic variables. ............................................................................................................................................................................. 37
1 Measuring Knowledge, Attitudes and Behaviours towards Sustainable Development: Two Exploratory Studies
1.0 Introduction
In December 2002 the United Nations General Assembly passed a resolution designating the years from 2005 to 2014 as the UN Decade of Education for Sustainable Development (DESD). At least since the publication of Our Common Future by the World Commission (Brundtland Commission) on Environment and Development in 1987, the idea of improving the quality of life for all of the earth’s inhabitants has been essentially connected to the idea of sustainable development.
Sustainable development is development that meets the needs of the present without compromising the ability of future generations to meet their own needs [. . .]. The satisfaction of human needs and aspirations is the major objective of development. The essential needs of vast numbers of people in developing countries—for food, clothing, shelter, jobs—are not being met, and beyond their basic needs these people have legitimate aspirations for an improved quality of life. A world in which poverty and inequity are endemic will always be prone to ecological and other crises. Sustainable development requires meeting the basic needs of all and extending to all the opportunity to satisfy their aspirations for a better life. (World Commission, 1987, pp. 43–44; emphasis added)
These ideas are articulated in quite explicit and detailed ways in the Framework for the UNDESD International Implementation Scheme:
The overall goal of the DESD is to integrate the values inherent in sustainable development into all aspects of learning to encourage changes in behavior that allow for a more sustainable and just society for all [. . .]. The DESD starts at a time when a number of other, related international initiatives are in place. It is essential to situate the Decade with respect to efforts in which the international community is already engaged. In particular, the Millennium Development Goal (MDG) process, the Education for All (EFA) movement, and the United Nations Literacy Decade (UNLD) have close links with aspects of the DESD. All of them aim to achieve comparable impacts: an improvement in the quality of life, particularly for the most deprived and marginalized, and fulfillment of human rights including gender equality, poverty reduction, democracy and active citizenship. (UNESCO Education Sector, 2006, pp. 18–20).
The aim of this exploratory investigation is to lay the foundation for the development of standardized tests of people’s knowledge, attitudes and behaviours concerning the basic themes of the DESD. In order to assess progress made in people’s levels of knowledge, favourable attitudes and behaviours concerning education for sustainable development and/or sustainable development itself (sustainable development), one must be able to measure these three things in standardized ways. This is by no means a trivial task, and we are both sensitive to and sympathetic with the following comments of Fayers and Machin (2007):
2 Measuring Knowledge, Attitudes and Behaviours towards Sustainable Development: Two Exploratory Studies
Developing new instruments is a time-consuming task. In summary, our advice is: don’t develop your own instrument—unless you have to. Whenever possible, consider using or building upon existing instruments. If you must develop a new instrument, be prepared for much hard work over a period of years” (p.75)
The structure of our paper is as follows. In the next section (2) we briefly describe the UN DESD themes and the procedures used here to obtain a pool and a final list of items for use in indexes of knowledge, attitudes and behaviours concerning sustainable development. Sections 3 to 7 review results of a province-wide survey of adults taken in Manitoba in January 2008, and Sections 8 to 12 review results of a survey of a convenience sample of Manitoba students in Grades 6 to 12 in February and March 2008. In Section 3 we describe our questionnaire, sampling method and sample demographic statistics. Descriptive statistics for items used in our indexes concerning knowledge of and favourable attitudes and behaviours toward sustainable development are reviewed in Section 4. Following that, clinimetric and psychometric approaches to index construction and our three indexes are briefly described (Section 5). In Section 6 we present results of some bi-variate and multi-variate measurements taken to reveal the salient and significant relationships among our indexes and demographic variables. Section 7 contains a summary of the main results of the adult survey. The remaining sections of the paper are patterned after the earlier sections. Sections 8 and 9 review the methodology, sample demographic and other descriptive statistics for the student sample. Section 10 describes the three indexes with minor changes for that sample. Section 11 describes results of bi-variate and multi-variate measurements taken with the student sample, and Section 12 contains a summary of the adult and student results together.
1.1 Adult Survey
1.1.1 DESD Themes, Item Pool and Item Selection
When we began our search for a pool of items that might be included in standardized measures of knowledge, attitudes and behaviours concerning sustainable development, we were aware that sustainable development is an open-textured concept and still somewhat controversial. The authors of the UN Framework document were very clear about one thing that is unfortunately less clear to many people, namely, that
Education for sustainable development should not be equated with environmental education. The latter is a well-established discipline, which focuses on humankind’s relationship with the natural environment and on ways to conserve and preserve it and properly steward its resources. Sustainable development therefore encompasses environmental education, setting it in the broader context of socio-cultural factors and the socio-political issues of equity, poverty, democracy and quality of life. (UNESCO Education Sector, 2006, p. 17)
Our first task became that of finding a definitive list of themes or perspectives to be addressed by education for sustainable development, and this task was completed in broad outlines by the authors of
3 Measuring Knowledge, Attitudes and Behaviours towards Sustainable Development: Two Exploratory Studies
the Framework. Sections 3.1-3.3 (pp. 18-20) list the following “fifteen strategic perspectives, and the connections between them, [that] must inform education and learning for sustainable development.” These are “socio-cultural perspectives,” including human rights, peace and human security, gender equality, cultural diversity and intercultural understanding, health, HIV/AIDS, governance; “environmental perspectives,” including natural resources (water, energy, agriculture, biodiversity), climate change, rural development, sustainable urbanization, disaster prevention and mitigation; and “economic perspectives,” including poverty reduction, corporate responsibility and accountability and market economy. Given the absence of generally accepted definitions of many of the terms in the list, it is fairly certain that the fifteen perspectives are not mutually exclusive in pairs or collectively exhaustive of all the things that might be relevant to sustainable development. Nevertheless, given the source of the list, we believe it should be granted some privileged, authoritative status. Therefore, tests of people’s knowledge, attitudes and behaviours concerning sustainable development should reflect the topics included in this list. In other words, at least the face validity of such tests should be matched against these topics. In search of potential items for our initial pool, we examined a substantial variety of documents that are listed in the References. We would like to acknowledge and thank the authors of the cited articles and reports. Without their initial efforts, our own efforts would have been considerably more difficult and less productive. On the basis of our documentary search, we assembled 90 candidate items covering knowledge, attitudes and behaviours more or less indicative of the “fifteen strategic perspectives.” We created a questionnaire to be sent to experts in the field of Sustainable development (SD) and Education for Sustainable development (ESD) asking them to “rate the importance of each item for a scale aimed at measuring people’s understanding, attitudes and behaviours regarding sustainable development and education for sustainable development.” The importance ratings were to be made in a simple Likert format with 4 = ‘very important’; 3 = ‘important’; 2 = ‘slightly important’ and 1 = ‘not important.’ Because we wanted to create measurement scales suitable for surveys aimed at adults 18 years and older as well as for students in Grades 6 to 12, each item was to receive two ratings from each expert, which might be identical. The sums of the expert importance ratings for each item for an adult questionnaire and for a student questionnaire were to be calculated to obtain overall importance ratings. In the first week of November 2007 approximately 160 experts from knowledgeable groups were emailed questionnaires. The groups included members of the UN Monitoring and Evaluation Expert Group for the DESD, UN Reference Group for the DESD; Canadian National Education for Sustainable Development Expert Council, a network of Education for Sustainable Development contacts of the Council of Ministers of Education, Canada; a network of contacts through the International Institute for

4 Measuring Knowledge, Attitudes and Behaviours towards Sustainable Development: Two Exploratory Studies
Sustainable development; former participants in the Halifax Higher Education for Sustainability Conference; and participants in the Asia-Pacific DESD Monitoring Project. By the last week of November, we received a disappointing 18 completed questionnaires, though many of them included helpful comments about ways to improve the wording of our items as well as suggestions for additional items. On the basis of the importance ratings from these respondents, then, we made a first cut at reducing the total item pool. Somewhat arbitrarily, but with an eye to parsimony, we decided to aim for scales containing about 15 items. Selecting the top rated items from the three sets of items, we ended up with 17 items measuring knowledge, and 15 each measuring attitudes and behaviours.
1.1.2 Questionnaire, Methods and Sample Statistics
A six-page mailout questionnaire was developed that contained a set of 17 true/false items testing respondents’ knowledge of sustainable development, a set of 15 Likert-type items running from ‘strongly disagree’ (=1) through ‘are unsure’ (=3) to ‘strongly agree’ (=5) concerning respondents’ attitudes, and a set of 15 true/false items concerning respondents’ behaviours. Following these items there was a set of standard demographic questions concerning gender, age and so on. In January 2008 the questionnaires were mailed out to a random sample of 5,000 households in the province of Manitoba, and 506 completed questionnaires were returned by the end of February. These formed our working dataset, and we suppose that the 10 per cent who responded to our survey had some interest in and perhaps a bias toward sustainable development. Because it was immediately obvious that our sample of respondents was not representative of the total population of the province, we decided to apply weights to the sample to get a better fit. We used education as a weighting variable because we assumed that of all the demographic variables available from the census, it would have the largest impact on the kind of information we were attempting to obtain. As we will show below, results of our regressions suggest that our assumption was correct. All of our tables provide results using the unweighted and weighted samples, although in most cases there is very little difference in the results. Table 1 summarizes the demographics of the unweighted sample and of the sample weighted by education statistics drawn from Statistics Canada’s 2001 census, population 15 years and over by the highest level of schooling completed by province and territory. Compared to the 2001 census data, our weighted sample is just about perfect for education, has about two percentage points more of married people, 10 percentage points more of males and 22 percentage points more of people 65 years old or more. Thus, our weighted sample is still not strongly representative of the total Manitoba population.
1.1.3 Descriptive Statistics
Table 2 lists the 17 items concerning knowledge of sustainable development, the numbers of respondents for each item and the percentages of correct responses for the unweighted and weighted datasets. Cursory inspection of the percentages of respondents correctly identifying the truth or falsity of each of the 17
5 Measuring Knowledge, Attitudes and Behaviours towards Sustainable Development: Two Exploratory Studies
sentences in both samples reveals that most people did very well most of the time. The weighted sample produced smaller numbers of respondents for 14 items, with higher percentages of correct answers for ten items, lower percentages for five items and two items had no change. Assuming that students who score about 80 per cent or higher on an exam are entitled to an A- or better in many schools and universities in Canada, about half of our class would have had such entitlements. While this would be wonderful news for students, it is a sure sign that for the respondents in our sample, the test was relatively useless for discriminating those who know a lot from those who know a little. However, an acceptable standardized test should have precisely such discriminating power. So, these items do not seem to be very useful for present purposes. Examination of the percentages of respondents correctly identifying the truth or falsity of each item reveals that K5 (“Canada’s overall energy is improving.”) had the lowest percentage of correct answers, 42.1 per cent and 56.4 per cent, respectively, for the unweighted and weighted samples. Notwithstanding the fact that this item merited placement in our list according to its relative standing in the expert ratings, it is a fairly vague item. Some respondents may have thought of the booming oil and gas industry, others of the equally booming greenhouse gases connected to burning fossil fuels, still others of the rebirth of the nuclear option, for better or worse. After this item, K7 (“Education for sustainable development emphasizes gender equality.”) had the lowest percentage of correct answers, 62.2 per cent and 65.3 per cent, respectively, for the unweighted and weighted samples. Issues connected to gender equality and even more so to equality for disabled people have had and continue to have a rough time being connected to ideas about sustainable development inside and outside the UN. So, our relatively low scores were not surprising. On the other hand, it was encouraging to see that K1 (“Economic development, social development and environmental protection are all necessary for sustainable development.”) had the highest number of respondents (499 and 501) as well as the highest percentage of correct answers in both samples, 97.6 per cent and 98.4 per cent, respectively, for the unweighted and weighted samples. Table 3 lists the 15 items concerning attitudes toward sustainable development, the numbers of respondents for each item and the percentages of responses agreeing or strongly agreeing with statements favourable to sustainable development for the unweighted and weighted datasets. Inspection of the percentages of respondents with favourable attitudes toward sustainable development reveals good levels of support in both samples. This time, the gender item (A15: “Gender equality has nothing to do with sustainable development.” [reverse coded]) was clearly in a class by itself at the bottom of the whole set of items, with practically the same amount of support (47.9 per cent and 48.1 per cent) in both samples. Why is it so difficult to see that development which delivers unequal advantages and disadvantages to men and women is not sustainable? As it was in Table 2, the first item in Table 3 produced the highest levels of support in both samples, (A1: “Every girl or boy should receive education that teaches the knowledge, perspectives, values, issues and skills for sustainable living in a community.”), namely, 97.6 per cent and
6 Measuring Knowledge, Attitudes and Behaviours towards Sustainable Development: Two Exploratory Studies
98.2 per cent, respectively for the unweighted and weighted samples. Table 4 lists the 15 items concerning behaviour related to sustainable development, the numbers of respondents for each item and the percentages of responses favourable to sustainable development for the unweighted and weighted datasets. Inspection of the percentages of respondents reporting behaviours favourable to sustainable development reveals a significant drop of support in both samples. At the bottom of the list in both samples is item B5 (“I have taken a course in which sustainable development was discussed.”), with 29.5 per cent and 21.1 per cent, respectively, reporting such experiences for the unweighted and weighted samples. This is not surprising given the relatively high percentages of older people in our samples. (Recall that weighting our original sample by the highest levels of education completed increased the percentage of people 65 years old and older from 29.5 per cent to 37.5 per cent.) Item B3 (“At home I try to recycle as much as I can.”) had the highest percentages of responses favourable to sustainable development, with 93.2 per cent and 90.2 per cent, respectively, for the unweighted and weighted samples. Interestingly, the one item mentioning gender equality had percentages of responses favourable to sustainable development that were above the mean. B9 (“The household tasks in my home are equally shared among family members regardless of gender.”) had favourable responses of 75.6 per cent and 77.0 per cent, respectively, for the unweighted and weighted samples. The report of the Federal-Provincial/Territorial Ministers Responsible for the Status of Women (1997) showed that there was some progress toward equalization of paid and unpaid work for men and women in Canada in the period from 1986 to 1992 (Michalos 2000, reprinted in Michalos 2003), but we are not aware of any surveys using items similar to B9.
1.1.4 Developing Indexes of Knowledge, Attitudes and Behaviours toward Sustainable
Development
In this section we take some modest steps forward on the development of standardized measures of knowledge, attitudes and behaviours toward sustainable development. Reflection on the material already presented should caution readers against expecting too much. Generally speaking, we do not seem to have assembled sets of items with sufficient discriminating power to form the bases of good standardized measures. However, there is another issue that should be mentioned before we consider our three indexes. This concerns our use of an approach to index construction that is relatively unfamiliar in the social indicators research tradition but fairly familiar in the health-related quality of life research tradition. (See Michalos 2003, 2004 for comparisons of these two research traditions related to measuring the quality of life.) Fayers and Hand (2002) have provided an excellent account of the two approaches most familiar to the two research traditions.
The aim of psychometricians is to create scales in which the multiple component items are all measuring more or less the same single attribute [e.g., anxiety], but [. . .] this is in contrast with the aim of clinicians, which is to choose and emphasize suitably the most important attributes to be included in the index, using multiple items which are not expected to be homogeneous
7 Measuring Knowledge, Attitudes and Behaviours towards Sustainable Development: Two Exploratory Studies
because they indicate different aspects of a complex clinical phenomenon. Thus, there are two types of scale, psychometric and clinimetric, with different aims, and hence their development should follow different paths [. . .]. The majority of the items to be found in [. . .] psychometric assessments reflect a level of ability or a state of mind. This has two implications. Firstly, implicit in this approach is the notion that the ‘thing’ being measured exist— we are not merely defining it in terms of the variables that we choose to measure (and combine in some way), but each of these variables is assumed to have some relationship to an underlying concept which we are trying to measure [. . .]. Secondly, the items do not alter or influence the underlying concept: they are merely aspects of it, or indicators of its magnitude. Such items have been given various names [ . . .]. We shall call them indicator variables. [. . .] In contrast, many scales from other fields, such as QOL [quality of life] scales, are not constrained to include merely indicator variables. They can include such variables, but they can (and typically do) also include variables which are part of the definition of what the concept being measured means [i.e., causal variables] [. . .]. This has two implications. Firstly, it means that sometimes we are defining the thing being measured in terms of the variables that we select to measure it. In contrast with the psychometric approach, we are not postulating that something exists but are merely constructing an index which is convenient for some purpose. The variables, therefore, need not be indicator variables for the concept in question. It follows from this, and this is the second implication, that we can, in some sense, frequently regard these variables as ‘causal’ since, if they are present (score highly, say) then the concept in question is present. Thus, in the case of QOL, a scale might include a measurement of pain as a component—not a result of low QOL, but a likely cause of it. (pp. 234–237)
Assembling our best candidate items by means of expert ratings of potential items, we have essentially adopted the clinimetric approach to index construction. However, in this section we will follow the fairly standard psychometric approach by measuring the internal consistency of the items in our three indexes using the Cronbach Alpha reliability formula. As suggested by Fayers and Hand (2002), the formula was constructed with the assumption that all the indicators in a composite index are effects of some single thing, each indicator measuring that thing from a slightly different perspective. Any correlations among the indicators are assumed to be the result of their connections to that single thing (concept, construct or phenomenon of some sort). Results displayed below indicate that the fundamental assumption of the psychometric approach does not appear to be appropriate for two of our three indexes. Table 5 lists the results of several manipulations of our six datasets using factor analysis with a variety of rotational procedures as well as systematic measures of Cronbach Alpha values with a variety of variables in each dataset. In every case, our indexes were formed by summing each respondent’s scores for each of the three kinds of phenomena—knowledge, attitudes and behaviours. The first row of the table gives the
8 Measuring Knowledge, Attitudes and Behaviours towards Sustainable Development: Two Exploratory Studies
number of cases used (N) in the analysis, with listwise deletion of cases having missing values. The second line gives the Alpha (α) score for the set of variables in each index, which is simply a measure of the inter-correlations among all the variables in the set (internal consistency, reliability) based on pairwise correlations. The formula for calculating α values is such that as the sizes of the correlations and/or number of items in a scale increase, α values increase. Values of α of 0.7–0.8 may be regarded as acceptable, while those above 0.8 are good. The item-total correlations are correlations between each item in the scale and the whole scale. Beginning with the 15-item sustainable development Knowledge Index, because every procedure we used had K3 (“Sustainable development is as much about the children in the future as it is about what we need today.”) and K5 (“Canada’s overall energy is improving.”) as largely independent of all of the other knowledge items, we decided to leave these items out of the final index. Quite a few cases were lost because of missing values (N = 384) and the α values for both datasets are acceptable (0.74, 0.72), but the average item-total correlations are modest. More to the point, the correlations range from 0.15 to 0.57, which is a very mixed bag. Still, applications of factor analysis with a variety of rotation procedures usually produced at least six factors based on the standard “eigenvalues greater than one rule” (Fayers and Machin, 2007), and it did not seem reasonable to divide 15 items in so many ways. On the contrary, it seemed preferable to just grant that the items in our Knowledge Index are there primarily as a result of expert judgments rather than psychometric manipulations. The 15-item sustainable development Favourable Attitudes Index fared much better, with N = 471 and N = 461 for the two datasets, good α values of 0.89 for both and relatively good average item-total correlations of 0.56 and 0.55. A14 (“There is no point in getting involved in environmental issues, since governments and industries have all the power and can do what they like.”) and A15 (“Gender equality has nothing to do with sustainable development.”) were reverse coded and were notably more disconnected than any other items in the set. The 15-item sustainable development Favourable Behaviours Index faired worst of all, with N = 291 and N = 271 for the two datasets, unacceptably low α values of 0.65 and 0.64, and average item-total correlations of 0.26.
1.1.5 Bi‐variate and Multi‐variate Relations
Table 6 lists the significant Pearson Product-Moment Correlations among our three indexes and four demographic variables, gender, age, education and income. The sustainable development Knowledge Index has fairly strong associations with the sustainable development Favourable Attitudes Index, at r = 0.53 and r = 0.54 (P < 0.05) for the unweighted and weighted datasets, respectively. Associations between the sustainable development Knowledge Index and the sustainable development Favourable Behaviours Index are modest, at r = 0.31 and r = 0.22 (P < 0.05) for the unweighted and weighted datasets, respectively. Correlations between the sustainable development Favourable Attitudes Index and the
9 Measuring Knowledge, Attitudes and Behaviours towards Sustainable Development: Two Exploratory Studies
sustainable development Favourable Behaviours Index are r = 0.40 and r = 0.32 (P < 0.05) for the unweighted and weighted datasets, respectively. On average, women had slightly higher scores than men on all three indexes (data not displayed). The correlations between gender and attitudes (r = 0.15 and r = 0.14, P < 0.05) for the unweighted and weighted datasets, respectively) provide numerical indicators of this same fact: being a woman is positively associated with having a favourable attitude toward sustainable development. The other two indexes did not have statistically significant associations with gender at the P < 0.05 level. For the unweighted dataset, age and income had no statistically significant associations at the P < 0.05 level with any of the sustainable development indexes. For the weighted dataset, age was negatively correlated with the knowledge index (r = -0.24) and with the attitudes index (r = -0.18), while income was positively but weakly correlated with the behaviours index (r = 0.11). Since, compared to the 2001 census figures, our datasets had disproportionately high percentages of older people in them, if our datasets were more representative of the Manitoba population, on average, our knowledge and attitudes index scores would have been even higher than they were here. Of the four demographic variables, highest level of education completed had the greatest number of statistically significant associations with the three sustainable development indexes, although all of them were relatively weak. For the unweighted dataset, education had a correlation of r = 0.12 with the knowledge and behaviours indexes, and r = 0.09 with the attitudes index. For the weighted dataset, education had a correlation of r = 0.14 with the knowledge index and r = 0.10 with the behaviours index, but no statistically significant correlation with the attitudes index at the P < 0.05 level. Finally, Table 7 summarizes the results of regressing what many people might regard as our most important variable, the sustainable development Favourable Behaviours Index, on our other two indexes and four demographic variables. Thomson, Hoffman and Staniforth (n.d., p. 6) approvingly offered the following quotation from a report by the North America Association for Environmental Education (1996), which, with slight alterations, applies with even more force to sustainable development: “Environmental education is concerned with knowledge, values, and attitudes, and has as its aim responsible environmental behaviour.” We used stepwise regression and created three separate equations for the unweighted and weighted datasets. For each dataset, the first numerical column of Table 7 shows the results of regressing the sustainable development Favourable Behaviours Index on the four demographic variables. In the second numerical column, only the other two indexes are used as predictors, and in the final column, only the statistically significant predictors from the first two columns are used. One aim of the regressions is to explain 100 per cent of the variation in index scores on the basis of our three sets of explanatory or predictor variables. The second row of each dataset summary reveals how successful we were in achieving this aim. A second aim of the regressions is to explain the relative influence of each predictor on the dependent variable when the values of every other predictor in the equation are held constant. Beta (β) values are standardized regression coefficients, with means of zero and standard deviations of one.

10 Measuring Knowledge, Attitudes and Behaviours towards Sustainable Development: Two Exploratory Studies
Figuratively speaking, they may be interpreted as percentages of a full step, that is to say, when the values of all but one predictor in an equation are held constant and the unbound predictor moves one full step, the dependent variable will move a certain percentage of a step. For the unweighted dataset, when the sustainable development Favourable Behaviours Index was regressed on the four demographic variables, only one of the latter, highest level of education completed, had a statistically significant relation to the dependent variable. By itself, education explained only 2 per cent of the variation in sustainable development Favourable Behaviours Index scores. Figuratively speaking, an improvement in the distribution of education scores of one standard deviation unit would produce an increase of 14 per cent (β = .14) of one standard deviation in the index scores. When the dependent variable was regressed on the other two indexes, 17 per cent of the variance in the dependent variable was explained, and the sustainable development Favourable Attitudes Index (β = .33) proved to be nearly three times more influential than the sustainable development Knowledge Index (β = .13). In the end, when the dependent variable was regressed on education and the two indexes, the knowledge index failed to reach statistical significance. In this case, 22 per cent of the variation in sustainable development Favourable Behaviours Index scores was explained by education (β = .12) and scores on the sustainable development Favourable Attitudes Index (β = .45), with the latter nearly four times more influential than the former. For the weighted dataset, when the sustainable development Favourable Behaviours Index was regressed on the four demographic variables, again only one of the latter, highest level of education completed, had a statistically significant relation to the dependent variable. By itself, education explained only 1 per cent of the variation in sustainable development Favourable Behaviours Index scores. When the dependent variable was regressed on the other two indexes, only 10 per cent of the variance in the dependent variable was explained and only the sustainable development Favourable Attitudes Index (β = .32) had a statistically significant relation to that variable. At last, when the dependent variable was regressed on education and the attitude index, 23 per cent of the variation in sustainable development Favourable Behaviours Index scores was explained by education (β = .11) and scores on the sustainable development Favourable Attitudes Index (β = .47), with the latter over four times more influential than the former.
1.1.6 Summary of Adult Survey Results
The results summarized in the preceding two paragraphs lead to a very clear-cut conclusion. So far as our particular datasets are concerned, sustainable development favourable attitudes are much more important than sustainable development knowledge for explaining sustainable development favourable behaviours, and the highest level of education completed is more important than gender, age and income for explaining sustainable development favourable behaviours. As well, the highest level of general education is more important than specific sustainable development knowledge for explaining sustainable development favourable behaviours.

11 Measuring Knowledge, Attitudes and Behaviours towards Sustainable Development: Two Exploratory Studies
Tidy as this sounds, one must not forget that nearly four-fifths of the variation in our dependent variable scores (the sustainable development Favourable Behaviours Index) remained unexplained. As well, one must not forget (if one could) that our dependent variable had a relatively low α value, its items were not great indicators of behaviours central to sustainable development as understood in the UN DESD and the items in the knowledge index had relatively weak discriminating power. On top of all this, one should remember that the β values in regression equations are highly sensitive to the variances in the particular variables used in particular samples. So, some of our results may be fairly sample-specific and not generalizable.
1.2 Student Surveys
1.2.1 Item Selection, Questionnaire, Methods and Student Sample Statistics
Student questionnaires were constructed from the same items used for the adult questionnaires with some simplification of language, some reordering of items beginning with those easiest to understand and some reduction in demographic questions. The exact wording and order of items are listed in Tables 9 to 11. Convenience samples were taken from four Manitoban schools in February and March 2008 located in the northern and central regions of the province. Two hundred and ninety-four useable questionnaires were obtained and the demographics of the respondents are summarized in Table 8. Of the those identifying their gender, 161 (55.9 per cent) were females. Of those identifying their grade, 112 (39.8 per cent) were in Grade 6, 122 (43.3 per cent) were in Grade 8 and the remaining 48 (16.9 per cent) were distributed into Grades 9 to 12. One hundred and sixteen (40.3 per cent) were aged 10 to 12, 121 (42 per cent) were 13 or 14 and the remaining 51 (17.7 per cent) ranged from 15 to 18, with two outliers aged 20 and 43.
1.2.2 Student Descriptive Statistics
Table 9 lists the 17 items concerning knowledge of sustainable development, the numbers of respondents for each item and the percentages of correct responses for all students, and then for all those in Grades 6, 8 and 9 to 12. As one might have expected, the students did not have as much success as the adults had with the items. Assuming again that students who score about 80 per cent or higher on an exam are entitled to an A- or better, about 20 per cent of all our student respondents would have had such entitlements. While these items are still probably too easy, they are more useful for students than for adults. One might also have expected that there would be some progression across the grades, with those in Grades 9 to 12 doing better than those in Grade 8 and the latter doing better than those in Grade 6. Inspection of the percent scores in the three columns of Table 9 reveals that for the sixteen items with positive results, there were 10 cases (62.5 per cent) in which the expected progression occurred. In the remaining 6 cases, the expected progression occurred sometimes from Grade 6 to Grade 8 or Grades 9 to 12, and sometimes only from Grade 8 to Grades 9 through 12. Examination of the results in the 17 rows of Table 9 immediately reveals that item K16 (“Sustainable

12 Measuring Knowledge, Attitudes and Behaviours towards Sustainable Development: Two Exploratory Studies
development has nothing to do with social justice.”) had zero percentages of correct answers for the whole group and every grade category. For the whole group, 80 per cent of those who responded to the item checked off the response “unsure,” including 81 per cent of those in Grade 6, 83 per cent in Grade 8 and 72 per cent in Grades 9 through 12. The only respondents who opted for another response, chose the wrong one. Presumably, the term “social justice” was just not familiar to most students. Examination of the percentages of respondents in the whole group correctly identifying the truth or falsity of each item reveals that K11 (“Sustainable development does not require businesses to behave responsibly.”) had the lowest percentage of correct answers, 43.1 per cent. After this item, K12 (“Education for sustainable development supports cultural diversity.”) had the lowest percentage of correct answers, 46.4 per cent. K3 (“Conservation of fresh water is not important in Canada because we have plenty.”) had the highest percentage of correct answers (77.8 per cent) as well as the second highest number of respondents (284). This was particularly encouraging. According to a report by Statistics Canada (2008),
Water availability is an emerging issue in some parts of the country and may be exacerbated by climatic changes. For example, in the summer of 2001, many regions of Canada experienced drought or near-drought conditions that led to regulatory responses by municipal authorities (e.g., water use restrictions) or the voluntary adoption of water conservation measures by households. In other locations, while water may not be in short supply, municipalities and taxpayers incur increased water treatment costs as demands for water grow. (p. 12)
Closely behind K3, K9 (“Helping people out of poverty in Canada is important for Canada to become more sustainable.”) had the second highest percentage of correct answers, 76.4 per cent. In fact, although the relatively abstract concept of social justice was unfamiliar to most students, three of the four items with the highest percentages of correct answers were issues of social justice. Besides K9, K5 (“Education for sustainable development includes education for a culture of peace.”) was correctly identified by 70.6 per cent of student respondents and K4 (“Education for sustainable development promotes respect for human rights.”) was correctly identified by 69.0 per cent. Clearly, high percentages of our student respondents believed that education for sustainable development involves more than environmental education. Table 10 lists the 15 items concerning attitudes toward sustainable development, the numbers of respondents for each item and the percentages of responses agreeing or strongly agreeing with statements favourable to sustainable development. For the whole group, A1 (“Every girl or boy should be taught the knowledge, values, issues and skills for sustainable development.”) produced the highest level of support, 82.2 per cent. A14 (“There is no point in getting involved in environmental issues, since governments and industries have all the power and can do whatever they like.”) is framed as a statement unfavourable to
13 Measuring Knowledge, Attitudes and Behaviours towards Sustainable Development: Two Exploratory Studies
sustainable development and only 17.4 per cent agreed or strongly agreed with it. Seventeen percent of respondents to this item selected the “unsure” response and 6.5 per cent selected “don’t understand,” leaving 58.9 per cent who disagreed or strongly disagreed with it. There were only four cases (A2, A7, A10, A12) in which there was the expected progression of support for sustainable development as one advanced from Grade 6 to 8 and from the latter to 9 through 12. There were ten cases where the expected progression occurred sometimes from Grade 6 to Grade 8 or Grades 9 through 12, and sometimes only from Grade 8 to Grades 9 through 12. In one case, A3 (“It is OK for companies to make products that are designed to be thrown away after one use.”), the progession was completely reversed. Forty-seven percent of Grade 6 students agreed or strongly agreed with this item, compared to 45.6 per cent of Grade 8 students and 21.5 per cent of students in Grades 9 through 12. Presumably, the older students could think of more plausible counter-examples (e.g., newspapers, facial and toilet tissue). Table 11 lists the 15 items concerning behaviour related to sustainable development, the numbers of respondents for each item and the percentages of responses favourable to sustainable development. As we found for the adult sample, the transition from knowledge and favourable attitudes to favourable behaviours is accompanied by a significant drop in percentages of responses supporting sustainable development. As it was for the adults, for the whole group of students, at the bottom of the list is item B5 (“I have taken a course in which sustainable development was discussed.”), with 13.7 per cent reporting such experiences. As one might have expected, the percentages increased from Grade 6 at 10.6 per cent to Grade 8 at 14.5 per cent, and then to 18.0 per cent in Grades 9 through 12. Item B4 (“I try to make sure that both boys and girls are treated fairly in my home and at school.”) had the highest percentage (80.6 per cent) of responses favourable to sustainable development. As well, this item was one of six out of the sixteen in which the expected progression through the grades actually occurred. For B4, 78.6 per cent of Grade 6 student responses were favourable to sustainable development, compared to 83.0 per cent for Grade 8 and 86.3 per cent for Grades 9 through 12. There were five items for which the expected progression was completely reversed (B2, B3, B9, B11, B13) and 4 where progression occurred sporadically (B6, B10, B14, B15).
1.2.3 Student Indexes of Knowledge, Attitudes and Behaviours concerning Sustainable
Development
Because of the relatively small sample sizes in each of the three grade groups, our discussion in the remaining sections of the paper is based only on the student group as a whole. Table 12 is patterned after Table 5 and lists the items in the Indexes of Knowledge of, Favourable Attitudes and Behaviours toward sustainable development, the numbers of student respondents, Cronbach Alphas, scale means and item-total correlations. As before, some items were deleted for one reason or another. Beginning with the sustainable development Knowledge Index, K16 (“Sustainable development has nothing to do with social justice.”) was dropped for reasons explained earlier. This 16-item index was
14 Measuring Knowledge, Attitudes and Behaviours towards Sustainable Development: Two Exploratory Studies
constructed with a sample N = 247, and had an α = 0.79. The average item-total correlation is 0.39, ranging from 0.16 to 0.52. The 11-item sustainable development Favourable Attitudes Index was built on an N = 271, had an α = 0.77, with an average item-total correlation of 0.41. The four deleted items (A3, A5, A14, A15) were reverse-coded for use in the index but had relatively low item-total correlations in all cases and were difficult to interpret in other cases. The 14-item sustainable development Favourable Behaviours Index fared worst of all (as it did with the adult sample), based on an N = 269, with a low α = 0.63 and an average item-total correlation of 0.26.
1.2.3 Student Sample Bi‐variate and Multi‐variate Relations
Table 13 lists the significant Pearson Product-Moment Correlations among our three indexes and three demographic variables, gender, age and school grade. The sustainable development Knowledge Index has a fairly strong association with the sustainable development Favourable Attitudes Index, at r = 0.57 (P < 0.05). The association between the sustainable development Knowledge Index and the sustainable development Favourable Behaviours Index is weaker, at r = 0.31 (P < 0.05). The correlation between the sustainable development Favourable Attitudes Index and the sustainable development Favourable Behaviours Index is also relatively weak, at r = 0.35. As we found for the adult samples, on average, females had slightly higher scores than males on all three indexes (data not displayed). Gender had no statistically significant association with the Knowledge or Attitudes Indexes, but being female was positively associated with the Behaviours Index, at r = .26 (P < 0.05). Age and grade had modest positive correlations with the Knowledge and Attitudes Indexes, but no significant associations with the Behaviours Index. As expected, age was highly correlated with grade status, at r = .86. Finally, Table 14 is patterned after Table 7 and summarizes the results of regressing the sustainable development Favourable Behaviours Index on our other two indexes and three demographic variables. When the sustainable development Favourable Behaviours Index was regressed on the three demographic variables, only one of the latter, gender, had a statistically significant relation to the dependent variable. By itself, gender explained only 6 per cent of the variation in sustainable development Favourable Behaviours Index scores. Essentially, then, the regression confirmed the association already revealed with the bi-variate analysis, with the additional information that the association holds in the presence of the other two demographic variables. When the dependent index variable was regressed on the other two indexes, 14 per cent of the variance in the dependent variable was explained, and the sustainable development Favourable Attitudes Index (β = .24) proved to be a bit more influential than the sustainable development Knowledge Index (β = .18). In the end, when the dependent index variable was regressed on gender and the two indexes, all three predictors reached statistical significance. In this case, 19 per cent of the variation in
15 Measuring Knowledge, Attitudes and Behaviours towards Sustainable Development: Two Exploratory Studies
sustainable development Favourable Behaviours Index scores was explained by gender (β = .24), scores on the sustainable development Favourable Attitudes Index (β = .21) and scores on the sustainable development Knowledge Index (β = .20).
1.3 Summary of Student and Adult Survey Results
The results summarized in the preceding section for our student sample have a notable similarity and some differences with those from our adult sample. The similarity is that for students and adults, having attitudes favourable to sustainable development is relatively more influential than age, levels of education and knowledge for behaviours favourable to sustainable development. The differences are that: (1) gender was most influential for the student samples, while favourable attitudes were most influential for the adult samples; and (2) while attitudes were practically equally influential to knowledge (though numerically more influential) for the student sample, attitudes were vastly more influential than education for the adult samples.
Nevertheless, the old caveats remain, namely, (1) nearly four-fifths of the variation in our dependent variable scores remained unexplained; (2) our dependent variable had a relatively low α value; (3) its items were not great indicators of behaviours central to sustainable development as understood in the UN DESD; and (4) our results may be fairly sample-specific and not generalizable. It was encouraging to discover that the items in the knowledge index had promising levels of discriminating power for student groups. There is surely something to build on here. All things considered, then, as an exploratory exercise, perhaps we should be satisfied with the progress made. There is obviously plenty of hard work ahead of us before we will have standardized measures that anyone might consider using to measure progress toward achieving the aims of the DESD.
16 Measuring Knowledge, Attitudes and Behaviours towards Sustainable Development: Two Exploratory Studies
2.0 Reference List
Asia-Pacific DESD Monitoring Project (2007). Sharing Progress Towards National DESD Monitoring Systems in the Asia-Pacific: Country Updates. Progress Report 2, July–September 2007. Bangkok: UNESCO. Canadian Commission for UNESCO (2006). United Nations Decade of Education for Sustainable development (2005-14): Canada’s Response to the UNESCO Questionnaire. Ottawa: Council of Ministers of Education, Canada and the Canadian Commission for UNESCO. Canadian Commission for UNESCO (2007). Report to UNECE and UNESCO on Indicators of Education for Sustainable development, Report for Canada. Ottawa: Council of Ministers of Education, Environment Canada, Canadian Commission for UNESCO. Dunlap, R.E., K.D. Van Liere, A.G. Mertig and R.E.Jones (2000). Measuring endorsement of the New Ecological Paradigm: A revised NEP scale. Journal of Social Issues, 56(3), pp. 425–442. Fayers, P.M. and D.J. Hand (2002). Causal variables, indicator variables and measurement scales: an example from quality of life. Journal of the Royal Statistical Society A, 165(Part 2), pp. 233–261. Fayers, P.M. and D. Machin (2007). Quality of Life: The Assessment, Analysis and Interpretation of Patient-Reported Outcomes. Chichester: John Wiley and Sons, Ltd. Federal-Provincial/Territorial Ministers Responsible for the Status of Women (1997). Economic Gender Equality Indicators. Ottawa. Franzen, A. (2003). Environmental attitudes in international comparison: An analysis of the ISSP surveys 1993 and 2000. Social Science Quarterly, 84(2), pp. 297–308. International Social Survey Program (1993). Codebook, ZA Study 2450, ISSP 1993, Environment 1. Cologne, Germany: Zentral archive fur Empirische Sozialforschung. McAllister Opinion Research (2006, April 3). The Sustainability Survey, Canadian Public 2006 and Canadian Thought Leaders 2006. Topline Report. Vancouver: McAllister Opinion Research. Michalos, A.C. (2000). Evaluation of equality policies for the status of women in Canada. Social Indicators Research, 49, pp. 241–277. (Reprinted in Michalos, 2003.)

17 Measuring Knowledge, Attitudes and Behaviours towards Sustainable Development: Two Exploratory Studies
Michalos, A.C. (2003). Essays on the Quality of Life. Dordrecht: Kluwer Academic Publishers. Michalos, A.C. (2004). Social indicators research and health-related quality of life research. Social Indicators Research, 65(1), pp. 27–72. (Reprinted in Michalos 2003.) Miller, J.D. and L.K. Pifer (1993). Public Attitudes Toward Science and Technology, 1979-1992, Integrated Codebook. Chicago: International Center for the Advancement of Scientific Literacy, Chicago Academy of Sciences. Monitoring and Evaluation Expert Group (2007). Draft Report of the Monitoring and Evaluation Expert Group (MEEG) Meeting, 29-30 January. Paris: UNESCO. Morrone, M., K. Mancl and K. Carr (2001). Development of a metric to test group differences in ecological knowledge as one component of environmental literacy. Journal of Environmental Education, 32(4), pp. 33–42. North America Association for Environmental Education. (1996). Environmental Education Materials: Guidelines for Excellence. Rock Spring, Georgia: NAAEE. Statistics Canada (2008). Households and the Environment 2006. Catalogue no.11-526-X. Ottawa: Minister of Industry. Sub-Saharan Africa (SSA) (2006). Towards the Implementation of the Decade of Education for Sustainable development (DESD) in Sub-Saharan Africa (SSA). Workshop Report, 27-30 November. Windhoek, Namibia: SSA. Thomson, G., J. Hoffman and S. Staniforth (n.d.). Measuring the Success of Environmental Education Programs. Ottawa: Canadian Parks and Wilderness Society and Sierra Club of Canada. TNS Canadian Facts (2007). Global Warming. Public Release. Ottawa: TNS Public Facts. UNESCO. (2007). The UN Decade of Education for Sustainable Development (DESD 2005–2014): The First Two Years. Paris: UNESCO. UNESCO Bangkok (2007). Asia-Pacific Guidelines for the Development of National ESD Indicators. Bangkok: UNESCO. UNESCO Education Sector (2005). Guidelines and Recommendations for Reorienting Teacher Education to Address Sustainability. Paris: UNESCO.

18 Measuring Knowledge, Attitudes and Behaviours towards Sustainable Development: Two Exploratory Studies
UNESCO Education Sector (2006). Framework for the UNDESD International Implementation Scheme. Paris: UNESCO. Retrieved December 2008 from: http://unesdoc.unesco.org/images/0014/001486/148650E.pdf UNESCO Education Sector (2006a). Education for Sustainable Development Toolkit. Paris: UNESCO. World Commission on Environment and Development (1987). Our Common Future. New York: Oxford University Press. Wright, T. (2005). Higher Education for Sustainability: Developing a Comprehensive Research, Summary Report, October 27–29, 2005. Halifax: Dalhousie University.
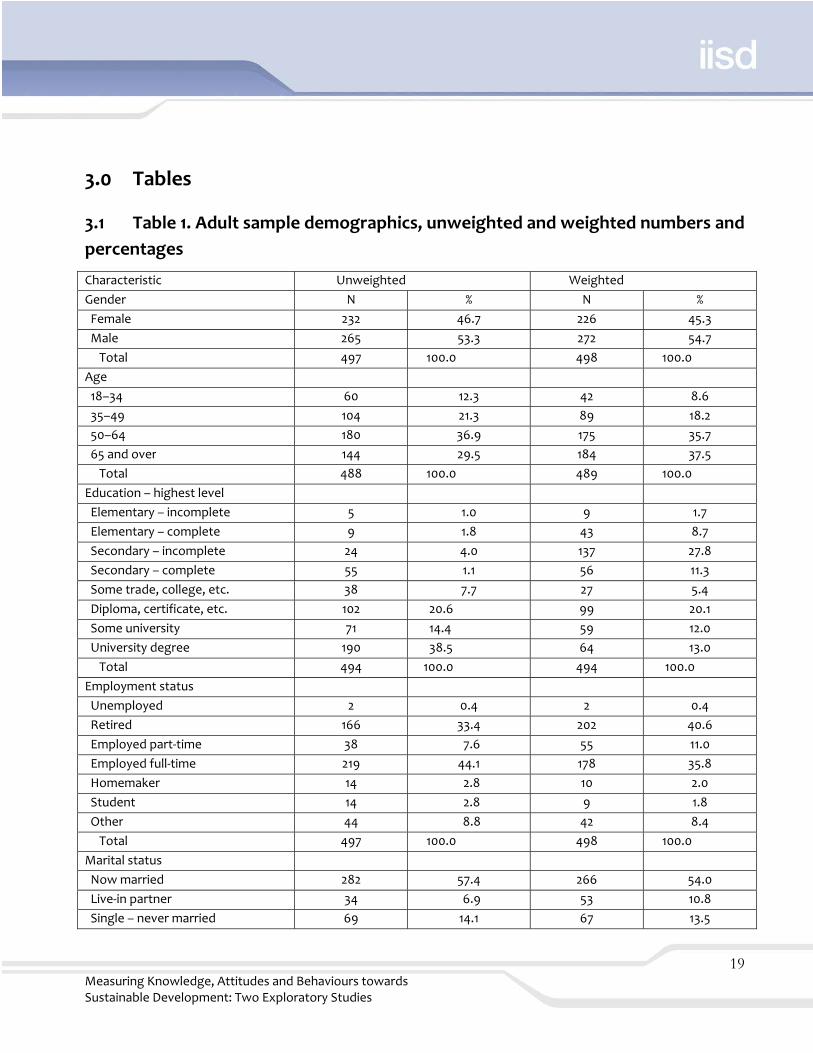
19 Measuring Knowledge, Attitudes and Behaviours towards Sustainable Development: Two Exploratory Studies
3.0 Tables
3.1 Table 1. Adult sample demographics, unweighted and weighted numbers and
percentages
Characteristic Unweighted Weighted
Gender N % N %
Female 232 46.7 226 45.3
Male 265 53.3 272 54.7
Total 497 100.0 498 100.0
Age
18–34 60 12.3 42 8.6
35–49 104 21.3 89 18.2
50–64 180 36.9 175 35.7
65 and over 144 29.5 184 37.5
Total 488 100.0 489 100.0
Education – highest level
Elementary – incomplete 5 1.0 9 1.7
Elementary – complete 9 1.8 43 8.7
Secondary – incomplete 24 4.0 137 27.8
Secondary – complete 55 1.1 56 11.3
Some trade, college, etc. 38 7.7 27 5.4
Diploma, certificate, etc. 102 20.6 99 20.1
Some university 71 14.4 59 12.0
University degree 190 38.5 64 13.0
Total 494 100.0 494 100.0
Employment status
Unemployed 2 0.4 2 0.4
Retired 166 33.4 202 40.6
Employed part‐time 38 7.6 55 11.0
Employed full‐time 219 44.1 178 35.8
Homemaker 14 2.8 10 2.0
Student 14 2.8 9 1.8
Other 44 8.8 42 8.4
Total 497 100.0 498 100.0
Marital status
Now married 282 57.4 266 54.0
Live‐in partner 34 6.9 53 10.8
Single – never married 69 14.1 67 13.5

20 Measuring Knowledge, Attitudes and Behaviours towards Sustainable Development: Two Exploratory Studies
Divorced 43 8.8 33 6.7
Separated 18 3.7 18 3.6
Widowed 44 9.1 55 11.4
Total 490 100.0 493 100.0

21 Measuring Knowledge, Attitudes and Behaviours towards Sustainable Development: Two Exploratory Studies
3.2 Table 2. Knowledge of sustainable development, unweighted and weighted numbers of adult
respondents and % of correct answers
Sentence Unweighted Weighted
N % N %
K1. Economic development, social development and environmental protection
are all necessary for sustainable development. T*
499 97.6 501 98.4
K2. Education for sustainable development emphasizes education for a culture
of peace. T
475 78.5 476 82.4
K3. Sustainable development is as much about the children in the future as it is
about what we need today. T
500 96.8 487 96.7
K4. Sustainable development has nothing to do with social justice. F 485 84.3 478 85.2
K5. Canada’s overall energy is improving. T 323 42.1 314 56.4
K6. Sustainable consumption includes using goods and services in ways that
minimize the use of natural resources and toxic chemicals, and reduces waste. T
497 91.5 486 90.4
K7. Education for sustainable development emphasizes gender equality. T 468 62.2 463 65.3
K8. Helping people out of poverty in Canada is an essential condition for Canada
to become more sustainable. T
490 85.3 486 87.1
K9. Education for sustainable development seeks to balance human and
economic well‐being with cultural traditions and respect for the earth’s natural
resources. T
494 94.7 490 94.8
K10. We cannot slow the rate of climate change. F 489 84.0 485 77.9
K11. Corporate social responsibility is irrelevant to sustainable development. F 493 90.9 479 86.3
K12. Conservation of fresh water is not a priority in Canada because we have
plenty. F
495 92.3 491 93.4
K13. Maintaining biodiversity—the number and variety of living organisms—is
essential to the effective functioning of ecosystems. T
478 96.0 456 94.5

22 Measuring Knowledge, Attitudes and Behaviours towards Sustainable Development: Two Exploratory Studies
K14. Education for sustainable development supports cultural diversity. T 462 81.6 457 83.5
K15. Use of nonrenewable resources like oil should not exceed the rate at which
sustainable renewable substitutes are used. T
473 87.3 464 86.0
K16. It is useful to estimate the monetary value of the services that the
ecosystem provides to us, such as neutralizing air pollutants or purifying water.
T
482 87.8 475 90.7
K17. Education for sustainable development emphasizes respect for human
rights. T
467 83.1 468 84.0
* T means correct response is true, F means correct response is false.

23 Measuring Knowledge, Attitudes and Behaviours towards Sustainable Development: Two Exploratory Studies
3.3 Table 3. Attitudes toward sustainable development, unweighted and weighted numbers of
adult respondents and percentage agreeing or strongly agreeing with statements favourable to
sustainable development.
Sentence Unweighted Weighted
N % N %
A1. Every girl or boy should receive education that teaches the knowledge,
perspectives, values, issues and skills for sustainable living in a community.
501 97.6 498 98.2
A2. The present generation should ensure that the next generation inherits a
community at least as healthy, diverse and productive as it is today.
501 97.4 498 98.0
A3. Manufacturers should discourage the use of disposables. 495 88.2 485 86.9
A4. Overuse of our natural resources is a serious threat to the health and
welfare of future generations.
500 95.6 497 95.0
A5. We need stricter laws and regulations to protect the environment. 499 89.6 496 89.8
A6. Poverty alleviation is an important topic in education for sustainable
development.
497 75.6 495 79.1
A7. Sustainable development will not be possible until wealthier nations stop
exploiting the labour and natural resources of poorer countries.
495 75.1 489 78.9
A8. Companies that are environmentally sustainable are more likely to be
profitable over the long run.
498 71.5 496 73.9
A9. The teaching of sustainability principles should be integrated into the
curriculum in all disciplines and at all levels of schooling.
498 91.0 496 92.5
A10. Governments should encourage greater use of fuel‐efficient vehicles. 499 94.4 497 93.4
A11. Adopting sustainable development as a national priority is key to
maintaining Canada’s status as one of the most liveable countries in the world.
499 90.4 497 89.6
A12. Citizenship education is an important component of education for
sustainable development.
499 78.4 501 84.2
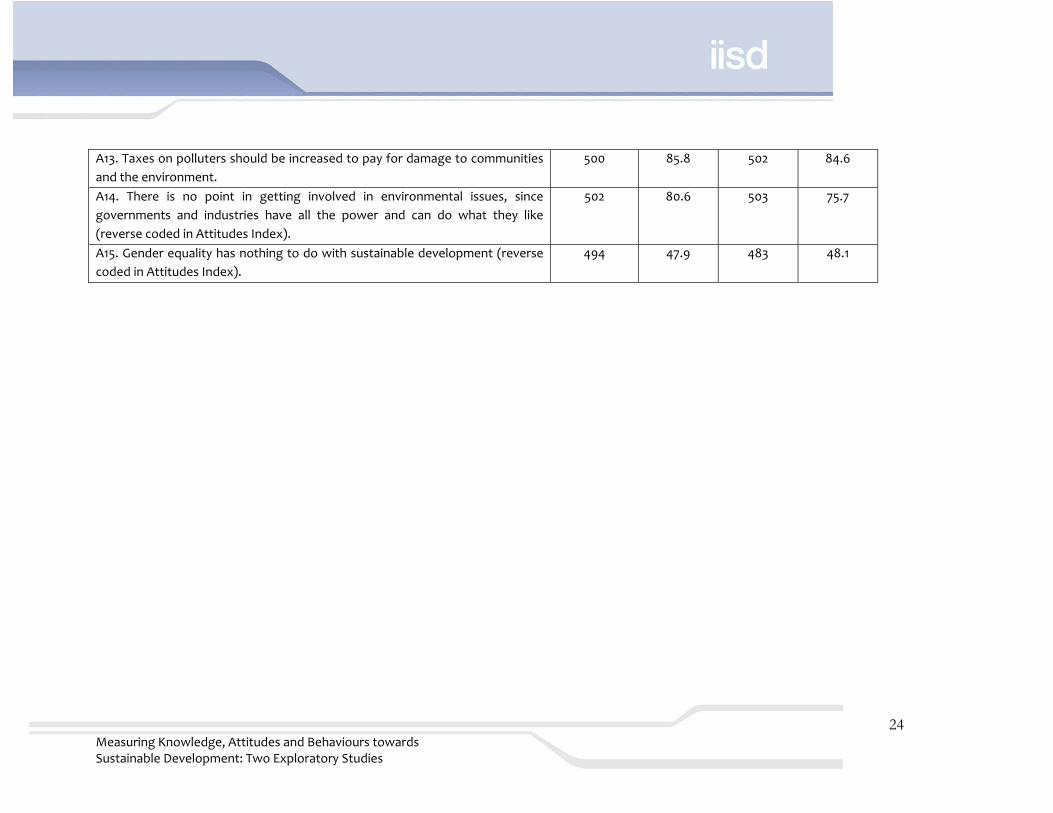
24 Measuring Knowledge, Attitudes and Behaviours towards Sustainable Development: Two Exploratory Studies
A13. Taxes on polluters should be increased to pay for damage to communities
and the environment.
500 85.8 502 84.6
A14. There is no point in getting involved in environmental issues, since
governments and industries have all the power and can do what they like
(reverse coded in Attitudes Index).
502 80.6 503 75.7
A15. Gender equality has nothing to do with sustainable development (reverse
coded in Attitudes Index).
494 47.9 483 48.1
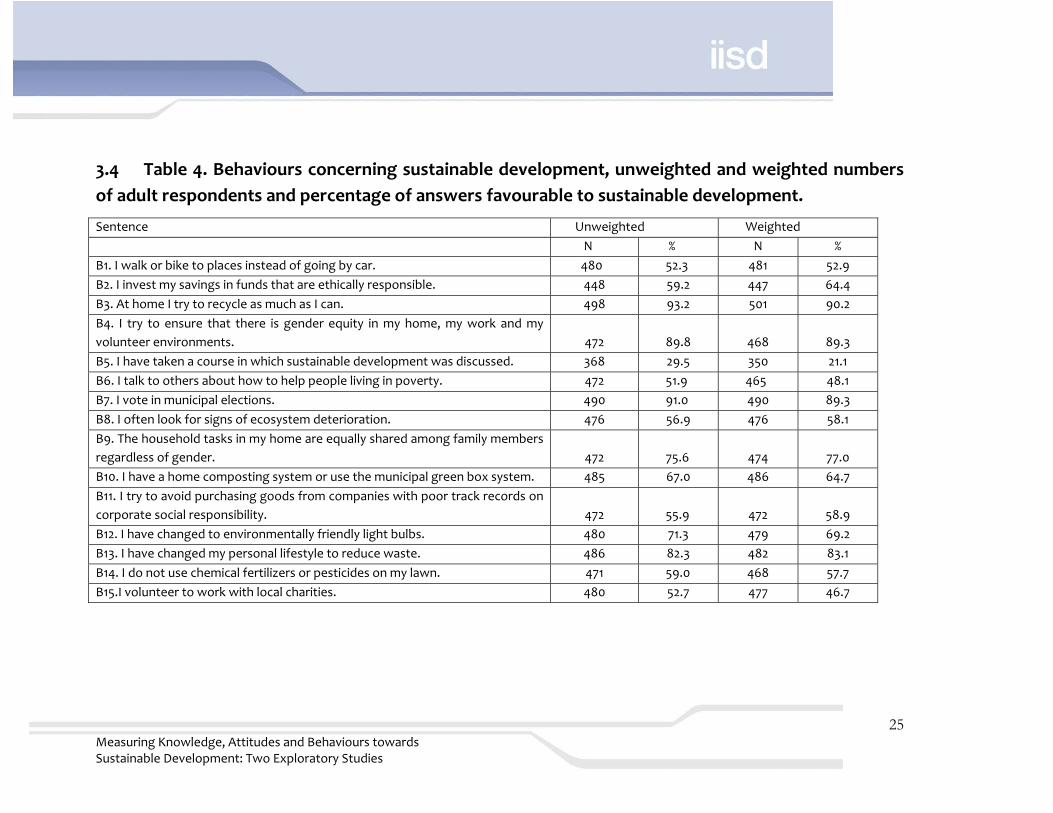
25 Measuring Knowledge, Attitudes and Behaviours towards Sustainable Development: Two Exploratory Studies
3.4 Table 4. Behaviours concerning sustainable development, unweighted and weighted numbers
of adult respondents and percentage of answers favourable to sustainable development.
Sentence Unweighted Weighted
N % N %
B1. I walk or bike to places instead of going by car. 480 52.3 481 52.9
B2. I invest my savings in funds that are ethically responsible. 448 59.2 447 64.4
B3. At home I try to recycle as much as I can. 498 93.2 501 90.2
B4. I try to ensure that there is gender equity in my home, my work and my
volunteer environments.
472
89.8
468
89.3
B5. I have taken a course in which sustainable development was discussed. 368 29.5 350 21.1
B6. I talk to others about how to help people living in poverty. 472 51.9 465 48.1
B7. I vote in municipal elections. 490 91.0 490 89.3
B8. I often look for signs of ecosystem deterioration. 476 56.9 476 58.1
B9. The household tasks in my home are equally shared among family members
regardless of gender.
472
75.6
474
77.0
B10. I have a home composting system or use the municipal green box system. 485 67.0 486 64.7
B11. I try to avoid purchasing goods from companies with poor track records on
corporate social responsibility.
472
55.9
472
58.9
B12. I have changed to environmentally friendly light bulbs. 480 71.3 479 69.2
B13. I have changed my personal lifestyle to reduce waste. 486 82.3 482 83.1
B14. I do not use chemical fertilizers or pesticides on my lawn. 471 59.0 468 57.7
B15.I volunteer to work with local charities. 480 52.7 477 46.7

26 Measuring Knowledge, Attitudes and Behaviours towards Sustainable Development: Two Exploratory Studies
3.5 Table 5. Indexes of Knowledge of, Favourable Attitudes and Behaviours toward Sustainable
Sevelopment, with numbers of adult respondents, Cronbach Alphas, scale means and item‐total
correlations.
sustainable development Knowledge Index sustainable development Favourable
Attitudes Index
sustainable development Favourable
Behaviours Index
unweighted weighted Unweighted weighted unweighted weighted
N 384 384 471 461 291 271
Alpha 0.74 0.72 0.89 0.89 0.65 0.64
Scale mean 13.0 13.1 63.5 63.9 9.8 9.2
Std. Dev. 2.3 2.2 8.1 7.8 2.7 2.6
Item
Number
Item‐Total
Correlation
Item‐Total
Correlation
Item
Number
Item‐Total
Correlation
Item‐Total
Correlation
Item
Number
Item‐Total
Correlation
Item‐Total
Correlation
K1 .30 .35 A1 .56 .54 B1 .20 .07
K2 .46 .36 A2 .55 .53 B2 .25 .20
K3 * * A3 .44 .49 B3 .26 .36
K4 .34 .26 A4 .56 .63 B4 .30 .33
K5 * * A5 .68 .68 B5 .19 .23
K6 .24 .25 A6 .66 .61 B6 .41 .35
K7 .38 .34 A7 .59 .59 B7 .17 .12
K8 .46 .43 A8 .50 .53 B8 .32 .31
K9 .31 .30 A9 .67 .69 B9 .15 .15
K10 .26 .27 A10 .63 .64 B10 .15 .16
K11 .25 .22 A11 .68 .66 B11 .34 .31
K12 .15 .11 A12 .59 .53 B12 .28 .28
K13 .25 .32 A13 .51 .49 B13 .43 .41
K14 .49 .46 A14 .37 .33 B14 .20 .28

27 Measuring Knowledge, Attitudes and Behaviours towards Sustainable Development: Two Exploratory Studies
K15 .34 .33 A15 .39 .26 B15 .29 .28
K16 .29 .29
K17 .57 .52
* Item omitted from scale

28 Measuring Knowledge, Attitudes and Behaviours towards Sustainable Development: Two Exploratory Studies
3.6 Table 6. Correlations among indexes for Knowledge of,
Favourable Attitudes and Behaviours toward Sustainable
Sevelopment, and four demographic variables, adult sample, P <.05,
N=386.
A. Unweighted variables
Index/Item knowledge attitudes behaviours gender age educ.
Knowledge 1.00
Attitudes 0.53 1.00
Behaviours 0.31 0.40 1.00
Gender ns 0.15 ns 1.00
Age ns ns ns 0.14 1.00
Education 0.12 0.09 0.12 ns ‐0.28 1.00
Income ns ns ns 0.11 ‐0.17 0.19
B. Weighted variables
Index/Item knowledge attitudes behaviours gender age educ.
Knowledge 1.00
Attitudes 0.54 1.00
Behaviours 0.22 0.32 1.00
Gender ns 0.14 ns 1.00
Age ‐0.24 ‐0.18 ns 0.11 1.00
Education 0.14 ns 0.10 ns ‐0.37 1.00
Income ns ns 0.11 ns ‐0.20 0.24

29 Measuring Knowledge, Attitudes and Behaviours towards Sustainable Development: Two Exploratory Studies
3.7 Table 7. Regressions of Favourable Behaviours Index on
Knowledge and Favourable Attitudes Indexes and four demographic
variables, adult sample.
A. Unweighted variables
N 382 502 382
% of variance expl 2 17 22
Predictors ↓ Betas Betas Betas
Gender * ** *
Age * ** *
Education .14 ** .12
Income * ** *
Knowledge index ** .13 *
Attitudes index ** .33 .45
* Significance level too low to enter equation
** Variable not in equation
B. Weighted variables
N 373 502 373
% of variance expl 1 10 23
Predictors ↓ Betas Betas Betas
Gender * ** *
Age * ** *
Education .12 ** .11
Income * ** *
Knowledge index ** * *
Attitudes index ** .32 .47
* Significance level too low to enter equation
** Variable not in equation
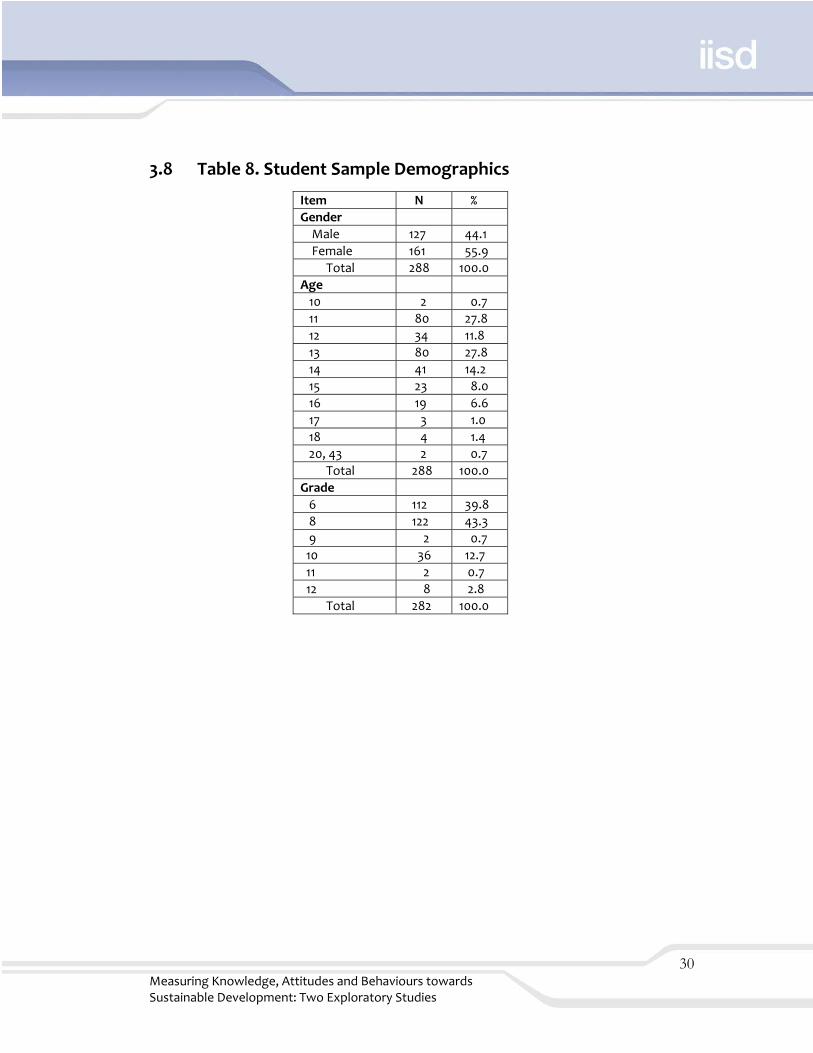
30 Measuring Knowledge, Attitudes and Behaviours towards Sustainable Development: Two Exploratory Studies
3.8 Table 8. Student Sample Demographics
Item N %
Gender
Male 127 44.1
Female 161 55.9
Total 288 100.0
Age
10 2 0.7
11 80 27.8
12 34 11.8
13 80 27.8
14 41 14.2
15 23 8.0
16 19 6.6
17 3 1.0
18 4 1.4
20, 43 2 0.7
Total 288 100.0
Grade
6 112 39.8
8 122 43.3
9 2 0.7
10 36 12.7
11 2 0.7
12 8 2.8
Total 282 100.0

31 Measuring Knowledge, Attitudes and Behaviours towards Sustainable Development: Two Exploratory Studies
3.9 Table 9. Knowledge of sustainable development, numbers of student respondents and
percentage of correct answers
Sentence All Grades Grade 6 Grade 8 Grades 9‐‐12
N % N % N % N %
K1 Canada’s overall use of energy is improving. T* 285 59.3 101 63.3 133 53.4 50 68.0
K2 We cannot slow the rate of climate change. F 282 48.6 101 35.6 131 52.7 50 64.0
K3 Conservation of fresh water is not important in Canada because we have
plenty. F
284
77.8
102
75.5
133
81.2
49
73.5
K4 Education for sustainable development promotes respect for human
rights. T
284 69.0 101 61.4 133 72.9 50 74.0
K5 Education for sustainable development includes education for a culture of
peace. T
279
70.6
99
69.7
130
73.1
50
66.0
K6 Sustainable development is as much about what the children in the future
need as it is about what we need today. T
282
63.5
101
56.4
131
62.6
50
80.0
K7 ‘Sustainable consumption’ is about using goods and services in ways that
minimize the use of natural resources and reduce waste. T
280
53.9
98
39.8
132
55.3
50
78.0
K8 Education for sustainable development promotes gender equality. T 281 53.0 98 44.9 133 59.4 50 52.0
K9 Helping people out of poverty in Canada is important for Canada to
become more sustainable. T
276
76.4
97
70.1
130
81.5
49
75.5
K10 Education for sustainable development tries to balance human and
economic success with cultural traditions and respect for the earth’s natural
resources. T
283
64.3
101
54.5
132
68.2
50
74.0
K11 Sustainable development does not require that businesses to behave
responsibly. F
281
43.1
100
30.0
132
48.5
49
55.1
K12 Education for sustainable development supports cultural diversity. T 278 46.4 97 35.1 131 52.7 50 52.0
K13 Maintaining biodiversity (the number and variety of living organisms) is

32 Measuring Knowledge, Attitudes and Behaviours towards Sustainable Development: Two Exploratory Studies
essential to the health of ecosystems. T 280 60.0 99 38.4 132 67.4 49 83.7
K14 Non‐renewable resources should not be used faster than the rate at
which we find substitutes that are renewable. T
283
51.2
101
41.6
132
54.5
50
62.0
K15 It is useful to estimate the dollar value of the services that the ecosystem
provides to us (such as how wetlands can clean our water). T
280 56.8 98 49.0 132 56.8 50 72.0
K16 Sustainable development has nothing to do with social justice. F 281 0.0 99 0.0 132 0.0 50 0.0
K17 Economic development, social development and environmental
protection are all needed for sustainable development. T
280 58.2 99 39.4 131 64.1 50 80.0
* T means correct response is true, F means correct response is false.
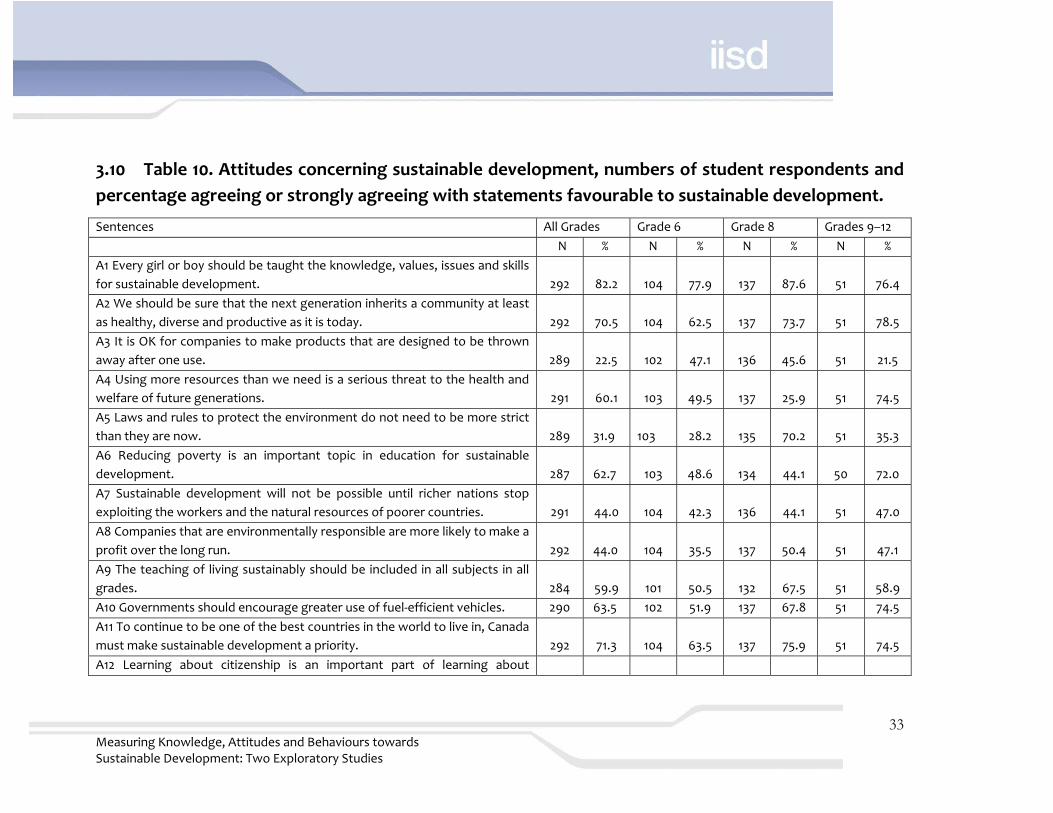
33 Measuring Knowledge, Attitudes and Behaviours towards Sustainable Development: Two Exploratory Studies
3.10 Table 10. Attitudes concerning sustainable development, numbers of student respondents and
percentage agreeing or strongly agreeing with statements favourable to sustainable development.
Sentences All Grades Grade 6 Grade 8 Grades 9–12
N % N % N % N %
A1 Every girl or boy should be taught the knowledge, values, issues and skills
for sustainable development.
292
82.2
104
77.9
137
87.6
51
76.4
A2 We should be sure that the next generation inherits a community at least
as healthy, diverse and productive as it is today.
292
70.5
104
62.5
137
73.7
51
78.5
A3 It is OK for companies to make products that are designed to be thrown
away after one use.
289
22.5
102
47.1
136
45.6
51
21.5
A4 Using more resources than we need is a serious threat to the health and
welfare of future generations.
291
60.1
103
49.5
137
25.9
51
74.5
A5 Laws and rules to protect the environment do not need to be more strict
than they are now.
289
31.9
103
28.2
135
70.2
51
35.3
A6 Reducing poverty is an important topic in education for sustainable
development.
287
62.7
103
48.6
134
44.1
50
72.0
A7 Sustainable development will not be possible until richer nations stop
exploiting the workers and the natural resources of poorer countries.
291
44.0
104
42.3
136
44.1
51
47.0
A8 Companies that are environmentally responsible are more likely to make a
profit over the long run.
292
44.0
104
35.5
137
50.4
51
47.1
A9 The teaching of living sustainably should be included in all subjects in all
grades.
284
59.9
101
50.5
132
67.5
51
58.9
A10 Governments should encourage greater use of fuel‐efficient vehicles. 290 63.5 102 51.9 137 67.8 51 74.5
A11 To continue to be one of the best countries in the world to live in, Canada
must make sustainable development a priority.
292
71.3
104
63.5
137
75.9
51
74.5
A12 Learning about citizenship is an important part of learning about

34 Measuring Knowledge, Attitudes and Behaviours towards Sustainable Development: Two Exploratory Studies
sustainable development. 288 60.3 103 54.4 134 63.4 51 64.7
A13 Taxes on polluters should be increased to pay for damage to
communities and the environment.
292
52.7
104
53.9
137
49.6
51
58.9
A14 There is no point in getting involved in environmental issues, since
governments and industries have all the power and can do whatever they
like.
292
17.4
104
49.0
137
16.1
51
25.4
A15 Gender equality has nothing to do with sustainable development. 291 33.6 104 17.3 137 14.6 50 22.0
3.11 Table 11. Behaviours concerning sustainable development, numbers of student respondents and
percentage of answers favourable to sustainable development.
Sentence All Grades Grade 6 Grade 8 Grades 9–12
N % N % N % N %
B1 I walk or bike to places instead of going by car. 293 47.1 104 42.3 138 44.2 51 64.7
B2 I bring my lunch to school in reusable containers in order to reduce waste. 293 52.2 104 59.6 138 50.7 51 41.2
B3 At home I try to recycle as much as I can. 291 52.7 104 57.7 136 56.6 51 35.2
B4 I try to make sure that both boys and girls are treated fairly in my home
and at school.
289 80.6 103 78.6 135 83.0 51 86.3
B5 I have taken a course in which we talked about sustainable development. 289 13.7 104 10.6 138 14.5 50 18.0
B6 I talk to other people about how to help people living in poverty. 292 29.8 104 22.1 138 36.2 50 28.0
B7 I pick up litter when I see it in a park or a natural area. 288 40.3 101 36.6 136 37.5 51 54.9
B8 I often look for signs of damage to our environment. 288 41.0 102 40.2 136 40.4 50 44.0
B9 The household chores in my home are equally shared among family
members regardless of gender.
293 68.6 104 73.1 138 69.6 51 56.9
B10 I have a home composting system or use the municipal blue box system. 293 37.9 104 32.7 138 44.2 51 31.4
B11 I try to avoid purchasing goods from companies with a poor track record
on caring about their workers or the environment.
294 20.5 102 23.5 135 19.3 51 17.6
B12 I have studied some issues related to climate change. 292 70.2 103 56.3 138 75.4 51 84.3

35 Measuring Knowledge, Attitudes and Behaviours towards Sustainable Development: Two Exploratory Studies
B13 I have changed my personal lifestyle to reduce waste. 292 40.3 102 42.2 137 40.1 51 37.3
B14 I do some things mostly because they are things a good citizen should
do.
292 74.0 104 74.0 137 72.3 51 78.4
B15 I volunteer to work with local charities. 291 20.6 103 21.4 138 17.4 50 28.0

36 Measuring Knowledge, Attitudes and Behaviours towards Sustainable Development: Two Exploratory Studies
3.12 Table 12. Indexes of Knowledge of, Favourable Attitudes and
Behaviours toward Sustainable Development, with numbers of
student respondents, Cronbach Alphas, scale means and item‐total
correlations.
Knowledge Index Attitudes Index Behaviours Index
N 247 N 271 N 269
Alpha 0.79 Alpha 0.77 Alpha 0.63
Scale Mean 9.6 Scale Mean 38.0 Scale Mean 6.6
Std. Dev. 3.8 Std. Dev. 89.4 Std. Dev. 2.6
Item
Number
Item‐Total
Correlation
Item
Number
Item‐Total
Correlation
Item
Number
Item‐Total
Correlation
K1 .16 A1 .40 B1 *
K2 .33 A2 .48 B2 .12
K3 .20 A3 * B3 .29
K4 .47 A4 .47 B4 .23
K5 .37 A5 * B5 .22
K6 .39 A6 .44 B6 .33
K7 .41 A7 .46 B7 .25
K8 .37 A8 .46 B8 .37
K9 .35 A9 .33 B9 .15
K10 .49 A10 .35 B10 .20
K11 .36 A11 .45 B11 .21
K12 .42 A12 .36 B12 .22
K13 .48 A13 .33 B13 .44
K14 .39 A14 * B14 .28
K15 .45 A15 * B15 .33
K16 *
K17 .52
* Item omitted from scale

Measuring Knowledge, Attitudes and Behaviours towards Sustainable Development: Two Exploratory Studies
37
3.13 Table 13. Correlations among indexes for Knowledge of, Favourable
Attitudes and Behaviours toward Sustainable Development, and three
demographic variables, for student sample, P <.05, N=294.
Index/Item knowledge attitudes behaviours gender age
Knowledge 1.00
Attitudes 0.57 1.00
Behaviours 0.32 0.35 1.00
Gender ns ns 0.26 1.00
Age 0.33 0.22 ns ns 1.00
Grade 0.31 0.23 ns ns 0.86
3.14 Table 14. Regressions of Favourable Behaviours Index on Knowledge
and Favourable Attitudes Indexes and three demographic variables.
N 285 285 280
% of variance expl 6 14 19
Predictors ↓ Betas Betas Betas
Gender .26 ** .24
Age * ** **
Grade * ** **
Knowledge index ** .18 .20
Attitudes index ** .24 .21
* Significance level too low to enter equation
** Variable not in equation